automation of cell surface protein isolation using the ... · 2 introduction cell surface membrane...
TRANSCRIPT

Automation of Cell Surface Protein Isolation Using the Agilent AssayMAP Bravo Platform, and Profi ling Using the Agilent 6550 iFunnel Q-TOF LC/MS Systems
Application Note
AuthorsRavi K Krovvidi, Lynette Lincoln, and Arunkumar PadmanabanAgilent Technologies, Inc.
AbstractThis study investigated the feasibility of automating an established cell surface protein isolation protocol using the Agilent AssayMAP Bravo automation platform. Epidermoid cancer cell lines-A431 was used as an in-vitro model system, and cell surface proteins were isolated using a combination of AssayMAP Bravo automation and a Pierce Cell Surface Protein Isolation kit. The isolated proteins were then analyzed using the Agilent 2200 TapeStation system in conjunction with the Agilent P200 ScreenTape assay for differential electrophoresis profi le. The eluted proteins were then analyzed using the Agilent HPLC-chip coupled to an Agilent 6550 iFunnel Q-TOF with dual stage ion funnel technology. Key cell surface proteins were identifi ed including extracellular matrix proteins, moderately abundant proteins including pancreatic marker protein, plectin-1 along with F-box leucine rich repeat protein-2, beta-actin, and PGK-2. This study demonstrates that the AssayMAP Bravo platform can be conveniently used for automated high-throughput sample preparation workfl ows involving affi nity purifi cations.
Prepare cartridge
Bind target
Wash cartridge
Elute target
Read results
2
IntroductionCell surface membrane proteins play a predominant role in cellular signaling processes. Membrane-specifi c receptor proteins serve as cellular markers and prime drug targets for several pharmaceutical agents. Receptor proteins have been targeted to decipher the molecular mechanisms for several cancers, for example breast, epidermoid, and lung cancers1. Enrichment of cell surface proteins by conventional biochemical approaches is a challenging task for various reasons including poor solubility of membrane proteins, sample loss during multiple sample processing steps, and so forth. The primary chemical enrichment strategy involves biotinylating cell surface proteins, and then specifi cally capturing those proteins using streptavidin. Automation of this workfl ow provides high-throughput processing, as well as higher precision, ease-of-use, and reproducibility.
The Agilent AssayMAP Bravo is a quantitative, high-throughput sample preparation technology that uses miniaturized, packed-bed cartridges and precise liquid handling. The system comprises a high precision liquid handler with 96 probe syringes that allows precise positive displacement fl ow control through disposable 5-μL packed-bed cartridges. The AssayMAP Bravo platform includes fl exible, customizable protocols with simple user interfaces to enable automated, high-throughput affi nity-based enrichment, protein digestion, and peptide cleanup in a microtiter plate format2. In this work, the sample preparation using the Pierce Cell Surface Protein Isolation kit was automated using the AssayMAP platform in conjunction with AssayMAP streptavidin cartridges (SA-W). Agilent 2200 TapeStation system with the Agilent P200 ScreenTape assay was used to see differential protein elution after binding and elution. The isolated proteome was then analyzed using the Agilent HPLC-Chip/6550 Q-TOF system for cell surface protein identifi cation.
Materials and MethodsReagents and kits Epidermoid carcinoma cell line-A431 was purchased from the National Centre for Cell Science, Pune, India and subcultured as recommended3. DMEM media, fetal bovine serum (FBS), and penicillin-streptomycin solution were all purchased from Sigma-Aldrich. The Pierce Cell Surface Protein Isolation kit and Trypsin/Lys-C mix was procured from Thermo Scientifi c and Promega, respectively. The DC Protein assay kit was purchased from Bio-Rad.
3
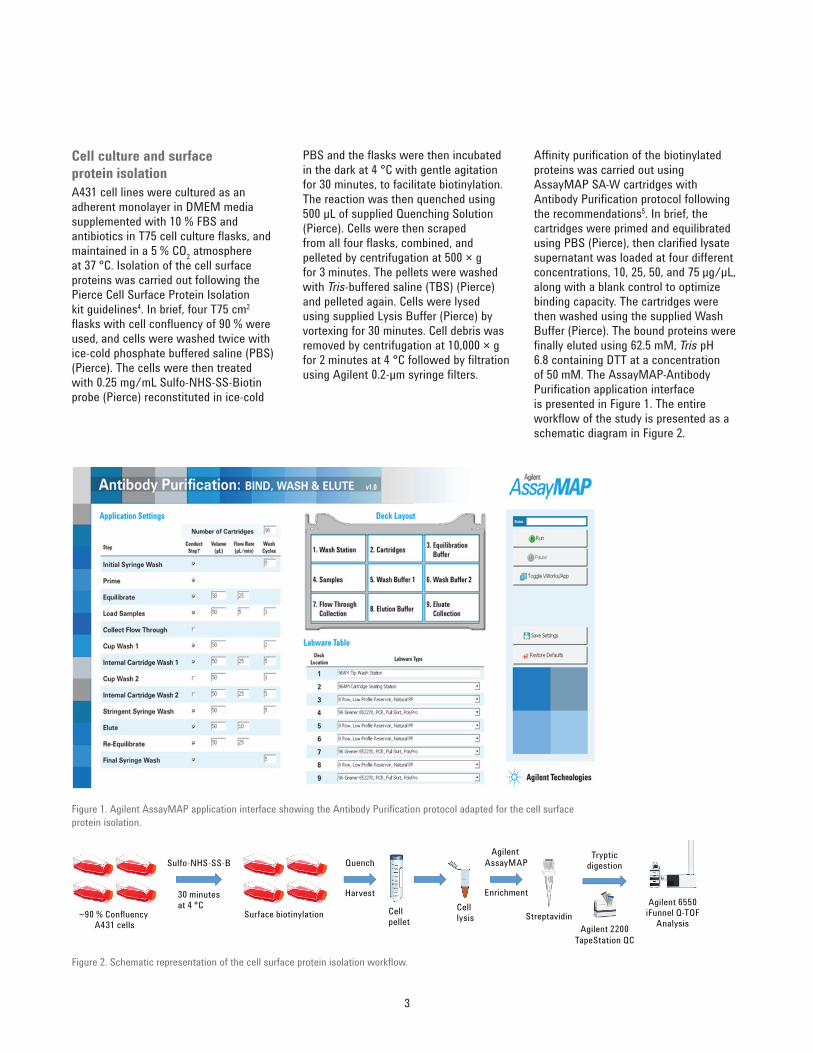
Fi gure 1. Agilent AssayMAP application interface showing the Antibody Purifi cation protocol adapted for the cell surface protein isolation.
Surface biotinylation
30 minutesat 4 °C
~90 % Confluency A431 cells
Cell pellet
Cell lysis
Agilent 6550 iFunnel Q-TOF
Analysis
Sulfo-NHS-SS-B
Streptavidin
Agilent AssayMAP
Enrichment
Trypticdigestion
Agilent 2200TapeStation QC
Quench
Harvest
Fig ure 2. Schematic representation of the cell surface protein isolation workfl ow.
Cell culture and surface protein isolationA431 cell lines were cultured as an adherent monolayer in DMEM media supplemented with 10 % FBS and antibiotics in T75 cell culture fl asks, and maintained in a 5 % CO2 atmosphere at 37 °C. Isolation of the cell surface proteins was carried out following the Pierce Cell Surface Protein Isolation kit guidelines4. In brief, four T75 cm2 fl asks with cell confl uency of 90 % were used, and cells were washed twice with ice-cold phosphate buffered saline (PBS) (Pierce). The cells were then treated with 0.25 mg/mL Sulfo-NHS-SS-Biotin probe (Pierce) reconstituted in ice-cold
PBS and the fl asks were then incubated in the dark at 4 °C with gentle agitation for 30 minutes, to facilitate biotinylation. The reaction was then quenched using 500 µL of supplied Quenching Solution (Pierce). Cells were then scraped from all four fl asks, combined, and pelleted by centrifugation at 500 × g for 3 minutes. The pellets were washed with Tris-buffered saline (TBS) (Pierce) and pelleted again. Cells were lysed using supplied Lysis Buffer (Pierce) by vortexing for 30 minutes. Cell debris was removed by centrifugation at 10,000 × g for 2 minutes at 4 °C followed by fi ltration using Agilent 0.2-µm syringe fi lters.
Affi nity purifi cation of the biotinylated proteins was carried out using AssayMAP SA-W cartridges with Antibody Purifi cation protocol following the recommendations5. In brief, the cartridges were primed and equilibrated using PBS (Pierce), then clarifi ed lysate supernatant was loaded at four different concentrations, 10, 25, 50, and 75 µg/µL, along with a blank control to optimize binding capacity. The cartridges were then washed using the supplied Wash Buffer (Pierce). The bound proteins were fi nally eluted using 62.5 mM, Tris pH 6.8 containing DTT at a concentration of 50 mM. The AssayMAP-Antibody Purifi cation application interface is presented in Figure 1. The entire workfl ow of the study is presented as a schematic diagram in Figure 2.
4
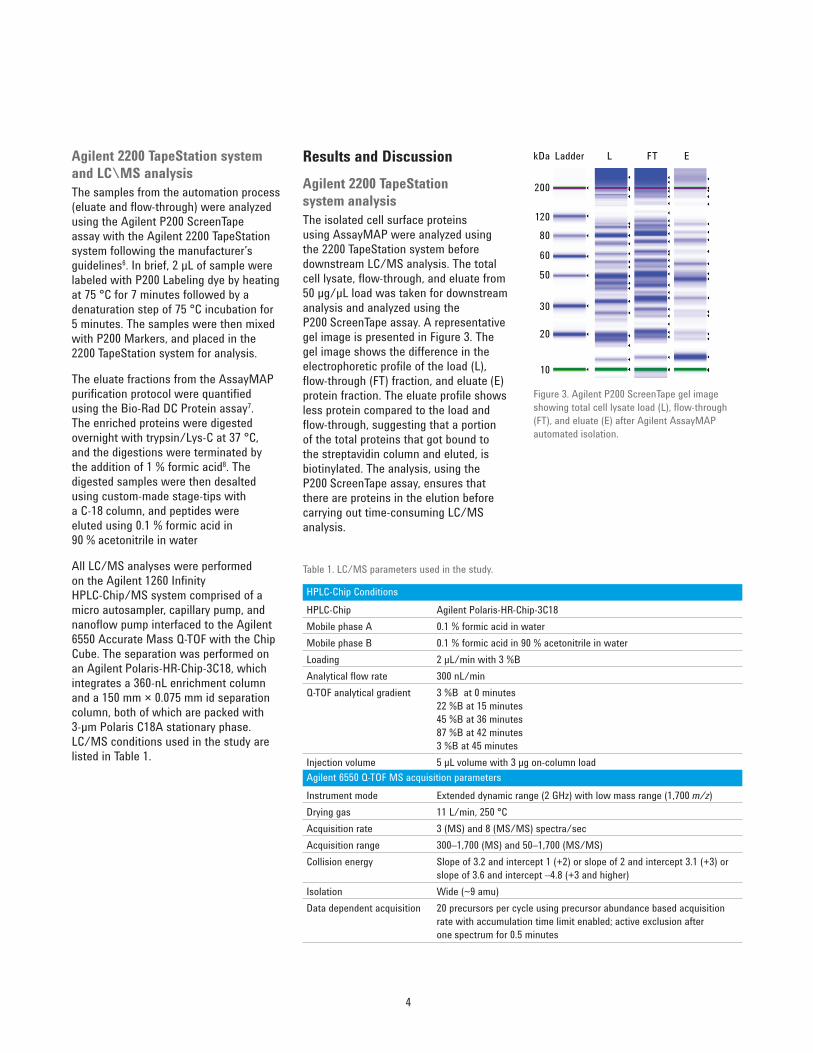
Results and DiscussionAgilent 2200 TapeStation system analysisThe isolated cell surface proteins using AssayMAP were analyzed using the 2200 TapeStation system before downstream LC/MS analysis. The total cell lysate, fl ow-through, and eluate from 50 µg/µL load was taken for downstream analysis and analyzed using the P200 ScreenTape assay. A representative gel image is presented in Figure 3. The gel image shows the difference in the electrophoretic profi le of the load (L), fl ow-through (FT) fraction, and eluate (E) protein fraction. The eluate profi le shows less protein compared to the load and fl ow-through, suggesting that a portion of the total proteins that got bound to the streptavidin column and eluted, is biotinylated. The analysis, using the P200 ScreenTape assay, ensures that there are proteins in the elution before carrying out time-consuming LC/MS analysis.
Agilent 2200 TapeStation system and LC\MS analysisThe samples from the automation process (eluate and fl ow-through) were analyzed using the Agilent P200 ScreenTape assay with the Agilent 2200 TapeStation system following the manufacturer’s guidelines6. In brief, 2 µL of sample were labeled with P200 Labeling dye by heating at 75 °C for 7 minutes followed by a denaturation step of 75 °C incubation for 5 minutes. The samples were then mixed with P200 Markers, and placed in the 2200 TapeStation system for analysis.
The eluate fractions from the AssayMAP purifi cation protocol were quantifi ed using the Bio-Rad DC Protein assay7. The enriched proteins were digested overnight with trypsin/Lys-C at 37 °C, and the digestions were terminated by the addition of 1 % formic acid8. The digested samples were then desalted using custom-made stage-tips with a C-18 column, and peptides were eluted using 0.1 % formic acid in 90 % acetonitrile in water
All LC/MS analyses were performed on the Agilent 1260 Infi nity HPLC-Chip/MS system comprised of a micro autosampler, capillary pump, and nanofl ow pump interfaced to the Agilent 6550 Accurate Mass Q-TOF with the Chip Cube. The separation was performed on an Agilent Polaris-HR-Chip-3C18, which integrates a 360-nL enrichment column and a 150 mm × 0.075 mm id separation column, both of which are packed with 3-µm Polaris C18A stationary phase. LC/MS conditions used in the study are listed in Table 1.
Tab le 1. LC/MS parameters used in the study.
HPLC-Chip ConditionsHPLC-Chip Agilent Polaris-HR-Chip-3C18 Mobile phase A 0.1 % formic acid in waterMobile phase B 0.1 % formic acid in 90 % acetonitrile in waterLoading 2 μL/min with 3 %BAnalytical fl ow rate 300 nL/minQ-TOF analytical gradient 3 %B at 0 minutes
22 %B at 15 minutes45 %B at 36 minutes87 %B at 42 minutes3 %B at 45 minutes
Injection volume 5 µL volume with 3 µg on-column loadAgilent 6550 Q-TOF MS acquisition parametersInstrument mode Extended dynamic range (2 GHz) with low mass range (1,700 m/z)Drying gas 11 L/min, 250 °CAcquisition rate 3 (MS) and 8 (MS/MS) spectra/secAcquisition range 300–1,700 (MS) and 50–1,700 (MS/MS)Collision energy Slope of 3.2 and intercept 1 (+2) or slope of 2 and intercept 3.1 (+3) or
slope of 3.6 and intercept –4.8 (+3 and higher)Isolation Wide (~9 amu)Data dependent acquisition 20 precursors per cycle using precursor abundance based acquisition
rate with accumulation time limit enabled; active exclusion after one spectrum for 0.5 minutes
L FTkDaT
ET
Ladder
200
12080
60
50
30
20
10
Figure 3. Agilent P200 ScreenTape gel image showing total cell lysate load (L), fl ow-through (FT), and eluate (E) after Agilent AssayMAP automated isolation.
5
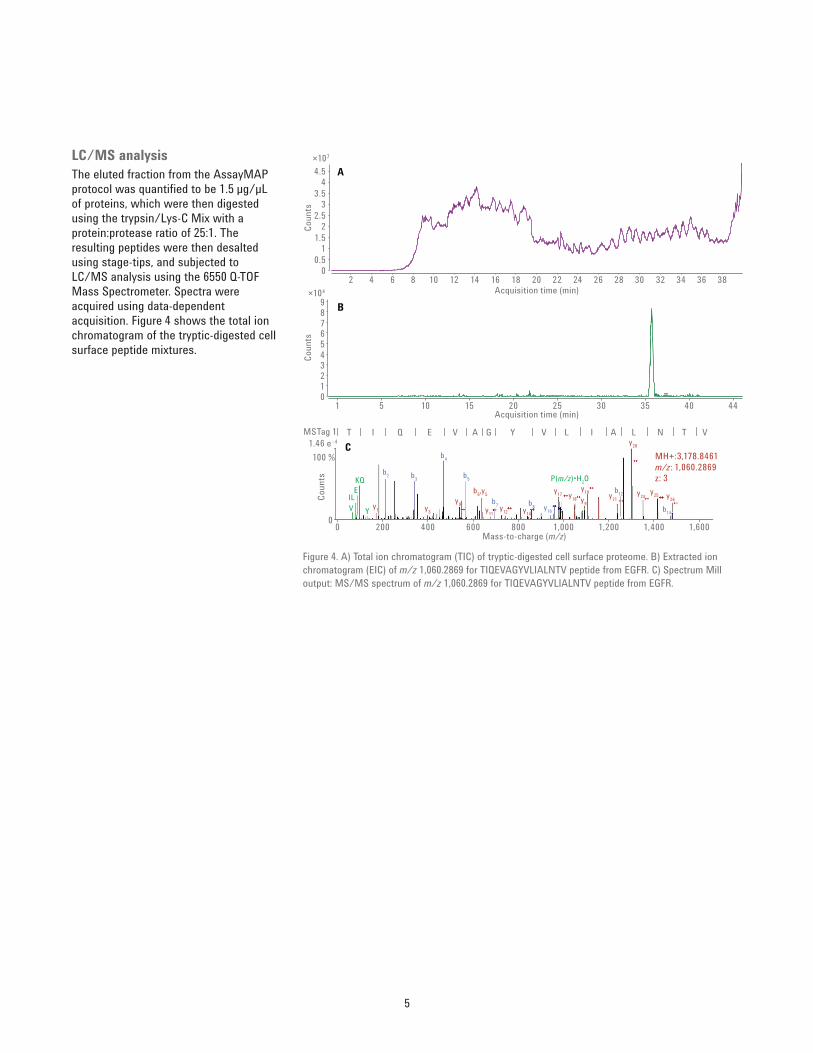
LC/MS analysisThe eluted fraction from the AssayMAP protocol was quantifi ed to be 1.5 µg/µL of proteins, which were then digested using the trypsin/Lys-C Mix with a protein:protease ratio of 25:1. The resulting peptides were then desalted using stage-tips, and subjected to LC/MS analysis using the 6550 Q-TOF Mass Spectrometer. Spectra were acquired using data-dependent acquisition. Figure 4 shows the total ion chromatogram of the tryptic-digested cell surface peptide mixtures.
Fi gure 4. A) Total ion chromatogram (TIC) of tryptic-digested cell surface proteome. B) Extracted ion chromatogram (EIC) of m/z 1,060.2869 for TIQEVAGYVLIALNTV peptide from EGFR. C) Spectrum Mill output: MS/MS spectrum of m/z 1,060.2869 for TIQEVAGYVLIALNTV peptide from EGFR.
0
0
100 %1.46 e–4
123456789
1
0
TMSTag 1 I Q E
V
E
Y y1 y3
y9
b6,y5
y11y12 y14
y17 y18
P(m/z)•H2O
y9
y19 y21
y28
y24y25 y26
b2 b3
b4
b5
b7 b8
b12
b14y16
IL
KQ
V A G Y V L I A L N T V
200 400 600 800 1,000 1,200 1,400
MH+:3,178.8461m/z: 1,060.2869z: 3
1,600
5 10 15 20 25 30 35 40 44
×107
×104
00.5
11.5
22.5
33.5
44.5
Acquisition time (min)
Acquisition time (min)
Mass-to-charge (m/z)
Coun
tsCo
unts
Coun
ts
2 4 6 8 10 12 14 16 18 20 22 24 26 28 30 32 34 36 38
A
B
C
6
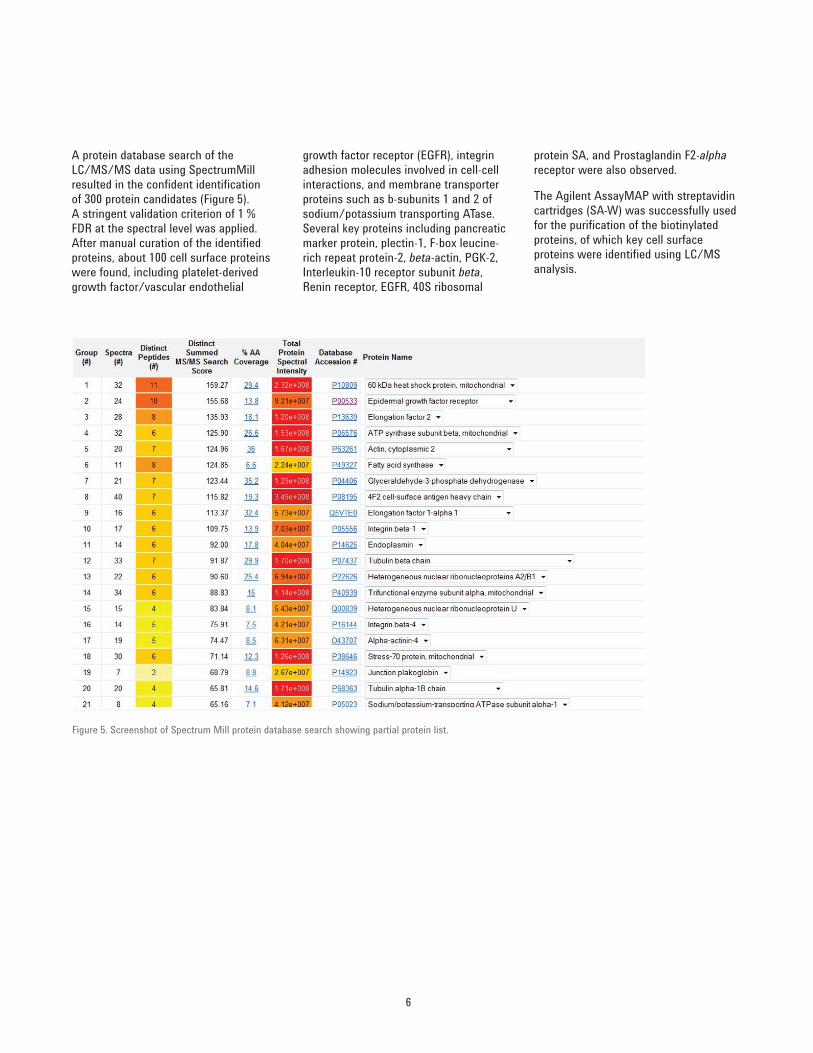
protein SA, and Prostaglandin F2-alpha receptor were also observed.
The Agilent AssayMAP with streptavidin cartridges (SA-W) was successfully used for the purifi cation of the biotinylated proteins, of which key cell surface proteins were identifi ed using LC/MS analysis.
growth factor receptor (EGFR), integrin adhesion molecules involved in cell-cell interactions, and membrane transporter proteins such as b-subunits 1 and 2 of sodium/potassium transporting ATase. Several key proteins including pancreatic marker protein, plectin-1, F-box leucine-rich repeat protein-2, beta-actin, PGK-2, Interleukin-10 receptor subunit beta, Renin receptor, EGFR, 40S ribosomal
A protein database search of the LC/MS/MS data using SpectrumMill resulted in the confi dent identifi cation of 300 protein candidates (Figure 5). A stringent validation criterion of 1 % FDR at the spectral level was applied. After manual curation of the identifi ed proteins, about 100 cell surface proteins were found, including platelet-derived growth factor/vascular endothelial
Fig ure 5. Screenshot of Spectrum Mill protein database search showing partial protein list.
7
4. Pierce Cell Surface Protein Isolation Kit manual, accessed online, Pierce Manual number: MAN0011518, revision 1151.7
5. AssayMAP Antibody Purifi cation protocol. Agilent Technologies Manual, part number G5496-90003, revision 00, 10/2012.
6. Agilent P200 ScreenTape System Quick Guide. Agilent Technologies Manual, part number G2964-90011, revision 08/2012.
7. DC Protein Assay Manual, Bio-Rad Manual, part number LIT448, revision D, 2014.
8. Trypsin/Lys-C Mix Mass Spec Grade Technical Manual, Promega Manual, part number TM390, revision 2/2014.
References1. Barton, S.; Starling, N.; Swanton, C.
Predictive molecular markers of response to epidermal growth factor receptor (EGFR) family-targeted therapies. Curr. Cancer Drug Targets 2010, 10, p 8.
2. Romm, M.; Heuvel, Z.; Miller, V. Automated High-Throughput Analysis of Proteins and Peptides in Blood-Based Matrices Using Immunoaffi nity Purifi cation and Ultrfast SPE/MS/MS. Agilent Technologies Application Note, publication number 5991-0936EN, October, 2012.
3. Thuncharoen, W.; Chulasiri, M.; et al. Apoptotic induction of skin cancer cell death by plant extracts. J. Med. Assoc. Thai. 2013.
ConclusionsTh is Application Note demonstrates the successful automation of an established cell surface isolation protocol to capture cell surface proteins using epidermoid cancer cell lines. The automation was achieved using the user-friendly interface of the Agilent AssayMAP application software interface. LC/MS/MS analysis of the isolated proteins also confi rmed that the cell surface proteins were captured using the described approach.
Our results demonstrate the ability of the Agilent AssayMAP Bravo automation platform and the HPLC-Chip/MS system to capture and analyze the cell surface proteome.

www.agilent.com/chem
This information is subject to change without notice.
© Agilent Technologies, Inc., 2015Published in the USA, October 1, 20155991-6049EN