automation in mars landing-site mapping and rover localization · automation in mars landing-site...
TRANSCRIPT

AUTOMATION IN MARS LANDING-SITE MAPPING AND ROVER LOCALIZATION
Fengliang Xu
Dept. of Civil & Environmental Engineering & Geodetic Science, The Ohio State University
470 Hitchcock Hall, 2070 Neil Ave., Columbus, OH 43210 - [email protected]
Commission VI, WG VI/4
KEY WORDS: Extraterrestrial, Planetary, Exploration, Close Range Photogrammetry, Mapping, Block Adjustment, Automation,
DEM/DTM, Triangulation, Rectification ABSTRACT: Our project aims to automate Mars mapping and localization using robotic stereo and descent imagery. Stereo vision is a well-studied domain. However, most efforts aim only at a general scene; little work has been done toward a natural, extraterrestrial environment through consideration of its special geometry and features. Our methodology utilized the properties of piece-wise continuity of natural scene and monotonously decreasing parallax between horizontal-looking stereo cameras. In outline, our automation process for processing robotic stereo imagery is: 1) interest points are extracted as features and matched between intra- and inter-stereo images, 2) tie points selection, 3) images with various illumination are balanced through use of tie points, 4) DEMs interpolation from 3-D interest points using Kriging and TIN, 5) orthophotos generation with DEM, and 6) landmarks (i.e. rocks) are extracted and occlusions are marked. Then, with the help of orthophotos, landmarks from different locations can be identified. Finally, robot localization is accomplished through use of rigid transformation and bundle adjustment of matched landmarks. For descent imagery, lower-level images are resampled and registered to higher-level images. Elevation is then estimated from multiple observations. This methodology has been used in the NASA 2003 Mars Exploration Rover Mission (MER) for precise robot navigation and mapping in support of the MER 2003 science and engineering team objectives.
1. INTRODUCTION
1.1 Background
The current hotspot of extraterrestrial exploration is Mars. Compared with other planets of this solar system, Mars is the one most similar to Earth, so it becomes the first stop in searching for extraterrestrial life. Water and life are closely related, and the search of water evidence on Mars is an important task in Mars exploration. In 2004, two twin rovers, Spirit and Opportunity, arrived at the equator of Mars, one on each side, and began their long journey to check rocks and craters for traces of water. The distance between Mars and Earth is 5.57~40.13×10⁷ km; it takes a radio signal around 20 minutes to finish a one-way trip. This delay, plus the limited window of communications between Mars and Earth (as the rovers use solar panels for power), makes it very hard to handle the rover directly from the Earth. Autonomous navigation is the most feasible way to make efficient use of the Mars rovers. Currently, instructions, including target location and approximate route, are sent to the rovers; rovers then use hazard avoidance techniques and navigation instruments to approach their target. Route planning and localization need detailed higher precision and higher resolution maps that can not be provided through satellite imagery. The MER rovers are equipped with four of stereo cameras: Navcam, Pancam, front Hazcam, and rear Hazcam. Navcam parameters are: 1024×1024 pixels, 0.82 mrad/pixel, 45° FOV, and 15cm baseline (Maki et al., 2003). Pancam parameters are: 1024×1024 pixels, 0.27 mrad/pixel, 16° FOV, and 25cm baseline (Bell et al., 2003). The valid measurement range (1m
distance measurement error with mismatch level at 1/3 pixel in parallax) is around 27m for the Navcam and around 52m for the Pancam. Thus the Navcam is used for close-range mapping and the Pancam is used for long-range mapping. Each rover takes photos at different looking angles. Camera rotations around the mast (azimuth) and around the camera bar (tilt) are recorded and serve as the initial orientation parameters. These photos can form a panorama, which normally consists of 10 Navcam pairs or 27 Pancam pairs. The overlap between neighboring image pairs (inter-stereo) is around ten percent. Overlap between left and right images of a pair (intra-stereo) is around ninety percent for Navcam and seventy percent for Pancam. These images can be linked through tie-points. 1.2 Brief review
Stereo vision is a well-studied problem. Existing methods can be classified into local methods, global method, and occlusion detection (Brown, 2003), or into three steps: matching-cost calculation, aggregation, and optimization (Scharstein, 2002). Most methods are aimed at making a parallax image for the overlapping area of two images in a general scene scenario. The global methods include dynamic programming methods (Ohta, 1985), which consider only constraints in the scanline direction, and graph cut methods (Roy, 1998), which apply constraints in both the scanline and the inter-scanline directions. The first method is limited; the second gives better result, but is very time consuming. For robot navigation, there are both local and global methods of stereo vision, as well as active vision (Desouza, 2002; Jensfelt, 2001; Leonard, 1991). Most of these are used for indoor applications (Kriegman, 1989); some are used for unstructured
���������,
environments as well (Krotkov, 1994; Sutherland, 1994; Olson, 2000; Cozman, 2000). Real-time applications are preferred (Atiya, 1993). To assistant robot localization, landmarks are selected or maps are built in the following applications: Shimshoni, 2002; Mouaddib, 2002; Betke, 1997; Davison, 2002; Olson, 2002. 1.3 Approach
Our goal is to generate terrain maps and orthophotos using Navcam and Pancam panoramic stereo images to support traverse design and to localize each rover by adjustment with cross-site tie points. The core of map generation is registration between intra-stereo and inter-stereo images and spatial interpolation. For an unstructured extraterrestrial environment, features like edges and surfaces rarely exist, thus we select interest points as our features for matching. Interest points between intra-stereo image pairs are matched locally and verified globally. The verification of matching is a global matching process of two steps: first, elimination of large parallax outliers using a median filter in the vertical profile (perpendicular to the scanline) by assuming piecewise continuity, which is true for a natural terrain; second, detection of small parallax outliers by triangulating all points in the X-Y plane, back-projecting them onto the photo plane, and then checking disordering nodes. Interest points between inter-stereo image pairs are actually matched in 3-D. For each point there are four observations; this redundancy can be used to reliably eliminate outliers. Instead of finding parallax for every point in the image plane, which is inaccurate and unreliable for featureless areas, we interpolate the terrain surface in 3-D using highly reliable points. Kriging, for the close range, and Triangular Irregular Network (TIN), for the far range, are used for spatial interpolation. Landmarks, such as rocks, are detected by projecting the interpolated DEM back onto a number of corresponding images and comparing the parallax difference. Rocks from different sites are matched by considering measurement and localization uncertainties. These rocks are then used as cross-site tie points to adjust the rover location through rigid transformation and bundle adjustment.
2. MAPPING WITH DESCENT IMAGERY (DIMES)
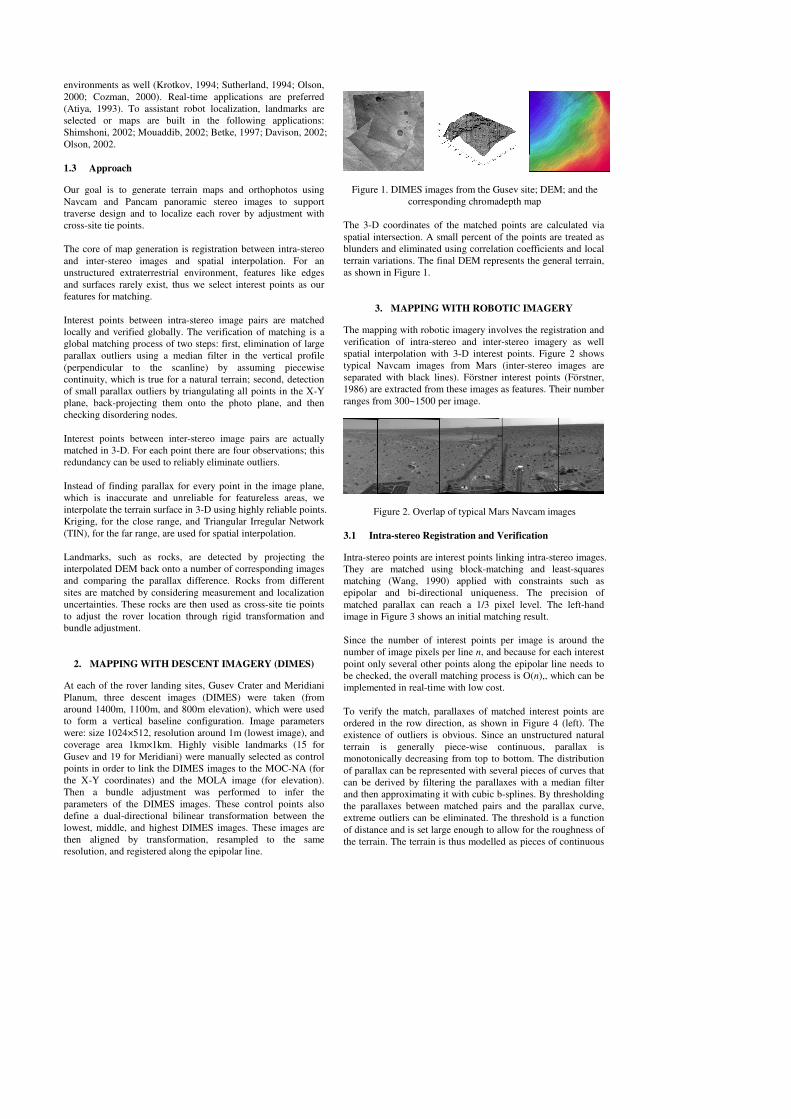
At each of the rover landing sites, Gusev Crater and Meridiani Planum, three descent images (DIMES) were taken (from around 1400m, 1100m, and 800m elevation), which were used to form a vertical baseline configuration. Image parameters were: size 1024×512, resolution around 1m (lowest image), and coverage area 1km×1km. Highly visible landmarks (15 for Gusev and 19 for Meridiani) were manually selected as control points in order to link the DIMES images to the MOC-NA (for the X-Y coordinates) and the MOLA image (for elevation). Then a bundle adjustment was performed to infer the parameters of the DIMES images. These control points also define a dual-directional bilinear transformation between the lowest, middle, and highest DIMES images. These images are then aligned by transformation, resampled to the same resolution, and registered along the epipolar line.
Figure 1. DIMES images from the Gusev site; DEM; and the corresponding chromadepth map
The 3-D coordinates of the matched points are calculated via spatial intersection. A small percent of the points are treated as blunders and eliminated using correlation coefficients and local terrain variations. The final DEM represents the general terrain, as shown in Figure 1.
3. MAPPING WITH ROBOTIC IMAGERY
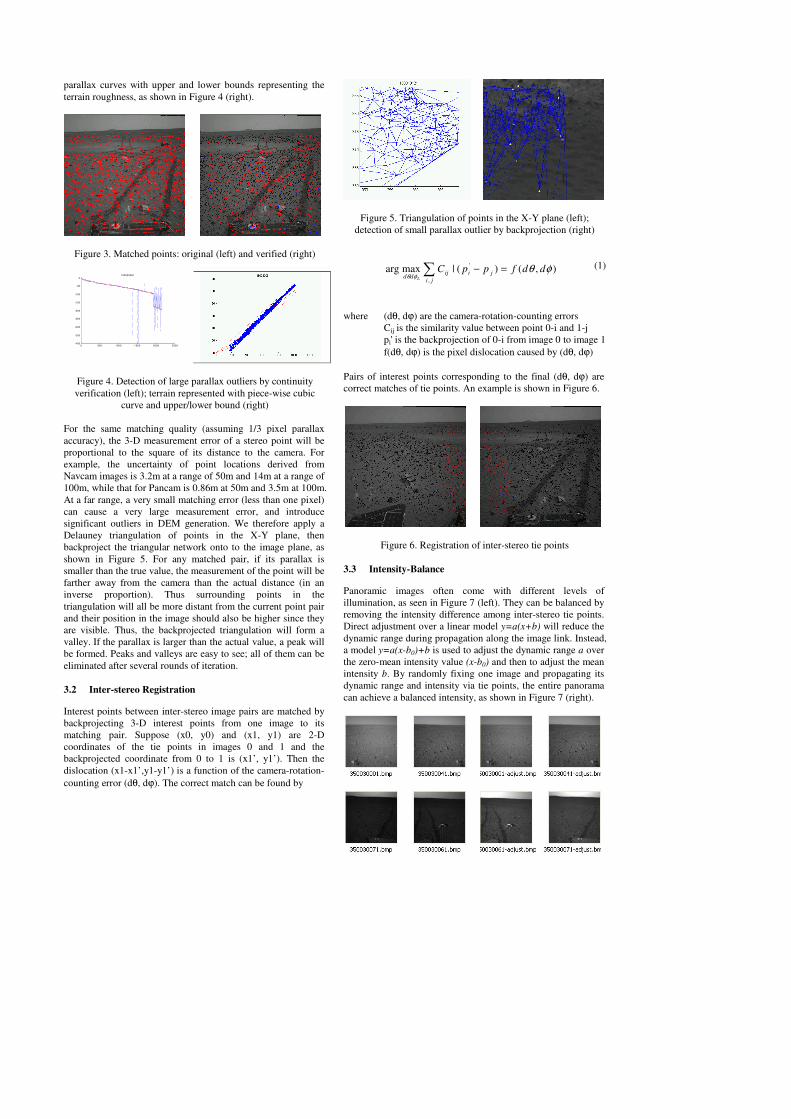
The mapping with robotic imagery involves the registration and verification of intra-stereo and inter-stereo imagery as well spatial interpolation with 3-D interest points. Figure 2 shows typical Navcam images from Mars (inter-stereo images are separated with black lines). Förstner interest points (Förstner, 1986) are extracted from these images as features. Their number ranges from 300~1500 per image.
Figure 2. Overlap of typical Mars Navcam images 3.1 Intra-stereo Registration and Verification
Intra-stereo points are interest points linking intra-stereo images. They are matched using block-matching and least-squares matching (Wang, 1990) applied with constraints such as epipolar and bi-directional uniqueness. The precision of matched parallax can reach a 1/3 pixel level. The left-hand image in Figure 3 shows an initial matching result. Since the number of interest points per image is around the number of image pixels per line n, and because for each interest point only several other points along the epipolar line needs to be checked, the overall matching process is O(n),, which can be implemented in real-time with low cost. To verify the match, parallaxes of matched interest points are ordered in the row direction, as shown in Figure 4 (left). The existence of outliers is obvious. Since an unstructured natural terrain is generally piece-wise continuous, parallax is monotonically decreasing from top to bottom. The distribution of parallax can be represented with several pieces of curves that can be derived by filtering the parallaxes with a median filter and then approximating it with cubic b-splines. By thresholding the parallaxes between matched pairs and the parallax curve, extreme outliers can be eliminated. The threshold is a function of distance and is set large enough to allow for the roughness of the terrain. The terrain is thus modelled as pieces of continuous
parallax curves with upper and lower bounds representing the terrain roughness, as shown in Figure 4 (right).
Figure 3. Matched points: original (left) and verified (right)
Figure 4. Detection of large parallax outliers by continuity verification (left); terrain represented with piece-wise cubic
curve and upper/lower bound (right)
For the same matching quality (assuming 1/3 pixel parallax accuracy), the 3-D measurement error of a stereo point will be proportional to the square of its distance to the camera. For example, the uncertainty of point locations derived from Navcam images is 3.2m at a range of 50m and 14m at a range of 100m, while that for Pancam is 0.86m at 50m and 3.5m at 100m. At a far range, a very small matching error (less than one pixel) can cause a very large measurement error, and introduce significant outliers in DEM generation. We therefore apply a Delauney triangulation of points in the X-Y plane, then backproject the triangular network onto to the image plane, as shown in Figure 5. For any matched pair, if its parallax is smaller than the true value, the measurement of the point will be farther away from the camera than the actual distance (in an inverse proportion). Thus surrounding points in the triangulation will all be more distant from the current point pair and their position in the image should also be higher since they are visible. Thus, the backprojected triangulation will form a valley. If the parallax is larger than the actual value, a peak will be formed. Peaks and valleys are easy to see; all of them can be eliminated after several rounds of iteration.
3.2 Inter-stereo Registration
Interest points between inter-stereo image pairs are matched by backprojecting 3-D interest points from one image to its matching pair. Suppose (x0, y0) and (x1, y1) are 2-D coordinates of the tie points in images 0 and 1 and the backprojected coordinate from 0 to 1 is (x1’, y1’). Then the dislocation (x1-x1’,y1-y1’) is a function of the camera-rotation-counting error (dθ, dϕ). The correct match can be found by
Figure 5. Triangulation of points in the X-Y plane (left); detection of small parallax outlier by backprojection (right)
),()(|maxarg '
,
φθφθ
ddfppC jiji
ijdd L
=−� (1)
where (dθ, dϕ) are the camera-rotation-counting errors Cij is the similarity value between point 0-i and 1-j pi' is the backprojection of 0-i from image 0 to image 1 f(dθ, dϕ) is the pixel dislocation caused by (dθ, dϕ) Pairs of interest points corresponding to the final (dθ, dϕ) are correct matches of tie points. An example is shown in Figure 6.
Figure 6. Registration of inter-stereo tie points 3.3 Intensity-Balance
Panoramic images often come with different levels of illumination, as seen in Figure 7 (left). They can be balanced by removing the intensity difference among inter-stereo tie points. Direct adjustment over a linear model y=a(x+b) will reduce the dynamic range during propagation along the image link. Instead, a model y=a(x-b0)+b is used to adjust the dynamic range a over the zero-mean intensity value (x-b0) and then to adjust the mean intensity b. By randomly fixing one image and propagating its dynamic range and intensity via tie points, the entire panorama can achieve a balanced intensity, as shown in Figure 7 (right).
0 500 1000 1500 2000 2500-400
-350
-300
-250
-200
-150
-100
-50
0100030061
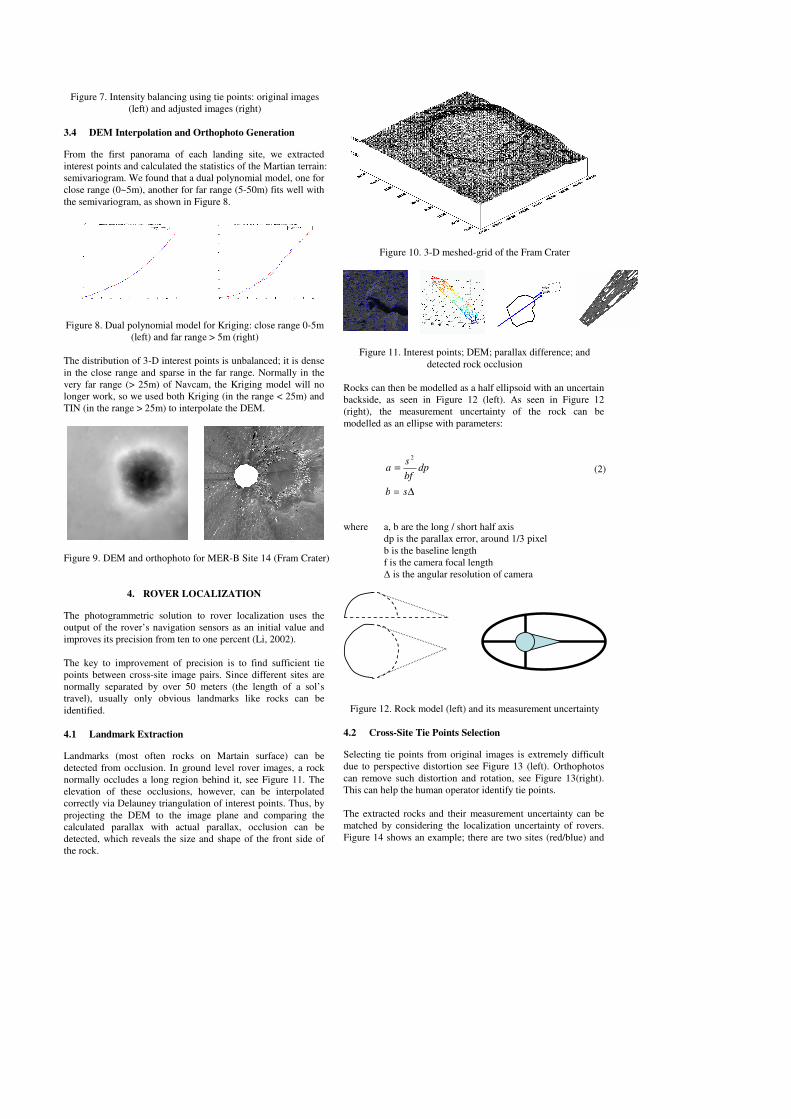
Figure 7. Intensity balancing using tie points: original images
(left) and adjusted images (right) 3.4 DEM Interpolation and Orthophoto Generation
From the first panorama of each landing site, we extracted interest points and calculated the statistics of the Martian terrain: semivariogram. We found that a dual polynomial model, one for close range (0~5m), another for far range (5-50m) fits well with the semivariogram, as shown in Figure 8.
Figure 8. Dual polynomial model for Kriging: close range 0-5m (left) and far range > 5m (right)
The distribution of 3-D interest points is unbalanced; it is dense in the close range and sparse in the far range. Normally in the very far range (> 25m) of Navcam, the Kriging model will no longer work, so we used both Kriging (in the range < 25m) and TIN (in the range > 25m) to interpolate the DEM.
Figure 9. DEM and orthophoto for MER-B Site 14 (Fram Crater)
4. ROVER LOCALIZATION
The photogrammetric solution to rover localization uses the output of the rover’s navigation sensors as an initial value and improves its precision from ten to one percent (Li, 2002). The key to improvement of precision is to find sufficient tie points between cross-site image pairs. Since different sites are normally separated by over 50 meters (the length of a sol’s travel), usually only obvious landmarks like rocks can be identified. 4.1 Landmark Extraction
Landmarks (most often rocks on Martain surface) can be detected from occlusion. In ground level rover images, a rock normally occludes a long region behind it, see Figure 11. The elevation of these occlusions, however, can be interpolated correctly via Delauney triangulation of interest points. Thus, by projecting the DEM to the image plane and comparing the calculated parallax with actual parallax, occlusion can be detected, which reveals the size and shape of the front side of the rock.
Figure 10. 3-D meshed-grid of the Fram Crater
Figure 11. Interest points; DEM; parallax difference; and detected rock occlusion
Rocks can then be modelled as a half ellipsoid with an uncertain backside, as seen in Figure 12 (left). As seen in Figure 12 (right), the measurement uncertainty of the rock can be modelled as an ellipse with parameters:
∆=
=
sb
dpbfs
a2
(2)
where a, b are the long / short half axis dp is the parallax error, around 1/3 pixel b is the baseline length f is the camera focal length � is the angular resolution of camera
Figure 12. Rock model (left) and its measurement uncertainty
4.2 Cross-Site Tie Points Selection
Selecting tie points from original images is extremely difficult due to perspective distortion see Figure 13 (left). Orthophotos can remove such distortion and rotation, see Figure 13(right). This can help the human operator identify tie points. The extracted rocks and their measurement uncertainty can be matched by considering the localization uncertainty of rovers. Figure 14 shows an example; there are two sites (red/blue) and
two sets of landmarks. Some landmarks are only distinguishable from one site.
Figure 13. Cross-site tie points on original image (left) and
orthophotos (right)
Figure 14. Matching of cross-site landmarks By pairing landmarks located within ranges defined by measurement and localization uncertainty, the parameter of localization uncertainty can be estimated as:
))((maxarg Lbjaibjaiuuuullcount
L
++<− (3)
where a, b denote site a and site b lai, lbj are the coordinates of landmarks a-i and b-j uai and ubj are landmark measurement uncertainty uL is relative localization uncertainty between a and b The corresponding pairs of landmarks can be used as cross-site tie points. This normally needs human verification. 4.3 Bundle Adjustment and Rover Localization
Bundle adjustment to improve rover localization results consists of three steps: in-site bundle-adjustment (to remove the within-site inconsistence), cross-site rigid transformation (to improve initial parameters), and cross-site bundle-adjustment (to refine parameters iteratively). The bundle adjustment shown in Equation 7 is derived from observation equation 4 and error equations 5 and 6. Since there is no ground truth, there is no absolute solution; however, using Singular Value Decomposition (SVD) we can obtain an optimal solution. Equation 8 represents the rigid transformation, in which the transformation matrix B (representing rotation and translation) is calculated from cross-site tie points.
),,,,,,,,(),( κφωSSS ZYXZYXfyx = (4)
κφω dadada
dZadYadXadZadYadXav SSS
987
654321
++++++++= (5)
AXV = (6) PVAPAAX TT 1)( −= (7)
12 BPP = (8) where (x,y) is the image coordinate of the tie points (X,Y,Z) is the object coordinate of the tie points (XS,YS,ZS) is the camera coordinate (ω,φ,κ) is the camera attitude v, V are the residuals of the observation a1-9, A are coefficients, a function of (XS,YS,ZS, ω,φ,κ) X is the unknown vector (X,Y,Z,XS,YS,ZS, ω,φ,κ) P is the weight matrix B is the matrix of rigid transformation
P1, P2 are homogeneous coordinates of tie points After the bundle adjustment, the new camera position can be used to renew the rover’s location.
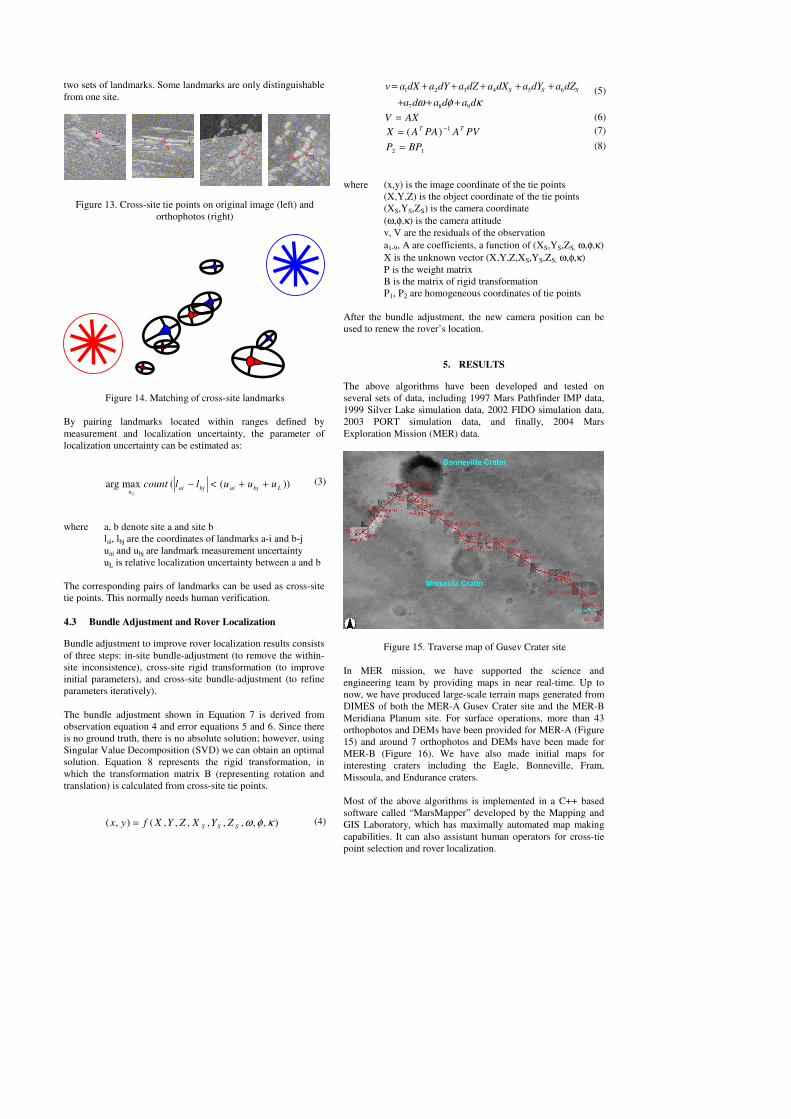
5. RESULTS
The above algorithms have been developed and tested on several sets of data, including 1997 Mars Pathfinder IMP data, 1999 Silver Lake simulation data, 2002 FIDO simulation data, 2003 PORT simulation data, and finally, 2004 Mars Exploration Mission (MER) data.
Figure 15. Traverse map of Gusev Crater site In MER mission, we have supported the science and engineering team by providing maps in near real-time. Up to now, we have produced large-scale terrain maps generated from DIMES of both the MER-A Gusev Crater site and the MER-B Meridiana Planum site. For surface operations, more than 43 orthophotos and DEMs have been provided for MER-A (Figure 15) and around 7 orthophotos and DEMs have been made for MER-B (Figure 16). We have also made initial maps for interesting craters including the Eagle, Bonneville, Fram, Missoula, and Endurance craters. Most of the above algorithms is implemented in a C++ based software called “MarsMapper” developed by the Mapping and GIS Laboratory, which has maximally automated map making capabilities. It can also assistant human operators for cross-tie point selection and rover localization.
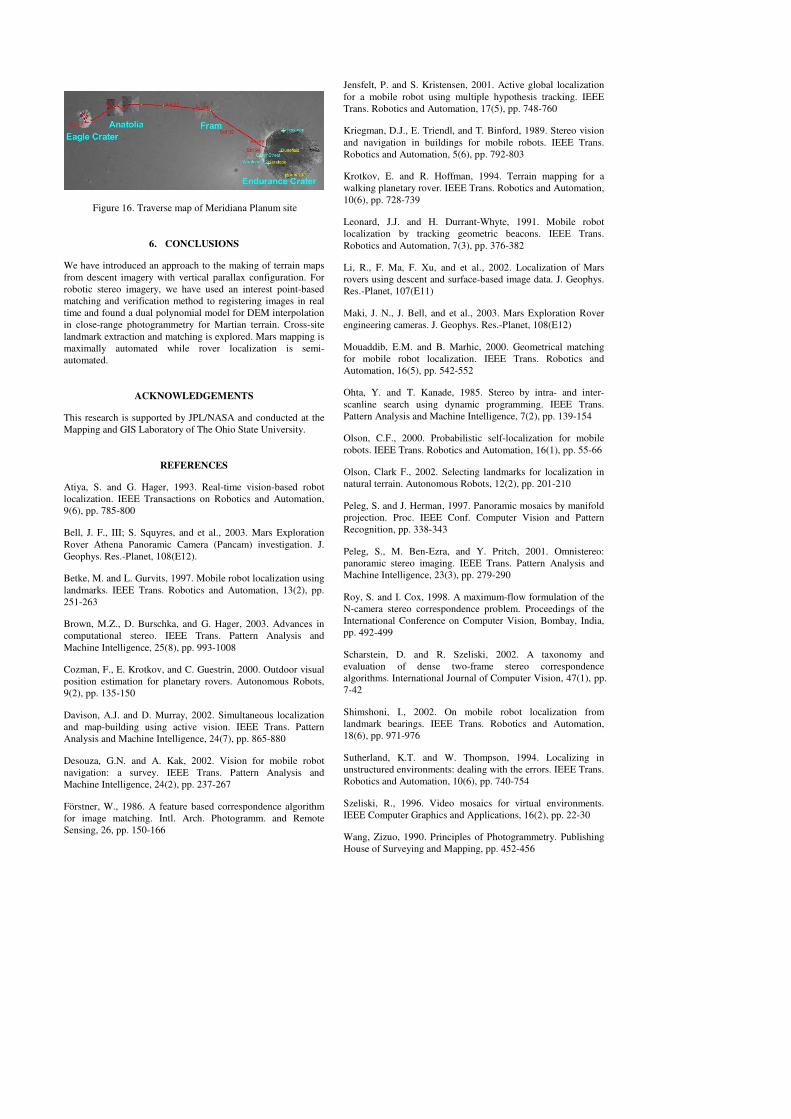
Figure 16. Traverse map of Meridiana Planum site
6. CONCLUSIONS
We have introduced an approach to the making of terrain maps from descent imagery with vertical parallax configuration. For robotic stereo imagery, we have used an interest point-based matching and verification method to registering images in real time and found a dual polynomial model for DEM interpolation in close-range photogrammetry for Martian terrain. Cross-site landmark extraction and matching is explored. Mars mapping is maximally automated while rover localization is semi-automated.
ACKNOWLEDGEMENTS
This research is supported by JPL/NASA and conducted at the Mapping and GIS Laboratory of The Ohio State University.
REFERENCES
Atiya, S. and G. Hager, 1993. Real-time vision-based robot localization. IEEE Transactions on Robotics and Automation, 9(6), pp. 785-800
Bell, J. F., III; S. Squyres, and et al., 2003. Mars Exploration Rover Athena Panoramic Camera (Pancam) investigation. J. Geophys. Res.-Planet, 108(E12).
Betke, M. and L. Gurvits, 1997. Mobile robot localization using landmarks. IEEE Trans. Robotics and Automation, 13(2), pp. 251-263
Brown, M.Z., D. Burschka, and G. Hager, 2003. Advances in computational stereo. IEEE Trans. Pattern Analysis and Machine Intelligence, 25(8), pp. 993-1008
Cozman, F., E. Krotkov, and C. Guestrin, 2000. Outdoor visual position estimation for planetary rovers. Autonomous Robots, 9(2), pp. 135-150
Davison, A.J. and D. Murray, 2002. Simultaneous localization and map-building using active vision. IEEE Trans. Pattern Analysis and Machine Intelligence, 24(7), pp. 865-880
Desouza, G.N. and A. Kak, 2002. Vision for mobile robot navigation: a survey. IEEE Trans. Pattern Analysis and Machine Intelligence, 24(2), pp. 237-267
Förstner, W., 1986. A feature based correspondence algorithm for image matching. Intl. Arch. Photogramm. and Remote Sensing, 26, pp. 150-166
Jensfelt, P. and S. Kristensen, 2001. Active global localization for a mobile robot using multiple hypothesis tracking. IEEE Trans. Robotics and Automation, 17(5), pp. 748-760
Kriegman, D.J., E. Triendl, and T. Binford, 1989. Stereo vision and navigation in buildings for mobile robots. IEEE Trans. Robotics and Automation, 5(6), pp. 792-803
Krotkov, E. and R. Hoffman, 1994. Terrain mapping for a walking planetary rover. IEEE Trans. Robotics and Automation, 10(6), pp. 728-739
Leonard, J.J. and H. Durrant-Whyte, 1991. Mobile robot localization by tracking geometric beacons. IEEE Trans. Robotics and Automation, 7(3), pp. 376-382
Li, R., F. Ma, F. Xu, and et al., 2002. Localization of Mars rovers using descent and surface-based image data. J. Geophys. Res.-Planet, 107(E11)
Maki, J. N., J. Bell, and et al., 2003. Mars Exploration Rover engineering cameras. J. Geophys. Res.-Planet, 108(E12)
Mouaddib, E.M. and B. Marhic, 2000. Geometrical matching for mobile robot localization. IEEE Trans. Robotics and Automation, 16(5), pp. 542-552
Ohta, Y. and T. Kanade, 1985. Stereo by intra- and inter-scanline search using dynamic programming. IEEE Trans. Pattern Analysis and Machine Intelligence, 7(2), pp. 139-154
Olson, C.F., 2000. Probabilistic self-localization for mobile robots. IEEE Trans. Robotics and Automation, 16(1), pp. 55-66
Olson, Clark F., 2002. Selecting landmarks for localization in natural terrain. Autonomous Robots, 12(2), pp. 201-210
Peleg, S. and J. Herman, 1997. Panoramic mosaics by manifold projection. Proc. IEEE Conf. Computer Vision and Pattern Recognition, pp. 338-343
Peleg, S., M. Ben-Ezra, and Y. Pritch, 2001. Omnistereo: panoramic stereo imaging. IEEE Trans. Pattern Analysis and Machine Intelligence, 23(3), pp. 279-290
Roy, S. and I. Cox, 1998. A maximum-flow formulation of the N-camera stereo correspondence problem. Proceedings of the International Conference on Computer Vision, Bombay, India, pp. 492-499
Scharstein, D. and R. Szeliski, 2002. A taxonomy and evaluation of dense two-frame stereo correspondence algorithms. International Journal of Computer Vision, 47(1), pp. 7-42
Shimshoni, I., 2002. On mobile robot localization from landmark bearings. IEEE Trans. Robotics and Automation, 18(6), pp. 971-976
Sutherland, K.T. and W. Thompson, 1994. Localizing in unstructured environments: dealing with the errors. IEEE Trans. Robotics and Automation, 10(6), pp. 740-754
Szeliski, R., 1996. Video mosaics for virtual environments. IEEE Computer Graphics and Applications, 16(2), pp. 22-30
Wang, Zizuo, 1990. Principles of Photogrammetry. Publishing House of Surveying and Mapping, pp. 452-456