automatic vision inspection solution for the manufacturing
TRANSCRIPT

978-1-7281-9080-8/20/$31.00 ©2020 IEEE
Automatic Vision Inspection Solution for the
Manufacturing Process of Automotive Components
Through Plastic Injection Molding
Mircea Paul Muresan, Dragos Gabriel Cireap, Ion Giosan
Computer Science Department
Technical University of Cluj-Napoca
Cluj-Napoca, Romania
[email protected], [email protected], [email protected]
Abstract— In the automotive industry, vehicle components
can be obtained through the process of plastic injection molding.
The components can be fixed in the vehicle by using metal
bushings, which are placed on the injection mold before the
beginning of the plastic injection process. The incorrect
placement or absence of the bushings leads to a defective
product. Object classification has been a long-tackled problem
in Computer Science, and the breakthroughs in Artificial
Intelligence allows us to solve this problem with a high degree of
accuracy and precision. In the context of industrial inspection,
ensuring high-quality products is a matter of utmost
importance. The automated vision inspection process facilitates
the creation of a high volume of products, which are in
conformity with the quality standards, in a short amount of time
and can save the manufacturing company money. In this paper
we propose a solution that automatically detects the injection
mold and classifies the positioning of the bushings, warning the
operator in case the current positioning can lead to a defective
product. Furthermore, the bushing detection is optimized in
such a way that, it is mandatory for the mold to be visible only
in the first frame, thus reducing the running time of the whole
pipeline. The results are validated by using a data set covering
multiple possible working scenarios. Moreover, we compare the
implemented classifier with other classifiers, highlighting the
performance of the proposed solution with respect to running
time and classification accuracy.
Keywords—CNN, non-destructive testing, plastic injection
molding , artificial intelligence, computer vision, industrial
inspection
I. INTRODUCTION
Industrial inspection is a critical process in ensuring the quality of a product before reaching the market. Until recent times, a human operator whose duty was checking for faults in products, was used. This method was not reliable in all cases, as attention fades with repetitive and boring jobs. However, thanks to the innovations in artificial intelligence, computer vision and technology in general, it is possible to inspect products using advanced algorithms, without the need of a human employee, whose attributes shifted from checking for faults to operating the industrial inspection machines. Other advantages of this practice include objectiveness and repeatability of a certain inspection or measurement process.
Two types of testing are distinguished, based on impact they have on the product. Destructive testing is meant to destroy the test specimen in order to find out its properties. In the paper presented in [1], the authors show the values of concrete-mix strength, found out using destructive testing. Hardness can be inspected by placing a heavy ball on the specimen, then applying a force on the ball, and using a microscope to detect the deformation of the specimen, known as the Brinell test [2]. The main disadvantage of such an experiment, is that the specimen is no longer usable. In consequence, destructive testing is only applicable to one item in a batch, which does not guarantee the same properties for all products in that batch, therefore this type of testing is more of an approximation. Non-destructive testing (NDT), on the other hand, describes various methods of inspecting the structure of a specimen without destroying or altering its composition. They are especially useful because no material is wasted and they can be applied to each product, instead of a batch of products. This leads to certain advantages, like improved product quality, raw material and finished products are not wasted, and therefore higher profit for the manufacturing company. The are many types of NDT methods used, some of them really simple, like penetrant methods, were a dye is placed on top of a material and then cleaned, leaving the dye visible in the cracks [3]. Radiographic methods are based on X-rays that penetrate the material and display on a film possible cracks in the material [4]. Ultrasonic methods use the properties of high-frequency sound waves, where based on the emission and reception time computed by a probe, cracks can be found in the material [5]. Magnetic methods use the flux leakage detection method to check for very fine cuts and cracks on the surface [6]. Electrical methods induce currents into conductive materials to detect cracks [7]. In the injection molding process, an injection molding machine liquifies the polyester, and injects it under pressure into a specific molding tool. Through cross linking reaction or cooling, the material from the molding tool, transforms into a solid state and can be removed and the process can be repeated. The cavity of the molding tool, determines the shape and surface structure of the finished part. Being a complex procedure, intelligent systems have been developed to model this process and tune its parameters, as presented in [8].

In the current paper, the correct placement of metal bushings plays an important role in obtaining the desired product. These components are placed onto the molding tool before the injection process, and if they are missing or are incorrectly placed, all the following stages of the manufacturing process will lead to the creation of a flawed product. Therefore, the quality of the final product is directly influenced by the correct placement on the bushings onto the mold. In this paper, a non-destructive optical inspection solution for the problem of analyzing the correct placement of the bushings on parts obtained through the process of plastic injection molding is presented. The proposed approach segments the image region corresponding to the mold, isolates the region of interest, which includes the area around the bushings and for each bushing the proposed algorithm classifies it into 3 main categories: well placed, badly placed or missing. The operator is warned using a color code about the positioning each bushing from the mold. This proposed solution is relevant for multiple reasons. Most important, it intervenes in the manufacturing process enabling the detection of faulty parts before the product is finished. Therefore, the costs of production are reduced, because possible faults are mitigated before the plastic injection process is started. Furthermore, using such an approach, human error is removed, and the inspection process is objective and repeatable. The rest of the paper is structured as follows, section II presents the related work in the field of non-destructive testing, in section III the proposed solution is explained, in section IV the experimental results are shown and finally in section V the main conclusions are drawn.
II. RELATED WORK
In many industries, massive automation has been
carried out on manufacturing lines, however, in many cases,
defect detection is still being done visually by inspection
workers. Product verification is an important step in the
manufacturing process, and ensuring that the quality of each
product is compliant with the standards is a challenging task.
Factors such as fatigue of the human operator, caused by
performing a repeatable task, may affect the accuracy of the
quality inspection. Furthermore, compared to machines, the
working hours of the human inspector is relatively short, and
the final verdict, when assessing the quality of a product, may
be subjective and may have fluctuations with respect to the
inspection standards and some rate of unavoidable errors.
The digitalization of factories adopted by many
manufacturers has led to the usage of automated visual
inspection [9], which ensures the objectiveness and
repeatability of the quality inspection task, while also
improving the production throughput. Automated visual
inspection, assumes the usage of computer vision methods
for quality control, and many solutions have been applied in
the production lines of traditional manufacturing industries in
order to help factories achieve their desired level of quality.
In [10] a new type of system that use a Cellular Neural
Network was proposed, that would be suited in the field of
visual inspection of paper, metal and polymer surfaces, due
to its highly parallel architecture. The proposed approach was
able to detect faults, like cracks and scratches, in real-time.
The biggest advantage of this solution consists in its parallel
architecture design that increases the processing speed.
Cellular Neural Network machines, were also used in [11],
where the authors managed to implement a genetic algorithm
for border detection and template matching. With this
approach, very fine scratches were being detected on metal
surfaces. A simpler solution that only uses a webcam to
measure different geometrical features of industrial products
such as length, height, or diagonal of circular parts, was
proposed in [12].
In recent years Convolutional Neural Networks
(CNN) models have proven to be powerful tools for many
classification applications. Furthermore, CNNs can extract
automatically features from complex data sets, and can be
fine-tuned with certain inputs to meet specific industrial
requirements. For these reasons, many industrial inspection
applications have applied CNN models for defect detection
and classification [13, 14, 15]. The authors in [16] train and
compare ResNet, Inception and MobileNet CNN models to
detect up to 27 defects in power cable manufacturing. A
framework for automatic machine vision-based surface
defect detection and classification is presented in [17]. The
authors use a modified SqueezeNet model that can classify
defects of various sizes in cluttered background. In order to
obtain larger receptive files and extract multi-scale features
the authors use multiple convolutional layers having different
kernel sizes. Furthermore, the number of parameters of the
newly added convolutional layers are reduced to avoid over-
fitting. Another neural network model NB-CNN, proposed in
[18], managed to detect defects like cracks on underwater
metallic surfaces for nuclear components. The method uses a
novel data fusion scheme that aggregates information
obtained from multiple video frames and registers crack
patches to a global coordinate system forming tubelets.
Moreover, A Naive Bayes decision making process discards
tubelets that are not of interest. Using multiple Convolutional
Neural Networks, the authors of [19] create a multiscale
system capable of combining different networks that have
been trained independently. Such a system can perform visual
inspection of airplane engine blades.
Authors of [20] used CNNs in order to classify a wide
range of defects on the surface of materials such as steel,
paper, foil, glass, plastic and film, obtaining an accuracy of
over 98%. The authors in [21] combine a CNN architecture
with K-NN algorithm to accurately detect and classify five
surface defects, present in the semiconductor manufacturing
industry. Based on the detected defects, the operators can
determine whether the product can be repaired or discarded.
CNNs have also been applied for quality control purposes in
a paper production plant [22]. The architecture was used to
generate different digital filters that aided the discovery of
defects. Other works, like the one presented in [23], use MLP
Neural Networks to predict the quality and soundness of
injected plastic parts; the results show that the model is
capable of determining the existence of weld line defects. The
authors in [24] present a quality predictor for the plastic
injection molding process using a self-organizing map
together with a back-propagation neural network (SOM-
BPNN). The results present a comparison of SOM-BPNN
and another BPNN, with SOM-BPNN having a much better
accuracy at predicting the quality values.
The current paper builds upon the state of the art by
creating a novel automated vision inspection and warning
system that aims at detecting and classifying the positioning
or absence of metal bushings onto an injection mold, with the
purpose of preventing the creation products that are not in
conformity with the standards. The incorrect positioning or
the absence of one of the metal bushings, may lead to the
creation of a defect product, and the loss of raw material
(PWC) and implicitly the loss of money for the
manufacturing company. The pipeline of the proposed
system contains an image pre-processing step, the mold
detection stage, the bushing segmentation and classification
part and finally the visual warning stage that informs the
operator about the status of system.
III. PROPOSED SOLUTION
In this section, a solution incorporating the detection
of an industrial mold and bushings along with bushing
classification is presented. The processing pipeline of the
proposed solution consists of the following five stages: Data
Pre-processing, Mold Detection, Bushings Detection,
Bushings Classification, Visual Warning System. For
experimental purposes a copy of the mold has been created,
that respects the proportions and interior shape and structure
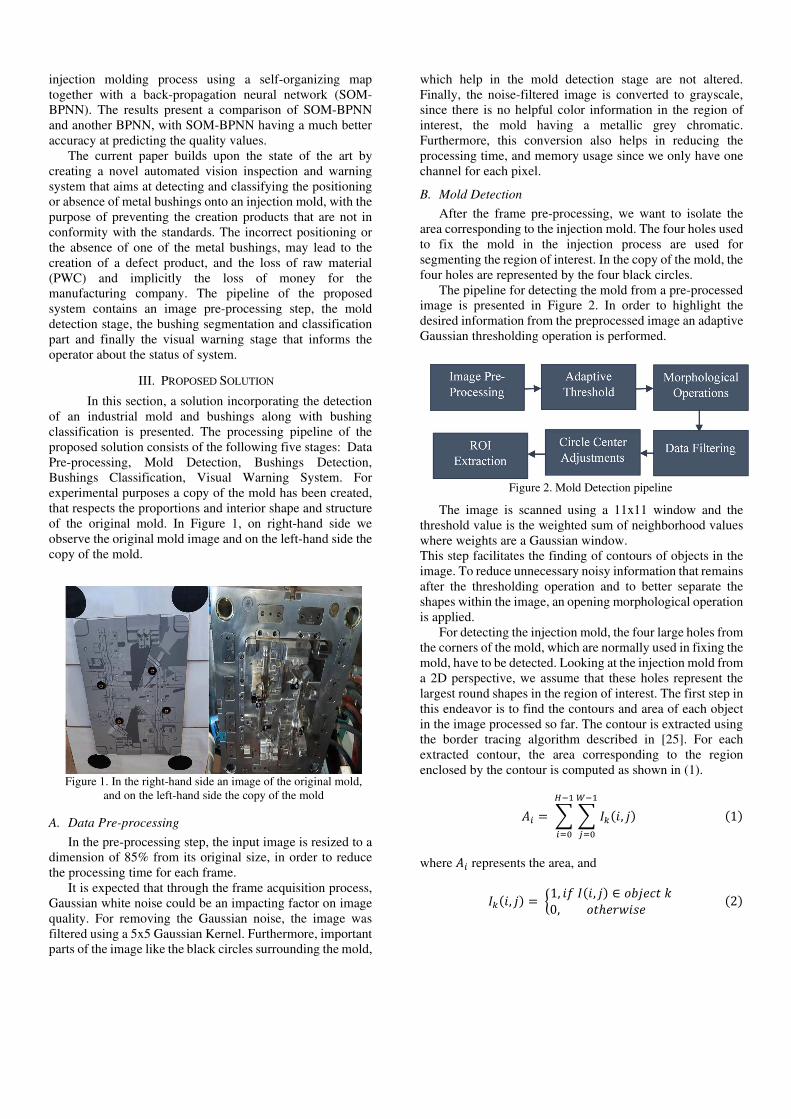
of the original mold. In Figure 1, on right-hand side we
observe the original mold image and on the left-hand side the
copy of the mold.
A. Data Pre-processing
In the pre-processing step, the input image is resized to a
dimension of 85% from its original size, in order to reduce
the processing time for each frame.
It is expected that through the frame acquisition process,
Gaussian white noise could be an impacting factor on image
quality. For removing the Gaussian noise, the image was
filtered using a 5x5 Gaussian Kernel. Furthermore, important
parts of the image like the black circles surrounding the mold,
which help in the mold detection stage are not altered.
Finally, the noise-filtered image is converted to grayscale,
since there is no helpful color information in the region of
interest, the mold having a metallic grey chromatic.
Furthermore, this conversion also helps in reducing the
processing time, and memory usage since we only have one
channel for each pixel.
B. Mold Detection
After the frame pre-processing, we want to isolate the
area corresponding to the injection mold. The four holes used
to fix the mold in the injection process are used for
segmenting the region of interest. In the copy of the mold, the
four holes are represented by the four black circles.
The pipeline for detecting the mold from a pre-processed
image is presented in Figure 2. In order to highlight the
desired information from the preprocessed image an adaptive
Gaussian thresholding operation is performed.
The image is scanned using a 11x11 window and the
threshold value is the weighted sum of neighborhood values
where weights are a Gaussian window.
This step facilitates the finding of contours of objects in the
image. To reduce unnecessary noisy information that remains
after the thresholding operation and to better separate the
shapes within the image, an opening morphological operation
is applied.
For detecting the injection mold, the four large holes from
the corners of the mold, which are normally used in fixing the
mold, have to be detected. Looking at the injection mold from
a 2D perspective, we assume that these holes represent the
largest round shapes in the region of interest. The first step in
this endeavor is to find the contours and area of each object
in the image processed so far. The contour is extracted using
the border tracing algorithm described in [25]. For each
extracted contour, the area corresponding to the region
enclosed by the contour is computed as shown in (1).
�� � � � ���, �� ��
���
���
��� �1�
where �� represents the area, and
���, �� � �1, � ��, �� ∈ ������ �0, ��ℎ� !"� �2�
Figure 2. Mold Detection pipeline
Figure 1. In the right-hand side an image of the original mold,
and on the left-hand side the copy of the mold

The circularity, C, of each identified object is computed using
(3), where A is the area of the object, and P is the perimeter.
$ � 4& ' �()* �3�
Objects having a circularity below 0.7 are removed. The
perspective effect together with bad illumination may lead to
a poor ROI identification, therefore the selection of the
largest round objects is not a viable solution. For this reason,
the image is further filtered using the area of each identified
item, leaving only the instances that have an area larger than
30% of the area of the largest contour. The 30% percentage
has been chosen experimentally, due to the fact that
depending on the viewpoint of the camera, and the
perspective effect, some circles can appear larger than others.
The results of the processing steps presented so far can be
seen in Figure 3.
The region of interest is isolated using the position of the
centroids of each identified circle. In some scenarios, the
algorithm may be unable to recognize all four circles, due to
bad illumination. In case only three of the four circles are
detected, the approximate location of the fourth circle is
inferred, by using the assumption that the mold has the shape
of a quadrilateral with parallel edges in the 2D image space.
Knowing that the slope of the parallel lines that make the
quadrilateral is equal, a system of 2 equations with two
unknowns can be derived. Given the four points necessary for
detecting the ROI corresponding to the mold (��,�, -��,
(��,�, -�� , ()�,), -)�, (.�,., -.� are positioned in a
clockwise manner on the corners of the 2D mold, with
(�(� | |()(. and the slope 01213 � 01415 . In case the point,
(.�,., -.�, is not detected, its position can be inferred using
equations 4 and 5.
x. � 73�84� 82��93�92�:�84�83��93�92��94�92��94�83�82��94�92��84�82��93�92�� �83�82��94�92�
(4)
y. � -) < �83� 82��95�94�93�92
(5)
In Figure 4, two depictions of the cropped region of interest
are illustrated.
C. Bushings Detection
The pipeline for detecting the bushings is similar to the
one presented for detecting the injection mold. To facilitate
the detection of bushings, small circular black marks are
placed around the bushing support area. On the metal mold
the marks can be made using a thermal resistant paint, which
would not disappear after the injection process, but it would
have to be reapplied after a number of days.
In order to aid the bushing detection process, an optimal
level of brightness and contrast have to be set in the image. A
region of interest that is too bright will result in bushings not
being detected, while a region of interest that is too dark will
result in other objects being detected as well.
The brightness is adjusted by applying a linear
transformation to each pixel, p(i,j), located at row i and
column j in the image as exemplified in (6).
=�, �� � 0>, �0, 0?�255, A=�, �� < B�� (6)
The values of A and B are selected relative to the mean
intensity value from the region of interest.
For adjusting the contrast in the ROI, the Contrast
Limited Adaptive Histogram Equalization [26] is used.
A binarization of the region of interest using a global
threshold value (t=50) is used together with a closing
operation for identifying the bushing location. The result of
the mentioned operations is shown in Figure 5.
The contours of the objects in the image are computed,
and then the round objects are filtered. The circularity of
Figure 4. ROI of the injection mold. In the left a case
where all corner points were detected, in the right, only 3
points were detected and one was inferred.
Figure 3. In the left image all detected contours are shown, in
the middle image the remaining contours after circularity
filtering are depicted, finally in the right image the remaining
contours after circularity and area filtering are illustrated.
Figure 5. In the left image, the original ROI is shown, the
middle image corresponds to the ROI after the contrast and
brightness adjustments, the right image illustrates the
identified bushing location

objects is computed using (3), and the image is filtered
leaving only the round objects having a circularity greater
than 0.6. The resulting set is filtered again using the area
information, leaving only four of the roundest objects having
the largest area. Once the contours are located, the regions of
interest can be extracted, as shown in Figure 6, by computing
the bounding rectangle of each contour.
D. Bushing Classification
The bushing classification problem was solved using a
Convolutional Neural Network, based on the LeNet-5
architecture, described in [27]. The proposed classifier has to
distinguish between three possible classes: correct placement
of the bushings, incorrect placement and missing bushings.
The missing bushings class was added because, once the
injection molding process begins, the bushings may fall of
from the mold, and in such a scenario the operator should be
warned such that the molding process does not lead to
product with defects. A pair of bushings are shown in Figure
7, the correct placement on the injection mold would be with
the wide flange towards the injection mold, and the narrow
flange facing out of the mold. Any other positioning would
be incorrect. The proposed classification solution works for
any color of the metal bushings (silver, golden, copper etc.).
The original LeNet architecture was built for digit
recognition and uses 6 layers. Starting from the original
design, in our implementation, we have modified the
architecture and created an 8-layer architecture for
classifying the 32x32 images of the industrial bushings. The
first layer is a Convolutional layer, with an 32x32x1 input
image and 28x28x6 output. It uses 5x5 convolution kernel
with 6 feature maps, with a stride of 1. The purpose of this
first convolutional layer is to detect basic features in the
image, like lines. All the convolutional layers use ReLu
activation function and a stride of 1. The second layer is a
Max-Pooling layer, with 2x2 window and a stride of 2. This
layer is responsible reducing the size of the feature map in
half, by selecting only those features which are dominant. A
28x28x6 input produces a 14x14x6 output. The third layer is
another Convolutional layer, with input 14x14x6 and output
10x10x16. This layer uses 5x5 convolutional kernels and 16
feature maps. This layer is responsible for learning more
complex features, like combinations of lines and basic
shapes. The fourth layer is another Max-Pooling layer, with
the same parameters as the second layer. This produces an
output of size 5x5x16 for the input size 10x10x16. The fifth
layer is the final Convolutional layer, with 5x5 kernel and 400
feature maps. This layer learns the most complex features of
the map. This layer can learn even more complex pattern than
the previous convolutional layers. The output of the fifth
layer is fed into a 3-layer fully connected neural network, that
uses ReLu activation and does the classification of the image
based on the features provided by the Convolutional and
Max-Pooling layers.
Multiple experiments have been done regarding the
architecture of the network, however, for the available
dataset, this architecture yielded the best results.
The architecture deals with overfitting by adding
regularization techniques, like dropout, at level 1 and level 3
convolutional layers. Dropout is a technique of disregarding
the values of randomly chosen neurons in order to reduce
overfitting. The network was trained on the GPU for 100
epochs using an Adam optimizer, with a learning rate of
0.0001 and no momentum. To train the neural network, it was
compulsory to create a dataset, containing images of the
bushings in different positions and scenarios. The original
dataset contained 1000 images and was augmented to
improve the training results. The following augmentation
operations were performed on the original dataset: inducing
salt-and-pepper noise, affecting 5% of the image, median
blurring with a 5x5 kernel, perspective transformation,
contrast normalization with a sampled value between 0.8 and
2.0, flipping the image vertically, flipping the image
horizontally, translation with a number of pixels, increasing
brightness with a sampled value between from the interval [1,
30], multiplying each image pixel with constant value of 1.5.
After the application of these operations, more than 8.000
images were obtained, which were split into train, validation
and test set.
E. Bushing Detection Optimization
The processes presented above are integrated inside a
unified solution, in which a sequence of frames is analyzed
in real time, and the result of classification is displayed within
each frame, warning the operator regarding the position of the
bushings. In order to improve processing and the detection
time, we take advantage of the fact that the bushing’s
displacement between consecutive frames is quite low.
Considering this assumption, we would only be required to
detect the injection mold in the first frame. This reduces the
processing time because the search for the bushings is done
in a relatively small area, without having to go through
processing steps required when their position wasn’t known
in advance. For each bushing, a new window is created that
is bigger than the original bounding box with 10 pixels on
each side. The new bounding box is made larger, in order to
accommodate possible size changes due to the mold moving
closer to the camera. A global thresholding algorithm
together with a morphological opening operation is applied
in the newly created window for each bushing location. The
displaced bushing location is extracted by computing the
contour and circularity of the biggest object in the new region
Figure 7. Silver Color Bushings. The bushing on the left has its wide
flange up and the bushing on the right has its narrow flange up
Figure 6. The four extracted regions of interest

of interest. For each window, the new position of the bushing
will be the bounding box associated to the biggest contour. In
Figure 8, we illustrate detections that are made exclusively
from previous frames.
IV. EXPERIMENTAL RESULTS
In this section we present an evaluation of the proposed
solution in terms of mold and bushings detection accuracy
and bushing classification accuracy, under different
conditions. For testing purposes, it has been accounted for
certain factors that might have a significant impact in real-
life, such as different lighting conditions, different camera
angles, different distances with respect to the injection mold.
It is also important to note that the testing samples were shot
indoors, in a relatively clean environment, without many
objects around the mold. In order to cover as many real-life
scenarios as possible, multiple sequences were taken. The
camera is located at around 1-2 m away from the mold, the
experiments have been performed fixing the camera in
different positions with respect to the mold (top, left side,
right side, straight view). The system on which we have
tested our method contains an Intel i7-7700HQ @ 2.80 GHz
processor and 16GB of RAM.
A. Evaluation of the Mold Detection
For testing the discovery rate of the mold detection
algorithm, the proposed solution was tested on 200 sequences
describing multiple scenarios. The algorithm was tested for
distances up to 2m, which is the maximum distance from the
camera, the mold would be positioned in a real-life scenario.
The proposed solution for mold detection shows very
good results, even when light is directly incident on it. The
result of the detection is 99% and it has been achieved taking
into consideration the following conditions: Natural Light,
Artificial Light, Straight View, Top View (45°), Left View
(60°), Right View (60°), different distances to the mold. The
different views refer to the positioning of the camera with
respect to the injection mold.
B. Evaluation of the Bushing Detection
The bushings in this category are detected from the
segmented region of interest, which contains the mold. In our
scenario, the injection mold can have at most four bushings
placed on it. The detection rate score for each scenario is
presented in Table I. In this testing stage, we are interested in
detecting the region of interest corresponding to each of the
four bushings. The testing of the orientation, and presence of
the bushings will be discussed in section C. In Figure 9
several detections of regions of interest are presented from
various scenarios.
It can be noticed from Table I that the bushing detection
is quite accurate in most cases. One might think that the
accuracy at 1m should be higher than the accuracy at 1.5m,
because closer objects should be easier to detect.
TABLE I. BUSHING DETECTION ACCURACY
Scenarios D <= 1m 1m < D <= 2m
Natural light 97% 95%
Artificial light 97% 99%
Straight view 94% 97%
Top view (45°) 99% 99%
Left view (60°) 96% 96%
Right view (60°) 99% 99%
In some scenarios, the accuracy at 1m is lower than the
accuracy at 2m in the case of a straight view camera angle.
This happens because of the illumination conditions
especially the natural one, which cannot be controlled.
C. Evaluation Bushing Classification
The quality and running time of the proposed neural network classifier are evaluated on multiple sequences. The results of the proposed classifier have also been compared to the results of other classifiers, like Support Vector Machine
(SVM), Decision Trees (DT), or solutions using Image Processing Techniques. The SVM classifies industrial
bushings based on features provided by the Histogram of Oriented Gradients (HOG) [28]. Using HOG, information such as the orientation of the edges of the bushings can be
captured by computing the magnitude and direction of the
gradient in points where intensity level changes abruptly. Decision trees [29] are supervised learning models that
can perform both classification and regression. In a decision
tree, each node represents a test on an attribute, and each leaf corresponds to a classification result. The outcome is computed by comparing the features of the input with the
features in each node and then going further on the appropriate branch. In our implementation, items are
classified using Haar features [30]. The other classifier uses classical Image Processing techniques (IPT), like
segmentation, morphological operations, contours finding, histogram equalization, highlighting distinctive traits of the
bushings depending on their positioning. The number of
Figure 9. Multiple detection cases for the bushing ROI
Figure 8. Bounding boxes detected using the position from
consecutive frames

bushings in each category is 600, 200 which are placed
correctly, 200 which are not placed correctly and 200 that are
missing completely. The classification accuracy for each
method can be seen in Table II. It can be observed that the
proposed implementation outperforms the other methods
qualitatively, the DT, the SVM approach and the method that
uses image processing techniques have a lower accuracy.
The main classification challenge comes from the small
dimensions of the bushing images and engineering the correct
features extractors would be a very difficult endeavor.
TABLE II. BUSHING CLASSIFICATION ACCURACY
Using the proposed method, the neural network automatically extracts the most relevant features. The running time of the proposed classifier has also been assessed. In Table III, the average running time is presented. Analyzing Table III, it can be observed that SVM is much faster, on average, than the other methods. However, for this application, where classification quality is a key point, the proposed solution is still the better option, due to its classification accuracy.
TABLE III. AVERAGE BUSHING CLASSIFICATION TIME
Methods Proposed SVM DT IPT Time (s) 0.0102 0.0009 0.8589 0.014
In Figure 10 and Figure 11 two classification scenarios are illustrated. The region of interest corresponding to a bushing is highlighted using a colored rectangle. The color of the rectangle is helpful to identify the positioning of the bushing and has the following meaning: Green-placed correctly, Blue-placed incorrectly and Red-missing. The used color code is also helpful for an operator, to easily identify the class of each positioning or absence the bushing. The results of the classification using the four classifiers can be seen in Figure 10. In the presented scenario, out of four bushings, only one is placed correctly. Only the proposed solution is able to detect correctly the positioning of all the
bushings. In Figure 11 another scenario is presented where two bushings are missing and two are placed correctly. In this scenario, the solution using the SVM and the proposed
solution are able to acurately detect the correct classes for all the items, while the other methods detect only two or three classes of the four bushings corectly. In Figure 12 a zoom in
of the bushing placement onto the mold is presented, for the scenario in Figure 10 and Figure 11. The bushings from Figure 12 are illustrated, from top down and left to right.
Scenarios Proposed SVM DT IPT
Natural light 99% 89% 86% 72%
Artificial light 99% 89% 85% 75%
Straight view 98% 89% 85% 73%
Top view (45°) 99% 92% 87% 73%
Left view (60°) 98% 90% 82% 78%
Right view (60°) 98% 86% 86% 78%
a
b
c
d
Figure 10. a) IPT b) SVM c) DT d) Proposed Solution
a
b
c
d
Figure 11. a) IPT b) SVM c) DT d) Proposed Solution

V. CONCLUSIONS AND FUTURE WORK
In this paper we have presented a solution for visually
inspecting the process of creating automotive components
through plastic injection molding in order to reduce the
number of defective products that are created. The processing
pipeline includes steps for detecting the injection mold using
various image processing methods, the regions of interest for
the bushings, that are normally added to the plastic object to
better fix the product on the vehicle, and classification of the
positioning of the bushing or their absence from the injection
mold. The implemented solution was evaluated by using a
copy of the injection mold that respects the proportions of the
original. Extensive tests have been carried out in various
lightning conditions, different distances to the mold and
using multiple angles for the positioning of the camera. The
proposed solution yielded good results for the detection and
classification tasks required. Furthermore, we have proven
the classification accuracy of the proposed classifier by
comparing it with other classifiers using various
classification features.
For future work, we plan to optimize the speed of the
whole pipeline using a GPU for most of the processing
functions and would like to improve the detection of the
injection mold by using a solution based on a combination
between the current solution and a learning-based approach.
REFERENCES
[1] C. Albano, N. Camacho, J. Reyes, J.L.Feliu and M. Hernandez,
"Influence of scrap rubber addition to Portland I concrete composites:
Destructive and non-destructive testing," Composite Structures, vol.
71, no. 3-4, pp. 439-446, 2005.
[2] H. Chandler, Hardness Testing, 2nd Edition, ASM International, 1999,
pp. 15-17.
[3] B. Duane, Liquid Penetrant Testing: Classroom Training Book, The
American Society for Nondestructive Testing, 2004, pp. 4-5.
[4] R. Halmshaw, Introduction to the Non-Destructive Testing of Welded
Joints, Woodhead Publishing, 1997, pp. 5-7.
[5] B. Raj, T. Jayakumar and M. Thavasimuthu, Practical Non-destructive
Testing, Woodhead Publishing, 2002, pp. 84-87.
[6] J. Blitz, Electrical and Magnetic Methods of Non-destructive Testing,
Springer Netherlands, 1997, pp. 44-53.
[7] V. Sankar, "Eddy Current Testing (ECT)," Rajagiri School of
Engineering & Technology (RSET).
[8] K. Shelesh-Nezhad and E. Siores, "An intelligent system for plastic
injection molding process design," Journal of Materials Processing
Technology, vol. 63, no. 1-3, pp. 458-462, 1997.
[9] Huang, S.-H., & Pan, Y.-C. (2015). Automated visual inspection in the
semiconductor industry: A survey. Computers in Industry, 66, 1–10.
[10] R. Montufar-Chaveznava, D. Guinea, M. C. Garcia-Alegre and V. M.
Preciado, "CNN computer for high-speed visual inspection,"
Proceedings of SPIE - The International Society for Optical
Engineering, vol. 4301, 4 April 2001.
[11] V. Preciado, D. Guinea and R. Montufar, "Real-time Inspection of
Metal Laminates by means of CNN's," Proceedings of SPIE - The
International Society for Optical Engineering, 01 2002.
[12] H. Akbar and A. S. Prabuwono, "Webcam Based System for Press Part
Industrial Inspection," IJCSNS International Journal of Computer
Science and Network Security, pp. 170-177, 2008.
[13] Shimizu, R., Yanagawa, S., Shimizu, T., Hamada, M., & Kuroda, T.
(2017). Convolutional neural network for industrial egg classification.
2017 International SoC Design Conference (ISOCC)
[14] M. P. Muresan, P. A. Szabo and S. Nedevschi, "Dot Matrix OCR for
Bottle Validity Inspection," 2019 IEEE 15th International Conference
on Intelligent Computer Communication and Processing (ICCP), Cluj-
Napoca, Romania, 2019, pp. 395-401
[15] Chen, Y.-F., Yang, F.-S., Su, E., & Ho, C.-C. (2019). Automatic Defect
Detection System Based on Deep Convolutional Neural Networks.
2019 International Conference on Engineering, Science, and Industrial
Applications (ICESI).
[16] Hanhirova, J., Harjuhahto, J., Harjuhahto, J., & Hirvisalo, V. (2019). A
machine learning based quality control system for power cable
manufacturing. 2019 IEEE 17th International Conference on Industrial
Informatics (INDIN)
[17] Yang, J., Fu, G., Zhu, W., Cao, Y., Cao, Y., & Yang, M. Y. (2020). A
deep learning-based surface defect inspection system using multi-scale
and channel-compressed features. IEEE Transactions on
Instrumentation and Measurement, 1–1.
[18] Chen, F.-C., & Jahanshahi, M. R. (2018). NB-CNN: Deep Learning-
Based Crack Detection Using Convolutional Neural Network and
Naïve Bayes Data Fusion. IEEE Transactions on Industrial Electronics,
65(5), 4392–4400
[19] X. Bian, S.-N. Lim and N. Zhou, "Multiscale fully convolutional
network with application to industrial inspection," in 2016 IEEE
Winter Conference on Applications of Computer Vision (WACV),
2016.
[20] S. Arikan, K. Varanasi and D. Stricker, "Surface Defect Classification
in Real-Time Using Convolutional Neural Networks," 2019.
[21] Cheon, S., Lee, H., Kim, C. O., & Lee, S. H. (2019). Convolutional
Neural Network for Wafer Surface Defect Classification and the
Detection of Unknown Defect Class. IEEE Transactions on
Semiconductor Manufacturing, 1–1.
[22] J. A. Calderon-Martinez and P. Campoy-Cervera, "An Application of
Convolutional Neural Networks for Automatic Inspection," in IEEE
Conference on Cybernetics and Intelligent Systems, Bangkok, 2006
[23] B. Sadeghi, "A BP-neural network predictor model for plastic injection
molding process," Journal of Materials Processing Technology, vol.
103, no. 3, pp. 411-416, 17 July 2000.
[24] W.-C. Chen, P.-H. Tai, M.-W. Wang, W.-J. Deng and C.-T. Chen, "A
neural network-based approach for dynamic quality prediction in a
plastic injection molding process," Expert Systems with Applications,
vol. 35, no. 3, pp. 843-849, October 2008
[25] S. Suzuki, K.A. be, Topological structural analysis of digitized binary
images by border following, Comput. Vision, Graph. Image Process.
30 (1985) 32–46.
[26] Pizer, S. M., Amburn, E. P., Austin, J. D., Cromartie, R., Geselowitz,
A., Greer, T., … Zuiderveld, K. (1987). Adaptive histogram
equalization and its variations. Computer Vision, Graphics, and Image
Processing, 39(3), 355–368.
[27] R. Montufar-Chaveznava, D. Guinea, M. C. Garcia-Alegre and V. M.
Preciado, "CNN computer for high-speed visual inspection,"
Proceedings of SPIE - The International Society for Optical
Engineering, vol. 4301, 4 April 2001
[28] N. Dalal and B. Triggs, "Histograms of oriented gradients for human
detection," 2005 IEEE Computer Society Conference on Computer
Vision and Pattern Recognition (CVPR'05), San Diego, CA, USA,
2005, pp. 886-893 vol. 1
[29] L. Rokach, O. Maimon, Decision Trees, in: Data Min. Knowl. Discov.
Handb., Springer, Boston, MA, 2005: pp. 165–192.
[30] Viola, P., & Jones, M. (n.d.). Rapid object detection using a boosted
cascade of simple features. Proceedings of the 2001 IEEE Computer
Society Conference on Computer Vision and Pattern Recognition.
CVPR 2001.
Figure 12. The top image, containing four bushings, corresponds to the scenario presented in Figure 10, and the bottom image corresponds to the one presented in Figure 11.