automatic interpretation of music structure...
TRANSCRIPT

AUTOMATIC INTERPRETATION OF MUSIC STRUCTURE ANALYSES:A VALIDATED TECHNIQUE FOR POST-HOC ESTIMATION OF THE
RATIONALE FOR AN ANNOTATION
Jordan B. L. SmithNational Institute of Advanced IndustrialScience and Technology (AIST), [email protected]
Elaine ChewQueen Mary University of [email protected]
ABSTRACT
Annotations of musical structure usually provide a low le-vel of detail: they include boundary locations and sectionlabels, but do not indicate what makes the sections similaror distinct, or what changes in the music at each boundary.For those studying annotated corpora, it would be useful toknow the rationale for each annotation, but collecting thisinformation from listeners is burdensome and difficult. Wepropose a new algorithm for estimating which musical fea-tures formed the basis for each part of an annotation. Toevaluate our approach, we use a synthetic dataset of musicclips, all designed to have ambiguous structure, that waspreviously used and validated in a psychology experiment.We find that, compared to a previous optimization-basedalgorithm, our correlation-based approach is better able topredict the rationale for an analysis. Using the best versionof our algorithm, we process examples from the SALAMIdataset and demonstrate how we can augment the struc-ture annotation data with estimated rationales, inviting newways to research and use the data.
1. INTRODUCTION
Listeners perceive structure in music, and trying to pre-dict the structures they perceive is a popular task in theMIR community [14]. Since the perception of structureis a complex phenomenon, the community focuses on asimpler, operational version: we imagine that structure,as perceived, can be characterized as a set of time pointsregarded as boundaries, and a set of labels that indicatewhich of the intervening segments repeat similar material.This simplification is not made naıvely: those who cre-ate annotations of musical structure are aware of its limita-tions, and the methodologies for annotating [1, 16, 21] andevaluating [7, 9, 11] structural analyses have become theirown important subtopics in MIR.
Still, the simplification is unfortunate because musicalsimilarity is multi-dimensional. If a listener declares that
c© Jordan B. L. Smith, Elaine Chew. Licensed under a Cre-ative Commons Attribution 4.0 International License (CC BY 4.0). Attri-bution: Jordan B. L. Smith, Elaine Chew. “Automatic interpretation ofmusic structure analyses: A validated technique for post-hoc estimationof the rationale for an annotation”, 17th International Society for MusicInformation Retrieval Conference, 2016.
two excerpts are “similar”, they could mean with respectto melody, contour, rhythm, timbre, or any combination ofthese or other musical attributes. This is in addition to theissue that structure itself is multi-dimensional; as pointedout in [16], boundaries may be perceived for reasons ofmusical similarity, musical function, or instrumentation.
Thus, in the transition from structure perception to struc-ture annotation, we usually fail to capture why a listenerhas included a boundary or chosen a label. This infor-mation, if preserved (or reconstructed), would help us tounderstand the content of the annotations, and could leadto fairer evaluations of structure segmentation algorithms.It would also provide more meaningful data to analyze inmusicology or music perception research.
How feasible is it to collect this information? As wefound in [23], to transcribe the rationale for every aspectof an annotation is difficult and requires prolonged self-interrogation. Even before that, it is difficult to decide whatinformation to collect, and how to collect it: should thedata be collected after a listener has provided the segmen-tation, in the manner of music perception experiments [2]?Or should each piece be annotated several times, each timewith a focus on a single feature [19]? No matter how it isdone, collecting this information is burdensome.
A more practical possibility is to estimate this informa-tion automatically from existing annotations, which wasour motivation in [22]. Our algorithm compared self-dis-tance matrices (SDMs) for different features to the groundtruth annotation, and found which parts of the feature-basedSDMs best re-created the annotation-based SDM. While[22] presented some examples to demonstrate the plausi-bility of the approach, we offered no experimental valida-tion.
Validation requires paired responses: a set of listeners’analyses, and the listeners’ justifications for each analysis.Producing this data is time-consuming and burdensome forthe reasons described above. However, we recently pro-duced data suited to this purpose for a music perceptionstudy [20]. The goal of that study was to determine whatrole attention plays in the perception of structure.
In this article, we make three main contributions: first,we test whether the approach described in [22] can effec-tively predict the attention of the listeners, based on thedataset created for [20]. Second, we explain some short-
435

comings of the previous approach, and suggest and testtwo improvements. Third, we demonstrate how the val-idated algorithm can be used to analyze and to augmentreal-world data with new information layers.
The next two sections recap the studies on which thisarticle builds. In Section 2, we briefly recall [22]’s algo-rithm, point out some shortcomings, and introduce a re-fined approach. In Section 3, we summarize the results ofthe experiment in [20], and describe in more detail the datadeveloped for that study and used in this one. In Sections4 and 5, we outline the validation experiment and discussthe results, and in Section 6 we use the algorithm to createnew information layers for examples from SALAMI [21].We close with a few observations on the limitations of thepresent work and recommendations for future research.
2. AN ALGORITHM FOR ESTIMATINGFEATURE RELEVANCE
In [22] we estimated the relevance of musical features to alistener’s analysis section-by-section by finding the weigh-ted sum of feature-derived SDMs that best matched theanalysis. The analysis is represented as a binary SDM,expanded to the same timescale as the feature SDMs. Anumber n of feature matrices are computed; from each, wederive m single-section SDMs by taking only the rows andcolumns associated with that single segment, as defined bythe annotation. (This row and column selection is done bymultiplying the SDM with a segment mask.) This givesn · m component matrices. A quadratic program (QP) isused to find the weights for these components whose sumoptimally reproduces the annotation-derived SDM; theseweights, the reconstruction coefficients, are taken to indi-cate feature relevance.
The method is illustrated in Fig. 1. The sound exam-ple has the form ABAB with respect to harmony, AABBwith respect to rhythm, and ABBA with respect to tim-bre. If a listener gives the analysis ABAB, segmenting theaudio at the 1/4, 2/4 and 3/4 marks, we obtain the four seg-ment masks given in the top row. We compute four audiofeatures, each related to a different musical attribute (seeSection 4.1 for details), which are pointwise multiplied bythe masks to give 8 potential components. The QP findsthe optimal combination of components to reproduce theannotation in the top-left corner, and gives the coefficientsshown above each component. In this case, the algorithmhas successfully identified that bass chroma is the featurethat best justifies the analysis.
2.1 Algorithm Improvements
One limitation of this approach is that none of the featurematrices may properly reflect the homogeneity of a givensection. We could include additional SDMs that have beensmoothed at different timescales (as demonstrated in [22]),but the smoothing can blur the boundaries between sec-tions even as they make the sections more homogeneous.We could use stripe-based instead of block-based masksin order to capture repetitions of feature sequences, but in
Figure 1. Illustration of component-building for QP al-gorithm. Four beat-indexed feature matrices (at left) aremultiplied by the masks (top) given by the segmentation,which here is ABAB. The number above each componentis the QP’s estimate of the component’s importance.
non-square blocks (which occur whenever two segmentshave unequal lengths), it is not easy to guess the best ori-entation or placement of the stripes.
A second problem is that it is unclear how to inter-pret some aspects of the QP. Should the individual recon-struction coefficients, or their sum, be bounded? Leavingthem unbounded can lead to unconstrained solutions, butif bounds are imposed, how should they be interpreted?
A third problem is that by finding the single optimalsum of matrix components, some good explanations maybe ignored. For example, if there are two matrix compo-nents which both justify a particular part of the analysis,the QP may find that only one is necessary. Thus, we can-not conclude that features omitted from the solution arenecessarily irrelevant, which is a big limitation.
For the first problem, we propose that instead of usingthe original SDMs, with all their heterogeneities, we re-duce them to segment-indexed SDMs, a common practicesince [4]. Similar to [13], we may take the distance be-tween each pair of segments to be the average distance ofall the pixels in the submatrix over which the segments in-tersect. The segment-indexed SDM can then be analyzedwith the QP as before, although with a substantial reduc-tion in complexity.
A second way to address the problem is to use a diago-nal stripe-based mask instead of a block-based mask. Sincethe diagonals are the most salient portions of the SDM,it makes sense to focus on reconstructing this portion ofthe SDM. Emphasizing stripes is a common SDM analy-sis technique, and a comparison of block and stripe fea-tures found that when boundaries were given, stripe fea-
436 Proceedings of the 18th ISMIR Conference, Suzhou, China, October 23-27, 2017

Figure 2. Illustration of proposed segment-indexed ap-proach, with both QP- and correlation-based estimates offeature relevance.
tures were more effective [12]. We remember the caveatabove, that repeated segments with different durations posea problem for creating a stripe-based mask, but we can stilltest it in cases where this is not an issue.
A third proposal, which addresses the second and thirdproblems above, is to dispense with the QP altogether andsimply take the element-wise Pearson correlation betweenthe feature-derived and annotation-derived matrices. (Thesame section-by-section method still applies.) Correlationsare perhaps more intuitive than QPs and reconstruction co-efficients, and using them would permit second-place fea-tures to be more readily identified in the solution.
Fig. 2 shows the output for an example of a three-partstimulus, using the suggested improvement of segment-indexing: the features have been averaged over the blocksgiven by the segmentation. The sum of the reconstructioncoefficients obtained using the QP method are given in the“QP sum” column, and the mean point-wise correlation be-tween the masked regions is shown in the “Mean corr.”column. Fig. 3 shows the output for the same example butusing the stripe-based mask. The mask is constructed bydrawing a diagonal line across each block of the originalbeat-indexed SDM, and then applying a 2D convolutionwith a Gaussian kernel of width 5 beats.
To sum up, we suggest three improvements to the algo-rithm: (1) using the correlation between submatrices, in-stead of QP, to estimate their relevance; (2) using a segment-indexed version of the SDM; and (3) applying a stripe maskto the SDM, instead of using the blocks.
3. A DATASET OF VALIDATED ANALYSES
Researchers in music psychology, like those in MIR, areinvested in modeling how listeners perceive structure. (Forone discussion, see [15].) The goal of [20] was to de-termine whether listeners could be influenced to perceive
Figure 3. Illustration of proposed stripe approach with cor-relation. Like in Fig. 2, QP coefficients are in the middlecolumn, correlations on the right.
different structures by manipulating the musical feature towhich they paid attention. In order to test this, we com-posed a set of artificial musical stimuli in which four dif-ferent features (harmony, melody, rhythm and timbre) weresystematically changed at different times, creating musicalpassages with ambiguous forms. These four features werechosen because they figured most prominently in studieswhere listeners were asked to justify why they perceived agiven boundary, such as [2].
The three-part stimuli had two potential structures, AABor ABB, with different features changing at different times.For example, the passage in Fig. 4a has form AAB with re-spect to harmony, and form ABB with respect to melody.The four-part stimuli had three potential structures, AABB,ABAB or ABBA, so that at every boundary there weretwo features that changed. For example, in the passagein Fig. 4d, the rhythm and harmony both change after thesecond measure.
As stated above, validating the algorithm requires musi-cal examples where listeners’ analyses are paired with theirjustifications—i.e., with the musical attributes to which theywere paying attention. Many datasets of structural analy-ses exist, but none indicate which musical attributes justifythe analyses. Also, in typical pieces of music, attributeschange frequently, to different extents, and often simulta-neously. To validate this algorithm we should use musicwith known, controlled changes. Hence, artificial stimulisuch as these are valuable resources to validate the algo-rithm: each passage contains precise change points relatedto known musical attributes; and the link between the at-tributes and the different forms has been affirmed by lis-teners in an experimental setting.
More artificial stimuli could be generated and testedin future work; this may be a convenient way to providedeep-learning algorithms with the quantity of labelled data
Proceedings of the 18th ISMIR Conference, Suzhou, China, October 23-27, 2017 437

(a)
2
!! !! !!!! !! !!"" "
"""!
" " " " " " #3
3
33
"$ !"
""$ !"
%& "
"""
"""
"$
" " #
!! !!!! !!
!! !!!! !! !!
!!"""""""" #""
!$"
!"!$" """
!$"
""""#"
!$"
"""
"#""'%
Organ
"""'& "
""""" """"
$"
""""$ !"
"" #""""" !"' " "("
"" #""""" !"' " "("
#"""""" " " "#"'& " """
#"""""" " " "#"'& " """
$ !$ ! """""
"Organ
% '
$ !$ ! """""
"Harpsichord
% '
!!$ !$ ! """""
"Piano
% '
!!!$$ ! """"""Piano
% ' ) )"" #""""' " """
Music engraving by LilyPond 2.18.2—www.lilypond.org
(b)
Harmony/Timbre and Melody/Rhythm
! !! !! ! !Melody A / Rhythm A
!" !3
3
3
! ! #! ! ! ! ! #$ ! ! ! !!!Melody A / Rhythm B
!!! ! !!Melody B / Rhythm B! ! ! !
333
! ! ! !! ! ! !" #!Melody B / Rhythm A ! ! ! #! !% $
!Organ
& ' !!!Harmony A / Timbre A
& ' !!!$ & '
Harmony B / Timbre B
Harpsichord
% & ' !!! & ' !!!Harmony A / Timbre B
Harpsichord
& ' !!!! & ' !!
!Harmony B / Timbre A
Organ
! & ' !!!
!!!! !!!!!!! !!!! !!! !!!!!!!! !!!! !!!! !!!!% !!!! !(!!!
(!(!(!(
! ! !!!! ! !
!!!'&
! !!!! #!!3
3
3& &! !'
!!!
!!!!$% '
$" !!!
Organ
! # !
!!!!
!& '!
!
!! !!!!!!
!'&! !!!
3 3 3
#!!!!
'&!!
'&! !!!"
% !!!
!'&! !#!!!
!!!
'' '''' '' ''
''! !!!!!! #!!
'&!
!!!!#
3
3
3&! !!'
!!'
!!!$% !!!$" !
&!
&! !!'
! !!!!
'' '''' '' ''
'''' '''' ''!!!
!!!!! #!!
''&! !
'&! !!!
'&!
Harpsichord
!!!!#!
'&!
!!!
!#!!$%
Organ
!!!$" !
!!!!! !!!!
&!
!!!
!& '!
'' '''' '' !
& 'Organ
! # !!!!
! !!&
3
3
! ! ! !! ! ! !!
" $% $ '!
!& '!
!! !!!!
(c)
Harmony/Timbre and Melody/Rhythm
! !! !! ! !Melody A / Rhythm A
!" !3
3
3
! ! #! ! ! ! ! #$ ! ! ! !!!Melody A / Rhythm B
!!! ! !!Melody B / Rhythm B! ! ! !
333
! ! ! !! ! ! !" #!Melody B / Rhythm A ! ! ! #! !% $
!Organ
& ' !!!Harmony A / Timbre A
& ' !!!$ & '
Harmony B / Timbre B
Harpsichord
% & ' !!! & ' !!!Harmony A / Timbre B
Harpsichord
& ' !!!! & ' !!
!Harmony B / Timbre A
Organ
! & ' !!!
!!!! !!!!!!! !!!! !!! !!!!!!!! !!!! !!!! !!!!% !!!! !(!!!
(!(!(!(
! ! !!!! ! !
!!!'&
! !!!! #!!3
3
3& &! !'
!!!
!!!!$% '
$" !!!
Organ
! # !
!!!!
!& '!
!
!! !!!!!!
!'&! !!!
3 3 3
#!!!!
'&!!
'&! !!!"
% !!!
!'&! !#!!!
!!!
'' '''' '' ''
''! !!!!!! #!!
'&!
!!!!#
3
3
3&! !!'
!!'
!!!$% !!!$" !
&!
&! !!'
! !!!!
'''''' '' '' ''
'' '' '' ''!!! !&!
!!!
#!!!!'&! !!!
'3 3 3
!!!#!!
' &!
Harpsichord
!!!! #!!
' &!
!!!!
$%Organ
!!!$" !
&!
!! !!!!!!
'&!!!
'!!
'' '''' '' !
& 'Organ
! # !!!!
! !!&
3
3
! ! ! !! ! ! !!
" $% $ '!
!& '!
!! !!!!
(d)
Figure 4. (a) Example stimulus with harmonic form AABand melodic form ABB. (b) Harmonic form AAB, timbralform ABB. (c) Rhythmic form AAB, timbral form ABB.(d) Example four-part stimulis with melodic form AABB,rhythmic form ABAB, and harmonic form ABBA.
they require. However, it is not as simple as sonifying asymbolic score, since scores must be annotated in order toknow the perceived structure and the musical features thatmotivate that analysis. The stimuli in our study are rare inthat they were (1) composed so that musical features var-ied systematically, and (2) used in a listening experimentto validate that the intended structures were perceived, forthe intended reason.
3.1 Stimulus Details
For [20], we composed three sets of stimuli. Each stim-ulus contains two voices, and in each set of stimuli, eachvoice potentially expresses changes in two different fea-tures. The examples in Fig. 4 are from the “HT-MR” set,where one voice expresses changes in harmony and timbre,and the other, changes in melody and rhythm. “HM-RT”and “HR-MT” sets were also composed.
Since in each set of stimuli, certain features are “con-volved,” some incorrect answers are less wrong than oth-ers. For instance, the feature that changes at the secondboundary of the example in Fig. 4c is rhythm, but if an al-gorithm said that the boundary was justified by melody, itwould be partially right.
The stems for the stimuli were composed using a Dig-ital Audio Workstation with standard instrument patches.The 8 stems for each set were systematically recombinedto generate 192 three-part stimuli and 384 four-part stim-uli, for a total of 1728 stimuli among all sets. Efforts weremade to keep constant all musical features other than har-
mony, melody, rhythm and timbre: the tempo of all stimuliis 140 bpm, and the loudness of each voice and each pas-sage is approximately equal. The stimuli are now freelyavailable on Github. 1
4. EXPERIMENT
4.1 Features
The stimuli manipulated four different musical attributes(in three environments): harmony, melody, rhythm andtimbre. We want to extract audio features that match eachof these attributes independently. Each audio feature shouldchange when the related musical feature changes, and berobust to changes in other musical features. We selectedtwo audio features for each musical feature, all availableas Vamp plugins 2 and listed in Tab. 1. We used groundtruth beat locations, and median feature values were takenfor each beat. Each dimension was normalized (indepen-dently for each stimulus) to zero mean, unit variance. Allfeatures were extracted using Sonic Annotator [3] usingthe default settings. For some features, we performed ad-ditional processing:
Chords: Chord labels were estimated from Chordinoand reconverted back to a chroma-like representation. Thisfeature is thus based on the same information as bass chro-ma, but refined with the chord-estimation algorithm.
Melody: The chroma of the estimated melody, and theinterval between the current steady-state note and the pre-vious one, each a 12-dimensional feature per frame. Wealso used the register of the melody: low, middle or high.
Autocorrelation: this was computed on an onset detec-tion function with a sliding window.
Low level features: a concatenation of loudness, RMSamplitude, rolloff, sharpness, smoothness, tristimulus, zero-crossing rate, and the centroid, kurtosis, skewness, andslope of the spectrum.
Feature Vamp plugins used to obtain feature
HarmonyBass chroma, from Chordino and NNLSChroma plugin [8]Chord notes [8]
MelodyTreble chroma [8]Melody, based on MELODIA [18]
RhythmCyclic tempogram [6]Autocorrelation, based on UAPlugins’sNote Onset Detector [17]
TimbreMFCCs (2nd to 13th), from Chris Cannamand Jamie Bullock’s LibXtract libraryLow level features, a set of fifteen one-di-mensional descriptors from LibXtract
Table 1. List of features chosen, and Vamp plugins used toobtain them
1 https://github.com/jblsmith/music-structure-stimuli.
2 vamp-plugins.org
438 Proceedings of the 18th ISMIR Conference, Suzhou, China, October 23-27, 2017

4.2 Results
We applied the algorithms, discussed in Section 2, on thestimuli discussed in Section 3. For each three-part stimu-lus, we ran the algorithms twice: once with analysis AAB,once with ABB. Likewise, we ran the algorithm thrice oneach four-part stimulus to find the best justifications forforms AABB, ABAB and ABBA. Each algorithm takesone of these analyses as input. The output of each algo-rithm is a matrix of feature relevance values xi,j : one persection i, per feature j. The importance of feature j is thesum across all the sections: sj =
∑i xi,j . The importance
of each musical attribute a is the sum of the two values sjrelated to that feature: ya = sa1 + sa2. We end up withfour values ya.
We test whether the maximum value correctly predictsthe feature related to the analysis with argmaxa ya. Thefraction of trials with correct guesses is the accuracy. Eachtrial has one focal pattern and three potential wrong an-swers, so the random baseline performance is 25%.
The five algorithm options were: whether to use cosineor Euclidean distance (in either case, the values were re-scaled between 0 and 1); whether to compute beat-indexedor segment-indexed SDMs; whether to apply stripe-basedmasks to the SDMs; whether to use the QP or correlation-based approach; and finally, if using QP, what constraintto use. We tested three constraints: (a)
∑i,j xi,j = C
(the sum of the coefficients over the entire piece has afixed value); (b)
∑j xi,j = C (the sum of the coefficients
for each section in the piece has a fixed value); and (c)0 ≤ xi,j ≤ 1. These options were tested in a full-factorialdesign, replicated across three variables that were not partof the algorithm: the relevant feature; the music environ-ment; and the stimulus length (3 or 4 sections).
We fit a linear model to the results and used ANOVAto interpret the eight factors. With 268,512 trials, threefactors were insignificant (p > 0.05): stimulus length,distance metric, and QP constraint. The other five fac-tors all had p < 0.0001, and main effect plots for eachare shown in Fig. 5. They show that performance variedgreatly among the music examples and features. However,the three proposed changes to the original algorithm—usingcorrelation instead of QP, using stripe masks, and usingsegment-indexed SDMs—all saw improvements, albeit aminor one in the case of segment indexing.
Tab. 2 gives the accuracy for different parameter set-tings. It shows that although the main effects appear mod-est in Fig. 5, their impact is additive: the original approachachieved 47% accuracy, and the three changes (using cor-relation, segment-indexing, and applying a stripe mask) to-gether raised the accuracy to nearly 70%.
These are the accuracies for choosing the most correctanswer, but not all errors are equally bad: guessing a fea-ture that was convolved in the stimulus with the correct oneis sometimes a fair mistake. However, Tab. 2 shows that the“convolved-with-correct” answer was not given any spe-cial weight by the algorithms. There are 3 features besidesthe correct one, so the chance of randomly guessing theconvolved feature is 33%. In all cases, fewer than a third
Figure 5. Main effect of significant factors on accuracy(i.e., rate of correct guesses).
Method: Quad. Prog. CorrelationSettings: Correct Conv. Correct Conv.Regular 47.1 13.7 52.3 12.8
Seg.-indexing 46.9 16.3 60.6 8.9Stripe mask 52.4 13.5 62.4 11.9
Seg. and stripes 59.6 12.8 69.6 7.2
Table 2. Comparison of QP-based and correlation-basedalgorithms. Columns indicate how often the guessed fea-ture was correct (“Correct”) or convolved with the correctfeature (“Conv.”). For example, in the HT-MR environ-ment, if the correct feature for a trial is timbre, guessingharmony could be half-right.
of the incorrect answers related to the convolved feature.Prediction accuracy varied greatly among the features,
as can be seen in the confusion matrices for the algorithms.Three are shown in Fig. 6, one for each music environment.These are the results for the best-performing algorithm.For harmony, we can observe that chord notes were moreeffective than bass chroma, the feature from which theyderive. Bass chroma were especially misled in the HM-RT setting, possibly due to the difference in bass drum be-tween the two timbre settings. With melody, it was also thecase that the 2nd-order feature (the estimated predominantpitch and interval) was better than the lower-level feature(treble chroma).
5. DISCUSSION
The results validate the algorithm proposed in [22]. How-ever, they also show that a simpler correlation-based ap-proach is better at predicting how best to justify an anal-ysis: it outperformed the QP approach by roughly 10%.Two other refinements, the stripe-based mask and the seg-ment indexing, increased accuracy by roughly another 10%.
However, the confusion matrices revealed great dispar-ities between the features we chose to use: some, such asChordino, were effective; others, such as the tempogramand MFCCs, were often wrong. Arguably, it is naıve for usto presume that off-the-shelf features can detect the typesof musical changes we created in the stimuli. Perhaps itis no accident that the four features we tweaked or assem-
Proceedings of the 18th ISMIR Conference, Suzhou, China, October 23-27, 2017 439
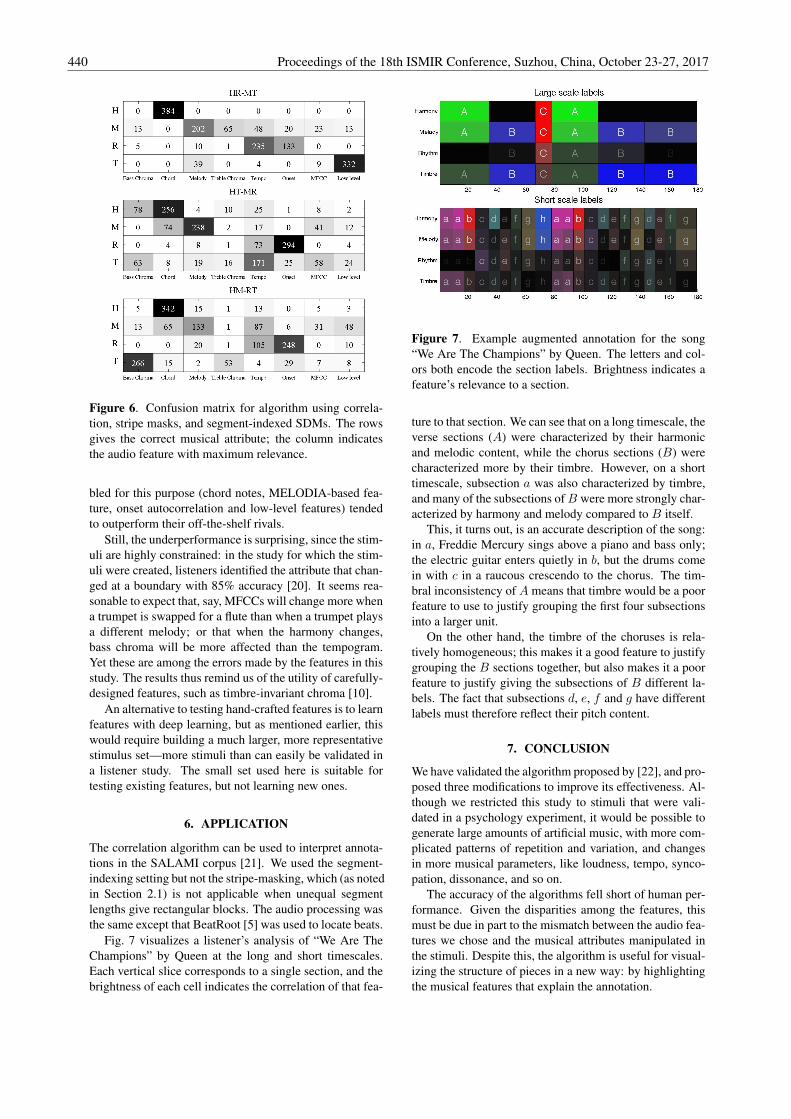
Figure 6. Confusion matrix for algorithm using correla-tion, stripe masks, and segment-indexed SDMs. The rowsgives the correct musical attribute; the column indicatesthe audio feature with maximum relevance.
bled for this purpose (chord notes, MELODIA-based fea-ture, onset autocorrelation and low-level features) tendedto outperform their off-the-shelf rivals.
Still, the underperformance is surprising, since the stim-uli are highly constrained: in the study for which the stim-uli were created, listeners identified the attribute that chan-ged at a boundary with 85% accuracy [20]. It seems rea-sonable to expect that, say, MFCCs will change more whena trumpet is swapped for a flute than when a trumpet playsa different melody; or that when the harmony changes,bass chroma will be more affected than the tempogram.Yet these are among the errors made by the features in thisstudy. The results thus remind us of the utility of carefully-designed features, such as timbre-invariant chroma [10].
An alternative to testing hand-crafted features is to learnfeatures with deep learning, but as mentioned earlier, thiswould require building a much larger, more representativestimulus set—more stimuli than can easily be validated ina listener study. The small set used here is suitable fortesting existing features, but not learning new ones.
6. APPLICATION
The correlation algorithm can be used to interpret annota-tions in the SALAMI corpus [21]. We used the segment-indexing setting but not the stripe-masking, which (as notedin Section 2.1) is not applicable when unequal segmentlengths give rectangular blocks. The audio processing wasthe same except that BeatRoot [5] was used to locate beats.
Fig. 7 visualizes a listener’s analysis of “We Are TheChampions” by Queen at the long and short timescales.Each vertical slice corresponds to a single section, and thebrightness of each cell indicates the correlation of that fea-
Figure 7. Example augmented annotation for the song“We Are The Champions” by Queen. The letters and col-ors both encode the section labels. Brightness indicates afeature’s relevance to a section.
ture to that section. We can see that on a long timescale, theverse sections (A) were characterized by their harmonicand melodic content, while the chorus sections (B) werecharacterized more by their timbre. However, on a shorttimescale, subsection a was also characterized by timbre,and many of the subsections of B were more strongly char-acterized by harmony and melody compared to B itself.
This, it turns out, is an accurate description of the song:in a, Freddie Mercury sings above a piano and bass only;the electric guitar enters quietly in b, but the drums comein with c in a raucous crescendo to the chorus. The tim-bral inconsistency of A means that timbre would be a poorfeature to use to justify grouping the first four subsectionsinto a larger unit.
On the other hand, the timbre of the choruses is rela-tively homogeneous; this makes it a good feature to justifygrouping the B sections together, but also makes it a poorfeature to justify giving the subsections of B different la-bels. The fact that subsections d, e, f and g have differentlabels must therefore reflect their pitch content.
7. CONCLUSION
We have validated the algorithm proposed by [22], and pro-posed three modifications to improve its effectiveness. Al-though we restricted this study to stimuli that were vali-dated in a psychology experiment, it would be possible togenerate large amounts of artificial music, with more com-plicated patterns of repetition and variation, and changesin more musical parameters, like loudness, tempo, synco-pation, dissonance, and so on.
The accuracy of the algorithms fell short of human per-formance. Given the disparities among the features, thismust be due in part to the mismatch between the audio fea-tures we chose and the musical attributes manipulated inthe stimuli. Despite this, the algorithm is useful for visual-izing the structure of pieces in a new way: by highlightingthe musical features that explain the annotation.
440 Proceedings of the 18th ISMIR Conference, Suzhou, China, October 23-27, 2017

8. REFERENCES
[1] Frederic Bimbot, Emmanuel Deruty, Gabriel Sargent,and Emmanuel Vincent. Semiotic structure labeling ofmusic pieces: Concepts, methods and annotation con-ventions. In Proceedings of ISMIR, pages 235–240,Porto, Portugal, 2012.
[2] Michael Bruderer, Martin McKinney, and ArminKohlrausch. The perception of structural boundariesin melody lines of Western popular music. Musicæ-Scientæ, 13(2):273–313, 2009.
[3] Chris Cannam, Michael O. Jewell, Christophe Rhodes,Mark Sandler, and Mark d’Inverno. Linked data andyou: Bringing music research software into the seman-tic web. Journal of New Music Research, 39(4):313–325, 2010.
[4] Matthew Cooper and Jonathan Foote. Summarizingpopular music via structural similarity analysis. In Pro-ceedings of the IEEE Workshop on Applications ofSignal Processing to Audio and Acoustics (WASPAA),pages 127–30, New Paltz, NY, United States, 2003.
[5] Simon Dixon. Automatic extraction of tempo and beatfrom expressive performances. Journal of New MusicResearch, 30(1):39–58, 2001.
[6] Peter Grosche, Meinard Muller, and Frank Kurth.Cyclic tempogram - a mid-level tempo representationfor music signals. In Proceedings of the IEEE Inter-national Conference on Acoustics, Speech and SignalProcessing, Dallas, TX, USA, 2010.
[7] Hanna Lukashevich. Towards quantitative measures ofevaluating song segmentation. In Proceedings of IS-MIR, pages 375–380, Philadelphia, PA, USA, 2008.
[8] Matthias Mauch and Simon Dixon. Approximate notetranscription for the improved identification of diffi-cult chords. In Proceedings of ISMIR, pages 135–140,Utrecht, Netherlands, 2010.
[9] Brian McFee, Oriol Nieto, and Juan Pablo Bello. Hier-archical evaluation of segment boundary detection. InProceedings of ISMIR, Malaga, Spain, 2015.
[10] Meinard Muller and Sebastian Ewert. Towards timbre-invariant audio features for harmony-based music.IEEE Transactions on Audio, Speech, and LanguageProcessing, 18(3):649–662, 2010.
[11] Oriol Nieto, Morwaread Farbood, Tristan Jehan, andJuan Pablo Bello. Perceptual analysis of the f -measureto evaluate section boundaries in music. In Proceedingsof ISMIR, Taipei, Taiwan, 2014.
[12] Jouni Paulus and Anssi Klapuri. Acoustic featuresfor music piece structure analysis. In Proceedings ofthe International Conference on Digital Audio Effects(DAFx), pages 309–312, Espoo, Finland, 2008.
[13] Jouni Paulus and Anssi Klapuri. Music structure anal-ysis using a probabilistic fitness measure and a greedysearch algorithm. IEEE Transactions on Audio, Speech& Language Processing, 17(6):1159–1170, 2009.
[14] Jouni Paulus, Meinard Muller, and Anssi Klapuri.Audio-based music structure analysis. In Proceedingsof ISMIR, pages 625–636, Utrecht, The Netherlands,2010.
[15] Marcus T. Pearce, Daniel Mullensiefen, and Geraint A.Wiggins. The role of expectation and probabilisticlearning in auditory boundary perception: A modelcomparison. Perception, 39:1367–1391, 2010.
[16] Geoffroy Peeters and Emmanuel Deruty. Is musicstructure annotation multi-dimensional? A proposalfor robust local music annotation. In Proceedings ofthe International Workshop on Learning the Semanticsof Audio Signals, pages 75–90, Graz, Austria, 2009.
[17] Antonio Pertusa and Jose Manuel Inesta. Note on-set detection using one semitone filter-bank for mirex2009. In MIREX Audio Onset Detection, Kobe, Japan,2009.
[18] Justin Salamon and Emilia Gomez. Melody extrac-tion from polyphonic music signals using pitch contourcharacteristics. IEEE Transactions on Audio, Speechand Language Processing, 20:1759–1770, 2012.
[19] Chris Sanden, Chad R. Befus, and John Z. Zhang.A perceptual study on music segmentation andgenre classification. Journal of New Music Research,41(3):277–293, 2012.
[20] Jordan B. L. Smith. Explaining listener differences inthe perception of musical structure. September 2014.
[21] Jordan B. L. Smith, J. Ashley Burgoyne, Ichiro Fuji-naga, David De Roure, and J. Stephen Downie. De-sign and creation of a large-scale database of structuralannotations. In Proceedings of ISMIR, pages 555–560,Miami, FL, United States, 2011.
[22] Jordan B. L. Smith and Elaine Chew. Using QuadraticProgramming to estimate feature relevance in struc-tural analyses of music. In Proceedings of the ACMInternational Conference on Multimedia, pages 113–122, Barcelona, Spain, 2013.
[23] Jordan B. L. Smith, Isaac Schankler, and Elaine Chew.Listening as a creative act: Meaningful differencesin structural annotations of improvised performances.Music Theory Online, 20(3), 2014.
Proceedings of the 18th ISMIR Conference, Suzhou, China, October 23-27, 2017 441