automatic image orientation - courses project report fall 2009 automatic image orientation ......
TRANSCRIPT

Aleksey Trofimov
CMPS 242 Machine Learning
Final Project Report Fall 2009
Automatic Image Orientation
Table of Contents
Abstract ......................................................................................................................................................... 2
Problem ......................................................................................................................................................... 2
Features ........................................................................................................................................................ 2
Spatial Pyramid ......................................................................................................................................... 2
Haar Features ............................................................................................................................................ 3
Edge Direction Features ............................................................................................................................ 3
Color Presence Features ........................................................................................................................... 4
Simplified (0s and 1s) Features ................................................................................................................. 5
Algorithms ..................................................................................................................................................... 5
Perceptron ................................................................................................................................................ 5
Logistic Regression .................................................................................................................................... 5
Adaptive Boosting ..................................................................................................................................... 6
Experiments .................................................................................................................................................. 6
Choice of dataset ...................................................................................................................................... 6
2-Step Classifier VS. Ranking ..................................................................................................................... 6
Results ....................................................................................................................................................... 6
Just-For-Fun-Test .................................................................................................................................... 11
Conclusion ................................................................................................................................................... 12
Future Work ................................................................................................................................................ 12
References .................................................................................................................................................. 13

Abstract
Cheap digital recording devices do not have sensors that orient images to landscape and portrait
orientations. To compensate for that I propose an algorithm that is able to rotate the images to correct
orientation after the fact. The proposed algorithm uses machine learning algorithms to learn orientation
using simple features like color presence, edge directions and lighting. The machine learning algorithms
used include Adaptive Boosting, Logistic Regression and Perceptron. First all the images are rotated ±90
degrees. For each orientation algorithms are trained to classify images as landscape versus portrait.
Orientations with strongest prediction as being correct are chosen as the final predictions.
Problem
Low –end digital cameras, ultra-compact digital cameras, scanned photos, most cell-phone photos and
other image-taking devices usually lack orientation detectors. This prevents correct image orientation
where the up direction in the image corresponds to the up direction when the image was taken. High-
end digital cameras have a sensor that senses orientation, so they can either rotate the image at the
time of the capture or label it with proper orientation. In all other cases, images tend to be oriented
manually on a one-by-one basis. Even some of the best consumer-available software at best allows
multiple-image selection for manual orientation, but not much more.
In a practical setting, manually rotating images can be difficult when a large portion of them are not
oriented correctly. A better approach is needed. In this paper I propose using machine learning
algorithms to orient images. Image recognition can be a hard task in general case, especially in multi-
class classification setting, but image orientation only has three classes (-90, 0 and 90 degrees), so it is
possible to get good results with relatively simple algorithms by extracting the right features.
Features
As always with machine learning, appropriate features must be defined. In this paper I tried three sets of
features that in my opinion could be correlated with image orientation. I looked at my own image
collection and noticed certain patterns like that sky is brighter than the ground, most images have a
horizon line, shades of red usually occur toward the bottom of the image and etc.
Spatial Pyramid
First of all, I noticed that for a lot of the images features are located around the edges. So features have
to be collected on the edges. Also, for the most part, the size of the images did not matter. I could just
as easily orient images looking at them full-screen as well as in tiny thumbnails. I ended up breaking up
the images into parts (cells) as a square grid. But, what size of the grid is optimal? Why not pick some
and all smaller ones? Trying larger grids produces exponentially larger feature vectors. Grids that are
powers of 2 smaller are linear combinations of larger grids. For example summing up some features in a
64x64 grid produces the same result as computing a 32x32 grid. For this project I used an 8x8 grid and
summed it up to a 4x4, 2x2 and 1x1.
Haar Features
One of the most obvious features that can be noticed come from the differences in lighting. Viola &
Jones describe -Haar features which accomplish just that - notice lighting changes. Haar features work
well for detecting faces, so they might work for image orientation as well. They should be able to pick up
that images usually have the sky brighter than the ground.
Haar features take the grayscale of the image and then, take some number of regions in the gray scaled
image and compare the sum of the pixels. One of the features is [1, 0]’ so if the region above sums up to
a larger number than the bottom, then this feature is 1. For two left-most cells in a 2x2 grid, applying
this feature will yield a 1 if the top is brighter and 0 otherwise. Actually I compute the difference in the
sum of the pixels divided by the number of pixels, so the feature is the difference in brightness between
the average pixels. I do this so that the size of the cell does not matter. The values for these features
range from -255 to +255.
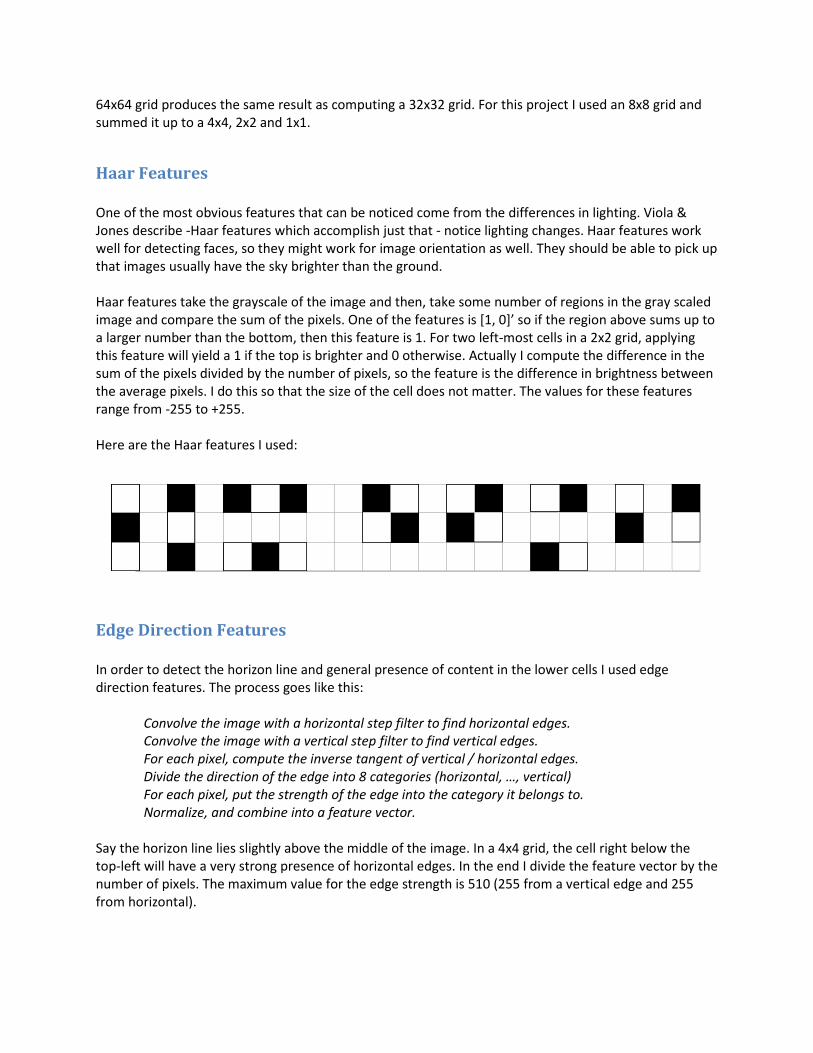
Here are the Haar features I used:
Edge Direction Features
In order to detect the horizon line and general presence of content in the lower cells I used edge
direction features. The process goes like this:
Convolve the image with a horizontal step filter to find horizontal edges.
Convolve the image with a vertical step filter to find vertical edges.
For each pixel, compute the inverse tangent of vertical / horizontal edges.
Divide the direction of the edge into 8 categories (horizontal, …, vertical)
For each pixel, put the strength of the edge into the category it belongs to.
Normalize, and combine into a feature vector.
Say the horizon line lies slightly above the middle of the image. In a 4x4 grid, the cell right below the
top-left will have a very strong presence of horizontal edges. In the end I divide the feature vector by the
number of pixels. The maximum value for the edge strength is 510 (255 from a vertical edge and 255
from horizontal).

Usually edges are taken from grayscale images, but I noticed that it is very sensitive to shadows, which
are not technically features. To counter-act that, I did the following.
Brightened each pixel until one of the color channels reached 255
For each channel, including grayscale I found the edges
The final edge image was a combination of the above
Here is an example:
You can notice that the combined edges is much more representative of what is actually in the image
compared to just taking edges from the grayscale.
Color Presence Features
I looked through my photos, and at least for photos taken outside, I noticed that there was a blue sky.
The sky is always on the top of the correctly oriented photo, so I thought that presence of blue in the
top could be a great feature. In order to extract color information I did the following:
Brighten each pixel until one of the channels hit 255
Reduce the color depth to 6 bits (Divide each RGB channel by 64)
For each cell sum up the number of pixels for each color
Normalize and append into the feature vector
I tried doing 3-bits per channel (9 bits total), but with too many colors, it didn’t generalize as good. If the
sky happens to be purple or turquoise, I still want that to be thought of as blue. Here is an example of
what a brightened picture with a blue sky looks like in a 2x2 grid:

You might notice that the grass is actually yellow. However, there is some green in it, so the presence is
still there.
Simplified (0s and 1s) Features
It is possible that the amount of blue in a cell could be misleading, because the value will be too high say
for jeans. Maybe it is better to just know that it is there? So, I also looked at looking at a feature vector
that was just 0s and 1s. To get it, for the color and Haar features, it is 1 if the feature is present (> 0) is
present and 0 otherwise; for the edge directions it is 1 if the value was above the mean and 0 otherwise.
Algorithms
Because the feature vectors are huge, I already knew that boosting will yield good results, but I needed
some algorithms to compare to, and I tried Perceptron and Logistic Regression.
Perceptron
The first algorithm I tried was Perceptron. I ran it for a while, and recorded performance on training and
validation sets. I saved the weights that gave the best performance on the validation set. I went through
the entire training set a few times, linearly decreasing alpha (learning rate). I tried a constant alpha, but
it yielded similar results, but it was not as stable. I also computed the average weights for the second
half of the run.
Logistic Regression
I tried logistic regression, as it had better chances of skipping features that were not correlated. Instead
of tuning lambda, I set lambda = 3 and ran regression. In each iteration I tested performance on the
training and validation sets and chose the weights that gave the best performance on the latter. I
basically used early stopping for regularization.

Adaptive Boosting
Last but not least I used Adaptive Boosting. I thought this will perform the best, because it can skip all
the bad features. I ran it for a while and also recorded performance against validation and training sets.
The best alphas for the validation set were used for testing.
Experiments
I split off my data into 65% training set, 15% validation set and 20% testing set. I didn’t run cross-
validation, but I permuted my data 10 times and recorded the averages on the test set.
Choice of dataset
Originally, I tried the following: I went through a lot of my photos that I had, and picked out the ones I
could orient myself just by looking at tiny thumbnails. I thought that if I can do it by looking at down-
sized images, then so can the computer. I was wrong. The computer rarely got above 80% accuracy,
which is better than picking at random, but not as good as I had hoped for.
I looked at my dataset and noticed that the photos I was using were just too diverse. So, instead I picked
out only the ones that: were taken outside; were taken during the day; had some portion of the horizon
line visible or did not contain people and contained more than one object. I think it is okay, because to
orient arbitrary images, they have to be classified to begin with, and teaching a machine to pick out
what I just described to me seems like an easier problem.
2-Step Classifier VS. Ranking
I had originally thought to make image orientation a 2-step classifier, because there were 3 classes: first
classify images as 0 – correctly oriented and 1 – need rotation; second classify as 0 – meaning it should
be rotated by -90 degrees and 1 – need to be rotated by +90 degrees. However I realized that this will
give poor performance, because the second step will have to rotate the bad examples from the previous
step. So if the first step is 85% accurate and so is the second one, overall this will yield 73% accuracy. I
quickly abandoned this idea.
What I did instead was ranking images after the first step. First I rotated the images +90 and -90
degrees, and computed features for each one. After running the classifier that determines whether the
orientation is right, I picked the image with the lowest prediction as the one with correct orientation. In
my implementation 0 means correctly oriented and 1 means needs to be rotated. So if one of the
orientations was closer to 0, it was probably the correct one.
Results

For training, I took my set, rotated a quarter of the photos to -90 degrees and another quarter to +90
degrees. I split it into training, validation and testing sets. The labels were 1 if the image was rotated and
0 if it was not. I tried both the features, and the simplified (only 0s and 1s) version of them.
Here is the table summarizing the results.
Algorithm Accuracy
Color Haar Direction All Three All Three Simple
Regression 77±2% 79±4% 89±2% 91±3% 93±2%
Perceptron 76±6% 77±4% 86±4% 88±4% 92±1%
AdaBoost N/A N/A N/A N/A 93±3%
As you can see, the most useful features were the edge direction features. I think because my photo set
was taken outside, the horizon line is the most giving away piece of evidence. The combination of all
three only gives a couple of percent improvement on performance.
Note that all algorithms performed nearly the same. When I was preparing the features for Adaptive
Boosting, I ran them through Regression and Perceptron, and noticed that the performance was better.
This is due the fact that intensity of features is not correlated with image orientation. If a portion of
some grass field has more green in a cell, there is no benefit from having less or more grass on the
bottom; only the position matters.
I would like to not crowd this paper with graphs, so here are some:

This graph shows the loss while training Adaptive Boosting algorithm. I was surprised that only 40
features were used for best results.
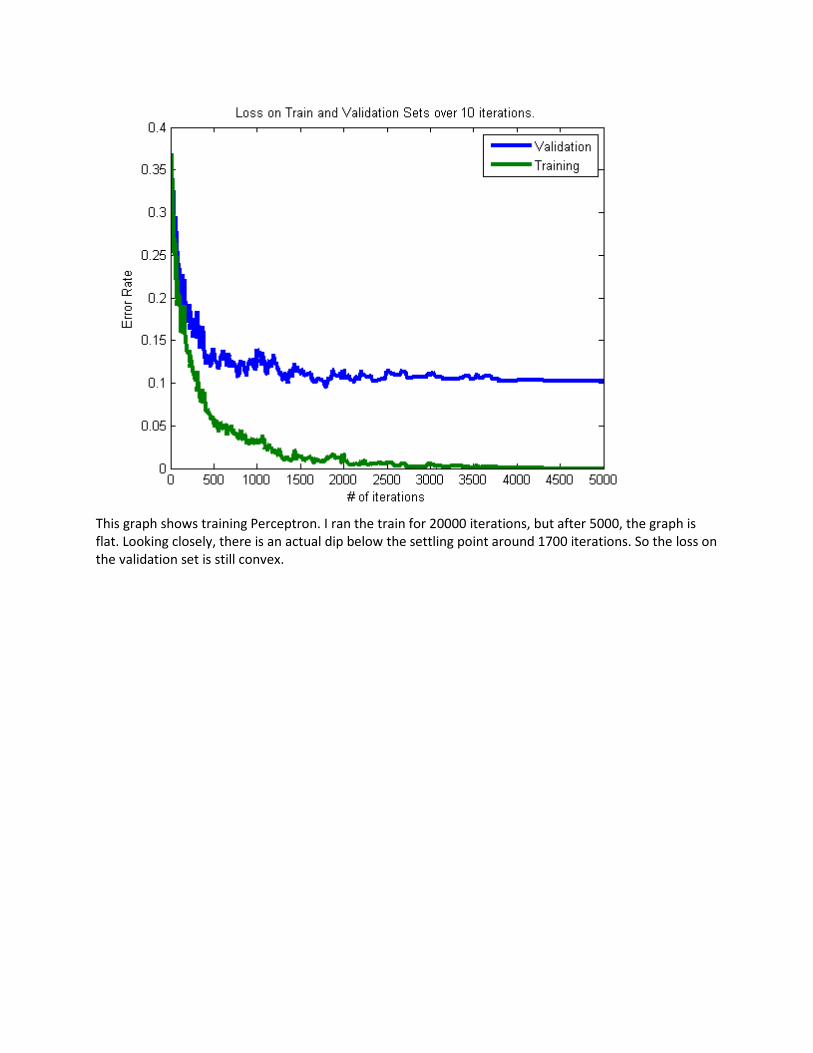
This graph shows training Perceptron. I ran the train for 20000 iterations, but after 5000, the graph is
flat. Looking closely, there is an actual dip below the settling point around 1700 iterations. So the loss on
the validation set is still convex.

This graph shows training Logistic Regression. Even though it gave the best results out of the other
three, this graph took a very long time to generate. I realize the plot of the Loss instead of the error rate
would have been prettier, but this still shows that the validation error function is convex, and settles
after a number of iterations.
These two curves are ROC curves for Perceptron and Logistic Regression respectively. You can tell that
regression has a better curve, but Perceptron has a better True Positive Rate with no false positives. If
there were only two orientations, and the goal was to not make any unnecessary rotations, Perceptron
would be a much better choice, but for this project, only the average accuracy mattered.
From this point on I only used Adaptive Boosting, because it ran much faster than Logistic Regression yet
it was almost as accurate.

For the next step, after each training session, I simply took the weights, multiplied them by the feature
vectors of the test set for all three orientations, and gave the final label to the orientation that received
the lowest score. I think of this as ranking, because the alphas (weights) represent the inverse ranking
system and the orientation with the highest rank is the predicted orientation.
The final result I got, over 10 iterations, was 90±3% accuracy. So there was almost no loss in accuracy
over the first step.
Here are some of the images that were persistently misclassified:
Note that most of these images have strong edges going from left to right. These are fake horizons. Also,
in all of these, if there’s the sky, there is still blue on top, and if there is green, it is on the bottom.
Just-For-Fun-Test
Out of curiosity, I wanted to see what my idea will behave like if I gave it photos it has never seen
before. I took my cheap camera that doesn’t do image orientation, took 34 photos outside my residence
and in the back yard and plugged them in as a test set. The results I got were pretty good. I permuted
my training set 3 times, and got 4, 3 and 2 images wrong. That’s 91% accuracy on average. Here are the
images that it got wrong:

Conclusion
In conclusion, I think that automatic image orientation is a very achievable goal. I have demonstrated
that with a combination of simple features like color presence and edge directions, it is possible to
classify the orientation of the images. Of course, there is a restriction that the images have to be similar.
Logistic Regression was the best algorithm for this, because it is able to weed out useless features, and
optimally combine good features. However, Logistic Regression takes a very long time to run.
A close second was Adaptive Boosting. It converged remarkably fast, which allowed for fast test
iterations. The loss in accuracy compared to regression was negligible. Out of 7000 features, just 40 gave
the best results, so there were a lot of really weak features.
Perceptron wasn’t much worse, but it fell short because it couldn’t easily skip weak features. It also
converged slower than AdaBoost. It is not shown in the results, but the average weights of the second
half had the same performance on the test set as the best ones on the validation set.
The fact that I had no problem getting 90% accuracy gives me high hopes that this can tuned and
improved to achieve much better results.
Future Work
There is a lot of work on this project that I wish I had done, but I just did not have the time. Here’s a list
of things for possible future work:
a) Try ranking after Logistic Regression.
b) Do Cross Validation and optimize Lambda for Logistic Regression.
c) Try another algorithm like ERLPBoost.
d) Use Adaptive Boosting on top of Logistic Regression
e) Compute a finer spatial pyramid, without gaps.
f) For edge direction features, add directions for each color channel.
g) For Haar features, try them on each of the color channels.
h) Try a combination of color presence and edge directions.
i) When combining edges give more weight to certain channels.
j) Try a different dataset. I am curious about trying ‘indoors’ shots and faces.
k) Work with square cut-outs of images, instead of resizing to squares.

References
P. Viola and M. Jones. Robust real-time object detection. 2nd Intl. Workshop on Statistical and
Computational Theories of Vision, 2001.
S. Lazebnik, C. Schmid, and J. Ponce. Beyond bags of features: Spatial pyramid matching for recognizing
natural scene categories. In CVPR, 2006.