automatic facial micro-expression analysis
TRANSCRIPT

Facial Micro-Expression Analysis –A Computer Vision ChallengeIII. ME Spotting
Tutorial
JOHN SEE Multimedia University, Malaysia
ANH CAT LE NGO TrustingSocial
SZE-TENG LIONG Feng Chia University, Taiwan

Outline ME spotting pipeline
Pre-processing steps
Facial Landmark Detection & Tracking
Face Registration
Optional steps (Masking, Region division)
Approaches
Early attempts with posed data
ME sequence spotting – Feature difference (FD) analysis
ME apex spotting
Highlighted Work: Automatic Apex Frame
Spotting in Micro-Expression Database

ME spotting Spotting
Automatic detection of the temporal interval of a micro facial movement in a sequence of video frames
Two Current Flavours: Spotting ME sequence or window of occurrence
Spotting ME apex frame

ME Spotting Pipeline Typically †, a ME spotting process will follow these
steps:
Facial Landmark Detection & Tracking
Face Registration
Feature Extraction
FD Analysis
† A majority of spotting works use this pipeline. There are a few works that
treat spotting as a classification problem; hence they may have a pipeline that is more similar to one of recognition.
Thresholding
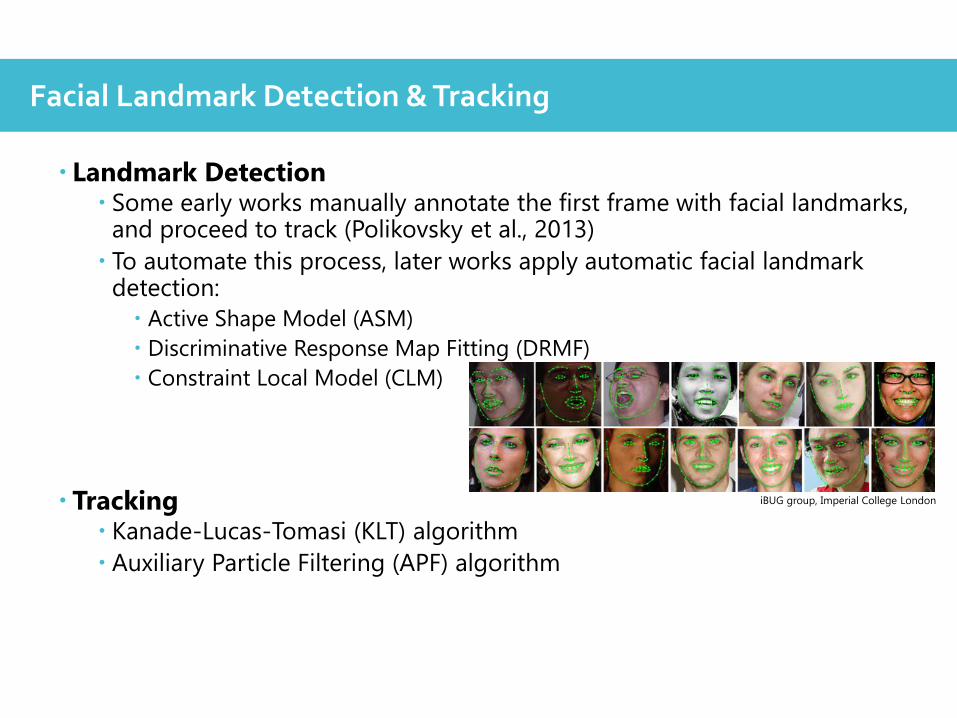
Landmark Detection Some early works manually annotate the first frame with facial landmarks,
and proceed to track (Polikovsky et al., 2013)
To automate this process, later works apply automatic facial landmark detection:
Active Shape Model (ASM)
Discriminative Response Map Fitting (DRMF)
Constraint Local Model (CLM)
Tracking Kanade-Lucas-Tomasi (KLT) algorithm
Auxiliary Particle Filtering (APF) algorithm
Facial Landmark Detection & Tracking
iBUG group, Imperial College London

Image Registration A process of aligning two images (the reference and sensed images) in a
geometrical manner.
In ME Useful to remove large head translations and rotations that might affect spotting or recognition task.
2 major categories of approaches used by ME works: Area-based (a.k.a. template matching or correlation-like) – windows
of predefined size / entire image utilized to estimate correspondence between images. 2D-DFT used by Davison et al. (2016)
Feature-based – features from local structures (points, lines, regions) are used to find pairwise correspondence between images
Simple affine transform used by Shreve et al. (2011), Moilanen et al. (2014)
Local Weighted Mean (LWM) used by Li et al. (2017), Xu et al. (2017) seeks to find 2D transformation matrix using 68 landmark points of the face
Face Registration

A masking step can be useful to remove noise caused by undesired facial motions
Shreve et al. (2011) – used a “T-shaped” static mask to remove middle portions of the face and the eyes
Liong et al. (2016) – used eye regions extracted based on facial landmarks to reduce false spotting of eye blinking motion
Davison et al. (2016) – used a binary mask to obtain 26 FACS-based facial regions, which were representative of locations of the face containing a single or a group of AUs
(Optional) Masking

Psychological findings (Porter & ten Brinke, 2008): ME analysis should be done on the upper and lower halves separately instead of together
Region division encourages splitting the face into important separate segments to achieve “localized spotting”
Ad-hoc ROI segments:
3 regions (upper, middle, lower); (Shreve et al., 2009)
8 regions (forehead, left & right of eye, left & right of cheek, left & right of mouth, chin) (Shreve et al., 2011)
4 quadrants (Shreve et al., 2014)
FACS action unit (AU) regions (popular in many works)
Block/grid segments:
𝑚× 𝑛 blocks (popular in many works)
Delaunay triangulated segments (Davison et al., 2016)
(Optional) Region Division


Early Attempts on posed data
Polikovsky et al. (2013) 3D gradient histograms as descriptor to
distinguish onset, offset, apex, neutral
Drawbacks:
Used posed data which is not challenging and unnatural
Treat spotting as a classification problem!
Shreve et al. (2013) Optical strain method to spot macro- and micro-
expressions
Reported good results (77/96 spotted) on their small, unpublished posed dataset
Feature Difference (FD) Analysis
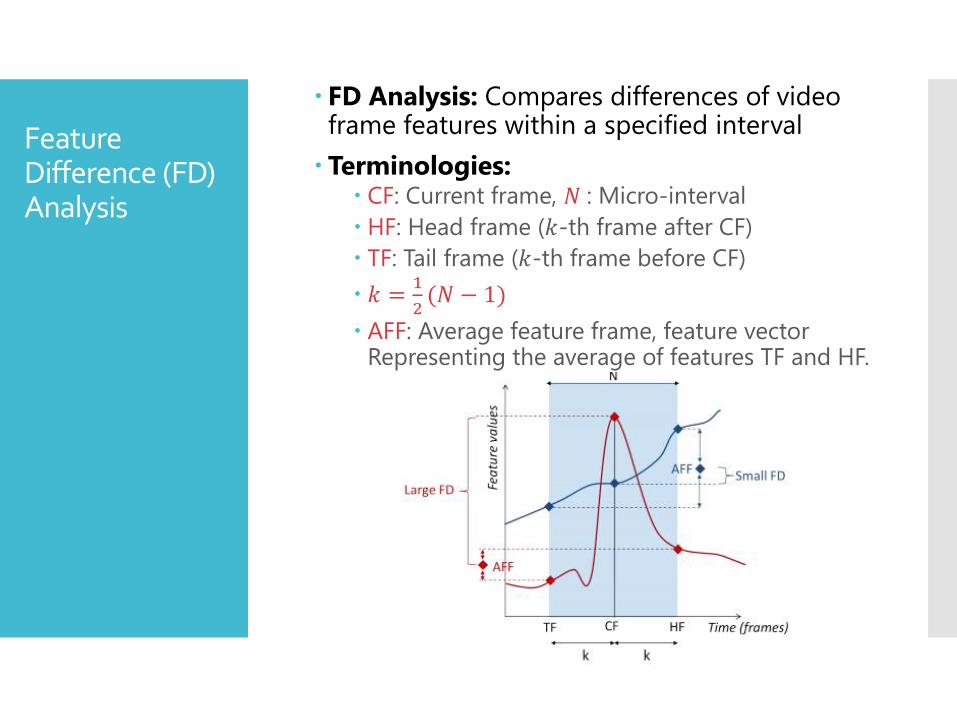
FD Analysis: Compares differences of video frame features within a specified interval
Terminologies: CF: Current frame, 𝑁 : Micro-interval
HF: Head frame (𝑘-th frame after CF)
TF: Tail frame (𝑘-th frame before CF)
𝑘 =1
2(𝑁 − 1)
AFF: Average feature frame, feature vector Representing the average of features TF and HF.
Feature Difference (FD) Analysis
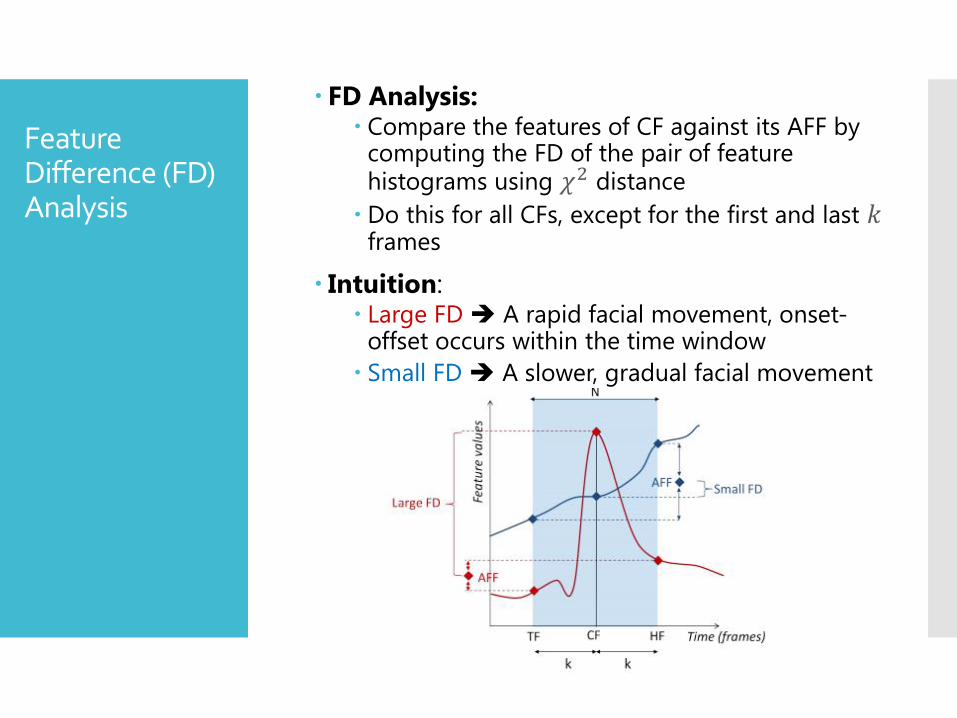
FD Analysis: Compare the features of CF against its AFF by
computing the FD of the pair of feature histograms using 𝜒2 distance
Do this for all CFs, except for the first and last 𝑘frames
Intuition: Large FD A rapid facial movement, onset-
offset occurs within the time window
Small FD A slower, gradual facial movement

Feature Difference (FD) Analysis
Localizing spotting: For each CF, FD values are computed for each
block (e.g. 6x6 grid = 36 blocks)
Since the occurrence of an ME will result in larger FD values in some (but not all) blocks, we take the average of 𝑀 largest FDs as the difference vector
The contrasted difference vector finds how far it is from the average 𝐹𝑖 of TF and HF
Determine threshold: Threshold
𝜏 = 0, 1 is a parameter for obtaining different thresholds

Feature Difference (FD) Analysis Peak detection:
Minimum peak distance for peak detection is set to 𝑘/2
Spotted peaks are compared with ground truth labels
If one spotted peak is located within the frame
range of 𝑜𝑛𝑠𝑒𝑡 −𝑁−1
4, 𝑜𝑓𝑓𝑠𝑒𝑡 +
𝑁−1
4, the frames
in the spotted sequence are counted as true positives, otherwise the 𝑁 frames will be counted as false positive frames.
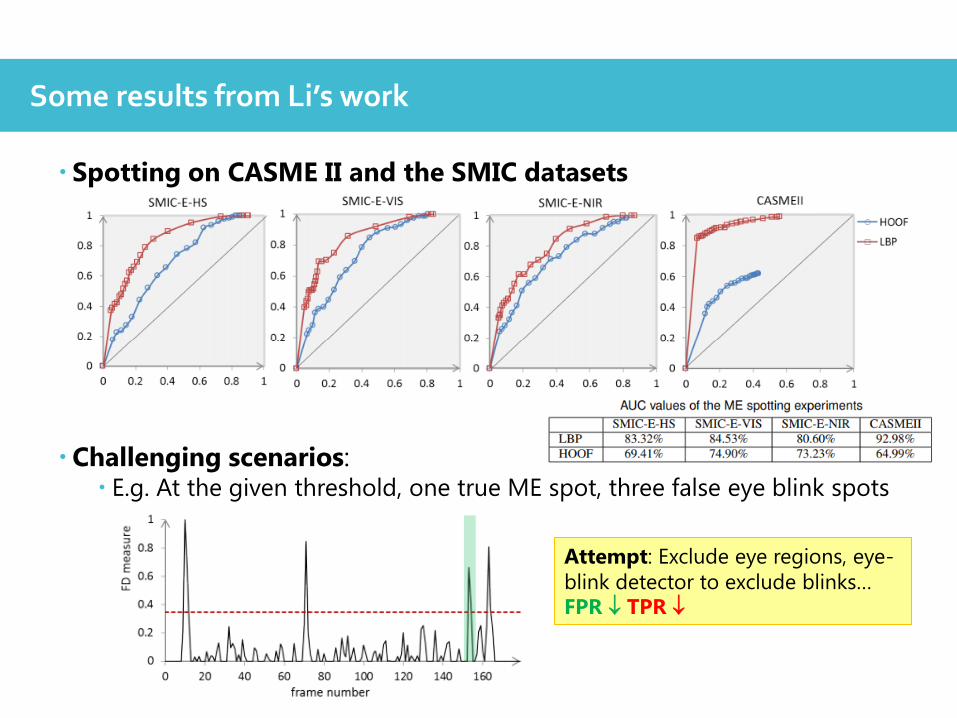
Spotting on CASME II and the SMIC datasets
Challenging scenarios: E.g. At the given threshold, one true ME spot, three false eye blink spots
Some results from Li’s work
Attempt: Exclude eye regions, eye-
blink detector to exclude blinks…
FPR TPR

A majority of works that applied FD Analysis opted for different feature choices:
Other methods: Optical flow vectors of small local regions, integrated into spatio-
temporal regions to find onset/offset times (Patel et al., 2015)
Random walk model to compute probability of containing MEs (Xia et al., 2016)
Features for FD Analysis
Feature First Work to Use
LBP Moilanen et al. (2014)
HOG Davison et al. (2015)
MDMD Wang et al. (2016)
3D HOG, Optical Flow (OF) Davison et al. (2016)
HOOF Li et al. (2017)
Riesz Pyramid Duque et al. (2018)

ME spotting is akin to a binary detection task (present / not present)
Typical detection performance metrics: TPR
FPR
ROC
The micro-interval 𝑁 = 0.5𝑠 is taken as the presumed maximum possible duration of MEs
Li et al. (2017)’s work used 𝑁 = 0.32𝑠 which corresponds to 𝑁 = 65 for CASME II
Performance Metrics & Specific Settings


Automatic Apex Frame Spotting in Micro-Expression DatabaseACPR 2015
Sze-Teng Liong, John See, KokSheik Wong, Anh Cat Le Ngo, Yee-Hui Oh, Raphael C.W. Phan

Can you tell which frame is the apex (with the strongest indication of emotion) ?
How about this ?
Spotting the apex frame

Apex frame spotting: Apex frame: the instant that is the most expression emotional state in the
sequence
Motivation: The apex frame is a potentially useful piece of information that may be helpful to recognition (spotting sequences tend to have a high margin of error)
The first work to attempt this: Yan & Chen (2017) CLM, LBP and OF were used to obtain features
Frame with largest feature magnitude is selected as the apex
However, is the frame with the strongest magnitude a good candidate? Can the presence of noise (eye blinks, large movements) affect this criterion?
Spotting the apex frame

This is as simple as it gets….
Exhaustive binary search strategy recursively searches through the set of candidate peaks by further splitting the partition that possesses the larger sum of feature magnitudes. Search stops when the final partition contains only 1 candidate peak, hence can no longer be split.
Exhaustive binary search strategy

The density heatmap shows the landmark # that contains the most changes in the video
The proposed binary search strategy is able to get as close as possible to the g/t apex instead of doing the “greedy”, i.e. going for the max magnitude
Searching for the apex frame
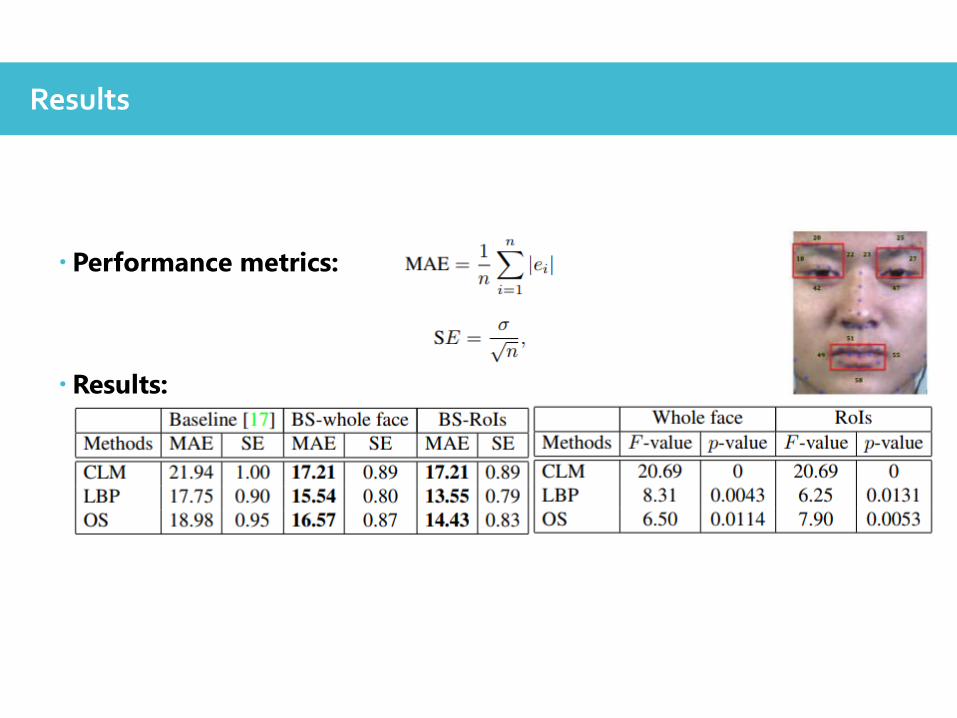
Performance metrics:
Results:
Results

Spotting - Given a long untrimmed video, these are essential targets, our “wish list”:
1. Able to differentiate macro-expressions and micro-expressions
CAS(ME)^2 needs mileage!
2. Able to extract “sufficiently good” ME sub-sequences that can be passed on to recognition task
Apex spotting does it from a different perspective…
2nd MEGC in FG 2019 has a new spotting challenge!
Spotting – how important is it?

End of Part 3
Questions?