automated topic naming - plg.math.uwaterloo.ca
TRANSCRIPT

Empirical Software Engineering manuscript No.(will be inserted by the editor)
Automated Topic Naming
Supporting Cross-project Analysis of Software MaintenanceActivities
Abram Hindle · Neil A. Ernst · MichaelW. Godfrey · John Mylopoulos
Received: date / Accepted: date
Abstract Software repositories provide a deluge of software artifacts to an-alyze. Researchers have attempted to summarize, categorize, and relate theseartifacts by using semi-unsupervised machine-learning algorithms, such as La-tent Dirichlet Allocation (LDA), used for concept and topic analysis to sug-gest candidate word-lists or topics that describe and relate software artifacts.However, these word-lists and topics are difficult to interpret in the absence ofmeaningful summary labels. Current topic modeling techniques assume man-ual labelling and do not use domain-specific knowledge to improve, contextu-alize, or describe results for the developers. We propose a solution: automatedlabelled topic extraction. Topics are extracted using LDA from commit-logcomments recovered from source control systems. These topics are given la-bels from a generalizable cross-project taxonomy, consisting of non-functional
Abram HindleDept. of Computing ScienceUniversity of AlbertaEdmonton, AB, CANADAE-mail: [email protected]
Neil A. ErnstDept. of Computer ScienceUniversity of British ColumbiaVancouver, BC, CANADAE-mail: [email protected]
Michael W. GodfreyDavid Cheriton School of Computer ScienceUniversity of WaterlooWaterloo, Ontario, CANADAE-mail: [email protected]
John MylopoulosDept. Information Eng. and Computer ScienceUniversity of TrentoTrento, ITALYE-mail: [email protected]
0DQXVFULSW&OLFN�KHUH�WR�YLHZ�OLQNHG�5HIHUHQFHV
1 2 3 4 5 6 7 8 9 10 11 12 13 14 15 16 17 18 19 20 21 22 23 24 25 26 27 28 29 30 31 32 33 34 35 36 37 38 39 40 41 42 43 44 45 46 47 48 49 50 51 52 53 54 55 56 57 58 59 60 61 62 63 64 65

2 Abram Hindle et al.
requirements. Our approach was evaluated with experiments and case stud-ies on three large-scale Relational Database Management System (RDBMS)projects: MySQL, PostgreSQL and MaxDB. The case studies show that la-belled topic extraction can produce appropriate, context-sensitive labels thatare relevant to these projects, and provide fresh insight into their evolvingsoftware development activities.
Keywords Software maintenance · Repository mining · Latent Dirichletallocation · Topic models
1 Introduction
A key problem for practicing software maintainers is gaining an understandingof why a system has evolved the way it has [26]. This is different from howa system has evolved. Looking back on streams of artifacts scattered acrossdifferent repositories, inferring what activities were performed, when, and forwhat reasons, is hard without expert advice from the developers involved. Inthis work we provide a method of automatically labelling development topicsextracted from commit logs, this method is called labelled topic extraction.
Concrete applications of labelled topic extraction include the annotationof development artifacts with NFR-related tags and the creation of projectdashboards. Annotating software development artifacts with NFR-related tagswould allow developers to create detailed directed queries of different artifactkinds that concern the same NFR; for example, a developer could browse therecent history of performance-related bug reports and code check-ins. Projectdashboards distill detailed information about a software system into a simplerand more abstract view that summarizes key aspects of the development effort[10]; labelled topic extraction would allow managers to track effort related tospecific NFR topics, such as usability or portability.
Topic modeling (such as Latent Dirichlet Allocation [2]) is a machine learn-ing technique that creates multinomial distributions of words extracted from atext corpus. This technique infers the hidden structure of a corpus using pos-terior inference: the probability of the hidden structure given the data. Topicmodels are useful in software maintenance because they summarize the keyconcepts in a corpus – such as source code, commit comments, or mailing-listmessages – by identifying words that commonly occur together. Among otheruses, topic modelling can quickly give developers an overview of where signifi-cant activity has occurred, and provide managers or maintainers an enhancedunderstanding of the project’s history.
While machine learning techniques can automatically identify clumps ofcommonly recurring terms, devising an appropriate summary label for eachclump/topic is harder. A given topic extracted from a set of commit logsmight consist of the following terms: “listener change remove add fire”. Thistopic might reasonably be labelled as “event handling” by a developer whounderstands the domain well, despite the fact that this label does not appearin the word list itself. Current approaches to topic labelling rely on manual
1 2 3 4 5 6 7 8 9 10 11 12 13 14 15 16 17 18 19 20 21 22 23 24 25 26 27 28 29 30 31 32 33 34 35 36 37 38 39 40 41 42 43 44 45 46 47 48 49 50 51 52 53 54 55 56 57 58 59 60 61 62 63 64 65

Automated Topic Naming 3
intervention by human experts, and also are limited to project-specific topiclabels. In this paper, we introduce labelled topic extraction, an approach thatautomatically suggests project-independent labels for topics.
In general, the fruits of mining software artifacts are often project spe-cific and hard to generalize. However, in our previous work we investigatedtopic trends — that is, topics that recur over time — we observed that topictrends often corresponded to non-functional requirements (NFRs) [18], whichis further emphasized in this paper due to the large numbers of NFR labelledtopics. This is encouraging, as NFRs have the property of being cross-domainand widely applicable. In this sense, they are useful abstractions for developerconversations about different software projects. Furthermore, there is a seriesof standards on NFRs, such as ISO9126 [19], that are specifically intendedto apply to projects of varying types; this suggests that our goal of tryingto extract NFR-related development topics, such as those related to softwarequality models, holds promise.
In this paper, we describe automated labelled topic extraction. It addressestwo gaps in the topic mining literature:
1. Topic mining of software has been limited to one project at a time. Thisis because traditional topic mining techniques are specific to a particu-lar data-set. Automated labelled topic extraction allows for comparisonsbetween projects.
2. Topic modeling creates word lists that require interpretation by the userto assign meaning. Like (1), this means that it is difficult to discuss resultsindependent of the project context. Our technique automatically, or withsome initial training, assigns labels across projects.
This paper makes the following contributions:
– We introduce the concept of labelled topic extraction, using a taxonomyof non-functional requirements (NFR) for our labels;
– We evaluate three kinds of automatic topic labelling methods: semi-unsupervisedlabelling of topics (word-lists), supervised labelling of topics with a singleNFR (machine learning), and supervised labelling of topics with multipleNFRs (multi-label machine learning);
– We examine how NFRs correlate with the work of individual developers;– We provide a method of cross-project analysis via topic labelling, and we
apply these techniques to visualize NFRs over time, and to analyze main-tenance activities.
We begin by discussing related work in Section 2. Next, we describe how wegenerated our data (Section 3.1). For semi-unsupervised classification (Section3.2), we begin by creating word-lists to signify when a topic matches an NFRlabel. We then apply our classifier and analyze the results. In Section 3.3,we manually annotate the topics, and use those annotations as training datafor supervised classification. To demonstrate an application of labelled topicextraction, we use an exploratory case study of three open source databasesystems to show how named topics can be compared between projects (Section
1 2 3 4 5 6 7 8 9 10 11 12 13 14 15 16 17 18 19 20 21 22 23 24 25 26 27 28 29 30 31 32 33 34 35 36 37 38 39 40 41 42 43 44 45 46 47 48 49 50 51 52 53 54 55 56 57 58 59 60 61 62 63 64 65

4 Abram Hindle et al.
4). The paper concludes with a discussion of limitations (Section 5), and futurework.
This work extends our previous work [15]. The major extensions in thispaper are as follows:
– We conducted another case-study on PostgreSQL.– We used two authors to each annotate the same PostgreSQL topics in order
to compare these annotations.– We used this new case-study to test inter-rater reliability (IRR), described
in Section 5.2.– We conducted an analysis of PostgreSQL authors and their association
with NFRs and topics (Section 4.3).
2 Previous Work
The idea of extracting higher-level concerns and topics, also known as concepts,aspects or requirements, has been approached from documentation-based andrepository-based perspectives.
Cleland-Huang and her colleagues have investigated mining requirementsdocuments for non-functional requirements (NFR) (software qualities) [6]. Oneapproach they tried was similar to this one, with keywords mined from NFRcatalogues found in Chung et al. [5]. Their approach resulted in a recall of 80%with precision of 57% for the security NFR, but could not find a reliable sourceof keywords for other NFRs. Instead, they developed a supervised classifier byusing human experts to identify an NFR training set. Our research is differentbecause we use a more comprehensive set of terms based on a taxonomy thatis an integral part of our framework. Another difference is that we make cross-project comparisons instead of focusing on a single project. They relied onrelatively well-structured requirements documents instead of version controlhistories that we use. The objective of Cleland-Huang’s study was to identifynew NFRs for system development, while our objective was to recover thoselatent NFRs from commit-log messages of the project.
Similarly, Mockus and Votta [26] studied a large-scale industrial change-tracking system. Mockus and Votta leveragedWordNet [9], an English-language“lexical database” that contains semantic relations between words, includingcommon related forms (similar to word stemming), meronymy and synonymy.They used WordNet for word roots as they felt the synonyms would be non-specific and cause errors. Mockus et al. validated their labels with systemdevelopers. Since we study multiple projects, instead of a single project, thesekind of interviews were not feasible (particularly in the distributed world ofopen-source software).
Another approach is to extract concerns from software repositories. Marcuset al. [22] used Latent Semantic Indexing (LSI) to identify commonly occurringconcerns for software maintenance. The concerns are given by the user, andLSI is used to retrieve them from a corpus. Topic modelling generates topics
1 2 3 4 5 6 7 8 9 10 11 12 13 14 15 16 17 18 19 20 21 22 23 24 25 26 27 28 29 30 31 32 33 34 35 36 37 38 39 40 41 42 43 44 45 46 47 48 49 50 51 52 53 54 55 56 57 58 59 60 61 62 63 64 65

Automated Topic Naming 5
that are independent of a user query, and relate only to word frequencies inthe corpus.
With ConcernLines, Treude et al. [28] showed tag occurrence using colourand intensity, and our plots that rely on color and intensity have a similar lookand feel to Treude et al.’s plots. They mined developer created change requesttags from IBM Jazz repositories and used these to analyze the evolution ofa single product. Change requests in Jazz allow for users to annotate eachchange request and check-in with tags such as “ui”, “usability” or “milestone3”. The presence of a well-maintained set of tags is obviously essential to thesuccess of this technique.
In Baldi et al. [1], topics are named manually: human experts read thehighest-frequency members of a topic and assign a label accordingly. As dis-cussed earlier, given the topic “listener change remove add fire”, Baldi et al.would assign the label event-handling. The labels are reasonable enough, butstill require an expert in the field to determine them. Furthermore, these la-bels are project specific, because they are generated from the data of thatproject. For example we might have a label called “Oracle” in the MySQLcase, since Oracle owns MySQL. Our approach differs in two important ways:we automate the process of naming the topics, and we label topics with project-independent terms, in order to permit cross-project comparison.
Mei et al. [25] use context information to automatically name topics. Theydescribe probabilistic labelling, using the frequency distribution of words in atopic to create a meaningful phrase. They do not use external domain-specificinformation as we do, but we do not generate phrases from the topics.
Massey [23] and Scacchi [27] looked at the topic of requirements in open-source software. Their work discusses the source of the requirements and howthey are used in the development process. German [13] looked at GNOMEspecifically, and listed several sources for requirements: leader interest, mimicry,brainstorming, and prototypes. None of this work addressed quality require-ments in OSS, nor did it examine requirements trends. In Hindle et al. [17] weexamined release patterns in OSS. That work showed that there is a differencebetween projects regarding maintenance techniques. This supports the resultdescribed in this paper, that software qualities are not discussed with the samefrequency across projects.
This paper and our MSR 2011 paper [15] are based off of the work ofErnst and Mylopoulos [7] and the work of Hindle et al. [18]. In Ernst and My-lopoulos [7], we describe an earlier project that identifies changes in qualityrequirements in GNOME software projects (GNOME is a Linux desktop envi-ronment). Unlike this paper, this earlier approach was more exploratory andhad less validation. In particular, it uses different word-lists, solely uses text-matching, and does not leverage machine learning strategies. Our approach inthis paper, and our MSR 2011 paper [15], extends Ernst and Mylopoulos [7]by using word-lists to label topics, which are completely absent in the earlierwork. Hindle et al. [18] propose a windowed method of topic analysis thatwe extend with labelled topics, NFRs and new visualizations. This windowedmethod was to bucket documents by time windows (such as months), that
1 2 3 4 5 6 7 8 9 10 11 12 13 14 15 16 17 18 19 20 21 22 23 24 25 26 27 28 29 30 31 32 33 34 35 36 37 38 39 40 41 42 43 44 45 46 47 48 49 50 51 52 53 54 55 56 57 58 59 60 61 62 63 64 65

6 Abram Hindle et al.
Fig. 1 Research methodology process view.
could overlap if necessary, and then use LDA to extract documents from thesebucket. These topics were then related to topics in other adjacent buckets, andjoined if deemed sufficiently similar. This paper, and our MSR’2011 paper [15],extend the method of Hindle et al. [18] by labelling topics and providing analternative visualization, the topic time-line described in Section 4.
3 Study Design and Execution
Figure 1 gives an outline of our methodology. We begin by gathering sourcedata and creating topic models. For semi-unsupervised labelling, we generatethree sets of word-lists as signifiers for NFRs. With supervised learning, wetrain our data with manual annotations in order to match topics with NFRs.Finally, these topics are used to analyze the role of NFRs in software mainte-nance.
1 2 3 4 5 6 7 8 9 10 11 12 13 14 15 16 17 18 19 20 21 22 23 24 25 26 27 28 29 30 31 32 33 34 35 36 37 38 39 40 41 42 43 44 45 46 47 48 49 50 51 52 53 54 55 56 57 58 59 60 61 62 63 64 65
Automated Topic Naming 7
3.1 Generating the Data
To evaluate our approach, we sought candidate systems that were matureprojects and had openly accessible source control repositories. We selected sys-tems from the same application domain, to control for differences in functional,rather than non-functional, requirements. We used three different open-source,partially-commercial database systems:
MySQL 3.23 — Started in 1994 and MySQL 3.23 was released in early 2001.MySQL contains 320, 000 lines of C and C++ source code 1. We used theMySQL 3.23 source control history from July 31st, 2000 to August 9th,2004.
MaxDB 7.500 — Started in the late 1970s as a research project, and was lateracquired by SAP. As of version 7.500, released April 2007, the project hasover 940, 000 lines of C source code 2. We used the MaxDB 7.500 sourcecontrol history from June 29th, 2004 to June 19th, 2006.
PostgreSQL 7.3 — Started in the 1980s as a Berkeley research project 3. Post-greSQL 7.3 contains 306, 000 lines of C code. We used the PostgreSQL 7.3source control history from May 9th, 2002 to August 26th, 2004.
We explicitly chose older versions of mature projects from a stable problemdomain to increase the likelihood that we would encounter primarily mainte-nance activities in our studies. We felt that a single domain would allow forcross-project comparison. At the same time we recognize that problem do-main alone does not guarantee functional and non-functional similarity. Forinstance, each database system has a different focus. PostgreSQL tends to fo-cus on fulfilling much of the SQL92 specification and adding more features,while MySQL has been slow to adopt much of that specification in favourof community-requested features. The consequence of our choice to look at asingle domain is to limit generalizability. What we show in this paper will besomewhat biased towards database software.
For each project, we studied source control commit comments, the mes-sages that programmers write when they commit revisions to a source controlrepository. Most commits we observed had comments: 90% in MySQL 3.23,98.5% in PostgreSQL and 99.99% in MaxDB 7.500. Commit comments areoften studied by researchers, as they are the most readily accessible sourceof project interactions, and developers are often required to create them bythe repository mechanism (e.g., CVS). Additionally, relying only on commitcomments makes our approach more generalizable, as we do not assume thepresence of other artifact corpora. An example of a typical commit message,fromMySQL, is: “history annotate diffs bug fixed (if mysql real connect() failedthere were two pointers to malloc’ed strings, with memory corruption on free(),of course)”. We extracted these messages and indexed them by creation time.
1 generated using David A. Wheeler’s SLOCCount, http://dwheeler.com/sloccount.2 http://www.sdn.sap.com/irj/sdn/maxdb3 http://www.postgresql.org/docs/7.3/static/
1 2 3 4 5 6 7 8 9 10 11 12 13 14 15 16 17 18 19 20 21 22 23 24 25 26 27 28 29 30 31 32 33 34 35 36 37 38 39 40 41 42 43 44 45 46 47 48 49 50 51 52 53 54 55 56 57 58 59 60 61 62 63 64 65

8 Abram Hindle et al.
Each word in the message was stripped of punctuation and converted to low-ercase. We summarized each message as a word distribution minus stop-wordssuch as “the” and “at”. We did not stem or apply any other transforms tothe messages. Our stop words are derived from the Natural Language Toolkit(NLTK) English stop-word list 4.
For the commit message data-sets of each project, we created an XML filethat partitioned commits into 30 day periods. We chose a period size of 30days as it is smaller than the time between minor releases but large enough forthere to be sufficient commits to analyze [18]. For each 30 day period of eachproject, we input the messages of that period into Latent Dirichlet Allocation(LDA), a topic analysis algorithm [2], and recorded the topics the algorithmextracted.
A topic analysis tool such as LDA will try to find N independent worddistributions within the word distributions of all input messages. If there arenot N independent word distributions, the topics produced tend to be dupli-cates of each other, that is, they share the top terms. During this study wefound that if we used a value of 20 for N , duplicate topics were infrequent.Linear combinations of these N word distributions are meant to represent andrecreate the word distributions of any of the original messages. In other words,these topics are cross-cutting collections of words relevant to one or more ofour commit messages. LDA extracts topics in an unsupervised manner; thealgorithm relies solely on the source data and word distributions of messages,with no human intervention.
3.1.1 The High-level Labels
To facilitate cross-project comparison, we used a taxonomy of NFRs. This tax-onomy is based on the ISO quality model, ISO9126 [19], which describes sixhigh-level NFRs: maintainability, functionality, portability, efficiency, usabil-ity, and reliability. There is some debate about the terms in this model [3], andwhether they are a) the correct terms and b) correctly organized. However,ISO9126 is “an international standard and thus provides an internationallyaccepted terminology for software quality [3, p. 58],” and so we consider thatit is sufficient for the purposes of this research. Performance is an example ofan RDBMS word related to the efficiency NFR. We claim that these NFRsare maintenance concerns (to varying degrees) in all software projects, and aretherefore well suited for comparisons between projects.
3.1.2 Creating a Validation Corpus
To evaluate both semi-unsupervised and supervised classification, we createda validation set of manually labelled topics. Per each project, the annotators(the first two authors) annotated each extracted topic in each period with the
4 NLTK: http://www.nltk.org/
1 2 3 4 5 6 7 8 9 10 11 12 13 14 15 16 17 18 19 20 21 22 23 24 25 26 27 28 29 30 31 32 33 34 35 36 37 38 39 40 41 42 43 44 45 46 47 48 49 50 51 52 53 54 55 56 57 58 59 60 61 62 63 64 65

Automated Topic Naming 9
six NFR labels listed above. Annotators did not annotate each other’s anno-tations, except that PostgreSQL (PgSQL) was annotated by both annotatorsin order to evaluate inter-rater reliability. We looked at each period’s topics,and assessed what the data—consisting of the frequency-weighted word listsand messages—suggested was the most appropriate labels for that topic. Weselected the appropriate labels using auxiliary information as well, such as theactual revisions and files that were related to the topic being annotated. Forexample, for the MaxDB topic consisting of a message “exit() only used in nonNPTL LINUX Versions”, we tagged that topic portability. Given the top-levelannotations of portability, efficiency, reliability, functionality, usability, andmaintainability, the annotators annotated each topic with the relevant label.We added a catch-all label, none, which we used when none of the six NFRswas suitable. In some instances, we used finer-grained annotations that wouldbe aggregated up to one of these higher-level labels.
We validate classification performance using the area under the curve of Re-ceiver Operating Characteristic [8], abbreviated ROC, sometimes called AreaUnder the Curve or AUC, and the F-measure, which is the harmonic mean ofprecision and recall, i.e., 2∗(P ∗R)/(P+R). Throughout the paper we will pro-vide F-measure scores so that readers who are more familiar with F-measurethan ROC can intuitively interpret the results.
ROC values provide a score reflecting how well a particular learner per-formed for the given data. ROC maps to the more familiar concepts of preci-sion/sensitivity and recall/specificity: it plots the true positive rate (sensitiv-ity) versus the false positive rate (1 - specificity). A perfect learner has a ROCvalue of 1.0, reflecting perfect recall and precision. A ROC result of 0.5 wouldbe equivalent to a random learner (that is, issuing as many false positives astrue positives). While we recognize that using 0.5 as the base-line means ourROC scores will look much larger than our F-Measure scores, we feel that theknowledge that random selection is 0.5 or worse is helpful for interpreting ourresults. The ROC of a classifier is equivalent to the probability that the clas-sifier will rank a randomly chosen positive instance higher than a randomlychosen negative instance.
We argue for using ROC over F-Measure because ROC suffers less frombias, as F-Measure often skews towards the positive class [11,12], especiallyin the case of class imbalance. Forman et al. [12] demonstrate that cross-foldvalidation will often produce low F-measures given high class imbalance andthe presence of false negatives. Although recent work [12] has suggested thatwhile ROC suffers less bias than the average F-measure (Favg) for cross-folds,F-measures (Ftp,fp) that are calculated from the sums of true-positives, false-positive, and false-negatives across folds tend to exhibit no bias. Unfortunatelyour experimental framework lacks a robust way to calculate Ftp,fp, thus westill provide ROC and Favg . We consider our labelling classifiers acceptable ifthey outperform a random classifier (0.5).
1 2 3 4 5 6 7 8 9 10 11 12 13 14 15 16 17 18 19 20 21 22 23 24 25 26 27 28 29 30 31 32 33 34 35 36 37 38 39 40 41 42 43 44 45 46 47 48 49 50 51 52 53 54 55 56 57 58 59 60 61 62 63 64 65

10 Abram Hindle et al.
3.2 Semi-unsupervised Labelling
In this section we describe how to label topics based on dictionaries mined fromsources external to the projects. We call this “semi-unsupervised” becausewhile there is no “training set”, we do seed the word-lists manually.
3.2.1 Generating Word Lists
In order to automatically label each topic with one of the six high-level NFRs,we associate each NFR with a list of keywords or word-lists, in our parlance.These word-lists were determined a priori and were not extracted from theprojects themselves, using the methodology explained below. In general, theselists are project and domain independent. We intersected the words of thetopics and the words of our word-lists. We “labelled” a topic if any of itswords matched any of the word-list’s words. A topic could match more thanone NFR. We used several different sets of word-lists for comparison, whichwe refer to as exp1, exp2, and exp3 in the text which follows.
Our first word-list set, exp1, was generated using the ontology for softwarequality measurement described in Kayed et al. [20], which was constructedusing 80 source documents, including research papers and international stan-dards. The labels we used were:
integrity, security, interoperability, testability, maintainability, trace-ability, accuracy, modifiability, understandability, availability, mod-ularity, usability, correctness, performance, verifiability, efficiency,portability, flexibility, reliability.
Our second word-list, exp2, uses the ISO9126 taxonomy described above(Section 3.1) to seed the word-lists. The terms from ISO9126 may not captureall words occurring in the topics that are nonetheless associated with one of theNFRs. For example, the term “redundancy” is one we considered to be relevantto discussion of reliability, but is not in the standard. We recognize that termslike this might be used in a different context with a different meaning, likecode-cloning. We therefore took the NFRs from the ISO9126 and added termsto them.
To construct these expanded word-lists, we used WordNet [9]. We thenadded Boehm’s software quality model [4], and classified his eleven ‘ilities ’into their respective ISO9126 NFRs. We did the same for the quality modelproduced by McCall et al. [24]. We then conducted a simple random analysis ofmailing list messages from an open source ecosystem, KDE. Like the GNOMEstudy we conducted in Ernst and Mylopoulos [7], KDE contains a suite ofdifferent products covering a variety of software categories. If we judged a givenmessage to contain terms that were related to one of the NFRs in ISO9126,we added it to our word-list. This allowed us to expand our word-lists withmore software-specific terms. Table 1 shows the labels (NFRs) and word-listswe used for matching.
For the third set of word-lists, exp3, we extended the word-lists from exp2
using WordNet similarity matches. Similarity in WordNet means siblings in a
1 2 3 4 5 6 7 8 9 10 11 12 13 14 15 16 17 18 19 20 21 22 23 24 25 26 27 28 29 30 31 32 33 34 35 36 37 38 39 40 41 42 43 44 45 46 47 48 49 50 51 52 53 54 55 56 57 58 59 60 61 62 63 64 65

Automated Topic Naming 11
Label Related terms
Maintainability testability changeability analyzability stability maintain maintain-able modularity modifiability understandability interdependent de-pendency encapsulation decentralized modular
Functionality security compliance accuracy interoperability suitability functionalpracticality functionality compliant exploit certificate secured “bufferoverflow” policy malicious trustworthy vulnerable vulnerability accu-rate secure vulnerability correctness accuracy
Portability conformance adaptability replaceability installability portable mov-ableness movability portability specification migration standardizedl10n localization i18n internationalization documentation interoper-ability transferability
Efficiency “resource behaviour” “time behaviour” efficient efficiency perfor-mance profiled optimize sluggish factor penalty slower faster slow fastoptimization
Usability operability understandability learnability useable usable serviceableusefulness utility useableness usableness serviceableness serviceabilityusability gui accessibility menu configure convention standard featurefocus ui mouse icons ugly dialog guidelines click default human con-vention friendly user screen interface flexibility
Reliability “fault tolerance” recoverability maturity reliable dependable respon-sibleness responsibility reliableness reliability dependableness depend-ability resilience integrity stability stable crash bug fails redundancyerror failure
Table 1 NFRs and associated word-lists – exp2
hypernym tree. We do not include these words here for space considerations 5.Wordnet similarity is a very broad match. For example, the label maintain-ability is associated with words ease and ownership, and the word performancehas a ‘sense’ that refers to musical performances, which is obviously unrelatedto software development. In general, as we proceed from word-lists in exp1 tothat in exp3, our lists become more generic.
3.2.2 Automatic Labelled Topic Extraction
Using our three word-lists (exp1, exp2, exp3), we labelled our topics with anNFR where there was a match between a word in the list and the same wordsomewhere in the frequency distribution of words that constitute the topic.A named topic is a topic with a match. Unnamed topics occur where there isno such match. This may indicate either a lack of precision in the word-lists,or simply that this topic is not associated with non-functional requirements.All experiments were run on the data-sets for each project (e.g., PostgreSQL,MySQL, MaxDB). LDA extracted 20 topics per period for each project. Eachchange-log message was lightly processed before applying LDA: words wereconverted to lowercase with punctuation removed and then stop words wereremoved. This labelling is semi-unsupervised because the corpus is not derived
5 For our word lists visit http://softwareprocess.es/nomen/
1 2 3 4 5 6 7 8 9 10 11 12 13 14 15 16 17 18 19 20 21 22 23 24 25 26 27 28 29 30 31 32 33 34 35 36 37 38 39 40 41 42 43 44 45 46 47 48 49 50 51 52 53 54 55 56 57 58 59 60 61 62 63 64 65

12 Abram Hindle et al.
Project Measure exp1 exp2 exp3
MaxDB 7.500 Named Topics 305 183 330Unnamed Topics 84 206 59
MySQL 3.23 Named Topics 341 202 469Unnamed Topics 245 384 117
PgSQL 7.3 Named Topics 639 543 640Unnamed Topics 1 97 0
Table 2 Automatic topic labelling for MaxDB, MySQL and PostgreSQL
from the project being analyzed, and we did not label the project’s topics our-selves for a training set. The motivation behind this technique is that becausemost software often addresses similar issues, we can use the domain knowledgeof software to label relevant topics.
Table 2 shows how many topics were labelled for MaxDB, MySQL andPostgreSQL. Notice how PostgreSQL had far fewer unlabelled topics, Post-greSQL also was under going far more development as we evaluated 7744PostgreSQL commits versus 8664 MaxDB commits and 6223 MySQL com-mits. In terms of change-log comment words PostgreSQL had 164724, whileMaxDB had 68203, and MySQL had 101081. This implies there were morePostgreSQL terms for the topic analyzer to produce topics with. And thuswe suspect that PostgreSQL topics were flooded with many terms, indicatingthat perhaps we needed more than 20 topics per month for PostgreSQL, asthis result indicates there is a lot of overlap in the topics.
For exp1 the labels with the most topics were correctness (182/305/640,which represent MySQL, MaxDB and PostgreSQL topic counts, respectively)and testability (121/238/625).We did not see many results for usability (4/0/138)or accuracy (3/0/27), which were infrequently matched. Note the significantlyhigher result for usability in PostgreSQL—this suggests a difference in howproject developers are discussing usability, at least with respect to our analysis.We also looked for correlations between our labels: excluding double matches(self-correlation), our highest co-occurring labels were verifiability or correct-ness with traceability, and testability with correctness.
For exp2, there are more unnamed topics than exp1. Only reliability pro-duces the most matches, mostly due to the word “error”. Co-occurrence resultswere poor. This suggests our word lists were overly restrictive. For PostgreSQLreliability and usability co-occurred with portability and efficiency.
For exp3, we generally labelled more topics. As mentioned above, the word-lists are broad, so there are likely to be false-positives (discussed below). Themost frequent label across all projects (for this word-list, and unlike exp1)was usability, and the least frequent label was maintainability. This impliesthat our signifiers for usability in this experiment were fairly broad. Commonco-occurrences were reliability with usability, efficiency with reliability, andefficiency with usability.
1 2 3 4 5 6 7 8 9 10 11 12 13 14 15 16 17 18 19 20 21 22 23 24 25 26 27 28 29 30 31 32 33 34 35 36 37 38 39 40 41 42 43 44 45 46 47 48 49 50 51 52 53 54 55 56 57 58 59 60 61 62 63 64 65

Automated Topic Naming 13
Fig. 2 Performance, ROC values (range: 0–1), of semi-unsupervised topic labelling for eachNFR and per word-list. The dashed line indicates the performance of a random classifier.This graph shows how well the semi-unsupervised topic labelling matched our manual an-notations.
3.2.3 Analysis of the Semi-unsupervised Labelling
For each quality in the high-level ISO 9126 taxonomy (namely, Maintainabil-ity, Usability, Reliability, Efficiency, Portability, Functionality) we assessedwhether the semi-unsupervised labels for a topic matched the manual annota-tions we created for the validation corpus. Recall that the manual annotationswere not used to train the labelling process. As described in Section 3.1 weused both ROC and F-measure measures to evaluate the performance of theclassification. Figure 2 shows our ROC results for PostgreSQL, MaxDB andMySQL. We omit plots of exp1 due to poor results. We describe F-measureresults in the text below.
Because our ground truth annotations were relevant only to ISO9126, exp1had poor performance due to the overlap between ISO9126 and the Kayedontology (i.e., we annotated topics with labels which did not appear in thevalidation corpus). For exp1 the F-measures for the NFRs for MaxDB werefrom 0 to 0.18 with an average (of all NFRs) of 0.03, for MySQL were from 0to 0.16 with an average of 0.05, and for PostgreSQL 0 to 0.15 with an averageof 0.07.
For exp2, the average F-measure (macro-F1) for MaxDB was 0.24 with arange 0.091 to 0.37, and 0.16 for MySQL with a range of 0 to 0.41. PostgreSQLhad an average F-measure of 0.30 with a range of 0.09 to 0.38. MaxDB hadan average precision and recall of 0.25 and 0.22 while MySQL had 0.41 and0.10 and PostgreSQL 0.31 and 0.29, respectively.
For exp3, the average F-measure (macro-F1) for MaxDB was 0.26 with arange 0.11 to 0.47, and 0.36 for MySQL with a range of 0.10 to 0.65. Post-greSQL had an average F-measure of 0.42 with a range of 0.31 to 0.54. MaxDBhad an average precision and recall of 0.16 and 0.67 while MySQL had 0.3 and
1 2 3 4 5 6 7 8 9 10 11 12 13 14 15 16 17 18 19 20 21 22 23 24 25 26 27 28 29 30 31 32 33 34 35 36 37 38 39 40 41 42 43 44 45 46 47 48 49 50 51 52 53 54 55 56 57 58 59 60 61 62 63 64 65
14 Abram Hindle et al.
0.48. PostgreSQL had average precision and recall of 0.27 and 0.95, respec-tively.
Based on this we found that reliability and usability worked well for MaxDBin exp2 and better in exp3. exp1 performed poorly. MySQL had reasonable re-sults within exp2 for reliability and efficiency. MySQL’s results for efficiencydid not improve in exp3 but other qualities such as functionality did improve.For PostgreSQL in exp2, reliability and efficiency were likewise the most accu-rate, while functionality remained poor. Functionality improved dramaticallyby exp3. Our F-measure scores were low and many ROC scores were 0.6 orless, but our classifier, in most cases, still performed substantially better thanrandom (0.5), even in the face of heavy class-imbalance for qualities such asusability and efficiency. While there is much room for improvement, we areseeing some correlation between our quality word lists and relevant topics.
3.3 Supervised Labelling
Supervised labelling requires expert analysis of the correct class/label to assigna label to a topic. In our approach, we use the top-level NFRs in the ISO9126standard [19] for our classes, but other taxonomies are also applicable.
We used a suite of supervised classifiers, WEKA [14], that includes ma-chine learning tools such as support vector machines and Bayes-nets. We alsoused the multi-labelling add-on for WEKA, Mulan [29]. Traditional classifierslabel topics with a single class, whereas Mulan allows for a mixture of classesper topic, which is what we observed while manually labelling topics. For ex-ample, a given topic (word distribution) may be ‘about’ both usability andmaintainability, if this topic was a product of a discussion on design trade offs.The features we used are word counts/occurrence per topic, if a word occursfrequently enough in a topic we consider it a feature of the topic.
To assess the performance of the supervised learners, we did a 10-fold cross-validation [21], a common technique for evaluating machine learners, where theoriginal data is partitioned randomly into ten sub-samples, and each sampleis used to test against a training set composed of the nine other samples. Wediscuss these results below.
3.3.1 Analysis of the Supervised Labelling
Because our data-set consisted of word counts we expected Bayesian tech-niques to perform well. Bayesian techniques are often used in spam filtering,which is similarly interested in word distributions. We tried other learners thatWEKA [14] provides, including rule learners, decision tree learners, vectorspace learners, and support vector machines. Figure 3 shows the performanceof the best performing learner per label: the learner that had the highest ROCvalue for that label. The best learner is important because one uses a sin-gle learner per label. When applying our technique, per each NFR one should
1 2 3 4 5 6 7 8 9 10 11 12 13 14 15 16 17 18 19 20 21 22 23 24 25 26 27 28 29 30 31 32 33 34 35 36 37 38 39 40 41 42 43 44 45 46 47 48 49 50 51 52 53 54 55 56 57 58 59 60 61 62 63 64 65
Automated Topic Naming 15
Portability E!ciency Reliability Functionality Maintain. Usability
1
0
0.1
0.2
0.3
0.4
0.5
0.6
0.7
0.8
0.9!"#$%!&'()*+,'()
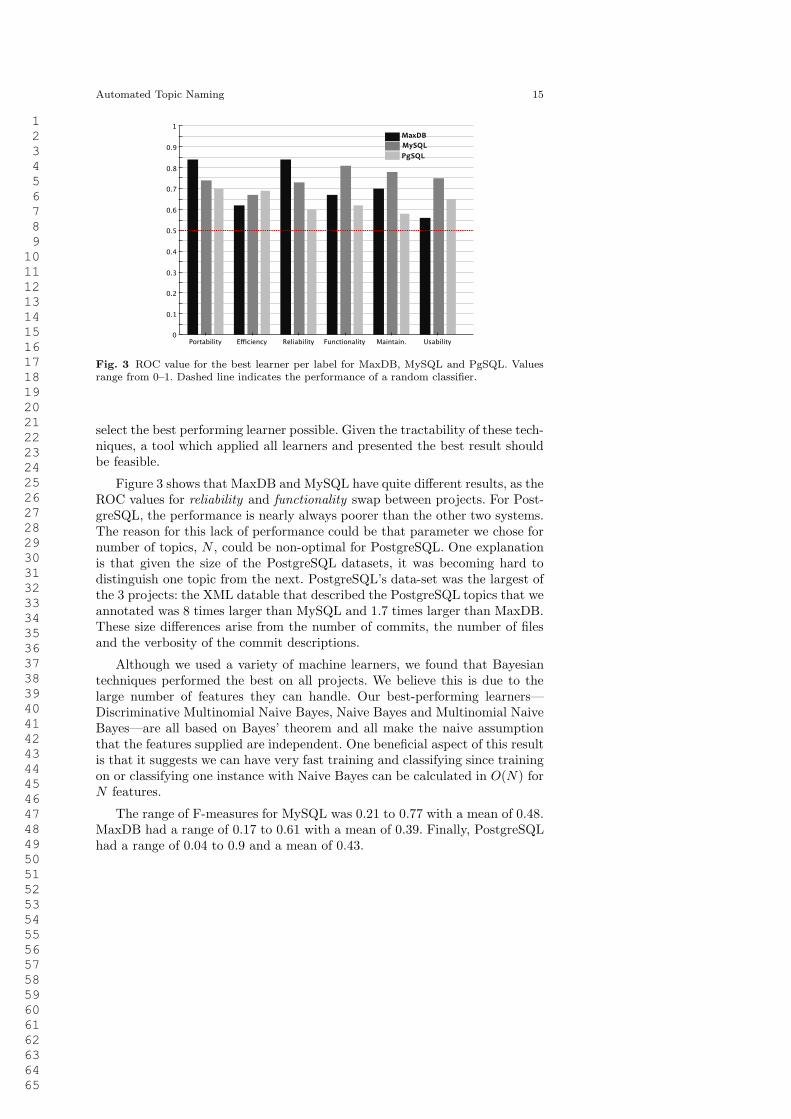
Fig. 3 ROC value for the best learner per label for MaxDB, MySQL and PgSQL. Valuesrange from 0–1. Dashed line indicates the performance of a random classifier.
select the best performing learner possible. Given the tractability of these tech-niques, a tool which applied all learners and presented the best result shouldbe feasible.
Figure 3 shows that MaxDB and MySQL have quite different results, as theROC values for reliability and functionality swap between projects. For Post-greSQL, the performance is nearly always poorer than the other two systems.The reason for this lack of performance could be that parameter we chose fornumber of topics, N , could be non-optimal for PostgreSQL. One explanationis that given the size of the PostgreSQL datasets, it was becoming hard todistinguish one topic from the next. PostgreSQL’s data-set was the largest ofthe 3 projects: the XML datable that described the PostgreSQL topics that weannotated was 8 times larger than MySQL and 1.7 times larger than MaxDB.These size differences arise from the number of commits, the number of filesand the verbosity of the commit descriptions.
Although we used a variety of machine learners, we found that Bayesiantechniques performed the best on all projects. We believe this is due to thelarge number of features they can handle. Our best-performing learners—Discriminative Multinomial Naive Bayes, Naive Bayes and Multinomial NaiveBayes—are all based on Bayes’ theorem and all make the naive assumptionthat the features supplied are independent. One beneficial aspect of this resultis that it suggests we can have very fast training and classifying since trainingon or classifying one instance with Naive Bayes can be calculated in O(N) forN features.
The range of F-measures for MySQL was 0.21 to 0.77 with a mean of 0.48.MaxDB had a range of 0.17 to 0.61 with a mean of 0.39. Finally, PostgreSQLhad a range of 0.04 to 0.9 and a mean of 0.43.
1 2 3 4 5 6 7 8 9 10 11 12 13 14 15 16 17 18 19 20 21 22 23 24 25 26 27 28 29 30 31 32 33 34 35 36 37 38 39 40 41 42 43 44 45 46 47 48 49 50 51 52 53 54 55 56 57 58 59 60 61 62 63 64 65

16 Abram Hindle et al.
BR CLR HOMER
1
0.4
0.5
0.6
0.7
0.8
0.9!"#$%
!&#$%
(a) MySQL
BR CLR HOMER
1
0.4
0.5
0.6
0.7
0.8
0.9!"#$%
(b) MaxDB
Fig. 4 MySQL and MaxDB macro and micro-ROC results per multi-label learner. Possiblevalues range from 0–1. Dashed line indicates the performance of a random classifier.
The less-frequently occurring a label, the harder it is to get accurate re-sults, due to the high noise level. Nevertheless, these results are better thanour previous word-list results of exp2 and exp3, because the ROC values aresufficiently higher in most cases (other than MaxDB reliability, MySQL effi-ciency, and PostgreSQL maintainability). The limitation of the approach wetook here is that we assume labels are independent; however, labels could becorrelated with each other. The next section (3.4) addresses the issue of a lackof independence and correlation between labels using multi-label learners.
3.4 Applying Multiple Labels to Topics
As noted in Section 3.1, each topic in our data-set can be composed of zero ormore NFRs. For example, a commit message might address reliability in thecontext of efficiency, or make amaintainability improvement in the source codethat relates to usability. However, traditional machine learning techniques,such as Naive Bayes, can map topics to only a single class. The Mulan [29]library encapsulates several different multi-label machine learners which canlabel elements with multiple labels. Mulan also includes methods for deter-mining the performance of these learners.
Two perspectives used to evaluate multi-label learners are with micro ormacro measurements (shown in Figure 4a). Macro measurements are aggre-gated at a class or label level (per class) while micro measurements are at theelement level (per element). A macro-ROC measurement is the average ROCover the ROC values for all labels, where a micro-ROC is the average ROCover all examples that were classified. For MaxDB, the macro-ROC values areundefined because of poor performance of one of the labels.During cross-foldsvalidation if the class imbalance or poor learner performance causes a divisionby zero when evaluating one of the NFR labels (in this case usability), cre-
1 2 3 4 5 6 7 8 9 10 11 12 13 14 15 16 17 18 19 20 21 22 23 24 25 26 27 28 29 30 31 32 33 34 35 36 37 38 39 40 41 42 43 44 45 46 47 48 49 50 51 52 53 54 55 56 57 58 59 60 61 62 63 64 65

Automated Topic Naming 17
BR CLR HOMER
1
0.4
0.5
0.6
0.7
0.8
0.9!"#$%&'(
!"#$%&')
(a) Macro-ROC
BR CLR HOMER
1
0.4
0.5
0.6
0.7
0.8
0.9!"#$%&'('
!"#$%&')
(b) Micro-ROC
Fig. 5 Author #1 and author #2 ROC results for PostgreSQL.
ating an undefined value. This undefined value is propagated through to themean of ROC per NFR label, causing the end calculation of macro-ROC tobe undefined.
Figure 4 presents the results of Mulan’s best multi-label learners for theMaxDB and MySQL projects, and Figure 5 for PostgreSQL. Calibrated LabelRanking (CLR) is a learner that builds two layers. The first layer determinesif an entity should be labelled, while the second layer determines what labelsshould be assigned. The Hierarchy Of Multi-label classifiERs (HOMER) andBinary Relevance (BR) act as a hierarchy of learners: BR is flat, while HOMERtries to build a deeper hierarchy for a more accurate learner [29].
Figure 5 shows the ROC results for the PostgreSQL product. In this figure,we show the relative differences when we use different training data-sets fromdifferent annotators. In 5a we see that ROC results are very similar. In theother figure, however, author #1 has dramatically better performance. Wespeculate that this is due to the particular annotation decisions made by author#1; in some sense he performed better. The difference in Macro-ROC was notsignificant, but the difference in Micro-ROC was, as the p-value of Student’sT-test was < 0.001.
These classifiers performed better than other multi-label classifiers as theyhave the best micro and macro ROC scores. The multi-label and single-labellearners had similar performance: for MySQL, BR and Naive Bayes had similarmacro-ROC scores of 0.74.
4 Understanding Software Maintenance Activities
As we mentioned in the introduction, a key issue in software maintenance isunderstanding why a system has evolved the way it has. In this section wedemonstrate the value of labelled topic extraction in addressing this issue.
1 2 3 4 5 6 7 8 9 10 11 12 13 14 15 16 17 18 19 20 21 22 23 24 25 26 27 28 29 30 31 32 33 34 35 36 37 38 39 40 41 42 43 44 45 46 47 48 49 50 51 52 53 54 55 56 57 58 59 60 61 62 63 64 65

18 Abram Hindle et al.
Labelled topics address why questions by associating a commit with the un-derlying software qualities which motivated that change. The how of a changeis the change itself, the software quality behind it, the why is what we areafter. We investigate the history of the three large-scale database systems thatwe studied. We use our technique to show the topic of development effortsover time in each project. We motivated our investigation with three researchquestions:
RQ1. Do NFR frequencies change over time? If a particular NFR was of moreinterest at one point in the life-cycle than another, this suggests that devel-opment activity shifted focus. For example, if a developer expected to seea recent focus on reliability, but instead usability dominated, they mightre-prioritize upcoming work items.
RQ2. Do projects differ in their relative interest in NFRs? A project manager,especially a systems-manager, would be interested in knowing whether aparticular NFR, such as reliability, was more important for one projectthan another. This question could be used to confirm the initial designgoals, or to track the progress on that quarter’s objectives. The differencein NFR proportion is interesting because it implies a difference in focusbetween projects.
RQ3. Do different developers work on different NFRs? For a given project, it isreasonable to think that developers are either assigned (in commercial orga-nizations) or choose (in open-source organizations) to work on a particularNFR. For example, one developer might be more junior, and take respon-sibility for the low-impact reliability fixes. Another, more senior developermight assume responsibility for major improvements such as efficiency im-provements.
Topic time-lines are depicted in Figures 6a, 6b and 6c. These topic time-lines show the temporal patterns of NFR frequencies. This is generated fromthe manually annotated topics, although this visualization can be generatedfrom the results of labelled topic extraction. Note that there are no unlabelledtopics in this data-set.
There are two measures represented. One, the relative frequency, shown inthe grey histogram boxes, represents the number of topics with that NFR inthat period, relative to the maximum number of topics assigned to the NFR.For example, in Figure 6a we see a spike in portability and functionality fre-quency in September 2002. The second, absolute frequency, is shown using cellintensity, and compares the number of topics labelled with the NFR per periodrelative to the maximum number of labelled topics overall. For instance, Figure6a shows that the NFRs functionality, portability and maintainability containmore labelled topics, since these NFRs have been more intensely shaded. Oneinteresting stream is efficiency in PostgreSQL, which shows periodic activity,and suggests that efficiency-related changes have longer lasting effects. A moresystematic analysis of periodicity is necessary to properly conclude this. Thetopmost row in each diagram lists historical events for that project (such as arelease).
1 2 3 4 5 6 7 8 9 10 11 12 13 14 15 16 17 18 19 20 21 22 23 24 25 26 27 28 29 30 31 32 33 34 35 36 37 38 39 40 41 42 43 44 45 46 47 48 49 50 51 52 53 54 55 56 57 58 59 60 61 62 63 64 65

Automated Topic Naming 19
(a) MySQL 3.23
(b) MaxDB 7.500
(c) PostgreSQL 7.2
Fig. 6 NFR label per period. Each cell represents a 30-day period. Grid cell intensity(saturation) is mapped to label frequency relative to the largest label count of all NFRs.Grey histogram bars indicate label frequency relative to that particular NFR’s largest labelcount. Dashed vertical lines relate a project milestone (*Key events* ) to our topic windows.
We analyzed each project’s developer mailing list for external validation(the body of the email). We use labelled topic extraction to pick out the un-derlying NFR activity behind these events. For example, both MaxDB andMySQL show a high number of NFRs recognized at the first period of analy-sis. This is due to our window choice: we deliberately targeted our analysis to
1 2 3 4 5 6 7 8 9 10 11 12 13 14 15 16 17 18 19 20 21 22 23 24 25 26 27 28 29 30 31 32 33 34 35 36 37 38 39 40 41 42 43 44 45 46 47 48 49 50 51 52 53 54 55 56 57 58 59 60 61 62 63 64 65

20 Abram Hindle et al.
when both MySQL 3.23 and MaxDB 7.500 were first announced. For MaxDB,version 7.5.00 was released in December of 2003.We know that release 7.5.00.23saw the development of PHP interfaces, possibly accounting for the simulta-neous increase in the portability NFR at the same time. The gap in MaxDB(Figure 6b) is due to a shift in development focus (from February 2005 to June2005) to MaxDB 7.6, which is released in June 2005.
The development period of MySQL we studied (Figure 6a) saw the firstreleases to be licensed under the GPL. Version 3.23.31 (January, 2001) wasthe production release (non-beta), and the time-line view shows a flurry oftopics labelled with functionality and maintainability. After this point, thisversion enters the maintenance phase of its life-cycle. In May 2001, there isan increase in the number of topics labelled with portability. This might berelated to release 3.23.38, which focused on Windows compatibility. Similarly,in August, 2002, both functionality and portability are frequent, and mailinglist data suggests this is related to the release of version 3.23.52, a generalbug fix with a focus on security (a component of the functionality NFR in theISO9126 model). After this point, efforts shift to the newer releases (4.0, 4.1,5.0) and subsequently becomes more functionality oriented.
By contrast, the PostgreSQL time-line (Figure 6c) is extracted from a cen-tral trunk and is not version-specific (due to differences in how the projectsmanage branches). Therefore development tends to be focused on releases 7.3,7.4 and 7.5/8.0 alpha. For example, a priority for the 8.0 candidate was aWindows-native port of the source code, which seems to correlate with theportability NFR increasing in frequency in mid-2004. Before the 7.4 release,usability, functionality and portability all increase in frequency, possibly re-flecting the interest in adding features and documentation for the release. Inthe following sections we turn to our research questions:
4.1 RQ1: Do NFR Frequencies Change Over Time?
In both MaxDB and MySQL the frequencies generally decreased with age.However, there are variations within our NFR labels. In MySQL, usabilityand efficiency do not appear very often in topics. A proportionately smallernumber of commits addressed these NFRs. Certain peaks in topic numberscoincide with a particular emphasis from the development team on issues suchas new releases or bug fixes. This suggests that maintenance activity is notnecessarily strictly decreasing with time, but rather episodic and responsiveto outside stimuli. In MaxDB, we can observe that Maintainability topicsbecame more prevalent as MaxDB matures. This is likely due to our analysistime-frame for MaxDB being shorter than the time-frame for the MySQLproduct.
In PostgreSQL, by comparison, the frequencies seem to become somewhatcyclic, since we are not studying a maintenance-phase for the product, butrather ongoing feature addition and usability improvements.
1 2 3 4 5 6 7 8 9 10 11 12 13 14 15 16 17 18 19 20 21 22 23 24 25 26 27 28 29 30 31 32 33 34 35 36 37 38 39 40 41 42 43 44 45 46 47 48 49 50 51 52 53 54 55 56 57 58 59 60 61 62 63 64 65

Automated Topic Naming 21
4.2 RQ2: Do Projects Differ in Their Relative Topic Interest?
We found significant overall variation in the projects. MySQL 3.23 had propor-tionally more topics labelled functionality, while MaxDB had proportionallymore efficiency related topics. MaxDB was a very mature release “donated”to the open-source community, whereas MySQL was in its relative infancy,and security problems were more common (security is a component of func-tionality in the ISO9126 model). PostgreSQL had more NFR topics in general,but portability, functionality and usability were more prevalent in PostgreSQL.One notable difference between PostgreSQL and the other two projects is thatmany of the commits for PostgreSQL were UI changes and documentationchanges. PostgreSQL also seemed to focus more on reliability later in the casestudy than earlier like MySQL. In all cases portability was a constant main-tenance concern and was prevalent throughout the lifetime of the projects. Itmay surprise developers how often portability arises as a concern.
4.3 RQ3: Do Different Developers Work on Different NFRs?
We wanted to see whether developers in the PostgreSQL project6 worked onsimilar NFRs. For example, one developer might be a usability expert, whileanother developer is focused on security. We assume that the NFR labels as-sociated with a commit implicitly reflect work on those NFRs. Being able toreport on where effort is being expended is useful for tracking productivity(among other things). We explored this issue by extracting, for each topic inthe PostgreSQL data-set, the developer names responsible for the commitsused to generate that topic, and the NFRs that are associated with the topic.The analysis in this section used Neil’s annotations. This produced a mapwhich associated developer name with NFR labels. The six NFR labels (main-tainability, usability, efficiency, functionality, portability, reliability) and theNone label describe a 7-dimensional space (essentially a distribution), intowhich we can position developers, based on the frequency with which eachlabel occurs in the map.
Using this space, we first conducted pairwise X2 (chi-squared) tests andKolmogorov-Smirnov tests for each developer pair on their NFR distributions(18 developers, 306 pair-wise tests). We found that in 27% of these tests, thetwo developers were significantly different (i.e. distant in the 7-d space andhave significant p-values less than 0.05). This implies that there are developerswho focus on different NFRs or different proportions of NFRs, but the majorityof developers have similar NFR distributions.
In Figure 7 we clustered the developers from PostgreSQL using the Wardmethod of Hierarchical clustering on the 7-dimensional space. This will groupdevelopers according to the Euclidean distance metric. The height in Figure7 describes the euclidean distance between elements, in terms of the path We
6 Since the MySQL and MaxDB data had poor records for developer ids, we focused onPostgreSQL.
1 2 3 4 5 6 7 8 9 10 11 12 13 14 15 16 17 18 19 20 21 22 23 24 25 26 27 28 29 30 31 32 33 34 35 36 37 38 39 40 41 42 43 44 45 46 47 48 49 50 51 52 53 54 55 56 57 58 59 60 61 62 63 64 65

22 Abram Hindle et al.
mom
jian tgl
thom
as
inou
e
ishi
i
teod
or
darc
y
scra
ppy
jurk
a
joe
denn
is
wie
ck
pgsq
l pete
re
mes
kes
dave
c
neilc
barry
020
040
060
080
010
0012
00Cluster Dendrogram
Organized into 2 and 6 clustersPostgreSQL Authors
Hei
ght
Fig. 7 PostgreSQL Author Clusters: Authors clustered by Euclidean distance of their NFRcontributions. The outer rectangles (black) reflect the clustering of authors into 2 clusters;while the inner rectangles (dim grey) reflect clustering of authors into 6 clusters. The heightis a measure of cluster similarity, Euclidean distance, where smaller values are more similar.Individuals that share branches are more similar to each other individuals who do not. Thelonger the path, in terms of height, between two individuals, the more different their NFRcontributions are.
clustered the authors into both 2-clusters and 6-clusters. We chose 6-clustersbecause the difference in distance between entities and centroids was minimalat 6-clusters, and the derivative of distance was the highest in that region aswell.
Figure 7 shows that when we use 6-clusters, petere, one of the majorcontributors, is in his own cluster while two other major contributors, tgl andmomjian form their own cluster (i.e., they are distant from one another in the7-dimensional space). This is interesting because it means that the importantdevelopers are have different proportions of NFR-relevant contributions; theyhave different focuses during development. In terms of the 2-clusters, we cansee that momjian and tgl are in the same cluster, but petere is not. The mostfrequent committers do not share the same clusters, even at the coarsest level
1 2 3 4 5 6 7 8 9 10 11 12 13 14 15 16 17 18 19 20 21 22 23 24 25 26 27 28 29 30 31 32 33 34 35 36 37 38 39 40 41 42 43 44 45 46 47 48 49 50 51 52 53 54 55 56 57 58 59 60 61 62 63 64 65

Automated Topic Naming 23
NFR Developer
Usability dennis, neilcPortability scrappy, meskesEfficiency inoue, neilcReliability jurka, joeFunctionality thomas, weickMaintainability scrappy, ishii
Table 3 Developer interest in NFRs
of clustering, 2 clusters. This implies that developers in this sample do workon different sets of NFRs and have different software quality focuses.
If we compare the global NFR distribution (that is, the relative globalfrequency of each NFR label) to each author we find that 25% of the authorshave a similarity (Pearson correlation) of 0.47 or less. In other words, forthese authors (gathered to the lower left of Figure 8), their NFR distributiondoes not match well with the global distribution. Authors momjian and tglare in the top right of Figure 8, dominate in topic count and commit count,and so are very similar to the global distribution of NFR topics. Figure 8demonstrates that although a few authors dominate in the number of commits,many authors exhibit different behaviour in terms of the NFR-relevant topicsof their commits. Furthermore, there are no authors in the top left corner,indicating that the authors who commit less, do not contribute with a similarNFR-topic distribution as momjian or tgl. We found that number of commitscorrelated with an author’s similarity to the global NFR distribution (0.59Pearson), i.e., the variables “number of topics associated with a developer”and “number of commits” are not discriminative.
Our working theory is that less frequent committers are more specialized,e.g., interested in a specific NFR, while the main developers (i.e., frequentcommitters) either have wider responsibility or have more time to be widelyinvolved. An interesting extension would be to compare this data with thePostgreSQL source code files, to see which developer touched which file.
We say that an author (read developer) is “proportionately interested” inan NFR if, for all NFRs with which he or she is associated, a given NFRreceives the plurality of his or her commits. This is a measure of relativeinterest and is independent of number of commits (subject to the caveat aboutfrequent committers, above). If we look at which of the top 15 developers wereproportionately interested in a given NFR, we find the associations identifiedin Table 3. Our data also showed that for these top developers, between 1/10and 1/3 of their commits were labelled with a single NFR.
Based on Figure 8 we wanted to see which clusters momjian, tgl, andpetere would be in if we evaluated the clusters proportionately, that is ifwe use distance measures that normalize the data and ignore magnitude (e.g.turning an author’s NFR contributions into a histogram or unit-vector) suchas cosine distance, Euclidean distance of unit vectors, or Pearson correlationdistance (1−r). Whereas, Euclidean distance uses both angle and magnitude of
1 2 3 4 5 6 7 8 9 10 11 12 13 14 15 16 17 18 19 20 21 22 23 24 25 26 27 28 29 30 31 32 33 34 35 36 37 38 39 40 41 42 43 44 45 46 47 48 49 50 51 52 53 54 55 56 57 58 59 60 61 62 63 64 65

24 Abram Hindle et al.
0.4 0.6 0.8 1.0
020
040
060
080
010
00Author Correlation with NFR distribution versus # of Author Topics
Similarity of Author NFR topics to global distribution
# of
Top
ics
asso
ciat
ed w
ith A
utho
r
momjian
thomasdavecneilc
ishii
darcy
barry
wieckinoue
pgsqlteodor
jurka
tgl
scrappy
petere
dennis
meskes
joe
Fig. 8 Author commit count versus the similarity of the NFR distribution of an Author tothe Global Distribution of NFR topics. Similarity is Pearson correlation between the countsof NFR relevant topics associated with an Author and the total counts of NFR relevanttopics.
a vector. For all three non-magnitude distances measures we tend to see thatthe three largest contributors, momjian, tgl, and petere inhabit the sameclusters when we use 2-clusters or 6-clusters. This confirms the observationsin Figure 8, which uses Pearson correlation, that the larger contributors tendto be proportionally similar.
One potential confound for this analysis is that we could be describing de-veloper style instead of developer focus. Developer style would be a developer’slikelihood to use terms found within our dictionaries and training corpus intheir commit messages. Furthermore, a top developer, in terms of number ofcommits, will have more samples, and thus be more likely take on a moregeneral role. For example, we found in a previous project [16] that there was agood correlation between the words used to describe a commit and the authorof the commit.
1 2 3 4 5 6 7 8 9 10 11 12 13 14 15 16 17 18 19 20 21 22 23 24 25 26 27 28 29 30 31 32 33 34 35 36 37 38 39 40 41 42 43 44 45 46 47 48 49 50 51 52 53 54 55 56 57 58 59 60 61 62 63 64 65

Automated Topic Naming 25
Cohen’s Kappa Spearman CorrelationPortability 0.154 0.253Functionality -0.014 -0.014Reliability 0.005 0.005Maintainability 0.082 0.082Efficiency 0.231 0.258Usability 0.009 0.014None 0.062 0.081Everything 0.107 0.108
Table 4 Inter-rater Reliability on PostgreSQL
5 Discussion
5.1 Annotation Observations
We found many topics that were not non-functional requirements (NFRs) butwere often related to them. For instance, concurrency was mentioned often inthe commit logs and was related to correctness and reliability, possibly becauseconcurrent code is prone to bugs such as race conditions. Topics related toconfiguration management and source control appeared often; these kinds ofchanges are slightly related to maintainability. A non-functional change thatwas not quality-related was licensing and copyright; many changes concernedupdating copyrights or ensuring copyright or license headers were applied tofiles. In these cases we assigned the None label to the topic.
We noticed that occasionally the names of modules would conflict withwords related to other non-functional requirements. For instance, optimizersare very common modules in database systems: all three projects, MySQL,MaxDB, and PostgreSQL have optimizer modules. In MySQL the optimizeris mentioned but often the change addresses correctness or another quality.Despite this difference, the name of the module could fool our learners intobelieving the change was always about efficiency. In these cases the advantagesof tailoring topic names to specific project terminologies are more clear. Projectspecific word-lists would avoid automated mistakes due to the names of entitiesand modules of a software project.
5.2 Inter-rater reliability
To determine inter-rater reliability two of the authors—Ernst and Hindle—each annotated the PostgreSQL topics, and then evaluated each other’s anno-tations. Table 4 describes the Cohen Kappa and the Spearman correlation ofour per-topic annotations for each NFR. We evaluated inter-rater reliabilityusing each NFR, because a single topic could be tagged with more than oneNFR.
These results are fairly poor. The aggregate view of a Kappa of 0.1 in-dicates there is some weak agreement. We found that there was good agree-ment in terms of lack of an annotation, but disagreement regarding which
1 2 3 4 5 6 7 8 9 10 11 12 13 14 15 16 17 18 19 20 21 22 23 24 25 26 27 28 29 30 31 32 33 34 35 36 37 38 39 40 41 42 43 44 45 46 47 48 49 50 51 52 53 54 55 56 57 58 59 60 61 62 63 64 65
26 Abram Hindle et al.
annotation to apply. After some discussion we concluded that usability wasa primary source of disagreement. For instance, should we annotate a com-mit which updates the user manual as a usability-related change? Is addinga command-line option a usability issue? These kinds of questions illustratesome of the agreement, disagreement, and ambiguity about these labels. Wetherefore recommend that future annotators train and discuss how and whenan annotation is appropriate. This ought to be easier to do if an internal teamis using our tool, since (presumably) there is a greater shared understandingof project activities, and therefore, potentially greater rater agreement.
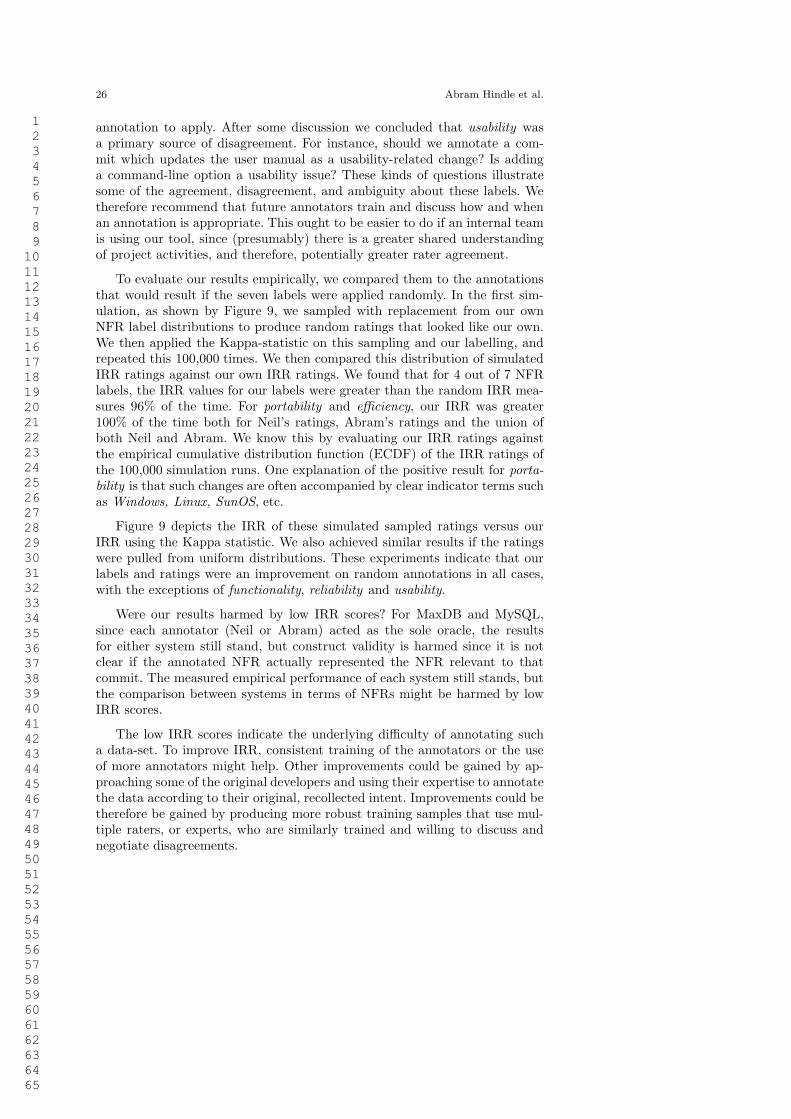
To evaluate our results empirically, we compared them to the annotationsthat would result if the seven labels were applied randomly. In the first sim-ulation, as shown by Figure 9, we sampled with replacement from our ownNFR label distributions to produce random ratings that looked like our own.We then applied the Kappa-statistic on this sampling and our labelling, andrepeated this 100,000 times. We then compared this distribution of simulatedIRR ratings against our own IRR ratings. We found that for 4 out of 7 NFRlabels, the IRR values for our labels were greater than the random IRR mea-sures 96% of the time. For portability and efficiency, our IRR was greater100% of the time both for Neil’s ratings, Abram’s ratings and the union ofboth Neil and Abram. We know this by evaluating our IRR ratings againstthe empirical cumulative distribution function (ECDF) of the IRR ratings ofthe 100,000 simulation runs. One explanation of the positive result for porta-bility is that such changes are often accompanied by clear indicator terms suchas Windows, Linux, SunOS, etc.
Figure 9 depicts the IRR of these simulated sampled ratings versus ourIRR using the Kappa statistic. We also achieved similar results if the ratingswere pulled from uniform distributions. These experiments indicate that ourlabels and ratings were an improvement on random annotations in all cases,with the exceptions of functionality, reliability and usability.
Were our results harmed by low IRR scores? For MaxDB and MySQL,since each annotator (Neil or Abram) acted as the sole oracle, the resultsfor either system still stand, but construct validity is harmed since it is notclear if the annotated NFR actually represented the NFR relevant to thatcommit. The measured empirical performance of each system still stands, butthe comparison between systems in terms of NFRs might be harmed by lowIRR scores.
The low IRR scores indicate the underlying difficulty of annotating sucha data-set. To improve IRR, consistent training of the annotators or the useof more annotators might help. Other improvements could be gained by ap-proaching some of the original developers and using their expertise to annotatethe data according to their original, recollected intent. Improvements could betherefore be gained by producing more robust training samples that use mul-tiple raters, or experts, who are similarly trained and willing to discuss andnegotiate disagreements.
1 2 3 4 5 6 7 8 9 10 11 12 13 14 15 16 17 18 19 20 21 22 23 24 25 26 27 28 29 30 31 32 33 34 35 36 37 38 39 40 41 42 43 44 45 46 47 48 49 50 51 52 53 54 55 56 57 58 59 60 61 62 63 64 65

Automated Topic Naming 27
Portability Functionality Reliability Maintainability Efficiency Usability None
−0.2
0.0
0.2
0.4
0.6
0.8
1.0
Human Ratings ( Both ) versus Sampled Random Ratings
Interrater Reliability per NFR Topic Label
Fig. 9 Measured IRR versus IRR of random labeling simulations. Perfect IRR is 1.0. Thered line and points highlight the measured inter-rater reliability of NFR topics labels betweenannotators of PostgreSQL. The box-plots are the distribution of 100,000 IRR ratings betweenrandom simulation, drawn from our distribution of ratings, and our labelling of NFRs. Notehow for 4 of the 7 NFRs the measure IRR is distinctly higher than the median of thesimulations.
5.3 Summary of Techniques
While an unsupervised technique such as LDA is appealing in its lack of hu-man intervention, and thus lower effort, supervised learners have the advan-tage of domain knowledge, which typically means improved results. Creatingannotated topics (i.e., manual labels) for training is painstaking, but with asuitably representative set of topics, we feel that the effort is acceptable fornon-academic use. To annotate all topics took us approximately 20 hours perproject, but we estimate only 10% of the topics need annotation to produceuseful results.
Very rarely did exp2 and exp3 (semi-unsupervised word matching) everperform as well as the supervised machine learners. For MaxDB, reliabilitywas slightly better detected using the static word list of exp2. In general, themachine learners and exp3 did better than exp2 for MySQL and MaxDB, yetfor PostgreSQL the exp2 word-lists performed better. For both MySQL andMaxDB usability was better served by exp2. Usability was a very infrequentlabel, however, which made it difficult to detect for both approaches.
The semi-unsupervised labelling had difficulty distinguishing between com-mon labels and infrequent labels. The learners would occasionally mislabel atopic deserving of an infrequent label with a more common label. The word-lists for correctness tended to be too lengthy, non-specific and broad, especially
1 2 3 4 5 6 7 8 9 10 11 12 13 14 15 16 17 18 19 20 21 22 23 24 25 26 27 28 29 30 31 32 33 34 35 36 37 38 39 40 41 42 43 44 45 46 47 48 49 50 51 52 53 54 55 56 57 58 59 60 61 62 63 64 65

28 Abram Hindle et al.
if WordNet words were used, since the NFRs are typically loosely defined con-cepts in common parlance.
We found that the multi-label learners of BR, CLR and HOMER performedonly as well or worse for Macro-ROC as the single-label Naive Bayes andother naive Bayes-derived learners. This suggests that by combining togethermultiple Naive Bayes learners we could probably label sets of topics effectively,but it would require a separate Naive Bayes learner per label.
With ROC values ranging from 0.6 to 0.8 for MySQL and MaxDB and 0.47to 0.6 for PostgreSQL, we can see there is promise in supervised methods. exp2and exp3 both indicate that static information can be used to help label top-ics without any training whatsoever. MySQL and MaxDB’s machine learnersmade some decisions based off a few shared words: bug, code, compiler, data-
base, HP UX, delete, memory, missing, problems, removed, add, added, changed,
problem, and test. Adding these words to the word-lists of exp2 and exp3 couldimprove performance while ensuring they were only domain specific.
If the techniques used in exp2 and exp3 were combined with the supervisedtechniques, we could reduce the training effort by boosting training sets withtopics classified with the semi-unsupervised techniques. Both Naive Bayesianlearners and the word-list approaches were computationally efficient. Low F-measures and ROC scores are a concern for some of these techniques, perhapsthe word lists need to be re-enforced or made robust in the face of heavyclass imbalance. These results are promising because they indicate that thesetechniques are accurate enough to be useful while still maintaining acceptablerun-time performance.
While this work focuses on labelling natural language commit log com-ments, we feel it can be adapted to other natural language software artifacts,such as mailing-list discussions and bug reports. Bug reports might not exhibitthe same behaviour as commits in terms of dominant topics.
5.4 Threats to Validity
Our work faced multiple threats to validity and we have attempted to addressthem:
Construct validity – we used only commit messages rather than mail or bugtracker messages. To extend further we would need matching repositories foreach project. Possibly they would have influenced our results, but there wouldbe a degree of correlation between the corpora. It is possible for a given labelto occur across the arbitrary 30-day boundary we set. We suspect but have notproved that this is insignificant. Our taxonomy for software NFRs is subjectto dispute, but seems to be generally accepted. A future approach shouldconsider a different taxonomy, such as one created by surveying developers onwhat “types” of tasks they work on. Finally, there are exogenous sources, suchas in-person discussions, which we did not access.
1 2 3 4 5 6 7 8 9 10 11 12 13 14 15 16 17 18 19 20 21 22 23 24 25 26 27 28 29 30 31 32 33 34 35 36 37 38 39 40 41 42 43 44 45 46 47 48 49 50 51 52 53 54 55 56 57 58 59 60 61 62 63 64 65

Automated Topic Naming 29
Our word-lists were built up of words that were assumed to be relevant tothose topics, our automated analysis was ignorant of the multi-uses of wordsand thus topics could be flagged inappropriately. For instance, if the wordredundancy is used would it reference reliability or cloned code? This issueis why we checked the performance of the techniques, although we did notexplicitly check for these cases.
Developer style is another confounding issue; if we are searching for wordsin a word-list, we are relying on developers to use these words. This studymight be exploiting the behaviour or style of a few developers. If one devel-oper did not describe their commits well or used fewer terms it is likely theywould be associated with a NFR topic regardless of the actual purpose of theircommits.
Internal validity – We improved internal validity by trying to correlate andexplain the behaviours observed in the analysis with the historical records ofthe projects. We did not attempt to match our results to any particular model.
PostgreSQL was larger than MySQL and MaxDB. This imbalance in size,combined with the choice of 20 topics per month produced topics that repre-sented too many issues or threads within PostgreSQL’s development. Choiceof number of topics should probably be tuned to the project.
We primarily relied on ROC (the area under the receiver operating char-acteristic curve), as our measurement to compare the effectiveness of semi-unsupervised and supervised learners. ROC is less biased than F-Measure incross-folds validation [11,12] in the case of class imbalance. We feel that thefixed point of 0.5 for random results allows us to better describe the pre-dictability achieved by some of these techniques against random and ZeroRlearners. We also include F-Measure results to allow for the reader to validateagainst F-Measure if they are more comfortable with it. Thus because of F-Measure’s biased handling of class-imbalance and the inherent class-imbalancethat our data suffers from we chose ROC.
One potential issue with some of our results is that we often achieved verylow ROC and F-Measure scores. Performance was not uniformly low, as themore common classes often exhibited better performance than the more rareclasses. Often this was amplified by class imbalance. In our future work we planto investigate techniques such as sub-sampling and boot-strapping in order toimprove performance. Some of the ROC performance could be due to a lack ofcoherence in tagging which was shown by our low inter-rater reliability score.Inter-rater reliability is a threat, and we discussed it in Section 5.2.
External validity – Our data originated from OSS database projects and thusmight not be applicable to commercially developed software or other domains.Furthermore, our analysis techniques rely on a project’s use of meaningful com-mit messages, although we feel this is the most frequently occurring form ofdeveloper comments. While we tried to control for application domain variabil-ity, OSS projects investigated were database systems, thus our results mightnot generalize well to other domains. Generalizability is enhanced by the fact
1 2 3 4 5 6 7 8 9 10 11 12 13 14 15 16 17 18 19 20 21 22 23 24 25 26 27 28 29 30 31 32 33 34 35 36 37 38 39 40 41 42 43 44 45 46 47 48 49 50 51 52 53 54 55 56 57 58 59 60 61 62 63 64 65

30 Abram Hindle et al.
that all three projects were maintained by different developers and differentteams using different development processes.
Reliability – each annotator, the first two authors, followed the same protocoland used the same annotations. However, only two annotators were used; theirannotations exhibit some bias as suggested by the weak inter-rater reliabilityfor PostgreSQL. Inter-rater reliability could not be checked for MySQL andMaxDB because annotators did not rate the same documents. This is discussedat length in Section 5.2.
5.5 Future Work
There are several avenues of further investigation. More external validationwould be useful. Although we validated our comparisons using a mailing listfor each project, interviews with developers would provide more detail. Wealso think multi-label learning techniques, although in their infancy, are crucialin understanding cross-cutting concerns such as NFRs. We want to leveragedifferent kinds of artifacts to discover threads of NFR-related discussions thatoccur between multiple kinds of artifacts. Finally, we would like to extendthis analysis to other domains, to see what patterns might occur within thosedomains, such as consumer-facing software products.
6 Conclusions
This paper presented a cross-project data mining technique, labelled topicextraction. Previous topic analysis research produced project-specific topicsthat needed to be manually labelled. To improve on this, we leveraged soft-ware engineering standards, specifically the ISO9126 quality taxonomy, to pro-duce a method of partially-automated (supervised) and fully-automated (semi-unsupervised) topic labelling. Since the word-list technique is not project-specific, we used it to compare three distinct projects, where we showed ourtechnique produced interesting insight into maintenance activity.
We validated our topic labelling techniques using multiple experiments.We first conducted semi-unsupervised labelling using word-lists. Our next ap-proach was supervised, using single-label and multi-label learners. Both kindsof learners performed well with average ROC values between 0.6 and 0.8.These results were confounded by our low inter-rater reliability score on thePostgreSQL data-set, suggesting that annotators need careful and thoughtfultraining. With appropriate rigor in annotation, these results, along with theperformance of our learners, demonstrate that labelled topic extraction canbe a promising approach for understanding the occurrence of non-functionalrequirements in software projects.
Our data and scripts are available at http://softwareprocess.es/nomen/
1 2 3 4 5 6 7 8 9 10 11 12 13 14 15 16 17 18 19 20 21 22 23 24 25 26 27 28 29 30 31 32 33 34 35 36 37 38 39 40 41 42 43 44 45 46 47 48 49 50 51 52 53 54 55 56 57 58 59 60 61 62 63 64 65
Automated Topic Naming 31
References
1. Baldi, P.F., Lopes, C.V., Linstead, E.J., Bajracharya, S.K.: A theory of aspects aslatent topics. In: Conference on Object Oriented Programming Systems Languages andApplications, pp. 543–562. Nashville (2008)
2. Blei, D.M., Ng, A.Y., Jordan, M.I.: Latent Dirichlet Allocation. Journal of MachineLearning Research 3(4-5), 993–1022 (2003). DOI 10.1162/jmlr.2003.3.4-5.993
3. Bøegh, J.: A New Standard for Quality Requirements. IEEE Software 25(2), 57–63(2008). DOI 10.1109/MS.2008.30
4. Boehm, B., Brown, J.R., Lipow, M.: Quantitative Evaluation of Software Quality. In:International Conference on Software Engineering, pp. 592–605 (1976)
5. Chung, L., Nixon, B.A., Yu, E.S., Mylopoulos, J.: Non-Functional Requirements inSoftware Engineering, International Series in Software Engineering, vol. 5. KluwerAcademic Publishers, Boston (1999)
6. Cleland-Huang, J., Settimi, R., Zou, X., Solc, P.: The Detection and Classification ofNon-Functional Requirements with Application to Early Aspects. In: InternationalRequirements Engineering Conference, pp. 39–48. Minneapolis, Minnesota (2006). DOI10.1109/RE.2006.65
7. Ernst, N.A., Mylopoulos, J.: On the perception of software quality requirements duringthe project lifecycle. In: International Working Conference on Requirements Engineer-ing: Foundation for Software Quality. Essen, Germany (2010)
8. Fawcett, T.: An introduction to ROC analysis. Pattern Recognition Letters 27(8), 861– 874 (2006)
9. Fellbaum, C. (ed.): WordNet: An Electronic Lexical Database. MIT Press (1998)10. Few, S.: Information Dashboard Design: The Effective Visual Com-
munication of Data, 1 edn. O’Reilly Media (2006). URLhttp://www.amazon.com/exec/obidos/redirect?tag=citeulike07-20&path=ASIN/0596100167
11. Flach, P.: The geometry of roc space: understanding machine learning met-rics through roc isometrics. In: Proc. 20th International Conference onMachine Learning (ICML’03), pp. 194–201. AAAI Press (2003). URLhttp://www.cs.bris.ac.uk/Publications/Papers/1000704.pdf
12. Forman, G., Scholz, M.: Apples-to-apples in cross-validation studies: pit-falls in classifier performance measurement. SIGKDD Explor. Newsl. 12,49–57 (2010). DOI http://doi.acm.org/10.1145/1882471.1882479. URLhttp://doi.acm.org/10.1145/1882471.1882479
13. German, D.M.: The GNOME project: a case study of open source, global softwaredevelopment. Software Process: Improvement and Practice 8(4), 201–215 (2003). DOI10.1002/spip.189
14. Hall, M., Frank, E., Holmes, G., Pfahringer, B., Reutemann, P., Witten, I.H.: TheWEKA Data Mining Software: An Update. SIGKDD Explorations 11(1), 10–18 (2009).URL http://www.kdd.org/explorations/issues/11-1-2009-07/p2V11n1.pdf
15. Hindle, A., Ernst, N.A., Godfrey, M.W., Mylopoulos, J.: Automated topic naming tosupport cross-project analysis of software maintenance activities. In: International Con-ference on Mining Software Repositories (2011)
16. Hindle, A., German, D.M., Holt, R.: What do large commits tell us?: a taxonomicalstudy of large commits. In: MSR ’08: Proceedings of the 2008 international workingconference on Mining software repositories, pp. 99–108. ACM, New York, NY, USA(2008). DOI http://doi.acm.org/10.1145/1370750.1370773
17. Hindle, A., Godfrey, M.W., Holt, R.C.: Release Pattern Discovery via Partitioning:Methodology and Case Study. In: International Workshop on Mining Software Reposi-tories at ICSE, pp. 19–27. Minneapolis, MN (2007). DOI 10.1109/MSR.2007.28
18. Hindle, A., Godfrey, M.W., Holt, R.C.: What’s hot and what’s not: Windowed developertopic analysis. In: International Conference on Software Maintenance, pp. 339–348.Edmonton, Alberta, Canada (2009). DOI 10.1109/ICSM.2009.5306310
19. Software engineering – Product quality – Part 1: Quality model. Tech. rep., InternationalStandards Organization - JTC 1/SC 7 (2001)
20. Kayed, A., Hirzalla, N., Samhan, A., Alfayoumi, M.: Towards an ontology for softwareproduct quality attributes. In: International Conference on Internet and Web Applica-tions and Services, pp. 200–204 (2009). DOI 10.1109/ICIW.2009.36
1 2 3 4 5 6 7 8 9 10 11 12 13 14 15 16 17 18 19 20 21 22 23 24 25 26 27 28 29 30 31 32 33 34 35 36 37 38 39 40 41 42 43 44 45 46 47 48 49 50 51 52 53 54 55 56 57 58 59 60 61 62 63 64 65

32 Abram Hindle et al.
21. Kohavi, R.: A study of cross-validation and bootstrap for accuracy estimation and modelselection. In: International Joint Conference On Artificial Intelligence, pp. 1137–1143.Toronto (1995). URL http://portal.acm.org/citation.cfm?id=1643047
22. Marcus, A., Sergeyev, A., Rajlich, V., Maletic, J.: An information retrieval approach toconcept location in source code. In: 11th Working Conference on Reverse Engineering,pp. 214–223 (2004). DOI 10.1109/WCRE.2004.10
23. Massey, B.: Where Do Open Source Requirements Come From (And What Should WeDo About It)? In: Workshop on Open source software engineering at ICSE. Orlando,FL, USA (2002)
24. McCall, J.: Factors in Software Quality: Preliminary Handbook on SoftwareQuality for an Acquisiton Manager, vol. 1-3. General Electric (1977). URLhttp://oai.dtic.mil/oai/oai?verb=getRecord&metadataPrefix=html&identifier=ADA049055
25. Mei, Q., Shen, X., Zhai, C.: Automatic labeling of multinomial topic models. In: Inter-national Conference on Knowledge Discovery and Data Mining, pp. 490–499. San Jose,California (2007). DOI 10.1145/1281192.1281246
26. Mockus, A., Votta, L.: Identifying reasons for software changes using his-toric databases. In: International Conference on Software Maintenance, pp.120–130. San Jose, CA (2000). DOI 10.1109/ICSM.2000.883028. URLhttp://ieeexplore.ieee.org/lpdocs/epic03/wrapper.htm?arnumber=883028
27. Scacchi, W., Jensen, C., Noll, J., Elliott, M.: Multi-Modal Modeling, Analysis and Val-idation of Open Source Software Requirements Processes. In: International Conferenceon Open Source Systems, vol. 1, pp. 1—-8. Genoa, Italy (2005)
28. Treude, C., Storey, M.A.: ConcernLines: A timeline view of co-occurring concerns. In:International Conference on Software Engineering, pp. 575–578. Vancouver (2009)
29. Tsoumakas, G., Katakis, I., Vlahavas, I.: Mining multi-label data. In: O. Maimon,L. Rokach (eds.) Data Mining and Knowledge Discovery Handbook, 2nd edn. Spring(2010)
1 2 3 4 5 6 7 8 9 10 11 12 13 14 15 16 17 18 19 20 21 22 23 24 25 26 27 28 29 30 31 32 33 34 35 36 37 38 39 40 41 42 43 44 45 46 47 48 49 50 51 52 53 54 55 56 57 58 59 60 61 62 63 64 65