automated test & measurement system for a power supply and
TRANSCRIPT

Paper ID #14667
Automated Test & Measurement System for a Power Supply and ControlBoard
Prof. David R. Loker, Pennsylvania State University, Erie
David R. Loker received the M.S.E.E. degree from Syracuse University in 1986. In 1984, he joinedGeneral Electric (GE) Company, AESD, as a design engineer. In 1988, he joined the faculty at Penn StateErie, The Behrend College. In 2007, he became the Chair of the Electrical and Computer EngineeringTechnology Program. His research interests include wireless sensor networks, data acquisition systems,and communications systems.
Mr. Stephen A. Strom, Pennsylvania State University, Erie
Stephen Strom is a lecturer in the Electrical and Computer Engineering Technology department of PennState Behrend, and holds a B.S. in electrical engineering from Carnegie Mellon University. His careerincludes over thirty years experience in designing and programming embedded systems and has multiplepatents for both hardware designs and software algorithms
c©American Society for Engineering Education, 2016

Automated Test & Measurement System for a Power Supply and Control Board
Abstract Junior-level students in the Electrical and Computer Engineering Technology program complete a 3-credit Measurements & Instrumentation course. There are three main sections of the course: (1) Programming applications using LabVIEW, (2) Data acquisition, sensors, and signal conditioning, and (3) Design of measurement systems. Weekly laboratory activities mirror the lecture materials. Part of the requirements in the course includes an end-of-semester team design project where one possible option is the design and implementation of an automated test & measurement system for a power supply and control board (PSCB). For this project, students design and build the PSCB to meet these requirements: one DC output voltage, one function generator output with user selectable waveform type (sinusoidal, triangular, square waveform) and user selectable amplitude and frequency adjustments, four simultaneous TTL outputs, and four simultaneous TTL inputs. The function generator is implemented using a Cypress Semiconductor Programmable System-On-Chip (PSoC) prototyping kit. Using a National Instruments data acquisition device with analog I/O and digital I/O capability, students design an automated test & measurement system for testing the PSCB. Software is implemented with a state machine using LabVIEW. The program provides instructions to the user, using pop-up windows and/or text indicators, during the test. The program also prompts the user for adjustments (pots, switches, etc.) during the test. Additionally, the program writes test data to a file on disk. The file contains the user name, time & date stamp, and the serial number of the PSCB. This paper provides a detailed listing of the engineering requirements for the project. For the software design, functional requirements and operating sequence are provided. A summary of the contents of student reference materials and the lab handout are also included. Assessment results showing grading statistics, lab report format, and grading rubric, are provided. Examples of student work are included, along with a project assessment. Recommendations are shown to help ensure student success on the project. Introduction to the Measurements and Instrumentation Course This is a required junior-level course for Electrical and Computer Engineering Technology students. The purpose of the course is several-fold: • Learn principles of LabVIEW programming. • Use LabVIEW to design software for programming PC-based data acquisition (DAQ)
systems • Understand various sensors and design signal conditioning circuits to interface the sensors to
DAQ systems • Integrate all of these components into the design of measurement systems This course is lab intensive and utilizes LabVIEW with a data acquisition (DAQ) device as a

primary vehicle for the design of measurement systems1-3. The course is 3 credits and consists of 2 hours of lecture and 2 hours of lab per week. The lecture content of the course is divided into three areas: Programming applications using LabVIEW (5 weeks), Data acquisition, sensors, and signal conditioning (4 weeks), and Design of measurement systems (7 weeks). LabVIEW is a graphical programming environment that allows a developer access to a wide variety of I/O and sensor interfaces, perform mathematical analysis, and link all of these operations to custom designed “control panels” or user interfaces. The lab content of the course is designed to reinforce concepts discussed during lecture. Each lab is considered a project since it lists a series of engineering requirements and requires 2 weeks to complete. Each project is completed by a student team that consists of no more than 2 students (some students prefer to work by themselves), where students pick their team members at the beginning of the semester. For nearly all of the projects, students are expected to work outside of the scheduled lab time in order to complete the objectives. Grading for the project consists of 60% based on meeting all of the engineering requirements, 30% based on the content of the lab report, and 10% based on spelling, grammar, and writing style. There is a 5% reduction for late lab report submittals. A listing of the projects for the course is shown below. • Lab 1: Software-defined Calculator Project (2 weeks) • Lab 2: Thermocouple Project (2 weeks) • Lab 3: Waveform Generator Project (2 weeks) • Lab 4: Digital Voltmeter Project (2 weeks) • Lab 5: Digital Multimeter Project (2 weeks) • Lab 6: Temperature Measurement System Project (2 weeks) In addition to the six lab projects, a final project is required for the course. The students can work in teams of two, or if a student prefers to work individually, they are awarded an extra 10% to compensate for their extra time and effort. Three weeks of scheduled lab time are provided at the end of the semester for students to work on their project. Some possible options for the project include: • Design and implementation of an automated test & measurement system for a power supply and
control board (PSCB). • Design of an elevator control system • Design of a conveyor control system • Joystick control of finch robot system The purpose of this paper is to describe the details about the automated test & measurement system project. This is a lab in which students use a PSoC 5LP board to generate a series of waveforms, and then use LabVIEW to design the automated test and measurement system. Students have previously used off-the-shelf function generator ICs, when they were readily available, to generate the waveforms.

Project Definition There are three primary objectives for this project: • Design of a power supply and control board (PSCB). • Design of an automated test and measurement system for testing the PSCB. • Software development using a state machine. This project fits within the course outcomes since it requires the students to: • Design a control board that includes designing a signal conditioning circuit for the function
generator output • Design an automated test system using LabVIEW • Implement each part of the project and combine them together to meet the overall engineering
requirements Engineering Requirements for the Project The students were given detailed engineering requirements for the power supply and control board (PSCB) as shown below. • One DC output voltage (3.3V) with tunable adjustment for accuracy within +/-0.01V. • One function generator output using the PSoC 5LP. A signal conditioning circuit (using op-
amps) will allow the user to adjust Vp-p and offset. The output waveform will have the following characteristics: o Sinusoidal, triangular, or square waveform output (through software, user selects 1 output at
a time) o Frequency adjustment (using PSoC software) from 10Hz to 1KHz o Peak-to-peak voltage adjustment from 0 to 5Vp-p (using external signal conditioning circuit
and pots) o DC offset adjustment (using pots) from -2.5V to +2.5V (using external signal conditioning
circuit and pots) • Four simultaneous TTL outputs with separate adjustment for each output logic level. • Four simultaneous TTL inputs with visual indicators to show the logic levels for each input.
• Two power supply input voltages to the PSCB (+/-15VDC). (Note that the PSoC board obtains its power from the PC USB port).
The students were given detailed engineering requirements for the automated test and measurement system for testing the PSCB as shown below. Special Features • Program designed using LabVIEW • Software development using a state machine • PSCB will be interfaced to an NI DAQ device • PSoC 5LP (with firmware pre-loaded) used for function generator

Functional Requirements: • The program provides instructions to the user, using pop-up windows and/or text indicators,
during the test. • The program prompts the user, using pop-up windows and/or text indicators, for adjustments
(pots, switches, etc.) during the test. • The program automatically displays measurement results during each test (e.g., frequency, peak-
to-peak amplitude, and offset for function generator test, etc.) • The program writes test data to a file on disk. The file will also contain the user name, time &
date stamp, and the serial number of the PSCB. Operating Sequence: • When the program is started, it provides instructions to the user to enter their name and the
serial number for the board. It also instructs the user to connect the PSCB to the DAQ, apply power to the PSCB, and press the start button when ready.
• Program then waits for the user to select the start button. • When the start button is selected, a dialog box appears asking if the user has entered their name
and the PSCB serial number, connected the PSCB to the DAQ, and connected power to the PSCB. The program then waits for the user to select yes or no. If no is selected, the program redisplays the same dialog box. If yes is selected, the program continues to the first test.
• For each test, text is provided to the user indicating the name of the test, how the test is to be performed, and how the user should respond once the test is performed. The program then waits for user input. If the test passed, the program continues to the next test. If the test failed, the program re-loops to the same test for another try. If the test continues to fail, the user will depress a stop button on the front panel to terminate the program.
• At the end of each test, the status for the test is updated on the front panel. • (For the function generator output test, each of the 3 possible waveform outputs is tested. For
each output waveform, 3 tests are performed – frequency, peak-to-peak amplitude, and offset). • When all of the tests have been performed, a text file is created. The file contains the user
name, PSCB serial number, time and date, each test performed, and whether each test passed or failed.
• The program prompts the user to see if another test should be performed. If another test is desired, the program re-loops back to the beginning of the program. If another test is not desired, the program terminates.
Documentation: • Students provide VI online description • Students provide title information on front panel • Students provide appropriate comments on block diagram Deliverables: • Soft copy of lab report

• Soft copies of VI and all SubVIs Power supply and control board (PSCB) At this point in the semester, students are expected to interpret a basic set of requirements and determine an approach to implement the project. The DC output voltage with tunable adjustment can be implemented by using an LM317, and schematic information is obtained from Figure 6 of the datasheets4. Potentiometer R2 is adjusted to obtain the proper voltage. The function generator can be implemented by using a Programmable System-On-Chip Prototyping Kit with onboard programmer and debugger (PSoC 5LP)5-6. A schematic for the firmware in the PSoC is shown in Figure 1. Waveform type, frequency, and amplitude are selected from a menu displayed in a terminal program, as indicated in Figure 2. Amplitudes for the waveforms range from 180mV to 820mV peak-to-peak. Thus, for proper voltage and DC offset ranges, students need to design a signal conditioning circuit using op-amps. One example of student work is shown in Figure 3. Two examples of student work for digital input and output are shown in Figures 4 and 5. Each figure shows only one channel with a visual indicator using an LED. Inverters are used to provide isolation between the PSCB and the DAQ device. This is primarily designed to provide some protection for the DAQ. However, inverters are also used to source sufficient current for the LEDs.

Figure 1. PSoC Creator Schematic for Waveform Generator
Figure 2. Waveform Generator Menu in HyperTerminal

Figure 3. Signal Conditioning Circuit for Waveform Generator Output
Figure 4. Digital input with visual indicator for PSCB
Figure 5. Digital output with visual indicator for PSCB

Data Acquisition (DAQ) Device A variety of DAQ devices have been used for this project, all from National Instruments7. The input/output requirements include 2 analog inputs, 4 digital outputs, and 4 digital inputs. The USB-6008 and myDAQ are sufficient to meet these requirements. Software Development Using their knowledge of LabVIEW, students need to determine the state machine and create a meaningful front panel for the project. An example program was provided for the students to reference. The example contains a template for a state machine that has a scan time of 100mS. Additionally, a video example of an automated test and measurement system was provided for the students. State Machine Template The state machine template example contains the four possible states shown in Table 1. Figures 6 and 7 show the block diagram and front panel of the example program for the “One Button” state. The program halts in this state until the user presses the Start button from the dialog box. However, an indicator on the front panel updates until this button is pressed. As an alternative to halting the program, it can re-loop to a wait state while simultaneously updating an indicator, as shown in Figure 8. The final output from the program is shown in Figure 9.
State Function Initialize All variables are initialized to default, and it transfers to the “One
Button” state. One Button Displays a dialog box containing instructions to the user. The program
halts in this state until the user presses the Start button. While in this state, program simultaneously increments a counter and updates an indicator every 100mS. When the Start button is pressed, it transfers to the “Wait” state.
Wait Displays instructions in a text indicator. Simultaneously increments a counter and updates an indicator every 100mS by repeating the “Wait” state until the user presses the wait state button. When wait state button is pressed, transfers to the “Stop” state.
Stop Displays log information, containing time in dialog box and time in wait state, in a text indicator. Then, the program terminates.
Table 1. State Machine Template.

Figure 6. State Machine Template Block Diagram Showing One Button State
Figure 7. State Machine Template Front Panel Showing Dialog Box
Figure 8. State Machine Template Block Diagram Showing Wait State

Figure 9. State Machine Template Front Panel Showing Completed Results Software Design Figures 10 through 14 are examples of student work. After prompting the user to enter their name and the serial number of the PSCB they are testing, the digital output test is performed. Instructions are provided to the user, as shown in Figure 10. The user toggles the four switches on the PSCB, and the corresponding LEDs on the front panel toggle on and off. If all four are functioning properly, the user presses the pass button. The test progress section on the front panel is updated. The digital input test is performed in a similar manner, except that the second set of LEDs on the front panel are used as controls for toggling the four digital input lines to the PSCB. The next test is performed on the 3.3V DC output voltage. As shown in Figure 11, instructions are provided to the user, and the DC output voltage is displayed on an indicator while the user adjusts the potentiometer on the PSCB. After adjustment such that the DC voltage is within the desired specification, the user presses the pass button and the test progress on the front panel is updated. Additionally, this student designed a second DC output voltage of 9.0V (for accuracy within +/-0.01V) on the PSCB and designed a software test that was very similar to the 3.3V test. Lastly, each waveform for the function generator output was tested for the wave shape, frequency, peak-to-peak voltage, and offset voltage. In addition to providing instructions, this student also provided a simulated waveform with which the user can use to verify the proper waveform characteristics. An example for a squarewave is provided in Figure 12. The block diagram for this portion of the state machine is provided in Figure 13. It shows the data collection section, waveform simulation section, and methods for determining the DC offset voltage, peak-to-peak voltage, and frequency. After completing each test, the information shown in the test progress section is written in a log file to disk. An example of the results is shown in Figure 14.

Figure 10. Digital Output Test
Figure 11. DC Output Voltage (3.3V) Test

Figure 12. Square Waveform Test
Figure 13. Block Diagram for Square Waveform Test

Figure 14. Log Output File Containing Test Results Grading Assessment As discussed previously, the content of the lab report is worth 30% of the overall lab project grade. The lab report contains the following detailed items (an executive summary is not required): • Tables of all results • Flowchart of the software design program • Complete schematics • All equations and calculations • Screen shots of LabVIEW front panel and block diagram windows Since students choose from one of several possible end-of-semester projects, there were only three teams that completed this project over the previous several years. The average score for these three teams was 87%, with a high score of 108% (student chose to work individually and received an extra 10%) and a low score of 76% (primarily because the team did not successfully complete all of the engineering requirements for the project). During the fall of 2009, this was a required individual project that students completed in place of a final exam. The lab report format consisted of a detailed executive summary containing: • Summary of the design • Summary of the results • Summary of what was learned from the lab experiment • Attachment section containing theoretical formulas and calculations, measured results,
simulation results, tables of results, and schematics Nineteen students completed this project during the fall of 2009 with an average score of 77%, a high score of 98%, and a low score of 46%. Grades less than 70% (there were six) generally indicated that the student was unable to meet all of the engineering requirements for the project.

Student Assessment The most recent teams (two from the fall 2015 semester) were asked to complete an assessment form to evaluate this project. One team consisted of two students, and the other team consisted of one student. Table 2 includes the questions asked on the form and the responses from the students. Conclusions /Recommendations Based on the 2009 grading statistics, student performance on the project was good. However, since 2009, very few students have shown interest in completing this project. One observation is that students generally choose the end-of-semester project based on their perception of the level of difficulty in completing the project. This project requires both hardware and software design, whereas the other projects primarily require only software design (the hardware portion of the project is provided to the students). Thus, the students may perceive this project as more difficult than the other projects. Student assessment results were provided for only two teams. One team consisted of one student who completed all of the engineering requirements for the lab, while the other team consisted of two students who were unable to successfully complete all of the engineering requirements. Comments ranged from enjoying the lab but needing more time, to reducing the scope of the lab and needing more suggestions about how to begin. More student assessment results will be needed. LabVIEW has been an excellent software development tool for implementing all of the requirements for this project. However, prior to the start of the course, it is necessary that students will have learned programming techniques with LabVIEW, including the design of state machines.
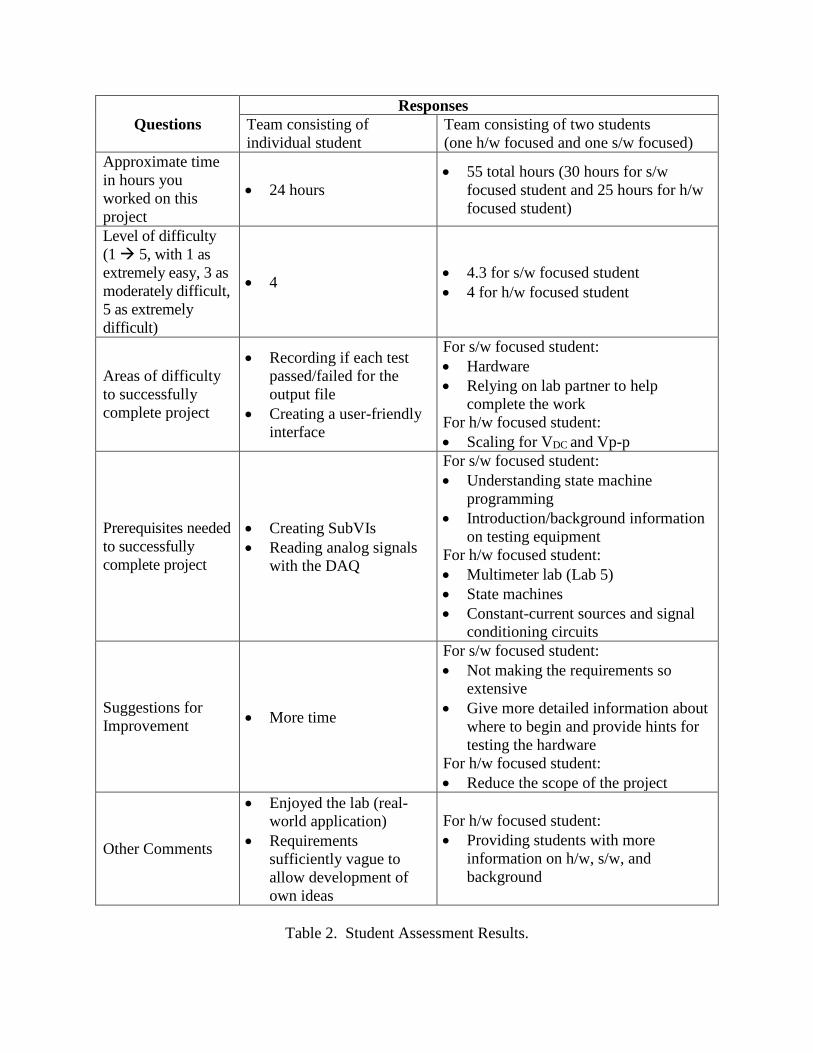
Questions Responses Team consisting of individual student
Team consisting of two students (one h/w focused and one s/w focused)
Approximate time in hours you worked on this project
• 24 hours • 55 total hours (30 hours for s/w
focused student and 25 hours for h/w focused student)
Level of difficulty (1 5, with 1 as extremely easy, 3 as moderately difficult, 5 as extremely difficult)
• 4 • 4.3 for s/w focused student • 4 for h/w focused student
Areas of difficulty to successfully complete project
• Recording if each test passed/failed for the output file
• Creating a user-friendly interface
For s/w focused student: • Hardware • Relying on lab partner to help
complete the work For h/w focused student: • Scaling for VDC and Vp-p
Prerequisites needed to successfully complete project
• Creating SubVIs • Reading analog signals
with the DAQ
For s/w focused student: • Understanding state machine
programming • Introduction/background information
on testing equipment For h/w focused student: • Multimeter lab (Lab 5) • State machines • Constant-current sources and signal
conditioning circuits
Suggestions for Improvement • More time
For s/w focused student: • Not making the requirements so
extensive • Give more detailed information about
where to begin and provide hints for testing the hardware
For h/w focused student: • Reduce the scope of the project
Other Comments
• Enjoyed the lab (real-world application)
• Requirements sufficiently vague to allow development of own ideas
For h/w focused student: • Providing students with more
information on h/w, s/w, and background
Table 2. Student Assessment Results.

Acknowledgement
We would like to thank the students in the ECET program who have completed this project and provided their feedback. Specifically, we would like to thank Robert Magoon for his role in initially designing this project, and for performing the video recording example for students to reference. Additionally, we would also like to thank Brian Law, Ben Schwab, Daniel Heise, and Eric Matteson who provided source files, screen shots (with some that were slightly modified) from which many of the figures were obtained, and comments. Bibliography 1. Bishop, Robert H., Learning with LabVIEW 2009, Pearson Education, 2010. 2. Travis, Jeffrey and Jim Kring, LabVIEW for Everyone, 3rd Edition, Pearson Education, 2007. 3. Essick, John, Hands-On Introduction to LabVIEW for Scientists and Engineers, 2nd Edition, Oxford University
Press, 2013. 4. Web Site http://www.ti.com/lit/ds/symlink/lm317.pdf 5. Web Site http://www.cypress.com/documentation/development-kitsboards/cy8ckit-059-psoc-5lp-prototyping-kit-
onboard-programmer-and 6. Web Site http://www.cypress.com/documentation/code-examples/psoc-345-code-examples 7. Web Site http://www.ni.com/data-acquisition/multifunction/