automated modeling of surface detail … modeling of surface detail from point clouds of historical...
TRANSCRIPT
AUTOMATED MODELING OF SURFACE DETAIL FROM POINT CLOUDS OFHISTORICAL OBJECTS
C. Notheggera, P. Dorningerb
a Vienna University of Technology, Christian Doppler Laboratory for ”Spatial Data from Laser Scanning and Remote Sensing”,Gußhausstraße 27-29, 1040 Wien - [email protected]
b Vienna University of Technology, Institute of Photogrammetry and Remote Sensing,Gußhausstraße 27-29, 1040 Wien - [email protected]
KEY WORDS: Laser scanning, Surface Modeling, Triangulation, Monitoring, Cultural Heritage
ABSTRACT:
Terrestrial Laser Scanners are well suited for the acquisition of data for subsequent geometric modeling. Modern phase shift laserscanners allow the measuring of point clouds with very high point densities. The redundancy in the data can be used to reducemeasurement error, leading to a point cloud with high precision and optimized point spacing. In combination with image data, verydetailed models can be generated representing the main characteristics of a cultural heritage site. We developed a method which allowsthe determination of highly accurate geometric models from laser scanner point cloud in an economically feasible fashion. The methodused for the point cloud processing is presented and analyzed and it is shown, how it can be applied fully automatically. To achievethis it is necessary to estimate a parameter for the size of the local neighborhood. A method for estimating this parameter is presented.Results of the method’s application at the UNESCO World Heritage Site Schonbrunn Palace are presented and discussed.
1 INTRODUCTION
For documentation, management, and reconstruction of culturalheritage, high quality geometric modeling based on adequate datacapturing methods is essential. In recent years terrestrial laserscanners (TLS) have successfully been used to perform thesetasks. TLS can be divided into two groups, long range scannershaving a measurement range from below one meter to severalhundreds of meters and close range scanners with measurementranges up to several meters. The best accuracy can be achievedwith close range scanners. However, the high cost of the data ac-quisition with such scanners prohibits their use on a larger scaleor for routine monitoring.
Alternative data capturing methods like interactive photogram-metric processing or tachymetry aim at the direct determinationof characteristic structures (i.e. edges). This implies a high de-gree of generalization during data acquisition and like the dataacquisition with close range scanners require a great amount ofmanual work. Furthermore, interactive methods are insufficientwhen the object being modeled consists of freeform surfaces. Bycontrast, autonomous data acquisition techniques as, for exam-ple, digital image matching or laser scanning determine numer-ous more or less randomly distributed points on the object’s sur-face. While laser scanning is almost independent of the surfacetexture, matching requires uniquely identifiable structural or tex-tural features.
Due to further-development of phase shift scanners, the point-sampling rates increased making high sampling density of sur-faces economically feasible. The measurement error, however,largely stays the same due to physical restrictions of the sensors.This means that the ratio of measurement noise to point densityworsens considerably and measurement errors can no longer beignored or reduced to simply removing outliers. In order to pro-duce geometric models that are both geometrically accurate andvisually appealing this measurement noise must be reduced. Thisproblem has traditionally been addressed by smoothing and thin-ning of the point cloud. In this process, however, detail is usu-
ally lost. Sharp edges and corners, for example, are very oftenrounded.
In this paper, the generation and application of models withhighly detailed surface structures (i.e. a sculpture and an ornateroom) from terrestrial laser scanning data will be presented. Al-ternative approaches have successfully been used for geometricmodeling of cultural heritage (e.g., (Bohm and Pateraki, 2006),(Alshawabkeh and Haala, 2004), (Beraldin et al., 2002)). But themethods presented there either lack in economical feasibility (i.e.a lot of interactive post-processing is necessary or the data acqui-sition is time-intensive) or they do not achieve the best possiblequality (both: precision and resolution) attainable by modern sen-sors. The method presented in this paper uses an innovative fil-tering method, that is capable of reducing the measurement noiseconsiderably while striving to preserve detail. As a byproduct ofthe surface normal estimation outliers can be identified and re-moved. Other byproducts include an estimation of the surfaceroughness and the likelihood of the presence of high frequencyfeatures.
Although this method was developed for the processing of dataacquired with long range laser scanners, it is independent of thescale of the measurements and the method of data acquisition andcould equally well be applied to data from close range scannersor image matching. All parameters needed in the processing caneither be estimated from the data or depend only on the scannerused. Thus no parameters need to be determined interactivelymaking the presented method highly suitable for automatic dataprocessing. The main two parameters are the size of the neigh-borhood which is to be considered when estimating the surfacenormal vectors - this can be estimated from the data - and thetarget point spacing which depends primarily on the maximumspatial frequency the scanner can resolve and it is known in ad-vance.
The method presented in this paper has been tested on datasets ac-quired at the UNESCO World Heritage Site Schonbrunn Palace.Results from the application of the method on data from a sculp-
XXI International CIPA Symposium, 01-06 October, Athens, Greece

ture from the park of the palace and on data from an ornate roomwithin the palace are presented. Both datasets have been acquiredusing a phase shift scanner. The sculpture was scanned from sev-eral positions around it with a point-spacing of 2mm. The com-bined point clouds were preprocessed using the method presentedin this paper. From the resulting point cloud a triangle mesh wasderived. The suitability of this mesh for the purposes of monitor-ing, visualization, and reconstruction is discussed. The room wasscanned with a point spacing of 1.5mm and 0.7mm in selectedareas and this dataset was also processed using the same method.The results are compared with those from alternative methods.
2 METHODOLOGY AND RELATED WORK
The typical workflow from data (point cloud) acquisition to thefinal, geometrical surface model (e.g. triangulation (Amenta etal., 2001) or manual construction of primitives (Autodesk, 2007))comprises the following steps:
• Data acquisition: Measurement of point cloud
• Registration: Definition of a reference coordinate systemand transformation of all datasets into this system (in pho-togrammetric context often referred to as orientation)
• Calibration: Elimination of systematic effects (i.e. improv-ing accuracy)
• Minimization of the influence of measurement noise: Oftenreferred to as filtering or smoothing (i.e. improving preci-sion)
• Surface modeling: Triangulation or freeform surface esti-mation
TLS for capturing point clouds was introduced in Section 1. Reg-istration is not considered in this paper (e.g., (Ullrich et al., 2003),(Rusinkiewicz and Levoy, 2001)). The calibration is described inthe following Section 2.1. Due to the redundant data acquisi-tion (i.e. very low sampling distance versus relatively high mea-surement noise - confer Section 1), an adequate method for theelimination of the measurement noise is necessary. The currentlyapplied steps are described in the sections 2.2 to 2.3. Finally, thedetermination of surface models from the smoothed point cloudis discussed.
2.1 Elimination of Systematic Errors
The data acquired with TLS contain systematic errors. Thesesystematic errors must be modeled and the resulting correctionfunction must be applied to the data. This process is known ascalibration. The instruments are usually calibrated by the manu-facturer on a regular basis, e.g. once a year. There are, however,calibration parameters which may change at a higher rate, mak-ing additional calibration before each survey campaign desirable.An example of how such a calibration can be performed underlaboratory conditions is presented in (Lichti, 2007). Some of thecalibration parameters even change from one scan to the next.These can no longer be determined under laboratory conditions,but must be determined in situ.
An example of such a fast changing phenomenon are cyclic er-rors of the phase shift rangefinder. Figure 1 shows the differencesbetween measured ranges and a mean plane. (Lichti, 2007) de-scribed such a cyclic ranging error with a wavelength of 0.6 m,which is half the length of the shortest measuring unit used by the
Figure 1: Distances to an adjusting plane by range for uncali-brated (top) and calibrated (bottom) data
investigated scanner. Our findings using the same scanner modelshow that there is a harmonic spectrum of at least 4 significantharmonic waves with wavelengths of 0.6 m, 0.3 m, 0.2 m and0.15 m respectively. If a plane patch - large enough to encompassmore than the largest wavelength - can be found in a scan then itis possible to estimate the parameters of the calibration function.
Figure 1 shows the described effect. A plane patch was takenfrom a real dataset and the distances to an adjusting plane areplotted versus the polar range. The upper diagram shows theuncalibrated data, where the cyclic error is clearly visible. Thelower diagram shows the calibrated data where the pattern ofwaves is mostly eliminated. The median absolute deviation isreduced from 1 mm to 0.4 mm. Notice that there are a number ofpoints not fitting very well to the majority of points, especially inthe right part of the diagrams. The reason is that the patch - takenfrom a scan of a historic room - is not really a plane. This illus-trates a general difficulty in performing in situ calibration. For anexact determination of the calibration an exact plane over the fullspectrum of measured ranges would be necessary. However, thisideal situation will rarely occur in realistic data.
Another source of systematic errors are the points at the silhou-ette of an object. Since for phase shift scanners the measuredrange is integral over the entire instantaneously illuminated area(often referred to as footprint), points on or near the silhouette areinvariably shifted. These points are gross errors and must be elim-inated. The software provided by the scanner manufacturers usu-ally provides such a functionality, however, there always remainsome silhouette points. Silhouette points can also be dealt withby eliminating all points whose angle of incidence, i.e. the anglebetween the incoming laser beam and the surface normal vector,approaches 90◦. Measurements with an angle of incidence closeto 90◦ and not lying near the silhouette of an object are unreli-able because the instantaneously illuminated area becomes verylarge. To avoid having uncovered areas additional scan positionsare necessary.
2.2 Estimation of Surface Normal Vectors
Our approach uses a filtering method that is capable of reducingthe measurement noise considerably while striving to preservedetail. This filtering is based on the Fast Minimum CovarianceDeterminant (FMCD) estimator (Rousseeuw and van Driessen,
XXI International CIPA Symposium, 01-06 October, Athens, Greece
1999) for the highly robust estimation of surface normal vec-tors. As a byproduct of the surface normal estimation outliers(i.e. points lying too far from the object’s surface) can be iden-tified and removed. The FMCD estimator robustly determines acovariance matrix C from the local neighborhood n. As the localneighborhood of a point p we use the n points which are clos-est to p. These n points can be found efficiently by using thekd-tree data structure (Berg et al., 2000). The surface normal isthe eigenvector corresponding to the least eigenvalue λ3 of theeigen-decomposition of C. The eigenvalues can also be used toestimate surface roughness. (Pauly et al., 2002) show that the sur-face variation σ2
n - which can be computed from the eigenvalues -can be used instead of the local surface curvature for determiningsurface roughness. Based on the surface roughness parameter thesurface can be classified into smooth and rough areas. Note thatσ2
n is dependent on the magnitude of n. It is thus essential to usean appropriate n.
2.3 Estimation of the Local Neighborhood
The most critical parameter that must be determined is the size ofthe local neighborhood. If the neighborhood is too small then theneighborhood is a more or less spherical region within the bandof points and the estimated surface normal will be more or lessarbitrary. The surface roughness will be high and mostly mean-ingless. If it is too large, the surface normals can be estimatedcorrectly, however, high frequency (i.e. small) features will beincreasingly smoothed. For the automation of the processing it isessential that the optimal neighborhood can be estimated locally.For a planar region this is possible.
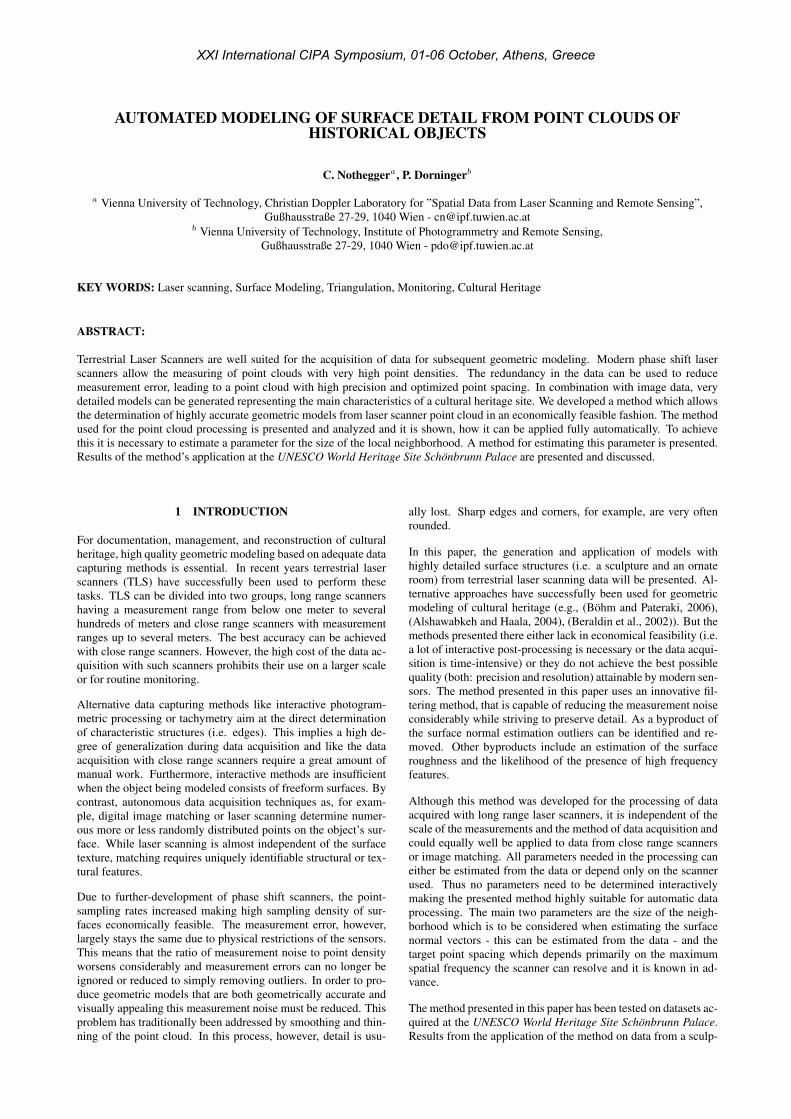
If the neighborhood of a point is enlarged step by step and thesmallest eigenvalue λ3 of the covariance matrix is plotted for eachneighborhood size n, you obtain a diagram like the one shown inFigure 2. λ3 will increase until it reaches a level where it willremain more or less constant. From that point on the increase invariance caused by the enlargement of the neighborhood will bereflected only in λ1 and λ2. The n corresponding to the pointwhere this level is reached is the optimal neighborhood size no.In practice the obtained samples are quite noisy. This makes itnecessary to estimate no. Fortunately, this problem is very simi-lar to the problem of fitting a variogram model to a spatial vari-ogram, and existing methods for solving this problem (e.g. (Gen-ton, 1998)) can be used.
Figure 2: Estimation of the optimal neighborhood size: A spheri-cal variogram function is fitted to the variance-neighborhood plotto estimate the range
2.4 Thinning of the Point Cloud
The normal vectors (c.f. Section 2.2) are then used to determinepoints having the highest probability of being closest to the real
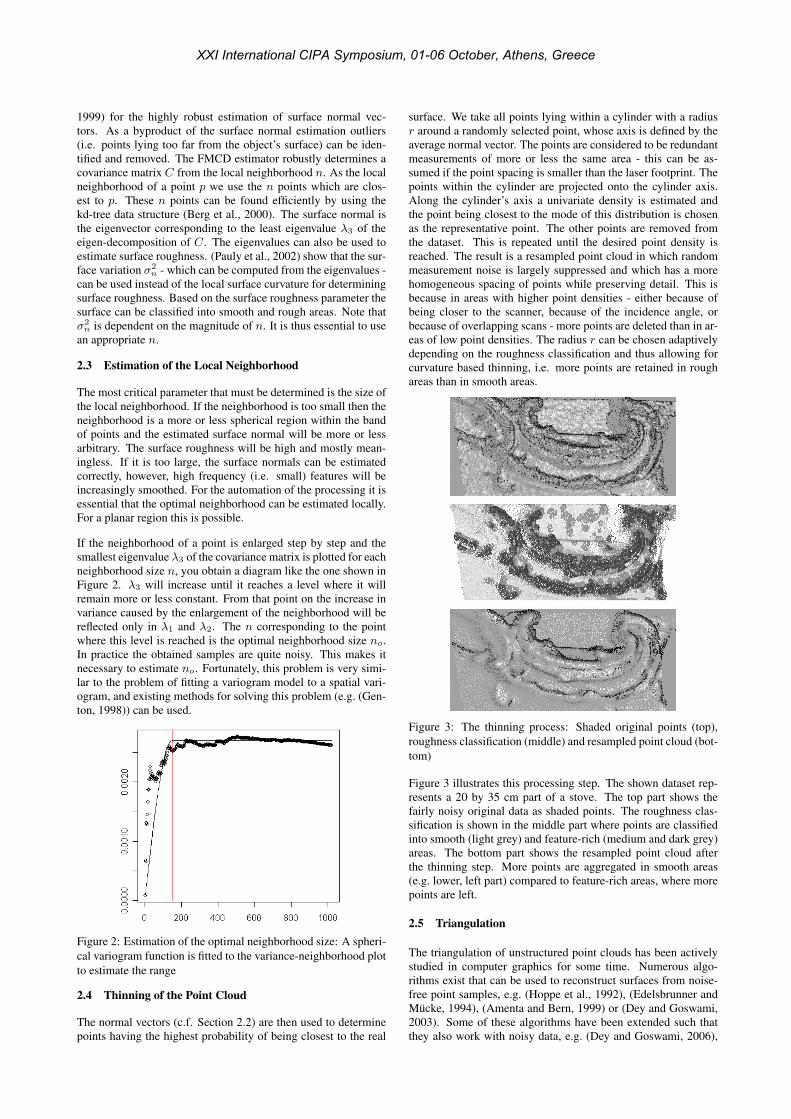
surface. We take all points lying within a cylinder with a radiusr around a randomly selected point, whose axis is defined by theaverage normal vector. The points are considered to be redundantmeasurements of more or less the same area - this can be as-sumed if the point spacing is smaller than the laser footprint. Thepoints within the cylinder are projected onto the cylinder axis.Along the cylinder’s axis a univariate density is estimated andthe point being closest to the mode of this distribution is chosenas the representative point. The other points are removed fromthe dataset. This is repeated until the desired point density isreached. The result is a resampled point cloud in which randommeasurement noise is largely suppressed and which has a morehomogeneous spacing of points while preserving detail. This isbecause in areas with higher point densities - either because ofbeing closer to the scanner, because of the incidence angle, orbecause of overlapping scans - more points are deleted than in ar-eas of low point densities. The radius r can be chosen adaptivelydepending on the roughness classification and thus allowing forcurvature based thinning, i.e. more points are retained in roughareas than in smooth areas.
Figure 3: The thinning process: Shaded original points (top),roughness classification (middle) and resampled point cloud (bot-tom)
Figure 3 illustrates this processing step. The shown dataset rep-resents a 20 by 35 cm part of a stove. The top part shows thefairly noisy original data as shaded points. The roughness clas-sification is shown in the middle part where points are classifiedinto smooth (light grey) and feature-rich (medium and dark grey)areas. The bottom part shows the resampled point cloud afterthe thinning step. More points are aggregated in smooth areas(e.g. lower, left part) compared to feature-rich areas, where morepoints are left.
2.5 Triangulation
The triangulation of unstructured point clouds has been activelystudied in computer graphics for some time. Numerous algo-rithms exist that can be used to reconstruct surfaces from noise-free point samples, e.g. (Hoppe et al., 1992), (Edelsbrunner andMucke, 1994), (Amenta and Bern, 1999) or (Dey and Goswami,2003). Some of these algorithms have been extended such thatthey also work with noisy data, e.g. (Dey and Goswami, 2006),
XXI International CIPA Symposium, 01-06 October, Athens, Greece

(Kolluri et al., 2004), or (Kazhdan et al., 2006). They only seemto work well when the noise level is low, which makes it neces-sary to reduce measurement noise as described above in situationwhere noise levels are high. Another problem with the latter twoalgorithms is that they optimize globally, which makes them un-suitable for large datasets. Currently efforts are being made toderive localized algorithms, e.g. (Schall et al., 2007).
The integration of a suitable triangulation algorithm into ourworkflow is currently being researched. For the presented ex-amples we used the commercially available software GeomagicStudio 9 to do the triangulation.
3 RESULTS AND DISCUSSION
So far, we discussed the individual steps to determine a triangula-tion model from a laser scanner point cloud. To demonstrate thecapabilities of our method, we are now presenting results frompoint clouds, acquired in Schonbrunn Palace. The first exampleshows an ornate room with sophisticated stuccoes and a highlydetailed stove. The second example shows a marble sculpturesituated in the Baroque garden of the palace. Finally, we are dis-cussing the achievable results and their quality with respect toalternative model determination approaches as provided by com-mercial modeling software packages.
3.1 Modeling an Ornate Room
The four Rococo rooms on the ground floor of SchonbrunnPalace are not accessible for tourists. They were redecorated in1770 and were used as dining-rooms and additionally as cere-monial rooms. The decoration is typical of the Rococo decorwith white wooden paneling outlined with guilt bordering andRocaille work. Isolated flower garlands in part cover the pan-eling. On the one hand, geometrical patterns have increasinglybeen used in the guilt ornamentation in these rooms, an indica-tion of the transition to classicism, but, in one of the four rooms,on the other hand, the undulating lines and sculptured decors arestill completely Baroque. Results from modeling this room areconsidered in the following. In order to document the status af-ter the recent restoration of these rooms, high detailed geometrymodels including textural information need to be determined.
Figure 4: Rendered image of a Rococo room of SchonbrunnPalace
Figure 4 shows a textured rendering of one of the Rococo rooms.The extension is about 7.5 by 7m (confer Figure 5, second roomfrom the right). The data has been acquired by a Faro phase-shift scanner from the centre of this room. The entire room wassampled with a mean point spacing of 1.5mm at the object. Addi-tionally, the stove was scanned with a higher resolution ( 0.7mm).The final model, combining both scans, consists of 4 million tri-angles for the entire room. Due to the lack of adequate photo-graphic images of the walls, the material properties of the trian-
gles were classified according to the reflected infrared light inten-sity measured by the scanner. The texture of the floor was gen-erated from a photograph. From this photograph, the image of asingle floor tile was undistorted and used to texture the triangles.As texture coordinates the affinely transformed x-y coordinateswere used.
Based on these results, the survey of all four Rococo rooms to-gether with five other rooms of similar size was recently done.For that, 63 scan positions were necessary. Figure 5 shows thescanner positions (numbered dots) for the four Rococo rooms.Stoves are represented by circles.
Figure 5: Scan positions (black dots) for scanning four rooms ofSchonbrunn Palace
The data acquisition took four working-days including the defini-tion of a local reference system (by tachymetric measurements)and the registration of all point clouds. The resulting point cloudhas close to 4 billion points. The model generation process bymeans of the described approach (confer Section 2) is performedautomatically. Thus, almost no additional manpower (exceptquality control) is necessary. The expected computation time isthree weeks using a workstation with four 3GHz Xeon CPUs.
3.2 Sculpture Monitoring
In the so-called Grand-Parterre which is part of the designedBaroque garden of Schonbrunn Palace, forty-three sculptures of2.5 meters height are situated. The total height including thepedestal is 3.5 meters. The sculptures are made of Sterzingermarble and represent famous scenes from the Roman and Greekmythology. In order to monitor the status of the surface structureand the current condition of the surface material of these sculp-tures (e.g. biogenous destruction, frost damage, ...) the imple-mentation of an adequate information system is currently inves-tigated. This information system shall be based on appropriatehighly detailed geometry models.
Figure 6: Rendered model (left), and rendering of the head andthe corresponding triangulation (right)
To test the capabilities of our modeling approach, three scansfrom different positions with a mean point spacing of 2mm wereacquired from such a sculpture. These scans were used to gener-ate a model of the sculpture including its pedestal. Figure 6 (left)
XXI International CIPA Symposium, 01-06 October, Athens, Greece

shows a rendering of the sculpture. The geometric model consistsof some 1.5 million triangles with a mean edge length of 5mm 6(right).
3.3 Quality Analysis
To assess the quality of our algorithm we compared it with thepreprocessing tools available in the software packages GeomagicStudio 9 and Rapidform 2006. If possible, the following pro-cessing steps were applied: Removal of outliers and disconnectedcomponents, adaptive thinning, and finally smoothing of the re-sulting point cloud. For visualisation a triangulation was per-formed using Geomagic Studio 9 with identical settings, there-fore the triangulation should have no influence on the result. Theparameters were determined such that the final cloud was about10% of the original and that the visual appearance of the flat areasappeared almost similar.
Figure 7: Comparison of different thinning/smoothing methods.Photograph of the area (top left), Geomagic Studio 9 (top right),Rapidform 2006 (bottom left), our method (bottom right)
Figure 7 shows the result of the comparison. It can be seen thatour method does indeed preserve detail better than any of the al-ternative methods, with the overall smoothness and the reductionrate being fixed. On the other hand it also contains the most holes.With an integrated triangulation algorithm it should be possibleto overcome this problem. The result achieved with GeomagicStudio 9 is the smoothest with most detail being lost, but it is alsothe surface with the least holes. Rapidform 2006 is somewhere inbetween, but it was not possible to achieve the same amount ofsmoothness as with either our method or Geomagic Studio 9.
Figure 8 shows a the color coded differences between the trian-gulated surface and the original point cloud. Within the smooth
Figure 8: Color coded differences between the triangulated sur-face and the original point cloud
areas the differences stay within the bounds defined by the spec-ified measurement noise of the scanner. One can also see, thatthere is still a slight tendency to smooth over highly curved sur-face areas. In two areas high deviations can be observed. In thearea marked with (a) a part of the ornament is missing completelyin the triangulation. The reason is that because of a disadvanta-geous scan angle comparably few points were measured on thispart and those were thus classified as outliers and filtered out. Inthe area marked with (b) specular reflection caused grossly erro-neous measurements, some of which were not detected and thuscaused the deformation of the surface. We are currently research-ing if these issues can be overcome by combining scans from sev-eral scan positions. At this level of detail the requirements for theaccuracy of the registration of multiple scans and the modeling ofsystematic errors are extremely high.
4 CONCLUSIONS AND FUTURE WORK
We stated that the generation of detailed models from character-istic features of cultural heritage sites is necessary for adequatemanagement of the facility. We introduced terrestrial laser scan-ning as a suitable and efficient data acquisition technique for thatpurpose. The presented method is an effective tool to generatemodels in an economically feasible manner. Compared to other,commercially available surface modeling methods, our approachis superior as it is possible to be applied without the need for inter-active determination of control parameter and thus runs automat-ically. Long computation times are not cost intensive if humansupervision is not necessary. Besides, the implementation sup-ports multi-core processors or even computer clusters allowingto decrease the computation time. As the only input parameter(i.e. the local neighborhood size) is determined from the dataautomatically (confer Section 2.3), the described smoothing andthinning processes are fitted automatically to the local data andthe error distribution. By contrast, commercial available methods(e.g., Geomagic Studio 9, Rapidform 2006, Polyworks 10) appearas black boxes to the user demanding for numerous control pa-rameter which have to be predefined by the user without detaileddescription. This fact makes an automatic processing of TLS dif-ficult as these parameter have to be determined by trial and errorfor every scan and taking local variations of the surface charac-teristics into account is only possible with significant interactivework.
Results from modeling two different assets of Schonbrunn Palacehave been presented. The models of the Rococo rooms are usedfor documentation of the final status of the preceding restoration.A future application will be the derivation of high quality ren-derings for virtual reality environments (e.g., (Gatiatzes et al.,2001), (Drap et al., 2006)). Two different applications of thesculpture models are discussed. On the one hand, it can be usedfor rapid reproduction by means of CNC-milling machines andon the other hand, the implementation of a sculpture monitoringsystem is planned which should be based on a high quality geo-metric model and will support the restoration process.
The data acquisition has so far been performed by a scanner ofone manufacturer, Faro. We are currently investigating alterna-tive products as well, because the diversity of the occurring sur-face structures and textures influences the quality of data acqui-sition. Due to the fact that the physical properties of TLS sys-tems from different providers are not equal (e.g. they differ inwavelength, footprint-size, illumination power, ...) the appropri-ate field of application has to be determined for each individualscanner. So far, we used the commercial software product Geo-magic Studio 9 to generate the three-dimensional triangle-mesh
XXI International CIPA Symposium, 01-06 October, Athens, Greece

from the preprocessed points. As, for our application, the soft-ware suffers from certain deficiencies (e.g. the resulting modelis not waterproof thus containing holes; it cannot cope with verylarge datasets), we are currently implementing an adequate trian-gulation method.
Finally, it can be said that generally the adequate modeling ofboth surface structure and texture from cultural heritage sites hasbeen a time and thus cost intensive procedure. Therefore, it hasrarely been performed. The application of upcoming data ac-quisition methods like terrestrial laser scanning in combinationwith automated model generation methods as presented in thispaper increases the cost efficiency to a great extent, thus mak-ing it suitable as a standard procedure for adequate cultural her-itage site management as already realized by the management ofSchonbrunn Palace.
ACKNOWLEDGEMENTS
The acquisition of the presented datasets was done in cooperationwith Faro Technologies Inc., Stuttgart (Faro, 2007) who providedthe scanner (Faro LS 880) and the necessary data processing soft-ware FaroScene for this project. Furthermore we have to thankthe management of Schonbrunn Palace as a member of the Chris-tian Doppler-Laboratory for supporting our investigations.
REFERENCES
Alshawabkeh, Y. and Haala, N., 2004. Integration of Digital Pho-togrammetry and Laser Scanning for Heritage Documentation.ISPRS xx. Symposium, Com. V. 4, pp. 12–23.
Amenta, N. and Bern, M., 1999. Surface reconstruction byvoronoi filtering. Discrete and Computational Geometry 22(4),pp. 481–504.
Amenta, N., Choi, S. and Kolluri, R., 2001. The power crust,unions of balls, and the medial axis transform. ComputationalGeometry 19(2-3), pp. 127–153.
Autodesk, 2007. http://www.autodesk.com.
Beraldin, J., Picard, M., El-Hakim, S., Godin, G., Valzano, V.,Bandiera, A. and Latouche, C., 2002. Virtualizing a ByzantineCrypt by Combining High-resolution Textures with Laser Scan-ner 3D Data. VSMM 2002 pp. 25–27.
Berg, M. d., Krefeld, M. v., Overmars, M. and Schwarzkopf, O.,2000. Computational Geometry Algorithms and Applications.Springer.
Bohm, J. and Pateraki, M., 2006. From point samples to surfaces- on meshing and alternatives. In: H. Maas and D. Schneider(eds), ISPRS Symposium, Com. V., pp. 50–55.
Dey, T. K. and Goswami, S., 2003. Tight cocone: A water-tightsurface reconstructor. Journal of Computing and Information Sci-ence in Engineering 3, pp. 302.
Dey, T. K. and Goswami, S., 2006. Provable surface reconstruc-tion from noisy samples. Computational Geometry: Theory andApplications 35(1-2), pp. 124–141.
Drap, P., Durand, A., Nedir, M., Seinturier, J., Papini, O., Bou-cault, F., Chapman, P., Viant, W., Vannini, G. and Nuccioti, M.,2006. Towareds a photogrammetry and virtual reality based her-itage information system: A case study of shawbak castle in jor-dan. In: M. Ioannides, D. Arnold, F. Niccolucci and K. Mania(eds), The 7th International Symposium on Virtual Reality, Ar-chaeology and Cultural Heritage VAST, Nicosia, Cyprus, pp. 67–74.
Edelsbrunner, H. and Mucke, E. P., 1994. Three-dimensionalalpha shapes. ACM Transactions on Graphics 13(1), pp. 43–72.
Faro, 2007. http://www.faro.com.
Gatiatzes, A., Christopoulos, D. and Roussou, M., 2001. Reviv-ing the past, cultural heritage meets virtual reality. In: 2nd Inter-national Symposium on Virtual Reality, Archaeology and Intelli-gent Cultural Heritage, ACM Press, pp. 103–109.
Genton, M. G., 1998. Variogram fitting by generalized leastsquares using an explicit formula for the covariance structure.Mathematical Geology 30(4), pp. 323–345.
Geomagic, 2007. http://www.geomagic.com.
Hoppe, H., DeRose, T., Duchamp, T., McDonald, J. and Stuetzle,W., 1992. Surface reconstruction from unorganized points. In:Proceedings of the 19th annual conference on Computer graph-ics and interactive techniques, ACM Press New York, NY, USA,pp. 71–78.
Kazhdan, M., Bolitho, M. and Hoppe, H., 2006. Poisson surfacereconstruction. In: Fourth eurographics symposium on geometryprocessing, pp. 61–70.
Kolluri, R., Shewchuk, J. R. and O’Brien, J. F., 2004. Spectralsurface reconstruction from noisy point clouds. In: Proceedingsof the 2004 Eurographics/ACM SIGGRAPH symposium on Ge-ometry processing, Vol. 71, ACM Press New York, NY, USA,pp. 11–21.
Lichti, D. D., 2007. Error modelling, calibration and analysisof an am-cw terrestrial laser scanner system. ISPRS Journal ofPhotogrammetry and Remote Sensing 61(5), pp. 307–324.
Pauly, M., Gross, M., Kobbelt, L. P., Hochschule, E. T. andZurich, S., 2002. Efficient simplification of point-sampled sur-faces. In: IEEE Visualization ’02, pp. 163–170.
Polyworks, 2007. http://www.innovmetric.com.
Rousseeuw, P. J. and van Driessen, K., 1999. A fast algorithm forthe minimum covariance determinant estimator. Technometrics41(3), pp. 212–223.
Rusinkiewicz, S. and Levoy, M., 2001. Efficient variants of theicp algorithm. In: Proceedings of 3rd International Conferenceon 3D Digital Imaging and Modelling, Quebec, pp. 145–152.
Schall, O., Belyaev, A. and Seidel, H.-P., 2007. Error-guidedadaptive fourier-based surface reconstruction. Computer-AidedDesign 39(5), pp. 421–426.
Ullrich, A., Schwarz, R. and Kager, H., 2003. Using hybrid multi-station adjustment for an integrated camera laser-scanner system.In: A. Grun and H. Kahmen (eds), Optical 3-D MeasurementTechniques: Proceedings of 6th conference on optical 3-D Mea-surement Techniques, Zurich, pp. 298–305.
XXI International CIPA Symposium, 01-06 October, Athens, Greece