automated malignancy detection in breast histopathological
TRANSCRIPT
Automated Malignancy Detection in Breast HistopathologicalImages
Andrei Chekkoury1, Parmeshwar Khurd1, Jie Ni1, Claus Bahlmann1, Ali Kamen1,Amar Patel1, Leo Grady1, Maneesh Singh1, Martin Groher3, Nassir Navab3,Elizabeth Krupinski2, Jeffrey Johnson1, Anna Graham2, Ronald Weinstein2
1Siemens Corporate Research, 755 College Road East, Princeton NJ, 08540, United States;2The University of Arizona, Tucson AZ 85721, United States
3Chair for Computer Aided Medical Procedures, Technical University of Munich, Germany
ABSTRACTDetection of malignancy from histopathological images of breast cancer is a labor-intensive and error-proneprocess. To streamline this process, we present an efficient Computer Aided Diagnostic system that can differen-tiate between cancerous and non-cancerous H&E (hemotoxylin&eosin) biopsy samples. Our system uses noveltextural, topological and morphometric features taking advantage of the special patterns of the nuclei cells inbreast cancer histopathological images. We use a Support Vector Machine classifier on these features to diagnosemalignancy. In conjunction with the maximum relevance - minimum redundancy feature selection technique, weobtain high sensitivity and specificity. We have also investigated the effect of image compression on classificationperformance.
Keywords: Breast histopathology, CAD histology, breast cancer, detecting malignancy, cancer in histopathologyimages
1. INTRODUCTION
The histopathological diagnosis is the foundation of modern oncology, and plays a major role in the treatment ofmany other types of disease. Errors in these reports can critically affect patient care and may become the subjectof media concern. Analogous to the role of computer-assisted diagnosis (CAD) algorithms in radiological imaging,our proposed approach aims at complementing the specialized opinion of the pathologist, by using an objectivejudgement, making use of quantitative measures. We aim at using the proposed system in distinguishing betweenmalignant and benign breast cancer samples, based on specially designed textural, topological and morphometricfeatures that can capture representative structures in cancer tissue. Although we are focused on the malignancydetection problem, we note that pathologists go beyond this and report grades of malignancy
2. METHODS
Our CAD system for breast cancer malignancy detection is composed of three different steps: 1) image processing2) feature extraction to quantify the properties of these areas, 3) classification of the relevant areas as malignantor not. In this study, we are focused on expanding the second and third steps, i.e., feature extraction andclassification to find hallmarks of cancer, but we will introduce a short description of the method used for pre-processing. Breast cancer is captured using morphometrical, textural or topological features. Along similarlines, our approach uses the network cycle feature framework developed in Khurd et al. [13] and the texton-basedapproach described in Khurd et al. [12] as the basis for our work. We now describe the different categories offeatures explored in this study, which are later fed to an SVM classifier after a feature selection procedure.
2.1 Pre-processing
In Hematoxylin&Eosin (H&E) images, a special staining is performed in order to enhance specific structures.Hematoxylin is a blue dye that binds to the nuclear chromatin and eosin is an acidic pink dye that binds to thecytoplasmic structures and blood cells. Depending on the application, a separation of these dyes is helpful. Alsosince current imaging techniques provide very high resolution output, pre-processing these images will reduce thecomputational cost. The H&E separation is performed based on the method presented in Cosatto et al. [5]: theimage is converted from RGB color space into the CMY color space for a better separation of the componentsand the two vectors corresponding to H and E are obtained.
2.2 Morphometric Features
Designed morphometric features, capture the variation in nuclei size and shape, considered as one of the mostimportant aspects taken into consideration by pathologists [3]. We have investigated three aspects that capturemorphometric features: information extracted from the Hessian matrix, information provided by the FourierShape Descriptors and a special designed feature, encoding the spatial arrangement of nuclei surrounding aductal structure.
Nuclei Detection Extracting characteristic features from nuclei size and shape, requires a good nuclei detection.Extracting a precise location of nuclei plays an important role in detecting cancer in histopathology of breastcancer. Based on the work presented in Loy and Zelinsky [14], in Singh et al. [17] the fast radial symmetry hasbeen modified and adapted in order to fit the purpose of detecting nuclei in histopathology slides.
Nuclei Segmentation is based on an improved random walker segmentation algorithm based on a previousaccurate detection of nuclei. The Random Walker (RW), introduced by Grady [8], is a segmentation algorithmthat captures weak or missing boundaries, but is also able to cope with noise in the image, identifying multipleobjects simultaneously and avoiding trivial solutions.
Random Walker is initialized with a set of voxels taking one of a predefined set of labels. The probability thata random walker starting at a given unlabelled voxel will first reach a voxel of a particular label is computed,based on solving a so-called Dirichlet problem with boundary conditions at the locations of the seed points andthe seed point in question fixed to unity while the others are set to zero.
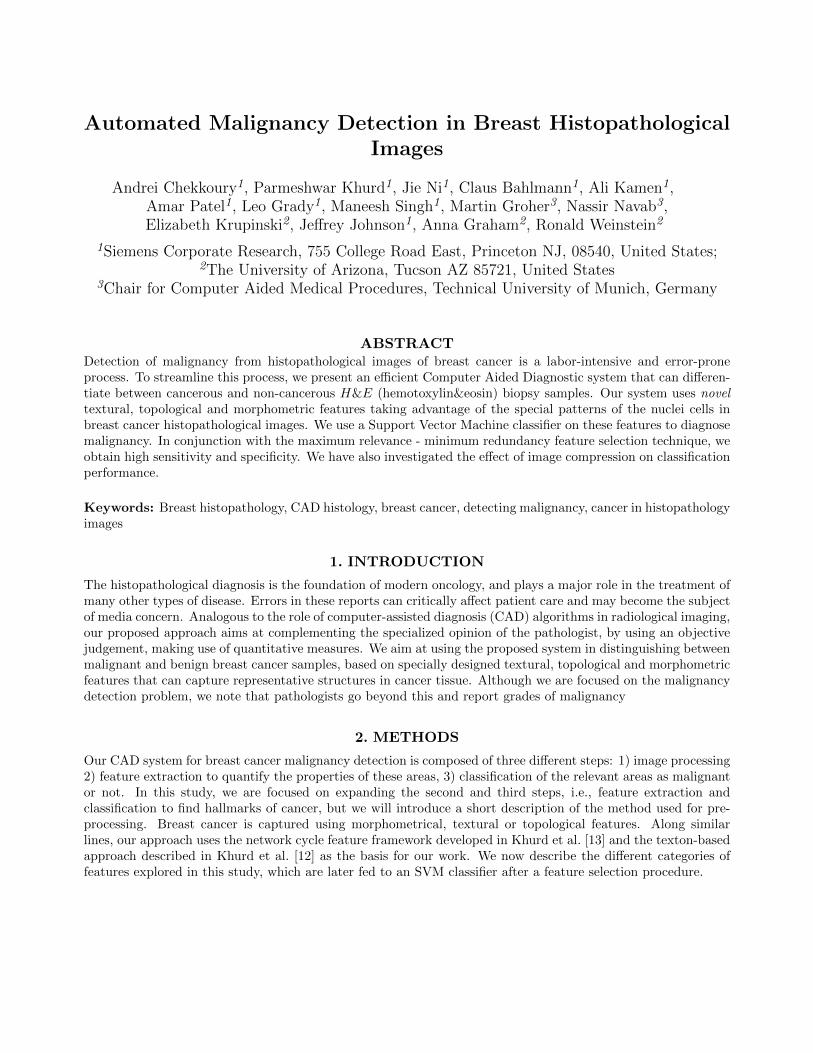
The introduced Random Walker segmentation needs input seeds in order to generate the random walks. Wewill introduce a method, based on the ellipse fitting method for detecting nuclei, that takes into considerationthe points obtained as belonging to the ellipse. The seed points taken into consideration for the Random Walkersegmentation are represented by a shrank ellipse. We perform a shrinkage by a factor of two. The remained seedpoints can be seen in Figure 1(a).
(a) (b)
Figure 1: Random Walker Segmentation(yellow) based on ellipse detection
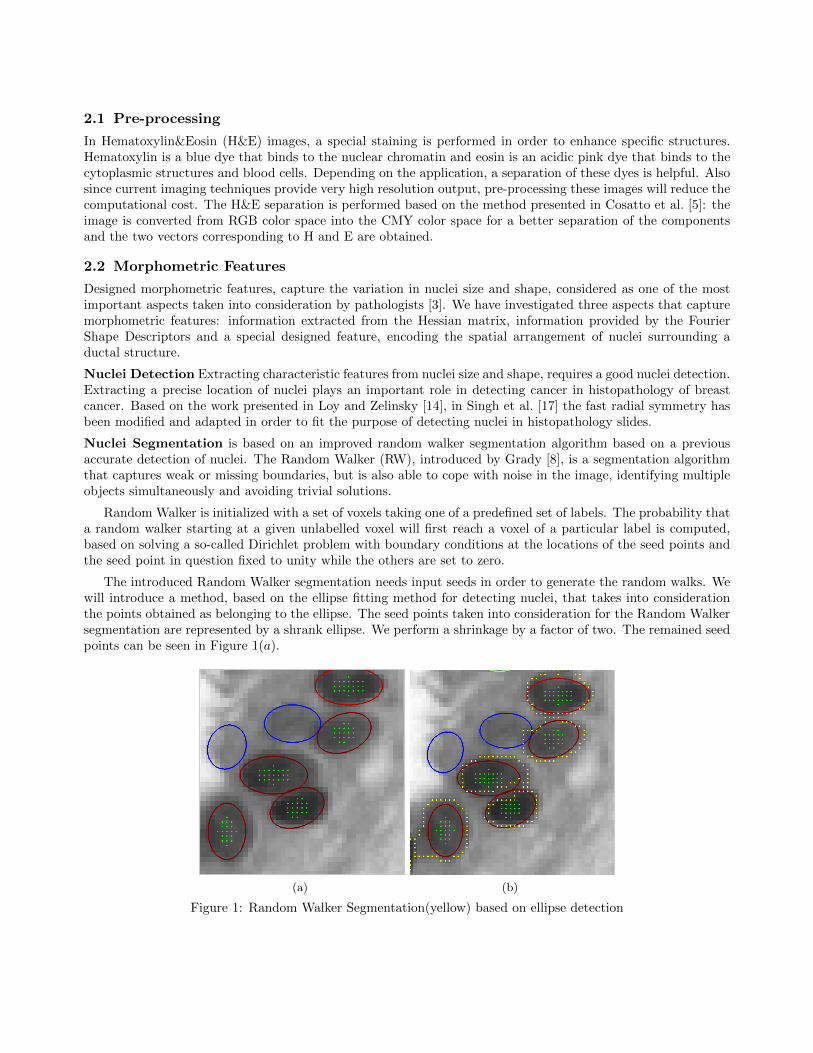
Segmenting nuclei using the random walker is graphically exemplified in Figure 2. In sub-figure 2(a) the imagecontaining the nucleus to be segmented is extracted. The points belonging to the detected ellipses are plottedin yellow, and will be later considered as seed points for the random walker. In sub-figure 2(b) these points aredilated by a predefined value in order to be included as border value for the random walker segmentation. In thisway, an accurate segmentation can be performed to preserve borders of touching or overlapting nuclei. Allowingthe random walker algorithm to segment the image taking into consideration the boundary conditions previouslydefined, the resulting segmentation is displayed in Figure 2 c.
In Figure 1 the ellipses surrounding detected nuclei having a high confidence value are highlighted in red,while the blue ones are considered to be with low confidence. For nuclei segmentation we take into considerationonly nuclei having a confidence value above a pre-set threshold value in order to remove outliers. The resultscan be seen in Figure 1(a), where the blue ellipses are considered as outliers.
5 10 15 20 25 30 35
5
10
15
20
25
30
35
(a) Seed points
5 10 15 20 25 30 35
5
10
15
20
25
30
35
(b) Dilated Background SeedPoints
5 10 15 20 25 30 35
5
10
15
20
25
30
35
(c) Segmentation Results
Figure 2: Random Walker Segmentation Steps
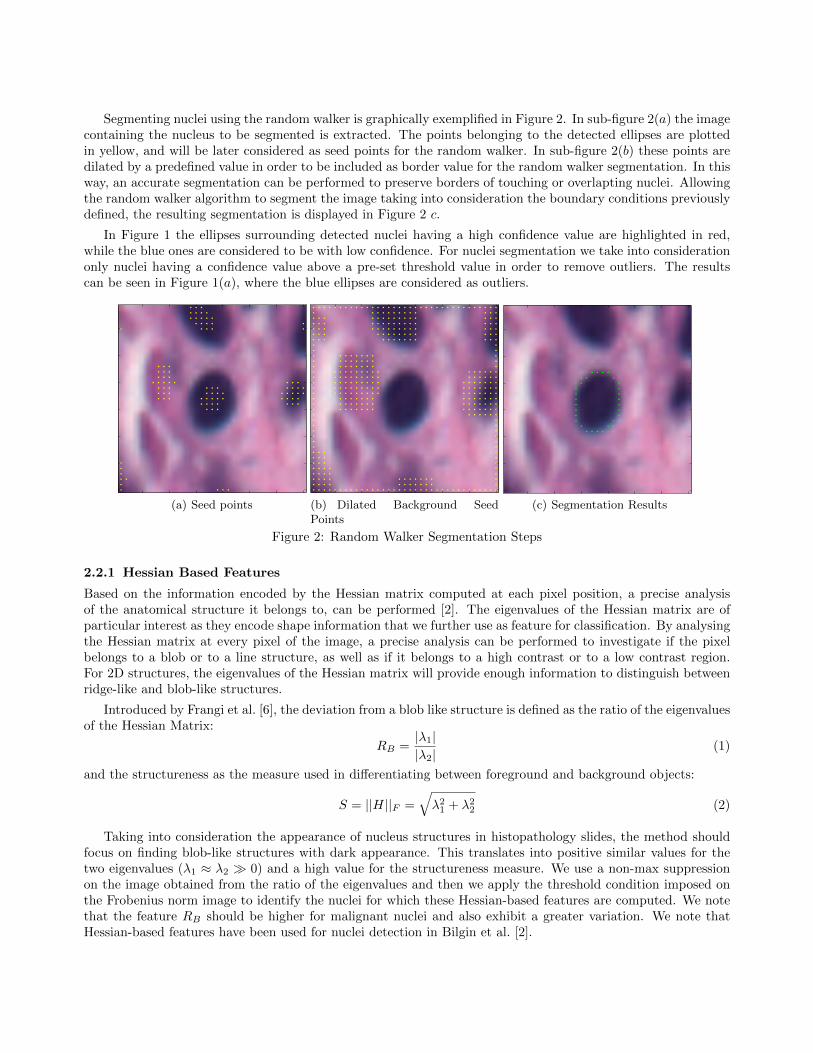
2.2.1 Hessian Based Features
Based on the information encoded by the Hessian matrix computed at each pixel position, a precise analysisof the anatomical structure it belongs to, can be performed [2]. The eigenvalues of the Hessian matrix are ofparticular interest as they encode shape information that we further use as feature for classification. By analysingthe Hessian matrix at every pixel of the image, a precise analysis can be performed to investigate if the pixelbelongs to a blob or to a line structure, as well as if it belongs to a high contrast or to a low contrast region.For 2D structures, the eigenvalues of the Hessian matrix will provide enough information to distinguish betweenridge-like and blob-like structures.
Introduced by Frangi et al. [6], the deviation from a blob like structure is defined as the ratio of the eigenvaluesof the Hessian Matrix:
RB =|λ1||λ2|
(1)
and the structureness as the measure used in differentiating between foreground and background objects:
S = ||H||F =√λ21 + λ22 (2)
Taking into consideration the appearance of nucleus structures in histopathology slides, the method shouldfocus on finding blob-like structures with dark appearance. This translates into positive similar values for thetwo eigenvalues (λ1 ≈ λ2 � 0) and a high value for the structureness measure. We use a non-max suppressionon the image obtained from the ratio of the eigenvalues and then we apply the threshold condition imposed onthe Frobenius norm image to identify the nuclei for which these Hessian-based features are computed. We notethat the feature RB should be higher for malignant nuclei and also exhibit a greater variation. We note thatHessian-based features have been used for nuclei detection in Bilgin et al. [2].

2.2.2 Fourier Shape Descriptors
The second category of morphometric features are extracted from Fourier Shape Descriptors, and are based on aprecise nuclei detection and segmentation. Since the Fourier Descriptors can encode size and shape informationfor different geometric shapes, we will extract these descriptors and based on the resulting spectra, we will extractfeatures that distinguish malignant nuclei from benign ones.
A relevant parameter for the Fourier Shape Descriptors is represented by the number of Fourier coefficients.This number must be chosen in such a way to encode a best description of the contour. We perform several testsand a good compromise value for an accurate contour description of the nucleus versus computation burden canbe achieved using 10 Fourier Descriptors.
The steps performed in order to compute the Fourier Shape Descriptors, are now introduced:
• Step 1 Accurate nuclei detection using the Generalized Fast Radial Transform method
• Step 2 Nucleus boundary segmentation using the Random Walker Segmentation
• Step 3 Several morphological operations to obtain only the boundary of the nucleus.
• Step 4 Computing center of masses for the nucleus center coordinates, followed by a computation ofeuclidean distance from the center to all the boundary points. The angle with respect to the centercoordinates is computed and only unique angles associated with distances are taken into consideration.
• Step 5 Compute the discrete Fourier Transform on the contour points extracted during Step 4, extract thefirst cosine term corresponding to the average value of the signal(DC component) and the general cosineand sine terms. The Fourier approximation is now complete.
Detecting the irregularity in nuclei shape can be done by analysing the Fourier spectrum in Figure 3. Wedesign the feature extraction method based on small non-DC values for circular nuclei and a high non-DC peakvalue for the elliptical nucleus presented in sub-figure 3(b). For the irregular nuclei, presented in sub-figure 3 (c),a non-DC peak followed by a smaller non-DC peak at a higher frequency can be observed. The features usedby our algorithm will focus on counting the number of irregular nuclei in each image sample, by detecting thesecond non-DC peak. It is known that a malignant image will have a high number of irregular nuclei, while abenign image will exhibit small irregularities at the shape of nuclei.
2.2.3 Novel Angular Features
The third developed morphometric feature, captures one of the aspects investigated by the pathologists whenestablishing the degree of malignancy of a histology slide: the orientation of nuclei around ductal structures.A benign sample will have nuclei displaced in a regular arrangement with small variation in size and shape.A uniform pattern of nuclei is considered to be a sign of non-cancerous tissue. For a benign case, the whitetissue representing the lumen, is surrounded by epithelium and then by a layer of nuclei, displaced in a parallelway. For a malignant slide, the glands are missing and the nuclei have a high variation in size and shape. Theangular nuclei and random orientation observed in malignant images is considered to be a sign of malignancy.The described method will perform a principal component analysis(PCA) on each of the nuclei surroundingglandular structures. The regular pattern around glands will be captured by computing the angle betweenthe principal direction of the nucleus and the normal vector to the gland surface. The method is graphicallyexemplified in Figure 4(a). A consistent parallel distribution of nuclei will result in a small standard deviationfor angles surrounding the gland, but also in small mean angular values.
Since investigating the arrangement of nuclei around ducts and glands requires an accurate gland and nu-clei segmentation, in the following, the gland segmentation and nuclei segmentation post processing steps areintroduced.
Gland detection and segmentation is based on the segmentation method described in Peng et al. [16]. Usingthe K-Means algorithm as an unsupervised learning method, we segment the images in four different clusters:
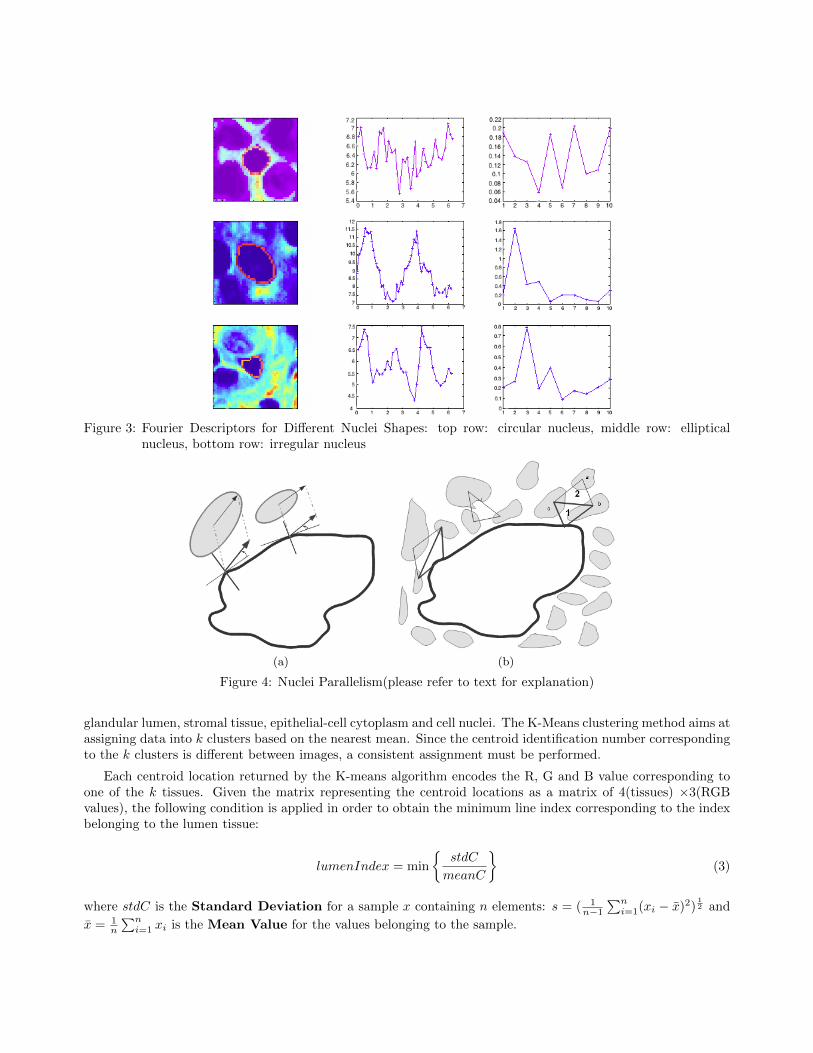
Figure 3: Fourier Descriptors for Different Nuclei Shapes: top row: circular nucleus, middle row: ellipticalnucleus, bottom row: irregular nucleus
(a) (b)
Figure 4: Nuclei Parallelism(please refer to text for explanation)
glandular lumen, stromal tissue, epithelial-cell cytoplasm and cell nuclei. The K-Means clustering method aims atassigning data into k clusters based on the nearest mean. Since the centroid identification number correspondingto the k clusters is different between images, a consistent assignment must be performed.
Each centroid location returned by the K-means algorithm encodes the R, G and B value corresponding toone of the k tissues. Given the matrix representing the centroid locations as a matrix of 4(tissues) ×3(RGBvalues), the following condition is applied in order to obtain the minimum line index corresponding to the indexbelonging to the lumen tissue:
lumenIndex = min
{stdC
meanC
}(3)
where stdC is the Standard Deviation for a sample x containing n elements: s = ( 1n−1
∑ni=1(xi − x)2)
12 and
x = 1n
∑ni=1 xi is the Mean Value for the values belonging to the sample.
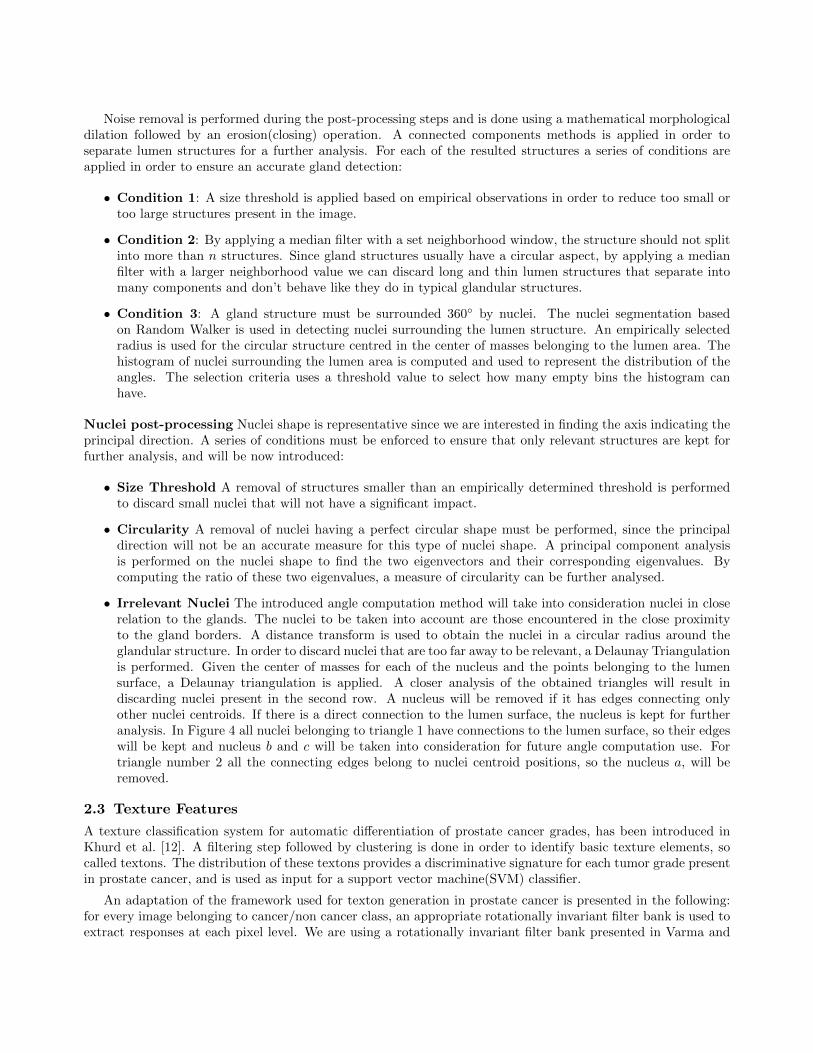
Noise removal is performed during the post-processing steps and is done using a mathematical morphologicaldilation followed by an erosion(closing) operation. A connected components methods is applied in order toseparate lumen structures for a further analysis. For each of the resulted structures a series of conditions areapplied in order to ensure an accurate gland detection:
• Condition 1: A size threshold is applied based on empirical observations in order to reduce too small ortoo large structures present in the image.
• Condition 2: By applying a median filter with a set neighborhood window, the structure should not splitinto more than n structures. Since gland structures usually have a circular aspect, by applying a medianfilter with a larger neighborhood value we can discard long and thin lumen structures that separate intomany components and don’t behave like they do in typical glandular structures.
• Condition 3: A gland structure must be surrounded 360◦ by nuclei. The nuclei segmentation basedon Random Walker is used in detecting nuclei surrounding the lumen structure. An empirically selectedradius is used for the circular structure centred in the center of masses belonging to the lumen area. Thehistogram of nuclei surrounding the lumen area is computed and used to represent the distribution of theangles. The selection criteria uses a threshold value to select how many empty bins the histogram canhave.
Nuclei post-processing Nuclei shape is representative since we are interested in finding the axis indicating theprincipal direction. A series of conditions must be enforced to ensure that only relevant structures are kept forfurther analysis, and will be now introduced:
• Size Threshold A removal of structures smaller than an empirically determined threshold is performedto discard small nuclei that will not have a significant impact.
• Circularity A removal of nuclei having a perfect circular shape must be performed, since the principaldirection will not be an accurate measure for this type of nuclei shape. A principal component analysisis performed on the nuclei shape to find the two eigenvectors and their corresponding eigenvalues. Bycomputing the ratio of these two eigenvalues, a measure of circularity can be further analysed.
• Irrelevant Nuclei The introduced angle computation method will take into consideration nuclei in closerelation to the glands. The nuclei to be taken into account are those encountered in the close proximityto the gland borders. A distance transform is used to obtain the nuclei in a circular radius around theglandular structure. In order to discard nuclei that are too far away to be relevant, a Delaunay Triangulationis performed. Given the center of masses for each of the nucleus and the points belonging to the lumensurface, a Delaunay triangulation is applied. A closer analysis of the obtained triangles will result indiscarding nuclei present in the second row. A nucleus will be removed if it has edges connecting onlyother nuclei centroids. If there is a direct connection to the lumen surface, the nucleus is kept for furtheranalysis. In Figure 4 all nuclei belonging to triangle 1 have connections to the lumen surface, so their edgeswill be kept and nucleus b and c will be taken into consideration for future angle computation use. Fortriangle number 2 all the connecting edges belong to nuclei centroid positions, so the nucleus a, will beremoved.
2.3 Texture Features
A texture classification system for automatic differentiation of prostate cancer grades, has been introduced inKhurd et al. [12]. A filtering step followed by clustering is done in order to identify basic texture elements, socalled textons. The distribution of these textons provides a discriminative signature for each tumor grade presentin prostate cancer, and is used as input for a support vector machine(SVM) classifier.
An adaptation of the framework used for texton generation in prostate cancer is presented in the following:for every image belonging to cancer/non cancer class, an appropriate rotationally invariant filter bank is used toextract responses at each pixel level. We are using a rotationally invariant filter bank presented in Varma and
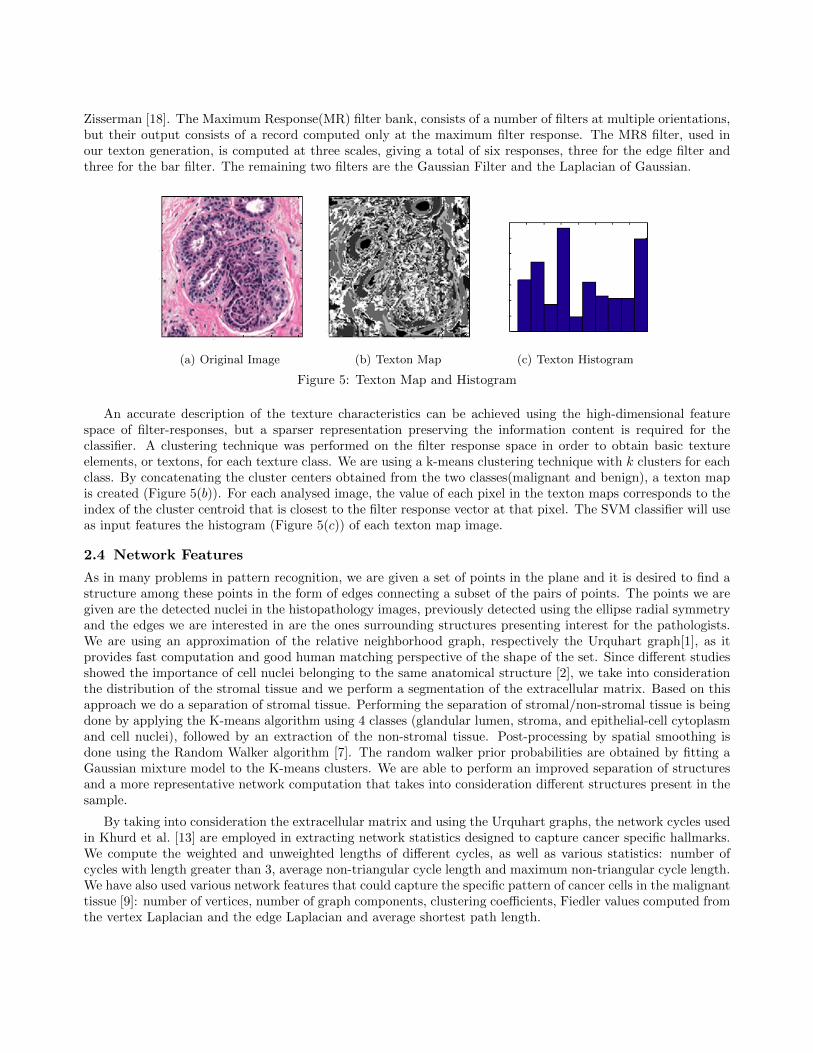
Zisserman [18]. The Maximum Response(MR) filter bank, consists of a number of filters at multiple orientations,but their output consists of a record computed only at the maximum filter response. The MR8 filter, used inour texton generation, is computed at three scales, giving a total of six responses, three for the edge filter andthree for the bar filter. The remaining two filters are the Gaussian Filter and the Laplacian of Gaussian.
(a) Original Image (b) Texton Map (c) Texton Histogram
Figure 5: Texton Map and Histogram
An accurate description of the texture characteristics can be achieved using the high-dimensional featurespace of filter-responses, but a sparser representation preserving the information content is required for theclassifier. A clustering technique was performed on the filter response space in order to obtain basic textureelements, or textons, for each texture class. We are using a k-means clustering technique with k clusters for eachclass. By concatenating the cluster centers obtained from the two classes(malignant and benign), a texton mapis created (Figure 5(b)). For each analysed image, the value of each pixel in the texton maps corresponds to theindex of the cluster centroid that is closest to the filter response vector at that pixel. The SVM classifier will useas input features the histogram (Figure 5(c)) of each texton map image.
2.4 Network Features
As in many problems in pattern recognition, we are given a set of points in the plane and it is desired to find astructure among these points in the form of edges connecting a subset of the pairs of points. The points we aregiven are the detected nuclei in the histopathology images, previously detected using the ellipse radial symmetryand the edges we are interested in are the ones surrounding structures presenting interest for the pathologists.We are using an approximation of the relative neighborhood graph, respectively the Urquhart graph[1], as itprovides fast computation and good human matching perspective of the shape of the set. Since different studiesshowed the importance of cell nuclei belonging to the same anatomical structure [2], we take into considerationthe distribution of the stromal tissue and we perform a segmentation of the extracellular matrix. Based on thisapproach we do a separation of stromal tissue. Performing the separation of stromal/non-stromal tissue is beingdone by applying the K-means algorithm using 4 classes (glandular lumen, stroma, and epithelial-cell cytoplasmand cell nuclei), followed by an extraction of the non-stromal tissue. Post-processing by spatial smoothing isdone using the Random Walker algorithm [7]. The random walker prior probabilities are obtained by fitting aGaussian mixture model to the K-means clusters. We are able to perform an improved separation of structuresand a more representative network computation that takes into consideration different structures present in thesample.
By taking into consideration the extracellular matrix and using the Urquhart graphs, the network cycles usedin Khurd et al. [13] are employed in extracting network statistics designed to capture cancer specific hallmarks.We compute the weighted and unweighted lengths of different cycles, as well as various statistics: number ofcycles with length greater than 3, average non-triangular cycle length and maximum non-triangular cycle length.We have also used various network features that could capture the specific pattern of cancer cells in the malignanttissue [9]: number of vertices, number of graph components, clustering coefficients, Fiedler values computed fromthe vertex Laplacian and the edge Laplacian and average shortest path length.
2.5 Feature Selection
Feature selection is the technique of selecting a subset of relevant features for building robust learning methodsby reducing the training complexity and increasing the accuracy. As currently used databases contain more andmore features, the majority of which is often redundant or irrelevant, the necessity of selecting relevant featuresarises. A feature selection method should improve the prediction performance of the classifier while providing afaster and more cost-effective classification system. It has to produce simpler classification models and gain aninsight in the underlying process that generated the data.
Because a simple combination of features that provide a high classification performance doesn′t necessarilyprovide a better feature set[11], different methods that take into consideration the dependency among features(redundancy) have been developed by Peng et al. [15] and by Yu and Liu [19].
The minimum redundancy-maximum relevance feature selection is a robust and accurate feature selectiontechnique that extracts features minimally redundant among themselves and maximally relevant to the targetclasses.
Maximum Relevance: is a feature selection criterion which approximates J (Sm, c) in equation with themean value of all mutual information values between individual feature xi and class c:
max D (S, c) , D=1
|S|∑xi∈S
I(xi; c) (4)
where I is the mutual information and |S| is the number of features in S. Since the remained features might havea high redundancy property another feature selection must be performed after applying the maximum relevancecriterion.
Minimal Redundancy: is a feature selection criterion that selects mutually exclusive features:
min R (S) , R =1
|S|2∑
xi,xj∈S
I (xi; xj) (5)
The MRMR method finds the subset of features that maximizes D-R in an incremental manner by addingone feature at a time.
3. RESULTS
In this section we show the details of the experiments on both texton features and network features used.Experiments are based on 512 × 512 image patches that were taken from large, several GPixel large, H&Estained “virtual slides”. For the texton analysis the results are computed using images down-sampled by a factorof 2. The slides are sampled at 0.47 microns/pixel, corresponding to 40X objective scan. A number of 100 patcheswere marked by pathologists as “diagnostically relevant” and labelled as malignant or benign. For training thesupport vector machine(SVM) classifier we selected 30 images(15 of each type: malignant and benign) and forvalidation of our algorithm the rest of 70 images had been used. We perform 10 runs for different train/testpartitions and report mean and standard deviation values of the classification accuracies and the area underthe ROC (Receiver Operating Characteristic) curve. The reported classification results are obtained using theLibSVM library for support vector machines [4]. We have used a radial basis kernelK(xi, xj) = exp(−γ||xi−xj ||2,with γ = 1
number of features .
Morphometric Features
The set of morphometric features is captured from the nuclei size based on the Random Walker Segmentation,the Fourier Shape Descriptors, and from the computation of the Hessian matrix for every pixel in the image.
The nuclear size is computed by finding the number pixels belonging to each segmented nucleus. The randomwalker segmentation is applied on the original image data-set, pre-processed by extracting only the H channel.Computing the standard deviation of the nuclear size over each of the images from the data-set will capture this
relevant cancer specific mark. A good feature used in distinguishing between malignant and benign samples isthe mean value of the Rb defined in the methods section computed over the entire image.
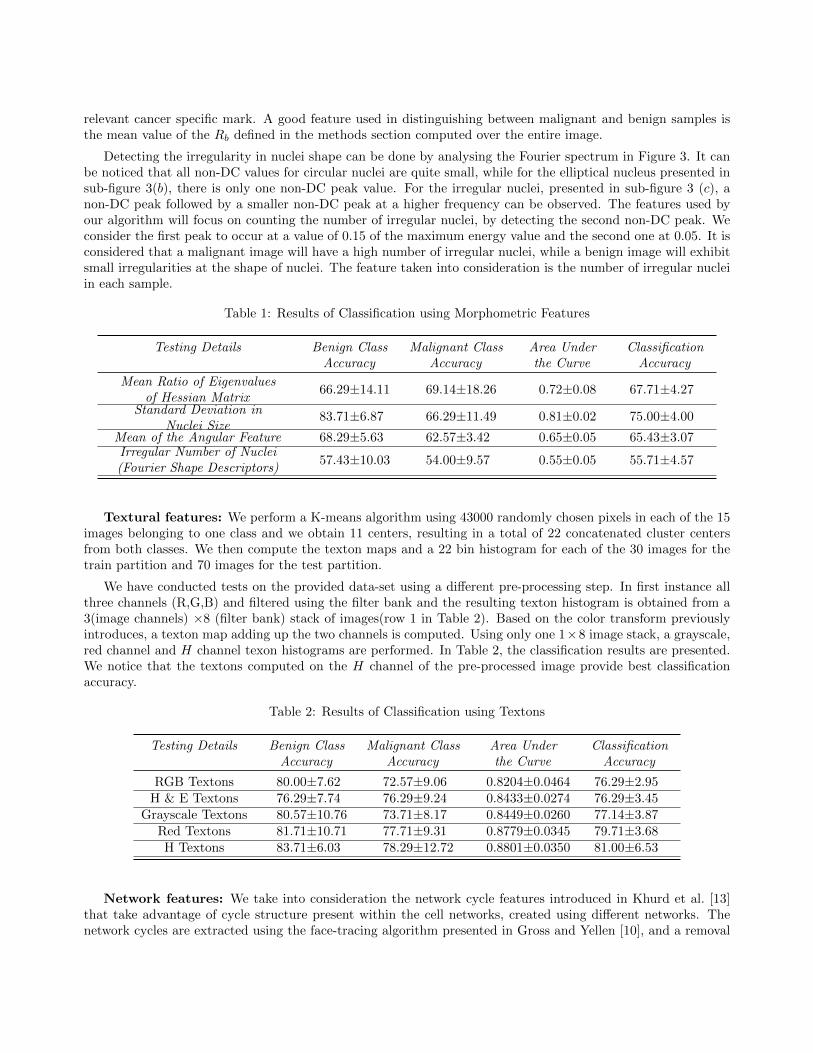
Detecting the irregularity in nuclei shape can be done by analysing the Fourier spectrum in Figure 3. It canbe noticed that all non-DC values for circular nuclei are quite small, while for the elliptical nucleus presented insub-figure 3(b), there is only one non-DC peak value. For the irregular nuclei, presented in sub-figure 3 (c), anon-DC peak followed by a smaller non-DC peak at a higher frequency can be observed. The features used byour algorithm will focus on counting the number of irregular nuclei, by detecting the second non-DC peak. Weconsider the first peak to occur at a value of 0.15 of the maximum energy value and the second one at 0.05. It isconsidered that a malignant image will have a high number of irregular nuclei, while a benign image will exhibitsmall irregularities at the shape of nuclei. The feature taken into consideration is the number of irregular nucleiin each sample.
Table 1: Results of Classification using Morphometric Features
Testing Details Benign ClassAccuracy
Malignant ClassAccuracy
Area Underthe Curve
ClassificationAccuracy
Mean Ratio of Eigenvaluesof Hessian Matrix
66.29±14.11 69.14±18.26 0.72±0.08 67.71±4.27
Standard Deviation inNuclei Size
83.71±6.87 66.29±11.49 0.81±0.02 75.00±4.00
Mean of the Angular Feature 68.29±5.63 62.57±3.42 0.65±0.05 65.43±3.07Irregular Number of Nuclei(Fourier Shape Descriptors)
57.43±10.03 54.00±9.57 0.55±0.05 55.71±4.57
Textural features: We perform a K-means algorithm using 43000 randomly chosen pixels in each of the 15images belonging to one class and we obtain 11 centers, resulting in a total of 22 concatenated cluster centersfrom both classes. We then compute the texton maps and a 22 bin histogram for each of the 30 images for thetrain partition and 70 images for the test partition.
We have conducted tests on the provided data-set using a different pre-processing step. In first instance allthree channels (R,G,B) and filtered using the filter bank and the resulting texton histogram is obtained from a3(image channels) ×8 (filter bank) stack of images(row 1 in Table 2). Based on the color transform previouslyintroduces, a texton map adding up the two channels is computed. Using only one 1×8 image stack, a grayscale,red channel and H channel texon histograms are performed. In Table 2, the classification results are presented.We notice that the textons computed on the H channel of the pre-processed image provide best classificationaccuracy.
Table 2: Results of Classification using Textons
Testing Details Benign ClassAccuracy
Malignant ClassAccuracy
Area Underthe Curve
ClassificationAccuracy
RGB Textons 80.00±7.62 72.57±9.06 0.8204±0.0464 76.29±2.95H & E Textons 76.29±7.74 76.29±9.24 0.8433±0.0274 76.29±3.45
Grayscale Textons 80.57±10.76 73.71±8.17 0.8449±0.0260 77.14±3.87Red Textons 81.71±10.71 77.71±9.31 0.8779±0.0345 79.71±3.68H Textons 83.71±6.03 78.29±12.72 0.8801±0.0350 81.00±6.53
Network features: We take into consideration the network cycle features introduced in Khurd et al. [13]that take advantage of cycle structure present within the cell networks, created using different networks. Thenetwork cycles are extracted using the face-tracing algorithm presented in Gross and Yellen [10], and a removal
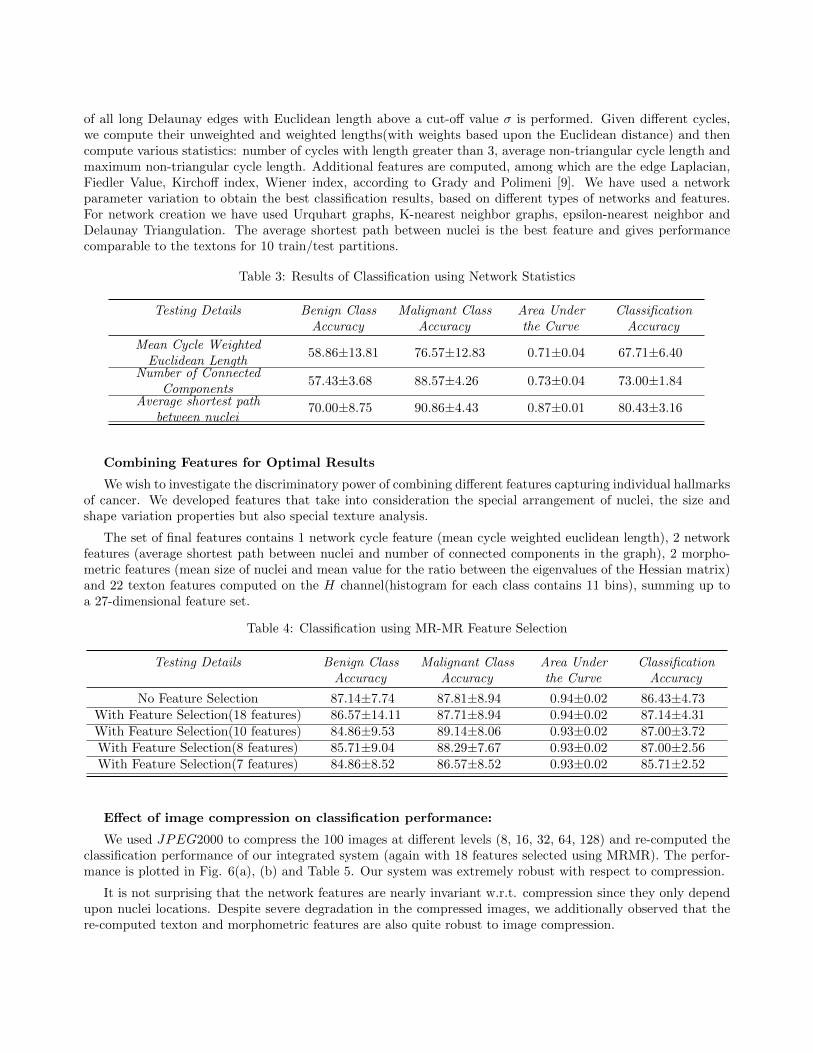
of all long Delaunay edges with Euclidean length above a cut-off value σ is performed. Given different cycles,we compute their unweighted and weighted lengths(with weights based upon the Euclidean distance) and thencompute various statistics: number of cycles with length greater than 3, average non-triangular cycle length andmaximum non-triangular cycle length. Additional features are computed, among which are the edge Laplacian,Fiedler Value, Kirchoff index, Wiener index, according to Grady and Polimeni [9]. We have used a networkparameter variation to obtain the best classification results, based on different types of networks and features.For network creation we have used Urquhart graphs, K-nearest neighbor graphs, epsilon-nearest neighbor andDelaunay Triangulation. The average shortest path between nuclei is the best feature and gives performancecomparable to the textons for 10 train/test partitions.
Table 3: Results of Classification using Network Statistics
Testing Details Benign ClassAccuracy
Malignant ClassAccuracy
Area Underthe Curve
ClassificationAccuracy
Mean Cycle WeightedEuclidean Length
58.86±13.81 76.57±12.83 0.71±0.04 67.71±6.40
Number of ConnectedComponents
57.43±3.68 88.57±4.26 0.73±0.04 73.00±1.84
Average shortest pathbetween nuclei
70.00±8.75 90.86±4.43 0.87±0.01 80.43±3.16
Combining Features for Optimal Results
We wish to investigate the discriminatory power of combining different features capturing individual hallmarksof cancer. We developed features that take into consideration the special arrangement of nuclei, the size andshape variation properties but also special texture analysis.
The set of final features contains 1 network cycle feature (mean cycle weighted euclidean length), 2 networkfeatures (average shortest path between nuclei and number of connected components in the graph), 2 morpho-metric features (mean size of nuclei and mean value for the ratio between the eigenvalues of the Hessian matrix)and 22 texton features computed on the H channel(histogram for each class contains 11 bins), summing up toa 27-dimensional feature set.
Table 4: Classification using MR-MR Feature Selection
Testing Details Benign ClassAccuracy
Malignant ClassAccuracy
Area Underthe Curve
ClassificationAccuracy
No Feature Selection 87.14±7.74 87.81±8.94 0.94±0.02 86.43±4.73With Feature Selection(18 features) 86.57±14.11 87.71±8.94 0.94±0.02 87.14±4.31With Feature Selection(10 features) 84.86±9.53 89.14±8.06 0.93±0.02 87.00±3.72With Feature Selection(8 features) 85.71±9.04 88.29±7.67 0.93±0.02 87.00±2.56With Feature Selection(7 features) 84.86±8.52 86.57±8.52 0.93±0.02 85.71±2.52
Effect of image compression on classification performance:
We used JPEG2000 to compress the 100 images at different levels (8, 16, 32, 64, 128) and re-computed theclassification performance of our integrated system (again with 18 features selected using MRMR). The perfor-mance is plotted in Fig. 6(a), (b) and Table 5. Our system was extremely robust with respect to compression.
It is not surprising that the network features are nearly invariant w.r.t. compression since they only dependupon nuclei locations. Despite severe degradation in the compressed images, we additionally observed that there-computed texton and morphometric features are also quite robust to image compression.
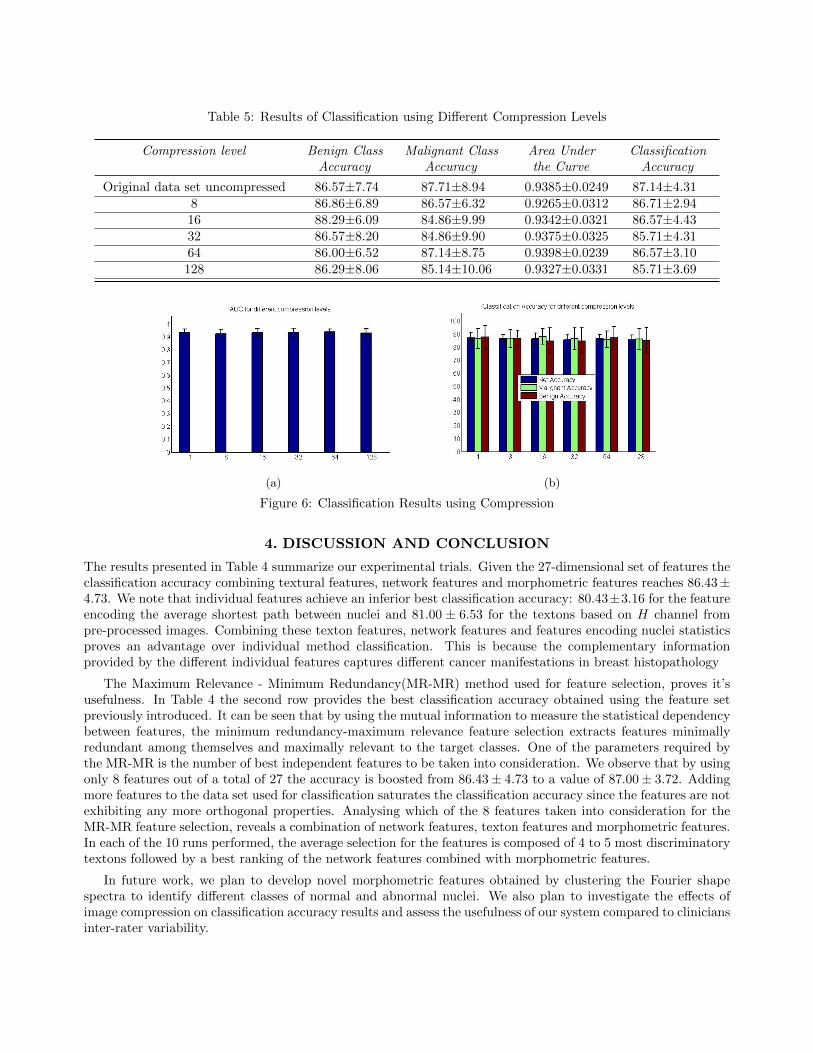
Table 5: Results of Classification using Different Compression Levels
Compression level Benign ClassAccuracy
Malignant ClassAccuracy
Area Underthe Curve
ClassificationAccuracy
Original data set uncompressed 86.57±7.74 87.71±8.94 0.9385±0.0249 87.14±4.318 86.86±6.89 86.57±6.32 0.9265±0.0312 86.71±2.9416 88.29±6.09 84.86±9.99 0.9342±0.0321 86.57±4.4332 86.57±8.20 84.86±9.90 0.9375±0.0325 85.71±4.3164 86.00±6.52 87.14±8.75 0.9398±0.0239 86.57±3.10128 86.29±8.06 85.14±10.06 0.9327±0.0331 85.71±3.69
(a) (b)
Figure 6: Classification Results using Compression
4. DISCUSSION AND CONCLUSION
The results presented in Table 4 summarize our experimental trials. Given the 27-dimensional set of features theclassification accuracy combining textural features, network features and morphometric features reaches 86.43±4.73. We note that individual features achieve an inferior best classification accuracy: 80.43±3.16 for the featureencoding the average shortest path between nuclei and 81.00 ± 6.53 for the textons based on H channel frompre-processed images. Combining these texton features, network features and features encoding nuclei statisticsproves an advantage over individual method classification. This is because the complementary informationprovided by the different individual features captures different cancer manifestations in breast histopathology
The Maximum Relevance - Minimum Redundancy(MR-MR) method used for feature selection, proves it’susefulness. In Table 4 the second row provides the best classification accuracy obtained using the feature setpreviously introduced. It can be seen that by using the mutual information to measure the statistical dependencybetween features, the minimum redundancy-maximum relevance feature selection extracts features minimallyredundant among themselves and maximally relevant to the target classes. One of the parameters required bythe MR-MR is the number of best independent features to be taken into consideration. We observe that by usingonly 8 features out of a total of 27 the accuracy is boosted from 86.43± 4.73 to a value of 87.00± 3.72. Addingmore features to the data set used for classification saturates the classification accuracy since the features are notexhibiting any more orthogonal properties. Analysing which of the 8 features taken into consideration for theMR-MR feature selection, reveals a combination of network features, texton features and morphometric features.In each of the 10 runs performed, the average selection for the features is composed of 4 to 5 most discriminatorytextons followed by a best ranking of the network features combined with morphometric features.
In future work, we plan to develop novel morphometric features obtained by clustering the Fourier shapespectra to identify different classes of normal and abnormal nuclei. We also plan to investigate the effects ofimage compression on classification accuracy results and assess the usefulness of our system compared to cliniciansinter-rater variability.
ACKNOWLEDGMENTS
This work was supported by National Institutes of Health/National Institute of Biomedical Imaging and Bio-engineering (NIH/NIBIB) under Grant R01EB008055.
References
[1] D.V. Andrade and L. De Figueiredo. Good approximations for the relative neighbourhood graph. InProceedings of the 13th Canadian Conference on Computational Geometry (CCCG01), pages 25–28, 2001.
[2] C.C. Bilgin, P. Bullough, G.E. Plopper, and B. Yener. ECM-aware cell-graph mining for bone tissue modelingand classification. Data mining and knowledge discovery, 20(3):416–438, 2010.
[3] HJG Bloom and WW Richardson. Histological grading and prognosis in breast cancer: a study of 1409cases of which 359 have been followed for 15 years. British Journal of Cancer, 11(3):359, 1957.
[4] Chih-Chung Chang and Chih-Jen Lin. LIBSVM: A library for support vector machines. ACMTransactions on Intelligent Systems and Technology, 2:27:1–27:27, 2011. Software available athttp://www.csie.ntu.edu.tw/ cjlin/libsvm.
[5] E. Cosatto, M. Miller, H.P. Graf, and J.S. Meyer. Grading nuclear pleomorphism on histological micrographs.In Pattern Recognition, 2008. ICPR 2008. 19th International Conference on, pages 1–4. IEEE, 2008.
[6] A. Frangi, W. Niessen, K. Vincken, and M. Viergever. Multiscale vessel enhancement filtering. MedicalImage Computing and Computer-Assisted Interventation MICCAI 1998, pages 130–137, 1998.
[7] L. Grady. Multilabel random walker image segmentation using prior models. In Computer Vision andPattern Recognition, 2005. CVPR 2005. IEEE Computer Society Conference on, volume 1, pages 763–770.IEEE, 2005.
[8] L. Grady. Random walks for image segmentation. IEEE transactions on pattern analysis and machineintelligence, pages 1768–1783, 2006.
[9] L.J. Grady and J.R. Polimeni. Discrete Calculus: Applied Analysis on Graphs for Computational Science,volume 3. SpringerLinkLink, 2010.
[10] J.L. Gross and J. Yellen. Graph theory and its applications. CRC press, 2006.
[11] J. Jager, R. Sengupta, and W.L. Ruzzo. Improved gene selection for classification of microarrays. InProceedings of the eighth Pacific Symposium on Biocomputing: 3–7 January 2003; Lihue, Hawaii, pages53–64, 2003.
[12] P. Khurd, C. Bahlmann, P. Maday, A. Kamen, S. Gibbs-Strauss, E.M. Genega, and J.V. Frangioni.Computer-aided gleason grading of prostate cancer histopathological images using texton forests. In Biomed-ical Imaging: From Nano to Macro, 2010 IEEE International Symposium on, pages 636–639. IEEE, 2010.
[13] P. Khurd, L. Grady, A. Kamen, S. Gibbs-Strauss, E.M. Genega, and J.V. Frangioni. Network cycle features:Application to computer-aided gleason grading of prostate cancer histopathological images. In BiomedicalImaging: From Nano to Macro, 2011 IEEE International Symposium on, pages 1632–1636. IEEE, 2011.
[14] G. Loy and A. Zelinsky. A fast radial symmetry transform for detecting points of interest. ComputerVision-ECCV 2002, pages 358–368, 2002.
[15] H. Peng, F. Long, and C. Ding. Feature selection based on mutual information criteria of max-dependency,max-relevance, and min-redundancy. Pattern Analysis and Machine Intelligence, IEEE Transactions on, 27(8):1226–1238, 2005.
[16] Y. Peng, Y. Jiang, L. Eisengart, M.A. Healy, F.H. Straus, and X.J. Yang. Segmentation of prostatic glandsin histology images. In Biomedical Imaging: From Nano to Macro, 2011 IEEE International Symposiumon, pages 2091–2094. IEEE, 2011.
[17] M. Singh, J. Ni, and C. Bahlmann. Generalized fast radial symmetry transform (GFRS) for ellipse detectionand application to histopathology for ellipse detection and application to histopathology, Siemens InternalTechnical Report, SCR-12-TR-880, 2011.
[18] M. Varma and A. Zisserman. Classifying images of materials: Achieving viewpoint and illumination inde-pendence. Computer Vision-ECCV 2002, pages 255–271, 2002.
[19] L. Yu and H. Liu. Efficiently handling feature redundancy in high-dimensional data. In Proceedings of theninth ACM SIGKDD international conference on Knowledge discovery and data mining, pages 685–690.ACM, 2003.