automated ict system health monitoring using grafana
TRANSCRIPT

Automated ICT system health
monitoring using Grafana
Sharif Fadhil
Master’s thesis December 2020 Technology Full Stack Software Development

Description
Author(s)
Fadhil, Sharif Type of publication
Master’s thesis Date
2020
Language of publication: English
Number of pages 81
Permission for web
publication: x
Title of publication
Automated ICT system health monitoring using Grafana
Degree programme
Full Stack Software Development Supervisor(s)
Huotari, Jouni and Kotikoski, Sampo
Assigned by
Futures Platform
Abstract
Futures Platform is a consultation company which provides foresights solutions and a tool to visualize all different possible solutions related to foresight.
As the technology evolve and ICT developments becomes more complex, there is been a need to understand the behaviour of the system architecture. This matter focuses more on the logging of what is happening on the background during the time applications are actively running, the process of logging includes several services components like CPU, usage, Network connections, Memory consumptions and so on.
In this project the focus has been to address the need of implementing monitoring system and also eradicating on time problems that may occurs after system faults. Several times these issues go un-noticed keep running on the background and they only emerged as visible errors on the user interface once reached certain thresholds. Project aimed to provide stable and reliable services without having noticed faults.
Ansible has been developed and design to achieve and aid configurations of most of the automation processes for different systems the idea of using ansible playbook in this implementation has been due to the advantages explained in this report but also the ability of Ansible to manage multiple server configurations in one configuration file.
The monitoring baseline of server’s components to be logged/monitored were developed, the method of the installation was investigated and researched then finally during the project implementation Ansible scripts were developed to achieve the project’s goal.
Keywords/tags (subjects)
Automated monitoring, Ansible, Telegraf, Grafana, Influx DB, System monitoring, APM Miscellaneous (Confidential information)

1
Contents
1 Introduction .................................................................................................. 8
1.1 Background .................................................................................................. 8
1.2 Project Goal ................................................................................................. 9
2 Research Settings......................................................................................... 10
2.1 Research summary .................................................................................... 10
2.2 Qualitative Research. ................................................................................ 10
2.3 Research interview .................................................................................... 11
2.4 Data gathered from interview ................................................................... 13
2.5 Benchmarking ............................................................................................ 14
2.6 Results summary ....................................................................................... 16
3 Effective automated monitoring................................................................... 16
3.1 Automated monitoring.............................................................................. 16
3.2 Need for effective automated monitoring ................................................ 24
3.2.1 Early issues detection ........................................................................... 26
3.2.2 Service availability ................................................................................ 27
3.2.3 Performances or APM .......................................................................... 28
3.2.4 Predictions ............................................................................................ 31
3.3 General system requirements ................................................................... 31
3.4 Framework ................................................................................................ 32
3.4.1 Influx DB ................................................................................................ 32
3.4.2 Grafana ................................................................................................. 33
3.4.3 Telegraf ................................................................................................. 35
4 Installation process ...................................................................................... 36
4.1 Ansible ....................................................................................................... 36
4.1.1 Maintaining multiple systems servers .................................................. 39

2
4.1.2 Vaults ids for storing secrets ................................................................ 39
4.2 Set up GitLab project ................................................................................. 40
4.2.1 Clone above created project locally ..................................................... 41
4.2.2 Project specific settings ........................................................................ 42
4.3 Initial setup of Influx DB ............................................................................ 49
4.4 Initial setup of Grafana .............................................................................. 53
4.5 Initial setup of Telegraf ............................................................................. 57
4.6 Configuring dashboards on Grafana ......................................................... 58
4.7 Settings for alerting rules .......................................................................... 60
5 Testing phase (QA) ....................................................................................... 63
5.1 Quality Assurance ...................................................................................... 63
5.2 Testing methodologies .............................................................................. 64
5.3 QA Results ................................................................................................. 66
6 Evaluation of the project .............................................................................. 67
6.1 Evaluation at Futures Platform ................................................................. 67
6.2 Need for evaluation from different parties............................................... 69
6.3 What was evaluated .................................................................................. 70
6.4 Evaluation method .................................................................................... 71
6.5 Evaluation results ...................................................................................... 72
7 Production deployment ............................................................................... 72
7.1 Deployment process .................................................................................. 72
7.2 Project timeframe ..................................................................................... 73
8 Discussion.................................................................................................... 74
8.1 Project conclusion. .................................................................................... 74
8.2 Fitted our needs ........................................................................................ 75
8.3 Maintenance ............................................................................................. 75

3
References .......................................................................................................... 77
Appendices ......................................................................................................... 80

4
Figure
Figure 1. Problem solving with sticky notes ................................................................. 13
Figure 2. Benchmarking Grafana with Prometheus ..................................................... 15
Figure 3. General overview of the host metrics ........................................................... 16
Figure 4. Detailed overview of the metrics .................................................................. 17
Figure 5. Microsoft Teams alerting .............................................................................. 18
Figure 6. Email alerting ................................................................................................. 19
Figure 7. Monitored resources ..................................................................................... 21
Figure 8. API-led service connectivity .......................................................................... 22
Figure 9. API monitoring............................................................................................... 23
Figure 10. Host based metrics, elastic search .............................................................. 25
Figure 11. Application metrics ..................................................................................... 25
Figure 12. Network metrics in the application............................................................. 26
Figure 13. Services interrupts peaks. ........................................................................... 27
Figure 14. Stable service host. ..................................................................................... 28
Figure 15. APM measures ............................................................................................ 30
Figure 16. Monitored host’s overview ......................................................................... 30
Figure 17. Influx DB API connections ........................................................................... 33
Figure 18. Influx DB hardware sizing ............................................................................ 33
Figure 19. Grafana main dashboard. ............................................................................ 34
Figure 20. Detailed Grafana dashboard ....................................................................... 35
Figure 21. Telegraf architecture ................................................................................... 36
Figure 22. Ansible automation tool architecture ......................................................... 37
Figure 23. Project set up with Ansible ......................................................................... 38
Figure 24. Basic project set up on Gitlab ..................................................................... 41
Figure 25. Project specific settings ............................................................................... 43
Figure 26. Detailed host dashboard ............................................................................. 59
Figure 27. An overview dashboard type. ..................................................................... 59
Figure 28. Settings for detailed dashboard. ................................................................. 60
Figure 29. QA general processes .................................................................................. 64
Figure 30. Evaluation process. ..................................................................................... 68

5
Figure 31. Production environment hosts ................................................................... 73
Figure 32. Project end results on Git ............................................................................ 74
Figure 33. System development lifecycle..................................................................... 76

6
Tables
Table 1. Qualitative Methods used in the project ....................................................... 11
Table 2. Some of the unstructured questions asked to the interviewee .................... 12
Table 3. Benchmark types used in the project ............................................................. 14
Table 4. Testing results ................................................................................................. 66

7
Acronyms
API Application Programming Interface
APM Application Performance Monitoring
DB Database
CD Continuous Delivery
CI Continuous Integrations
CPU Central Processing unit
CMS Content Management System
DevOps Development and Operations
HA High Availability
ICT Information Communications Technology
SPOF Single Point of Failure
QA Quality Assurance
UI User Interface
UX User Experience

8
1 Introduction
1.1 Background
This report has different purposes, main one is demonstrating how systems
monitoring infrastructure can be installed and maintained using different advanced
frameworks. How this technology can benefit organizations in early issue detections
by understanding problematic components of the services before they become
visible issues. Also, how it can benefit DevOps people to utilize the gathered metrics
from the monitoring systems for the purposes of having better understand of the
service architecture and how they operate in terms of resources usage.
This report can also serve as a tool for evaluating ICT projects or any projects in
general. It explains some found fundamentals of how projects are evaluated and why
in order to benefits organizations or target audiences.
Since technology is evolving rapidly and ICT systems are becoming even more
complex. The development complexity of the systems can become challenging to
track and monitor, this is where the major problem in DevOps is. These systems can
have faults and issues where no one understand what is going on until the fault
becomes visible one to the end user. By using proper monitoring tool DevOps
professionals are able to monitor, log and predict any complex system architecture.
By doing so they will be able to be alerted whenever they are a fault in the system,
and they would have enough time to rectify it before it becomes visible to the end
users. This is the major issue experienced in many organizations and in this project,
implementation is to have better control of the system architecture no matter how
complex they are.
The report has several advantages including the knowledge of how to install Grafana
using Influx DB, how to read the metrics obtained from the tool in order to
understand system health. How the metrics can help to predict the upcoming issues,
faults or errors that may occur in the system. The document also explains how the
project was successfully evaluated within the organization, meaning that what
evaluation method was, participants involved and also based on the evaluation how
the project fits the organization’s needs.

9
The report is suitable for audience who want to learn and understand installing and
using Grafana as monitoring tool, how this tool can help in managing ICT system
health and how it can help to correct small system faults before they become visible.
More specifically, this report’s audience are DevOps professionals, System
Administrators, Developers and Technical Engineers/Support. But also, Project
managers and ICT Management professionals can also benefit from the report.
1.2 Project Goal
The project’s goal was to address the problem existing in the system architecture,
where issues, errors and faults were not detected until they become visible ones on
UI.
Many times, there has been undetected system faults, it could be any from using too
many resources to low memory. These has caused problems to the end users of the
system by where they report these faults when becoming visible ones, instead of
being detected and rectified before they are noticed.
Using system monitoring tools such as Grafana helped in combat these problems on
the architecture level of applications. Another goal which I based on the project’s
research was to expand share the knowledge how to install this tool using ansible
playbook. Learning on how to install this tool has extended the current knowledge
and based on the metrics gathered has made the application/system to be handled
in an efficient way. Hopefully this project can help readers to gather some insights on
this area and increase their application management systems.
A person benefited from this report would be able to share how the granularity of
the information of this report has helped them to understand how to install the tool
and also would be able to confirm that this method worked. As experienced many
times, technical documentations can be difficult for beginners as they contained way
too much technical details that a nontechnical person wouldn’t easily understand.
Basically, an individual reading this report should be able to say that the information
was clear, easy to understand and the method used has worked on its purposes. It
also helps to answer some technical questions in simplest way as possible. As this

10
report shows how to install Grafana using Influx DB as well as Telegraf and if the
component of the report has worked then the goal of the project was reached.
2 Research Settings
2.1 Research summary
This project required a research in order to understand how to install the Grafana
tool and its required components, mainly technical parts. There were different
installation processes from different DevOps professionals, but the research was
more focused on clearly documented instructions/process that even nontechnical
person would be able to understand.
There are two ways or methods of how to perform a research which are qualitative
and quantitate. These two methods are both effective on collecting data, but they
use different approach in doing so, the nature of this project required discussions
and dialogue from different end users and DevOps professionals. Thus, based on the
descriptive data type needed in this project then the research approach that was
used was qualitative.
In this project benchmarking and interviews were also used. Benchmarking is an
effective way to compare two components, this can elaborate some attributes of one
item compare to another one and find out which of them is beneficial over the other.
This process can help in the decisions making against useful component, principles,
best practices and so on.
2.2 Qualitative Research.
Qualitative Research is one of the scientific researches that look for answers to some
questions (Hammarberg & Kirkman & Lacey 2016). This method uses procedure for
collecting evidence which help to produce new findings and expand the knowledge
of the topic. Qualitative research also seeks to understand and produce deeper
knowledge of a given topic from different perspective of the focus group involved.

11
There are several common methods for conducting qualitative research, in this
project it was more focused on the interviews and focus groups. This was to have
broader view of the topic and gather good quality data as see in Table 1.
Table 1. Qualitative Methods used in the project
Method Description
Interviews This was a very good and appropriate
method for this topic. It was more focus
on understanding individuals
understand and experiences of the topic
and also their comments on how certain
topic can be rectified. Rectification of
the problem ways of solving rather than
technically how.
Focus Groups With focus groups, it was aimed
internally to understand the behaviour
of the of different departments when
faults start to emerge. This helped to
generate broad overview of the issues
experienced by different people.
2.3 Research interview
Short interview was conducted to a group of eight people from different
departments so as to expand the possibilities of collecting good data. One of the
colleagues interviewed was Max Stucki Senior Foresight Analyst on 21 June 2020 who
has expertise of the tool to be monitored and also the colleagues is handling clients
who are end users of the tool. Mainly the focus of the interview was to understand
and gather data about what we can do in order to improve our services availability
and performances. Interviews are good way to gather direct insight from the
audience, to collect good insights the interview would need to be conducted in

12
elaborations way (Indeed 2020). The type of interview used in this project was
unstructured, meaning that we allowed discussions between the topic and also the
topic of the changed according to the one discussed previously. The aim on this type
of interview was to achieve a regular type of conversation rather than asking
questions, this was to make audiences more comfortable and attentive to the
subject. The questions used in this interview were completely less technical this was
to allow nontechnical colleagues to understand the topic and give their input on the
subject.
The interview provided some valuable insights on how these system faults are
affecting the general usability of the tool and how installing Grafana would help to
ensure service is available most of the time.
Table 2. Some of the unstructured questions asked to the interviewee
Research questions Explanation
What we can do in order to achieve and
ensure good services availability of the
platform?
Initial respond of this question from
several audience was that it would be
good for tech team to understand what
is happening on the platform, where
problems are and how they can tackle
them.
If we have system monitoring tool in
place? Will it help?
It would help if the monitoring system if
tech team is able to follow up with the
system. To clarify this this section most
of the interviewees meant that there
should be a way for monitoring system
to let tech team know of any ongoing
issues. This means we are talking about
alert notifications on practice.
Will it improve usability of our tool? From the interview held, it was
discussed that having monitoring tool
will definitely improve the usability of

13
the platform since end users will not see
errors resulted from architecture
failures.
Will it improve general way of handling
errors/faults?
Definitely it will (Max Stucki 21 June
2020)
Will the team have a better control of
the system?
Understanding the behaviour of the
architecture is crucial, so indeed will
have better control of the system
architecture.
2.4 Data gathered from interview
Data received was analysed in forms of cards/post notes, each question and possible
solutions was placed together. Which was then later used to find the best tool that
could meet most of the solutions suggested by the interviewee. Such method of
using cards (Problem solving with sticky notes) found to be successful in such that it
visualizes the best approach towards possible solutions. This also allows several team
members to see the problem from different perspective that facilitate in better
understand of the core issue and how rectifying core problem can improve our
services. Figure 1 illustrates solutions approach using sticky notes
Figure 1. Problem solving with sticky notes

14
2.5 Benchmarking
How benchmarking is applicable to this project is that there was a need to evaluate
best practices and how other professionals have solved similar issues, also using
which. methods.
Benchmarking can be defined as a process of comparing and learn from others on
what is the best way, standard or practice based on your needs (Inspire One 2018).
The main need for benchmarking was to locate best practices of system monitoring
tools available that would fit organizational needs. The tool had to be from well-
maintained/develop frameworks, ease of implementation and also easily readable
obtained metrics. Simply any person should be able to read the metrics and identify
any faults or inconsistencies.
Based on the nature of the project, there was a need to conduct three types of
benchmarking in order to obtain good quality data that can be used to determine the
project success.
Table 3. Benchmark types used in the project
Types of Benchmarking Applicable reasons
Performance
benchmarking
The main reason for implementing performance
benchmarking was to gather as much data as possible
related to the functionality of Grafana. In this section
quantitative data was compared, meaning that data and
metrics from these two tools were compared to
determine the performances of each.
As illustrated in Figure 2 below (Hoffman, 2020), during
this project Grafana was compared with another tool
Prometheus to understand which have better options
and features that fits organization’s needs. Each point of
difference was compared in terms of data.

15
Figure 2. Benchmarking Grafana with Prometheus
Practice benchmarking This method of benchmarking involved gathering and
also comparing information about where between this
tool there a gap or big differences is. In this section it is
very important to determine the practicalities of both
tools to observe and decide which of the tool would fit
the organization needs.
Internal benchmarking With internal benchmarking the tool was compared with
server’s own monitoring tool to determine the accuracy
and readability of the data metrics. Also results from this
tool were compared with several internal traffic
monitoring tools.

16
2.6 Results summary
Based on the results obtained from the benchmarking process and data gathered
from the technical comparison, the decisions were to install Grafana for monitoring
purposes of the application. This way we would solve most of the problems
experienced before and also understanding the application’s behaviour even deeper.
We would also be using this tool to visualize the data and keep logs of the hosts.
3 Effective automated monitoring
3.1 Automated monitoring
Monitoring is a process which is tracking the progress of an activity periodically and
systematically by gathering and analysing data (M&E studies, 2015). Monitoring a
system involves routinely gathering data which is measuring the progress of towards
accomplishing the objectives of the programme. Basically, the metrics or data
gathered should inform to what extent the system goals have been achieved.
Figure 3 shows the metrics of this project (from one of the API host) after it has been
evaluated and completed. So, metrics like these are able to tell a lot of information
about the system architecture and its behaviour.
Figure 3. General overview of the host metrics
17
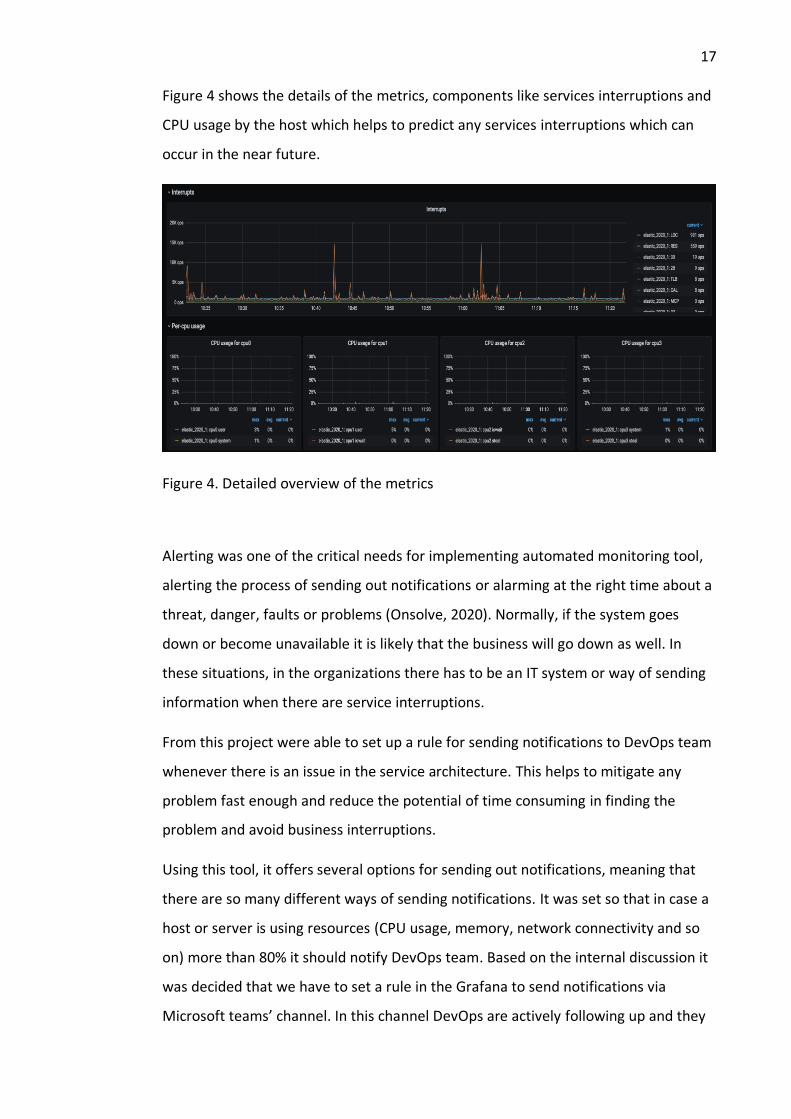
Figure 4 shows the details of the metrics, components like services interruptions and
CPU usage by the host which helps to predict any services interruptions which can
occur in the near future.
Figure 4. Detailed overview of the metrics
Alerting was one of the critical needs for implementing automated monitoring tool,
alerting the process of sending out notifications or alarming at the right time about a
threat, danger, faults or problems (Onsolve, 2020). Normally, if the system goes
down or become unavailable it is likely that the business will go down as well. In
these situations, in the organizations there has to be an IT system or way of sending
information when there are service interruptions.
From this project were able to set up a rule for sending notifications to DevOps team
whenever there is an issue in the service architecture. This helps to mitigate any
problem fast enough and reduce the potential of time consuming in finding the
problem and avoid business interruptions.
Using this tool, it offers several options for sending out notifications, meaning that
there are so many different ways of sending notifications. It was set so that in case a
host or server is using resources (CPU usage, memory, network connectivity and so
on) more than 80% it should notify DevOps team. Based on the internal discussion it
was decided that we have to set a rule in the Grafana to send notifications via
Microsoft teams’ channel. In this channel DevOps are actively following up and they

18
do have channel notifications option turned on. This was believed to be easy way of
notifying in case of urgent issues.
Figure 5 illustrates an example of an alert sent from Grafana to Microsoft team
channel notifying about the CPU usage is high for news feed host. It can be seen that
it took around nine minutes to rectify the problem and the new alert was sent out
that everything is ok.
Figure 5. Microsoft Teams alerting
Another form of alerting decided was to send out emails to an outlook email
distribution list, this means the same rule as discussed above was set but simply
using different alerting channel which in this option was Microsoft outlook. This was
again easy to notify since DevOps have their email notifications on and would
actively ready these alert emails from Grafana.
Figure 6 displays an example of an alert sent from Grafana to Microsoft outlook
notifying about the CPU usage is high for news feed host.

19
Figure 6. Email alerting
Application performance monitoring (APM) is a broad subject which involves the
process of ensuring business applications and systems are performing as expected. In
this project it was also one of the main factors to implementing this tool due to the
ongoing experienced faults which were not noticed until they become visible on the

20
UI. Having good experienced how these problems occurs, they are mostly
architecture level problems that happens on any system.
• Memory consumptions
• CPU usage.
• Disk space
• Network connectivity
• Load balancing
• Interruptions levels
• Kernel and so on.
Monitoring these resources was able to gather good insight (in the form of metrics)
on how the servers are behaving and what they are doing. APM is something that
needs to be kept running all the time, and DevOps actively following up with the alert
sent out from Grafana. Each request and transactions in the application are
measured by the tool, then administrators are able to quickly figure out the issues
that has any negative impact on the application’s performances.
Figure 7 illustrates services components monitored by Grafana

21
Figure 7. Monitored resources
In general, connected services are critical to monitor and in practice they must be
tracked and logged.
Figure 8 (Pearlman, 2017) describes an example of API-led services connectivity
which is becoming complex to monitor the architectural behaviour of the service.

22
Figure 8. API-led service connectivity
Since information systems are becoming more complex, there is a need to
understand the infrastructural behaviour in terms of how services are connected and
how they affect one another. Thus, it is essential for any system to ensure reliability
and stability of the services it provides this includes having the visibility of the overall
system health and performances. There are several components of the system that
can be real-time monitored, but this depends on the environments and how critical
they are. In our needs we will monitor overall system health, so components like
databases, API and containers.
Figure 9 (Smartbear, 2020) shows API monitoring.

23
Figure 9. API monitoring
Effective real-time performance monitoring not only help to understand the metrics
of the data but also reduce the time for development and operations people
(DevOps) to trace and trouble shoot any root cause of the system failure. It gives the
ability to catch any complications before it turns into a problem that it noticeable by
end-users. This ensure that they provide and maintain high quality of the services
and its availability, based on the metrics it also assists them to make good informed
decisions about the future of the overall infrastructure of their system.
The time used to spend in order to find the root cause of the system failure has been
reduce by the help of several monitoring aids. DevOps are no longer spending hours
to trace a problem and fix it, but nowadays they are able to see and understand the
metrics even before they turn into an issue which can then later on cause failure.

24
This also help to predict if there will be some faults or issues in the near future,
which service component will be affected and to what extent.
3.2 Need for effective automated monitoring
Monitoring system health is an essential component of information system’s
architect operation. DevOps professionals need to understand the information
outputted by the system in the form of feedback about its’ activities, and those
activities can be overall components that makes certain services in a system. This
feedback needs to be monitored, assessed and applying any actions required.
One of the key feedbacks to be monitored and assessed could be for example below.
• To determine where the system meets the performance operational standards.
• To determine system faults and future predictions
• To be able to alert about the any faults
• Overall operations and resources usage of the system.
• To understand when the system is mostly utilized by the users, basically to determine active hours and such.
There are several service components that can be monitored in order to understand
the architectural behaviour of an applications, this can be categorized as type of
information track (Ellingwood, 2017). These value types that DevOps can monitor,
and the information gathered can probably change some elements of the system
architecture. Normally system operates on different architectural hierarchy, so it can
be little bit challenging to decide what type of metrics are available on these
different layers and how the metrics can aid in the system stability. Below is some of
the components that can be monitored, it depends on the services and its
architecture.
Host based metrics:
For development team this was very important components, to be able to
understand and measure the metrics of all components that makes ours services.
These includes several API, CMS tool etc. These metrics which obtained from host
based were like CPU usage, memory, disk space please see Figure 10.

25
Figure 10. Host based metrics, elastic search
Software or application metrics:
Here we wanted to understand the application as one component in terms of
functionality. This mainly depends on what kind services it is, the integrations (API)
and other services dependencies, how all of these elements function together.
Errors, failures, performances and resources usage were some of the component
metrics that were captured and measured as seen in Figure 11.
Figure 11. Application metrics

26
Network metrics:
In most applications monitoring network connectivity in the infrastructure can be
worth monitoring, this is because how important connectivity is and if it happens
that there is a network issue then that means the whole services will be down. So,
understanding network metrics is very important, and this should be checked its
correctness and overall functionality in order to deliver necessary performances.
Connectivity, errors, packet loss and even bandwidth can be some of the
components to be measured, see Figure 12.
Figure 12. Network metrics in the application.
3.2.1 Early issues detection
This is one of the critical components to be considered in the development of system
health monitoring. Early issue detection or early problem detection can be defined
as a process of alerting system developers about an event that may take an

27
unexpected behaviour and lead to system failures. Normally early issue detection will
require some actions in order to prevent unwanted problems.
Anomality detections can reduce time and efforts by locating any threating issue in
the system functionality and applying applicable fixes.
Figure 13 illustrates service interrupts which occurs every now and then, it displays
the intensity and time which lead to determine when is the next interruption will
occur.
Figure 13. Services interrupts peaks.
3.2.2 Service availability
Information systems are becoming more complex as new technologies emerge and
develop, this makes challenging in ensuring services are available whenever they are
needed. If it happens that a system lost its availability, then in the business world this
can lead to a bigger problem when it comes to transactions or any other services.
Service availability has a key requirement which is to provide and deploy highly
available systems that has low intensity of interruptions even in the events of failure.
Using system health monitoring tool can aid services availability, as mentioned in this
report detecting and rectifying issues before they become visible on the UI.
The aim of this project in terms of services was also to make sure that the
organization provides highly available system that is available to the end user 99% of
the time. Based on this reason it was aimed to take increasingly sophisticated
measures together with the software development life cycle to ensure that HA is
reached by designing the system that will have no single point of failure (SPOF).

28
Using automated monitoring system like Grafana will enable detections of failures
for both stateless and stateful components in the services architecture, meaning that
DevOps professionals will be able to achieve load balance between nodes or hosts
that build the services (APIs). Monitoring these hosts will understand and predicts
any upcoming services interruptions and thus we have achieved the goal of services
available.
Below image demonstrate services availability in one of the hosts in the architecture,
it shows that it has been using the resources efficiently and no interruptions.
Figure 14 shows an example of stable monitored services.
Figure 14. Stable service host.
3.2.3 Performances or APM
The needs of monitoring the performance of the applications or APM was clearly
discussed and that it to have an ability in detecting and diagnosing complex
application performance issues to maintain and provide good services (Suresh,

29
2020). With APM using Grafana it was about ensuring that system is performing as
expected all the time using proper tracking, visualizing metrics, alerting from end-
point failures and also reporting performances issues. Also, the end goal in the
performances monitoring was to make sure that services were supplied
uninterrupted to the end users and its quality needs to be good.
APM is becoming inevitable components of the services and in DevOps teams, it has
become a duty to solve the needs by providing stable services infrastructure and
environments that support the applications.
APM solutions can help to combat the challenges faced in the production
environment’s architecture example in this project’s application user can run a query
to retrieve data from elastic search and if this query takes too long to return results it
means that there is an issue which can be hard to identify. In this project it was set
that if a query takes more than defined timeframe to return results then Grafana
must alert DevOps professionals about it. What will follow is to look at the metrics of
the elastic search and identify why it is taking too long to respond or basically
pointing out the problem which could be anywhere from high resources usage or
endpoint failure.
This was one of the problems faced before implementing this tool, with the help of
the tool these types of issues and many are tracked, monitored and fixed withing
short period of time.
Below are some components of APM, where monitored application traffics are
essential in identifying problems in the UI.
In Figure 15 (dnstuff, 2020) illustrates general ways or methods of measuring
application performances.

30
Figure 15. APM measures
With Figure 16, we can see the overall behaviour of all services components that are
integrated in the application architecture. We can easily pinpoint which host is
problematic and with detailed data we can find out what problems are.
Figure 16. Monitored host’s overview

31
3.2.4 Predictions
Predicting the behaviour of the application was also essential in the project, using
the metrics obtained from monitoring tool DevOps are able to tell when the peak of
issue will go high and reach failure state. A good example if host is using too much
memory to execute the services and it has taken x amount of time to reach 70% of
the memory usage, based on the timeframes it means that DevOps will know how
long it will take to reach 100%. During this time a person will understand how much
time left or how much time they have to identify the issue and fix it before memory
usage is 100% which is a total failure.
With this tool and the data gathered a person will be able to tell a lot of information
about the behaviour of the application. They will see how the patterns and metrics
ae affected over time, how they change and also when certain issues are recurring
and why.
3.3 General system requirements
In order to install Grafana, the tool requires that a person need to have Python 2.7 or
above ad also Ansible 2.8 or above, these are the main tools for the installation
process.
These two configurations tools are very important in the installation process, of
course user can select their own. If we take ansible as an example it has a lot of
advantages which explains which we decided to adopt it.
• It is agentless, meaning that it does not have any dependencies in order to install it.
• Ansible can be installed on the machine even before starting the project.
• Ansible offers secure communication protocol (SSH), so this offers secure channel.
• Ansible playbook is easy to use and modify accordingly.
• You have the ability to encrypt and decrypt secrets of the playbook.
We need to have Python library in order to store and use data in a time series
database (Influx DB). But also, ansible modules are written in Python including core

32
ones which makes Ansible work. So, by default Ansible will automatically try to find
Python configurations.
3.4 Framework
Framework is defined as a crucial supporting component of building up and object
(Rouse 2020). For this project there are three essentials tools needed to make
Grafana perform as expected. Ansible playbook was used as the main configurations
management tool for the automation purposes, ansible was built to and designed to
support configuration management on different systems.
Apart from Ansible there were frameworks which goes parallel with Grafana and
they are explained in the sub-chapter of this section
3.4.1 Influx DB
According to Influx Data (Influx Data 2020), Influx DB is an open-source time series
database that is written is statistical programming language, which is designed for
fast compiling, efficient data collection as well as highly availability data storage. This
database also offers high quality real-time data visualizations which helps DevOps to
evaluate the metrics progress with time and makes the management and handling
data series efficiently.
• It offers high data performances
• Easy to write and manage queries for retrieving data
• Ability to compact data reduce data storage
• Offers down sampling feature
Figure 17 (Nigam 2018) illustrates example of HTTP API send to Influx DB which is
then sent to Grafana.

33
Figure 17. Influx DB API connections
Figure 18 (Nigam 2018) we can see how Influx DB hardware sizing needs.
Figure 18. Influx DB hardware sizing
3.4.2 Grafana
Grafana is a defined as an open-source data visualizations and analytic application
(Grafana Labs 2020). Due to the advanced features of tool, it allows DevOps to create
and query highly visualize dashboards and also explore the metrics. This tool
converts time series data from the databases passed to Influx DB into graphs and
visuals where user can select data and time frame to be displayed. It depends on the
organization’s needs but there are many possible ways to visualize time series data
using Grafana. For this project the aim of Grafana was to let users read and
understand the metrics delivered from Influx DB. They should be easily interpretable

34
and insightful. Also, these metrics and dashboards can be re-used for different
purposes and use cases, since values are variables.
The project aimed to explore the metrics and create logs of the monitored servers, it
was also required to split the data into several different views with the ability to
compare them alongside using separate dashboards.
Another good feature of Grafana where this project wanted to achieve is the option
of sending out alert notifications whenever they are faults which have reached
defined thresh hold in the tool. Of course, alerting rules are per needs and as
explained on previous chapters for this project was decided that to send notification
to Outlook email and Microsoft teams’ channel.
Figure 19 shows the main front page of Grafana installed on this project.
Figure 19. Grafana main dashboard.
Figure 20 illustrates metrics from Drupal API, which is monitored using Grafana and
as we can see we do have stable metrics.

35
Figure 20. Detailed Grafana dashboard
3.4.3 Telegraf
Telegraf is plugin-driver server needed in Influx DB installation for collecting and also
reporting data (Influx Data 2020). Telegraf offers the ability to connect to different
data sources to collect and send data to the destination defined. The need of
collecting various application and services data metrics for various purposes has
made this project to select Telegraf due it its lightweight nature. Telegraf itself
contains over 200 plugins (Berman 2019) which aid in the data gathering and writing
process which then data is easily shipped to other services like Grafana or data
storage.
Figure 21 (Influx Data) demonstrates the architecture

36
Figure 21. Telegraf architecture
4 Installation process
The installation process was long, it took time since the framework were new to this
project and also it took time to find out the proper ways of how to install this tool
plus errors and fix. After gathering knowledge, it easy to follow up and also coming
up with my own process and which component to implement first then followed by
another.
4.1 Ansible
Ansible is rapidly rising an open-source ICT automation tool which is used for several
IT related tasks such as configurations, application deployment (CI/CD), services
orchestration and so on (Red Hat 2020). With this IT can automate many complex
tasks in order to simplify these complex tasks and make them more manageable with
saving time. This also allows developers to focus on other task while ansible

37
automate some of them thus it frees up a lot of time and also it lifts up the efficiency.
There are few advantages of why we have chosen this tool for implementing
automated monitoring system such as:
- It is an open-source tool; thus, no costs are involved. It is free for anyone and any organization.
- With this tool it only needs some basic understand of the ansible playbook, thus no special skills are needed. So, there is no need to invest of much time neither resources for learning ansible.
- Ansible is a powerful tool, it can manage very complex tasks and automate them. In our project we have manage to automate many of the tasks such data integrations, alerting, hosts configurations and so on.
- Ansible is an independent tool, there was no need to install any extra software or services in order to run it.
- We had more time to focus on other developments and let ansible run on the background.
Figure 22 (Keecheeril 2016) illustrates Ansible architecture and how it is working.
Figure 22. Ansible automation tool architecture
Figure 23 describes the project was set up using Ansible playbook.

38
Figure 23. Project set up with Ansible

39
4.1.1 Maintaining multiple systems servers
Ansible was used to maintain multiple servers due to its ability to manage grouped
servers or manage common configurations between servers which results in server
management automation. Using this tool’s playbook which had re-usable tasks, it
was able to ease set up monitoring configurations of several servers and manage to
send data quickly. All servers related configurations are expressed in the playbook
code and are executed across any specified hosts to access the data.
With maintaining multiple servers in the project, it was able to make any changes
very fast from adding/removing/editing new hosts in the hosts’ file. The tool only
concerns about the servers IP address and credentials which were stores in the next
chapter.
4.1.2 Vaults ids for storing secrets
Ansible vault can be used to encrypt any file or variables from inside the playbook. In
this project we will use ansible built-in-vault module for encrypting credentials in the
project repository, these credentials should never be pushed un-encrypted this is
because they cannot be removed from Git repository. We need to add Git commit
hook that will check the secret files.
New encrypted file can be created by using ansible vault command, whereby secrets
is the file name.
ansible-vault create secrets.yml
After that you will be prompted for a password and the ansible vault command
should launch the default system file editor (Phpstorm used in this project).
Executing Ansible playbook with encrypted files requires passing the vault password
for the secret files and there are two ways to achieve this.
1. Using interactive mode and asking for password every time, you need to use below command when running ansible. This means user will be prompted to add password whenever they need to execute playbook with encrypted files. –ask-vault-pass

40
2. Storing the vault password locally on your machine outside project repository by running below ansible command. --vault-id=project_name@<path_to_local_vault_file>
In this project we have selected second option which is to store vaults locally since
there will be no need of asking for password every time we work with secrets and
also for storing multiple vaults. This way you can enter the passwords for each host
as string on a single line in the above created file.
There are many resources explaining how to use ansible commands with example,
those are not listed in this report, but they are available from Ansible official website
(https://docs.ansible.com/ansible/latest/index.html ).
4.2 Set up GitLab project
Depends on the organizations and how they handle projects, some individuals might
choose to work with the project locally until some point they create remote project
and push what they have been working on. For this case remote project was first
created on Git, this was based on organizational policies and best practices. This
means that correct project details were added and including users of this project.
Users can be defined per needs, but this project choose to add the whole technical
teams so that everyone is aware of what is going on, what has been done and what is
expected to be completed.
Based on own experiences, it is easier to give access to the whole technical team for
several needs such as:
Project status review – This is how projects are followed up, supervisor and
colleagues can simply login to Git and see the project details together with the
progress. This creates transparency in the team and good communications, and of
course in case project is delayed for one reason or another then it is easier for any
team member to review the project and help.
Code review – Sharing the project with the team makes it easier to do code review
with the responsible person. Thus, since they already have access to the project, they
won’t have a need to request it.

41
Figure 24 shows an example of how new project was added in GitLab, due to the
sensitivity of the project and Git accounts it was decided to include this example
from general Git level.
Figure 24. Basic project set up on Gitlab
4.2.1 Clone above created project locally
This one of the straightforward steps, on the local machine set up a folder of any
name, preferably name that user can easily understand. Navigate into the folder
using terminal in Mac or cmd on windows and simply clone the project created on
Git by using below commands.
cd foldercreatedabove
git clone https://github.com/project/repository.git
These are different ways to do it, one might implement the project first locally and
then push changes to Git, but for this project we first created project reposit. Other
individual might rename the project locally but for this project name consistency was

42
important thus everything was exactly from remote to locally. As mention previously,
this part has more than one implementation method, thus user needs to select what
fits for their own needs.
Upon completing cloning process, then folder structure was created. This was based
on the framework described above and also environments to be monitored. As see
from Figure 24 the project structure and inside the folder project specific data as
added in the Ansible playbook.
4.2.2 Project specific settings
In the ansible playbook configurations folder, there several configurations were
made. These are mainly project specific settings, which act as basic settings for the
whole project.
It can be seen from the Figure 25 on ansible>config>monitoring.yml.

43
Figure 25. Project specific settings

44
Configurations for Grafana domain URL and path, this is where domain needs to be
defined as well as Grafana path for accessing the tool. URL is where the toll will be
hosted.
grafana:
domain: 'yourdomain.com'
path: 'grafana'
Configurations for sending out email notifications, this was needed in the alerting
process of this tool. SMTP email server needs to be defined.
smtp:
host: 'in-v3.mymail.com'
port: 587
sender:
name: 'Grafana Monitoring'
address: '[email protected]'
Microsoft teams’ notifications settings as well as email notification specific settings
were added, in this section these needs to be defined so that Grafana knows where
to send the notifications. The frequency for sending out alert is two hours.
notification:
channels:
email_channel:
name: email-channel
type: email
uid: notifier1
orgId: 1
isDefault: false
sendReminder: true
frequency: 2h
disablResolveMessage: false
settings:
singleEmail: false
addresses: '[email protected]'
teams_channel:
name: teams-channel
type: teams
uid: notifier2
orgId: 1
isDefault: false
sendReminder: true
frequency: 2h
disablResolveMessage: false
# url is kept in secrets

45
After that in the basic configurations default Grafana dashboards were defined, this
is for visualizing the metrics that will be obtained. These dashboard settings are by
default and they can be found from Grafana source, but they can also be modified
per needs.
dashboards:
grafana:
- template: 'detailed-dashboard.json.j2'
uid: '000000651'
name: "Detailed staging dashboard"
datasource: '{{ influx.databases.staging.name }}'
- template: 'detailed-dashboard.json.j2'
uid: '000000652'
name: "Detailed monitoring dashboard"
datasource: '{{ influx.databases.monitoring.name }}'
- template: 'detailed-dashboard.json.j2'
uid: '000000653'
name: "Detailed production dashboard"
datasource: '{{ influx.databases.prod.name }}'
- template: 'alert-dashboard.json.j2'
uid: '000000654'
name: "Overview production dashboard"
datasource: '{{ influx.databases.prod.name }}'
hosts: '{{ grafana_influx_prod_hosts.query_results |
map(attribute="value") | list }}'
extra_mountpoints:
mongo_1:
- /mongo-data
alerts:
cpu:
threshold: 50
notifiers:
- uid: '{{
grafana.notification.channels.email_channel.uid }}'
- uid: '{{
grafana.notification.channels.teams_channel.uid }}'
memory:
threshold: 80
notifiers:
- uid: '{{
grafana.notification.channels.email_channel.uid }}'
- uid: '{{
grafana.notification.channels.teams_channel.uid }}'
disk:
threshold: 80
notifiers:
- uid: '{{
grafana.notification.channels.email_channel.uid }}'
- uid: '{{
grafana.notification.channels.teams_channel.uid }}'
- template: 'alert-dashboard.json.j2'
uid: '000000655'
name: "Overview monitoring dashboard"
datasource: '{{ influx.databases.monitoring.name }}'
hosts: '{{ grafana_influx_monitoring_hosts.query_results |
map(attribute="value") | list }}'
extra_mountpoints:

46
influx_1:
- /var/fp
alerts:
cpu:
threshold: 50
notifiers:
- uid: '{{
grafana.notification.channels.email_channel.uid }}'
- uid: '{{
grafana.notification.channels.teams_channel.uid }}'
memory:
threshold: 80
notifiers:
- uid: '{{
grafana.notification.channels.email_channel.uid }}'
- uid: '{{
grafana.notification.channels.teams_channel.uid }}'
disk:
threshold: 80
notifiers:
- uid: '{{
grafana.notification.channels.email_channel.uid }}'
- uid: '{{
grafana.notification.channels.teams_channel.uid }}'
Influx DB settings, in this section host databases had to be defined and those were
based on the development process in place. Which is three environments
development for initial development, staging for performing QA of development
environment and finally production where it is a production environment. We have
given access Influx DB to several databases.
influx:
host: '10.4.12.44'
port: 8086
url: 'http://10.4.12.44:8086'
databases:
monitoring:
name: 'influxdb-fp-monitoring'
database: 'fp_monitoring_db'
prod:
name: 'influxdb-fp-prod'
database: 'fp_prod_db'
staging:
name: 'influxdb-fp-staging'
database: 'fp_staging_db'
Also, in the prod.yml file as seen from Figure 22, Telegraf settings had to be done.
Those were for collecting and reporting the metrics from production database. Rest
of the files were used for development and staging environment.

47
telegraf:
influx:
url: 'http://10.4.12.44:8086'
database: 'fp_prod_db'
Figure 22 shows infra folder where settings related to the whole project
infrastructure were made. Basically, components like Grafana servers and Influx DB
servers of the project, and these servers are the database defined from previous
section.
grafana_servers:
upcloud_hosts:
- title: "[Monitoring] Grafana host"
hostname: hostname.com
upcloud_plan: "1xCPU-2GB"
upcloud_storage_devices:
- { size: 30, os: Ubuntu 18.04 }
upcloud_firewall_rules: "{{ firewall.webserver_rules }} + {{
firewall.gitlab_ci_rules }}"
upcloud_user: "devops"
upcloud_ssh_keys: "{{ ssh_keys.devops }}"
upcloud_zone: de-fra1
influx_servers:
upcloud_hosts:
- title: "[Monitoring] Influx host"
hostname: hostname.com
upcloud_plan: "2xCPU-4GB"
upcloud_storage_devices:
- { size: 30, os: Ubuntu 18.04 }
upcloud_user: "devops"
upcloud_ssh_keys: "{{ ssh_keys.devops }}"
upcloud_zone: de-fra1
It is the inventory folder where we define all the hosts that are going to be
monitored, for this project all servers were defined and monitored. In this folder we
can list either individual hosts or custom defined groups of hosts. This means that
user can define group of devices running using similar roles e.g. content API
These are the inventory settings for Grafana ADD
[all:vars]
ansible_user=devops
[grafana_server]
94.237.98.70 short_name=grafana_1
nginx_domain_name=monitoring.yourdomain.com
[influx_server]
94.237.98.57 short_name=influx_1

48
.
Below is an example of the production inventory where all hosts to be monitored
were connected to Influx DB. For this project we managed to add multiple devices.
Hence, data has been changed for security reasons.
[all:vars]
ansible_user=devops
ansible_ssh_common_args='-o StrictHostKeyChecking=no'
[target_servers]
94.234.85.98 short_name=lb_private_1 uc_hostname=lb-
private.fp-prod.prod.fi uc_uuid=98377-c74a-47dc-23dsa-
e802d666e789
94.457.8.236 short_name=lb_public_1
uc_hostname=me.yourdomain.com uc_uuid=23423khkj-d68f-
490a-a8ae-2389hd77hd
94.466.09.652 short_name=host_1 uc_hostname=fp-
prod-host1.yourdomain.dev uc_uuid=kjshdkd273-6aad-
46ca-86df-sldkj238983
94.876.38.93 short_name=host_2 uc_hostname=fp-
prod-host2.yourdomain.dev uc_uuid=sdsad3-f879dsd4756-
8efb-adasd23e
94.988.93.491 short_name=rabbit_mq_1 uc_hostname=fp-
prod-rabbitmq.yourdomain.dev uc_uuid=sdwew322432-ddf3-
471f-98fd-2342342d223dwd23
94.763.93.322 short_name=my_api_postgres_1 uc_hostname=radar-
api-postgres.fp-prod.yourdomain.fi uc_uuid=ndhdh737373-d951-4d3d-
8319-7363hhdy26bd
94.098.987.994 short_name=my_api_1 uc_hostname=radar-
api.fp-prod.yourdomain.fi uc_uuid=nhdh78377-3feb-4e1e-
93ff-983hhd7636h3
94.724.99.507 short_name=minio_1
uc_hostname=minio.fp-prod.yourdomain.fi uc_uuid=nksd-
6fbf-43a9-jdhd7-jdjdj837ndn73
94.876.27.541 short_name=my_ai_minio_1 uc_hostname=myai-
minio.fp-prod.yourdomain.fi uc_uuid=00aa79e9-44f9-4941-a4d1-
582e8cb69a7b
94.237.31.138 short_name=my_ai_en_1 uc_hostname=myai-
en.fp-prod.yourdomain.fi uc_uuid=00acebde-6a66-4f37-a7be-
f29e929acced
94.237.83.115 short_name=my_ai_fi_1 uc_hostname=myai-
fi.fp-prod.yourdomain.fi uc_uuid=nasdkdakjansd-99ab-44fb-
8de1-3355fe072e9b
94.283.84.509 short_name=media_api_1
uc_hostname=media-api1.fp-prod.yourdomain.fi
uc_uuid=892398jh-c831-495f-ae9e-57a86d468bf5
94.237.31.128 short_name=media_api_2 uc_hostname=media-
api2.fp-prod.yourdomain.fi uc_uuid=00a8abe9-ac5e-4ff3-
94e4-98387237783hjjh2
94.237.26.224 short_name=elastic_2020_1 uc_hostname=fp-
prod-es2020.yourdomain.dev uc_uuid=9829737nwdjkd-f4a0-
4ebb-8b09-6f9ffb76f599

49
94.237.86.174 short_name=elastic_updater_1
uc_hostname=elastic-updater.fp-prod.yourdomain.fi
uc_uuid=001b0ad8-63cf-4aa0-ab93-22192f20cc2f
94.237.93.248 short_name=news_mine_postgres_1 uc_hostname=news-
mine-postgres.fp-prod.yourdomain.fi uc_uuid=008df7a7-2107-4f96-
b441-715ef0c33e27
94.237.93.247 short_name=news_mine_api_1 uc_hostname=news-
mine-api.fp-prod.yourdomain.fi uc_uuid=039383-50e6-48ba-9283-
af917eedb9e5
94.237.89.189 short_name=news_mine_scraper_1 uc_hostname=news-
mine-scraper.fp-prod.yourdomain.fi uc_uuid=938383jj-d449-4a93-
a5dd-6c5d9fda6f57
94.937.91.44 short_name=mongo_1 uc_hostname=fp-
prod-mongo.yourdomain.dev uc_uuid=0095506e-bd32-43b6-
b166-e552f740b5bd
94.2152.8.237 short_name=postgres_1
uc_hostname=postgres.fp-prod.yourdomain.fi
uc_uuid=0039ff88-0c7d-48f1-b2b7-932832882332j
94.9387.85.198 short_name=mysql_1
uc_hostname=mysql.fp-prod.yourdomain.fi
uc_uuid=00a12efa-6946-4e33-9409-jkasjkds878937893e
94.2938.89.191 short_name=redis_1
uc_hostname=redis.fp-prod.yourdomain.fi
uc_uuid=dkd838833-4ac3-jdjhd-8e6c-cee9b0dfe2bb
94.237.85.156 short_name=drupal_1
uc_hostname=drupal.fp-prod.yourdomain.fi
uc_uuid=00115169-de8f-446e-b943-lkjlkdk378937893
4.3 Initial setup of Influx DB
In this section of configurations, Influx DB services must be set up first this is because
Grafana uses Influx DB set up for fetching the hosts data for setting up the
dashboards. Initially Influx was configured for the testing environments which were
development where initial developments are done and second development2 which
is mainly for migrating developments done on the first environment and the doing
proper QA. So, at the beginning it was configured to have two databases and
production database was added later after evaluations process.
For each database added it had its own user for writing metrics and also one read-
only user used for Grafana.
Below are the Ansible commands used more can be found from several online
resource example from
(https://docs.influxdata.com/influxdb/v1.7/introduction/installation/ ).
ansible-playbook -i ansible/inventory/monitoring \

50
--vault-id=fp-monitoring@<path_to_local_vault_file> \
--extra-vars=@ansible/config/monitoring.yml \
--extra-vars=@ansible/secrets/monitoring.yml \
--tags=setup \
ansible/setup-influxdb.yml
Configuration (databases)
ansible-playbook -i ansible/inventory/monitoring \
--vault-id=fp-monitoring@<path_to_local_vault_file> \
--extra-vars=@ansible/config/monitoring.yml \
--extra-vars=@ansible/secrets/monitoring.yml \
--tags=config \
ansible/setup-influxdb.yml
There are several services components were also configured such Influx data volume
which the amount the data collected.
Docker networks settings were also implemented where image of influx dB: 1.8.0-
alpine was used. More information of these docker image versions for Influx can be
found from (https://hub.docker.com/_/influxdb ). Also starting docker service
contains settings were added, as well as creating Influx databases and database
rights were added.
Please refer to the below piece of code for the Influx DB implementations, hence
data values were modified.
- name: "Install required pip packages for influx"
pip:
state: 'present'
name: ['influxdb==5.3.0']
tags:
- setup
- name: "Make sure that directories exist"
file:
path: "{{ item }}"
state: directory
recurse: yes
with_items:
- '/var/fp/influxdb_data'
tags:
- setup
- name: "Create influx data volume"
docker_volume:
state: present
name: "influxdb_data"
driver_options:
type: none
device: '/var/fp/influxdb_data'
o: bind

51
tags:
- setup
- name: "Create docker networks"
docker_network:
state: present
name: "{{ item }}"
loop:
- monitoring_network
tags:
- setup
- name: "Start Influxdb service container"
docker_container:
state: started
restart_policy: unless-stopped
name: influxdb
image: "{{ influxdb_docker_image }}"
pull: no
recreate: no
ports:
- 8086:8086
env:
NFLUXDB_HTTP_AUTH_ENABLED: 'true'
INFLUXDB_ADMIN_USER: '{{ secrets.influx.admin.username }}'
INFLUXDB_ADMIN_PASSWORD: '{{ secrets.influx.admin.password }}'
log_driver: 'json-file'
log_options:
max-size: '200m'
max-file: '5'
volumes:
- influxdb_data:/var/lib/influxdb
networks:
- { 'name': 'monitoring_network' }
tags:
- setup
- name: "Create influx databases"
influxdb_database:
hostname: 'localhost'
port: 8086
username: '{{ secrets.influx.admin.username }}'
password: '{{ secrets.influx.admin.password }}'
database_name: '{{ item.value.database }}'
ssl: no
validate_certs: no
loop: '{{ lookup("dict", influx.databases) }}'
loop_control:
label: "{{ item.key }}"
tags:
- setup
- config
- name: "setup influx retention policy"
influxdb_retention_policy:
hostname: 'localhost'
port: 8086
username: '{{ secrets.influx.admin.username }}'
password: '{{ secrets.influx.admin.password }}'
database_name: '{{ item.value.database }}'
policy_name: default_retention_policy
duration: 4w
replication: 1

52
loop: '{{ lookup("dict", influx.databases) }}'
loop_control:
label: "{{ item.key }}"
tags:
- setup
- config
- name: "Create read-only user for grafana"
influxdb_user:
hostname: "localhost"
port: 8086
login_username: '{{ secrets.influx.admin.username }}'
login_password: '{{ secrets.influx.admin.password }}'
user_name: '{{ secrets.influx.grafana_user.username }}'
user_password: '{{ secrets.influx.grafana_user.username }}'
grants:
- database: '{{ influx.databases.monitoring.database }}'
privilege: 'READ'
- database: '{{ influx.databases.prod.database }}'
privilege: 'READ'
- database: '{{ influx.databases.staging.database }}'
privilege: 'READ'
tags:
- setup
- config
- name: "Create write-only user for telegraf monitoring hosts"
influxdb_user:
hostname: "localhost"
port: 8086
login_username: '{{ secrets.influx.admin.username }}'
login_password: '{{ secrets.influx.admin.password }}'
user_name: '{{
secrets.influx.databases.monitoring.telegraf_user.username }}'
user_password: '{{
secrets.influx.databases.monitoring.telegraf_user.password }}'
grants:
- database: '{{ influx.databases.monitoring.database }}'
privilege: 'WRITE'
tags:
- setup
- config
- name: "Create write-only user for telegraf prod hosts"
influxdb_user:
hostname: "localhost"
port: 8086
login_username: '{{ secrets.influx.admin.username }}'
login_password: '{{ secrets.influx.admin.password }}'
user_name: '{{
secrets.influx.databases.prod.telegraf_user.username }}'
user_password: '{{
secrets.influx.databases.prod.telegraf_user.password }}'
grants:
- database: '{{ influx.databases.prod.database }}'
privilege: 'WRITE'
tags:
- setup
- config
- name: "Create write-only user for telegraf staging hosts"
influxdb_user:
hostname: "localhost"

53
port: 8086
login_username: '{{ secrets.influx.admin.username }}'
login_password: '{{ secrets.influx.admin.password }}'
user_name: '{{
secrets.influx.databases.staging.telegraf_user.username }}'
user_password: '{{
secrets.influx.databases.staging.telegraf_user.password }}'
grants:
- database: '{{ influx.databases.staging.database }}'
privilege: 'WRITE'
tags:
- setup
- config
4.4 Initial setup of Grafana
Grafana services set up was added after completing Influx changes above. The setup
with done for the first two development environments explained on Chapter 4.3.
ansible-playbook -i ansible/inventory/monitoring \
--vault-id=fp-monitoring@<path_to_local_vault_file> \
--extra-vars=@ansible/config/monitoring.yml \
--extra-vars=@ansible/secrets/monitoring.yml \
--tags=setup \
ansible/setup-grafana.yml
Docker networks settings were also implemented where docker image of
Grafana/grafana:7.0.1-ubuntu was used. More information of these docker image
versions for Grafana can be found from (https://hub.docker.com/r/grafana/grafana/
). Also starting docker service containers settings were added, as well as creating
Influx databases and database rights were added. As explained on previous chapter
same settings were added on Grafana as well.
Please refer to the below piece of code for the Grafana implementations, hence
sensitive data values were modified.
# It's needed as we will get some hosts from influx to template the
dashboard
- name: "Install required pip packages for influx"
pip:
state: 'present'
name: ['influxdb==5.3.0']
tags:
- setup
- name: "Make sure that directories exist"

54
file:
path: "{{ item }}"
state: directory
recurse: yes
with_items:
- '/var/fp/grafana_data'
tags:
- setup
- name: "Create grafana data volume"
docker_volume:
state: present
name: "grafana_data"
driver_options:
type: none
device: '/var/fp/grafana_data'
o: bind
tags:
- setup
- name: "Create docker networks"
docker_network:
state: present
name: "{{ item }}"
loop:
- monitoring_network
tags:
- setup
- name: "Start Grafana service container"
docker_container:
state: started
restart_policy: unless-stopped
name: grafana
image: "{{ grafana_docker_image }}"
pull: no
recreate: no
ports:
- 3000:3000
env:
GF_SERVER_PROTOCOL: "http"
GF_SERVER_DOMAIN: "{{ grafana.domain }}"
GF_SERVER_ENFORCE_DOMAIN: "false"
GF_SERVER_ROOT_URL: "%(protocol)s://%(domain)s/{{ grafana.path
}}"
GF_SECURITY_ADMIN_PASSWORD: "{{ secrets.grafana.admin.password
}}"
GF_SMTP_ENABLED: "true"
GF_SMTP_HOST: '{{ grafana.smtp.host }}:{{ grafana.smtp.port }}'
GF_SMTP_USER: '{{ secrets.grafana.smtp.username }}'
GF_SMTP_PASSWORD: '{{ secrets.grafana.smtp.password }}'
GF_SMTP_FROM_NAME: '{{ grafana.smtp.sender.name }}'
GF_SMTP_FROM_ADDRESS: '{{ grafana.smtp.sender.address }}'
GF_SMTP_SKIP_VERIFY: 'false'
GF_SMTP_WELCOME_EMAIL_ON_SIGNUP: 'false'
GF_USERS_ALLOW_SIGN_UP: "false"
GF_USERS_ALLOW_ORG_CREATE: "false"
GF_SERVER_ENABLE_GZIP: "true"
GF_INSTALL_PLUGINS: "grafana-clock-panel,grafana-simple-json-
datasource,petrslavotinek-carpetplot-panel,savantly-heatmap-
panel,vonage-status-panel,neocat-cal-heatmap-panel,natel-discrete-
panel,flant-statusmap-panel,grafana-image-renderer"
log_driver: 'json-file'

55
log_options:
max-size: '200m'
max-file: '5'
volumes:
- grafana_data:/var/lib/grafana
networks:
- { 'name': 'monitoring_network' }
tags:
- setup
- name: Pause play until a URL is reachable from this host
uri:
url: "http://localhost:3000"
follow_redirects: none
method: GET
user: "admin"
password: "{{ secrets.grafana.admin.password }}"
force_basic_auth: yes
register: _result
until: _result.status == 200
retries: 12 # 1 minute
delay: 5 # Every 5 seconds
tags:
- setup
- name: "Create influxdb datasources for monitoring hosts"
grafana_datasource:
name: " {{ item.value.name }}"
grafana_url: "http://localhost:3030"
grafana_user: "admin"
grafana_password: "{{ secrets.grafana.admin.password }}"
org_id: "1"
ds_type: "influxdb"
ds_url: "{{ influx.url }}"
database: "{{ item.value.database }}"
user: '{{ secrets.influx.grafana_user.username }}'
password: '{{ secrets.influx.grafana_user.password }}'
time_interval: ">10s"
loop: '{{ lookup("dict", influx.databases) }}'
loop_control:
label: "{{ item.key }}"
tags:
- setup
- config
- name: "Get notifications channels"
uri:
url: "http://localhost:3030/api/alert-notifications"
user: "admin"
password: "{{ secrets.grafana.admin.password }}"
force_basic_auth: true
method: GET
register: grafana_notification_channels
tags:
- setup
- config
- set_fact:
grafana_notification_channels_ids: "{{
grafana_notification_channels.json | map(attribute='uid') | list }}"
tags:
- setup
- config

56
- name: "Setup notification channels"
uri:
url: "http://localhost:3030/api/alert-notifications{{
(item.value.uid in grafana_notification_channels_ids) |
ternary('/uid/' + item.value.uid, '') }}"
user: "admin"
password: "{{ secrets.grafana.admin.password }}"
force_basic_auth: true
method: "{{ (item.value.uid in grafana_notification_channels_ids)
| ternary('PUT', 'POST') }}"
body_format: json
body: "{{ item.value | to_json }}"
loop: '{{ lookup("dict", grafana.notification.channels |
combine(secrets.grafana.notification.channels, recursive=True)) }}'
tags:
- setup
- config
- name: "Get the hosts from influx monitoring db"
influxdb_query:
hostname: "{{ influx.host }}"
port: "{{ influx.port }}"
login_username: '{{ secrets.influx.grafana_user.username }}'
login_password: '{{ secrets.influx.grafana_user.password }}'
database_name: "{{ influx.databases.monitoring.database }}"
query: 'SHOW TAG VALUES FROM system WITH KEY=host'
register: grafana_influx_monitoring_hosts
tags:
- setup
- config
- dashboards
- name: "Get the hosts from dev2 influx db"
influxdb_query:
hostname: "{{ influx.host }}"
port: "{{ influx.port }}"
login_username: '{{ secrets.influx.grafana_user.username }}'
login_password: '{{ secrets.influx.grafana_user.password }}'
database_name: "{{ influx.databases.staging.database }}"
query: 'SHOW TAG VALUES FROM system WITH KEY=host'
register: grafana_influx_staging_hosts
tags:
- setup
- config
- dashboards
- name: "Get the hosts from prod influx db"
influxdb_query:
hostname: "{{ influx.host }}"
port: "{{ influx.port }}"
login_username: '{{ secrets.influx.grafana_user.username }}'
login_password: '{{ secrets.influx.grafana_user.password }}'
database_name: "{{ influx.databases.prod.database }}"
query: 'SHOW TAG VALUES FROM system WITH KEY=host'
register: grafana_influx_prod_hosts
tags:
- setup
- config
- dashboards
- name: "Setup dashboards"
uri:

57
url: "http://localhost:3030/api/dashboards/db"
user: "admin"
password: "{{ secrets.grafana.admin.password }}"
force_basic_auth: true
method: POST
body_format: json
body: '{
"dashboard": {{ lookup("template", item.template) }},
"folderId": 0,
"overwrite": true
}'
loop: '{{ dashboards.grafana }}'
tags:
- setup
- config
- dashboards
4.5 Initial setup of Telegraf
Since Telegraf will be used for collection a d reporting metrics, so it was set up to
listen all the hosts that were kept in ansible/inventory/prod file under target_servers
group and use Influx DB as an output. With this way ssh connectivity must be
established with the name@<target_host> for Telegraf services to function.
Docker networks settings were also implemented where image of telegraf: 1.14.3-
alpine was used. More information of these docker image versions for telegraf can
be found from (https://hub.docker.com/_/telegraf ). Also starting docker service
contains settings were added.
telegraf_docker_image: 'telegraf:1.14.3-alpine'
telegraf_influx_db:
url: ''
name: ''
username: ''
password: ''
Ansible script used for configurations:
ansible-playbook -i ansible/inventory/prod \
--vault-id=fp-prod@<path_to_local_vault_file> \
--extra-vars=@ansible/config/prod.yml \
--extra-vars=@ansible/secrets/prod.yml \
--tags=setup \
ansible/setup-telegraf.yml

58
Configurations for continuous deployment of Telegraf services were also
implemented, these were to make sure the services are going to be up.
- name: "Reload telegraf service"
command: "docker exec telegraf pkill -1 telegraf"
listen:
- reload_telegraf
tags:
- config
More detailed information about the Telegraf tasks settings can be found in
Appendix 1 as well as Telegraf template settings can be found on Appendix 2, this
data is very detailed and very long. Please refer to Git for further details
(https://github.com/influxdata/telegraf )
4.6 Configuring dashboards on Grafana
Depends on the needs, there are several ways to define the dashboards on Grafana
and this is a topic which should be planned well before hand. For this project it was
decided to have two types of dashboard
1. Detailed dashboard – This needs to be s separate dashboard for each host which contains all the monitored metrics related to this hosts. Whenever there is a new server it should be added for in the detailed dashboard. Figure 26 shows the detailed dashboard type from one of the servers.

59
Figure 26. Detailed host dashboard
2. An overview dashboard – This is type of dashboard contains metrics from all monitored servers. This is where you can see an overall health of all servers added to the services as seen from Figure 27. For overview dashboard it must be set up every time whenever new server is added.
Figure 27. An overview dashboard type.
Below scripts was used for defining these dashboards.
ansible-playbook -i ansible/inventory/monitoring \
--vault-id=fp-monitoring@<path_to_local_vault_file> \
--extra-vars=@ansible/config/monitoring.yml \
--extra-vars=@ansible/secrets/monitoring.yml \
--tags=dashboards \
ansible/setup-grafana.yml

60
Figure 28 shows the settings for detailed dashboard.
Figure 28. Settings for detailed dashboard.
4.7 Settings for alerting rules
As alerting needs explained in in Chapter 3.1, the settings were defined based on the
alerting channels which were Microsoft Teams and Outlook.
Refer to the below scripts to observer what has been implemented on the alerting
rules set up and from which dashboards with the threshold of 50% and 80%
resources usage.
grafana:
domain: 'monitoring.yourdomain.com'
path: 'grafana'
smtp:
host: 'in-v3.mymail.com'
port: 562

61
sender:
name: 'Grafana Monitoring'
address: '[email protected]'
notification:
channels:
email_channel:
name: email-channel
type: email
uid: notifier1
orgId: 1
isDefault: false
sendReminder: true
frequency: 2h
disablResolveMessage: false
settings:
singleEmail: false
addresses:
'[email protected];[email protected]'
teams_channel:
name: teams-channel
type: teams
uid: notifier2
orgId: 1
isDefault: false
sendReminder: true
frequency: 2h
disablResolveMessage: false
# url is kept in secrets
dashboards:
grafana:
- template: 'detailed-dashboard.json.j2'
uid: '000000651'
name: "Detailed staging dashboard"
datasource: '{{ influx.databases.staging.name }}'
- template: 'detailed-dashboard.json.j2'
uid: '000000652'
name: "Detailed monitoring dashboard"
datasource: '{{ influx.databases.monitoring.name }}'
- template: 'detailed-dashboard.json.j2'
uid: '000000653'
name: "Detailed production dashboard"
datasource: '{{ influx.databases.prod.name }}'
- template: 'alert-dashboard.json.j2'
uid: '000000654'
name: "Overview production dashboard"
datasource: '{{ influx.databases.prod.name }}'
hosts: '{{ grafana_influx_prod_hosts.query_results |
map(attribute="value") | list }}'
extra_mountpoints:
mongo_1:
- /mongo-data
alerts:
cpu:
threshold: 50
notifiers:
- uid: '{{
grafana.notification.channels.email_channel.uid }}'
- uid: '{{
grafana.notification.channels.teams_channel.uid }}'
memory:
threshold: 80

62
notifiers:
- uid: '{{
grafana.notification.channels.email_channel.uid }}'
- uid: '{{
grafana.notification.channels.teams_channel.uid }}'
disk:
threshold: 80
notifiers:
- uid: '{{
grafana.notification.channels.email_channel.uid }}'
- uid: '{{
grafana.notification.channels.teams_channel.uid }}'
- template: 'alert-dashboard.json.j2'
uid: '000000655'
name: "Overview monitoring dashboard"
datasource: '{{ influx.databases.monitoring.name }}'
hosts: '{{ grafana_influx_monitoring_hosts.query_results |
map(attribute="value") | list }}'
extra_mountpoints:
influx_1:
- /var/fp
alerts:
cpu:
threshold: 50
notifiers:
- uid: '{{
grafana.notification.channels.email_channel.uid }}'
- uid: '{{
grafana.notification.channels.teams_channel.uid }}'
memory:
threshold: 80
notifiers:
- uid: '{{
grafana.notification.channels.email_channel.uid }}'
- uid: '{{
grafana.notification.channels.teams_channel.uid }}'
disk:
threshold: 80
notifiers:
- uid: '{{
grafana.notification.channels.email_channel.uid }}'
- uid: '{{
grafana.notification.channels.teams_channel.uid }}'
influx:
host: '10.4.76.54
port: 8086
url: 'http://10.4.45.44:9904
databases:
monitoring:
name: 'influxdb-fp-monitoring'
database: 'fp_monitoring_db'
prod:
name: 'influxdb-fp-prod'
database: 'fp_prod_db'
staging:
name: 'influxdb-fp-staging'
database: 'fp_staging_db'

63
5 Testing phase (QA)
5.1 Quality Assurance
Quality assurance refers to the systematic process of testing services or product
meets certain requirements (Tiempo Development 2019), meaning that QA has to
make sure the organization deliver the best product or services as possible. Upon
completion of the project, for this completion phase it was completed on
development stage the team compose internal testing cases (this is organization’s
level). This is the environment for implementing or conducting the first stage of QA,
which was done in few steps.
Initial requirements and needs were clearly reviewed, they were aligned together
with the metrics components of the tool, meaning there were comparisons of the
project requirements together with Grafana. Grafana installed on development
environment was presented to the team, all monitored hosts/servers were examined
and evaluated based on the metrics produced by the tool, meaning that it was
discussed if all servers and its elements are monitored and tracked well and in case
of issues can the system send out alert notifications. The team went through each
server’s monitoring needs and what is produced by Grafana, several tests were
conducted to ensure that the tool work as expected. Several notifications were sent
out from Grafana to confirm that this system is stable and the ability to send out
notifications is also stable.
The tool was tested on the UI, this was selecting different dashboards and
previewing many data metrics, changes were made on the dashboards and observe
how they reflect on the UI.
Other test conducted were from an internal testing case which was compose upon
installing the tool, unfortunately this is a matter of internal communications and it is
also confidential so it will not be covered on this report however any one can create
their own testing cases based on their needs.
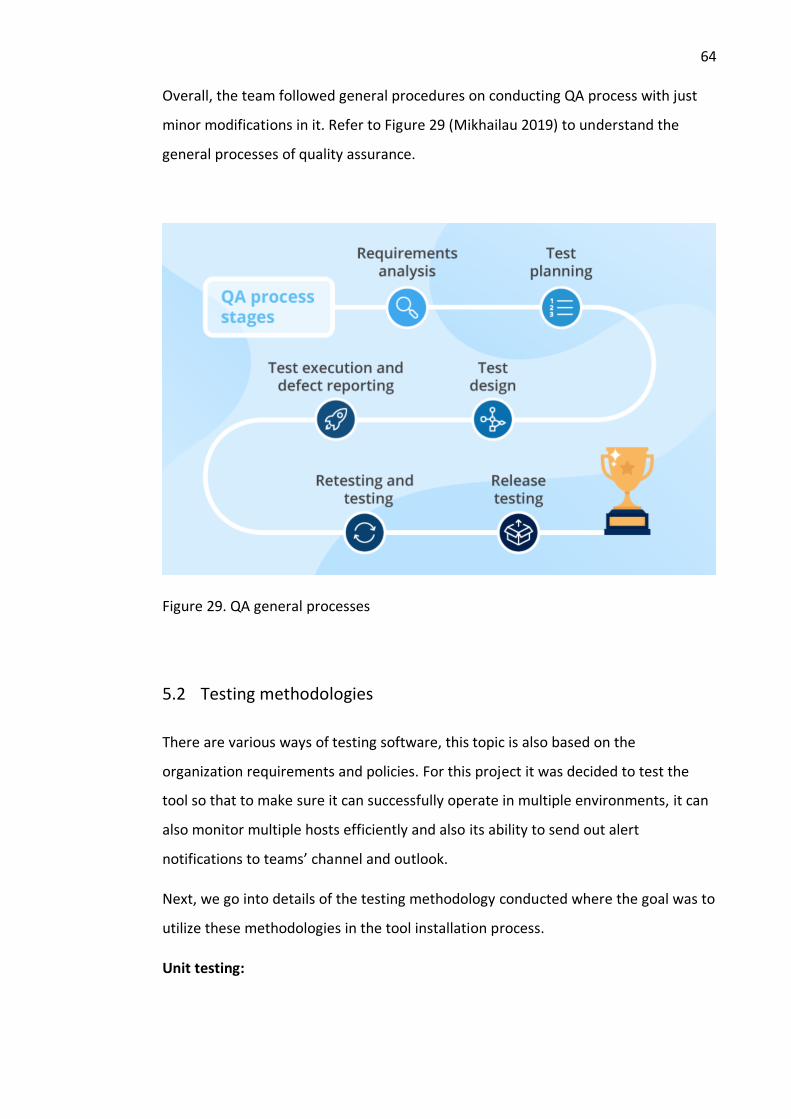
64
Overall, the team followed general procedures on conducting QA process with just
minor modifications in it. Refer to Figure 29 (Mikhailau 2019) to understand the
general processes of quality assurance.
Figure 29. QA general processes
5.2 Testing methodologies
There are various ways of testing software, this topic is also based on the
organization requirements and policies. For this project it was decided to test the
tool so that to make sure it can successfully operate in multiple environments, it can
also monitor multiple hosts efficiently and also its ability to send out alert
notifications to teams’ channel and outlook.
Next, we go into details of the testing methodology conducted where the goal was to
utilize these methodologies in the tool installation process.
Unit testing:

65
This is one of the first level of testing, it was simply the process of making sure that
these individual components (Telegraf, Influx DB and Grafana) that makes the whole
automated monitoring system works as they should. Documented testing cases were
conducted on the development environment, this process was automated to expand
the testing coverage. Issues identified were fixed and unit test was conducted again
to verify that it has passed.
Integration testing:
On this section it was tested to make sure the integration of the above components
is working fine, meaning that databases are connect and the metrics are sent over to
Influx DB to be visualized in Grafana. In this methodology all the components were
tested as group to see the integration behaviour and ensuring the whole segment of
the tool is working as expected. This type of test involved selecting different
databases and observe the metrics to see if they match source DB and if they are
correct ones.
Performance testing:
This is basically non-functionally type of testing which involves testing the tool’s
behaviour under different situations. The main goal if this testing method was to
examine how Grafana is stable in terms of loading it with large amounts to data from
different time frames. Testing data was loaded data on the tool to find out if the
system will still able to accept it and also visualize them correct in time series. Upon
this test it was agreed that the tool was stable.
Compatibility testing:
This simple testing method was done to understand if the tool is compatible with
different data sources and environments. This was mainly an internal knowledge
since there are several sources of data to be monitored and visualize. It was also
needed to understand how this tool is compatible with different operating systems
which hosts the data sources.
System testing:

66
In this testing methodology, the whole components of the tool were tested as one
package. Meaning that the functionality of the tool needed to be tested against the
specific requirements of the project.
Usability testing:
Usability testing involved measuring how the tool is easy to user, this is to verify that
end-user perspective of utilizing the tool. The main goal is to determine if a person
with less technical background can login to Grafana and easily select what dashboard
type to observe the metrics. Also, if the metrics can let this individual know about the
stability of the hosts.
5.3 QA Results
The results of QA process were clearly identified, this was based on the needs of the
tool and also testing phase of the tools. Based on the needs it was confirmed that
this tool meets organizations monitoring needs and it will be valuable in terms of
future perspective.
For the short descriptions of the testing results refer to Table 2.
Table 4. Testing results

67
Testing method Comments
Unit testing It has passed unit testing
Integration testing It has passed integration testing; data was sent across the tool for monitoring.
Performance testing It has passed performance testing
Compatibility testing It has passed compatibility testing
System testing It has passed system testing, but a person needs to be careful not to save dashboard on the UI. Saving them will affect the default dashboards created previously
Usability It needs to be used with someone with good technical understand IT. It will be difficult for nontechnical person to have broader understand of the metrics and even using the tool.
6 Evaluation of the project
6.1 Evaluation at Futures Platform
Evaluation is described as a process of genuinely analysing a program (e.g. project,
research, or publication) by Thomson & Hoffman (2003). The process involves several
phases and steps in order to collect and examine the data about program’s actions,
aspects and the outcome of it. Figure 30 (Castle 2018) describes the process.

68
Figure 30. Evaluation process.
Project evaluation is defined as process evaluation; however, it mainly involves the
assessment of an ongoing, as well as a completed project or research in an
organization. The main focus on this is to determine the level of achievement, impact
(can be profitability) and perhaps sustainability of the project in a company.
In many organizations this process has been adapted for several reasons. One main
purpose from the organization’s point of view is to determine how successful a
certain program is; areas of improvement reshape the goals. Also, when evaluation
results are shared among the organization, it helps the company to advance several
processes based on what was done effectively and what was not.
At Futures Platform, we use project evaluation for several purposes, which are
mainly focused not only on business benefits but also on employees’ wellbeing and
their personal development plans. The following items lists ADD

69
1. We use project evaluation in order for the company to learn and better use
what has been successful during the project. The lesson to be learned is
based on what went wrong or what did not fit in the project. This aspect
could answer questions like what happened and why we were successful and
what is to do next.
2. Another point why we value project evaluation is that everyone involved will
have a say in the project; this could be colleagues from marketing teams
which we work very closely with or the UX team. This way we get each
person’s perspective/feedback, which leads to improvements of the project
and communication.
3. Project evaluation keeps management up to date, which is kind of project
status. This is essential if we are looking for resources or just better utilizing
of the current resources.
4. We also conduct project evaluation to acquire some kind of validity and
realism of the project, things like are we going to the right way and so on,
which also provides a guide for the future plans
5. Also, one of the reasons is to identify which project member needs guidance
or training to deepen their skills and better performances.
Depending on the organization’s needs, size, and best practices, project evaluation
can vary from one company to another; nevertheless, the principle might remain the
same.
6.2 Need for evaluation from different parties
The project had to be evaluated in order to obtain detailed information of it, the
information needed was not only technical (this was mainly for development people)
but also how did the project went, was it successful and how it can benefit the
company.

70
From the company’s point of view, they wanted to understand how this tool can
benefits our development process, what can we get out of it and for long terms
future plans how it can solve service disruptions.
Overall, the project evaluations were needed so as to understand the outcome
presented and also to align the needs of technology with the project results. These
were mainly reflecting how services architectural problems can be avoided and
solved by using effective monitoring.
This evaluation method was conducted in two phases, the first one was to access the
needs of the departments (Technical department), which were clearly presented.
The second one was to oversee, or we can also call it process evaluation by
examining how the project would actually solve issues identified. The second process
also measured how the individuals in teams were satisfied with the results, and how
they reflect on the solutions with the issues existed.
6.3 What was evaluated
Overall performances of the tool had to be analysed and evaluated, and these points
as explained in this report were based on the needs. Evaluation focused more on the
Grafana operational level to determine for example if Grafana is doing the tasks was
it designed to, is it reliable and working with minimum errors and also usability of the
tool. Basically, Grafana was compared against the initial monitoring needs and
requirements presented at the initial stage of the project (we can call this
requirements specifications).
User experiences was also evaluated in terms of how easy to read and understand
the metrics, navigations within the Grafana looking for metrics and also if there are
any issues experienced on user level. These were also key to understand since at the
project needs it was required that monitoring system should be able to give insights
or being utilised by nontechnical persons.
Important part of the evaluation was how Grafana sends the alerting notification if
there are faults identified, and these alerting frequencies reliable or not.

71
In conclusions it was found out that the tool meet almost all of the needs and it
meets the services requirements plus no costs involved.
6.4 Evaluation method
The evaluation method used was formative, formative evaluation method is mainly
used to evaluate a project or research from different project phases (early stage,
while it is still ongoing and even upon project completion) i.e., feedback is provided
from both parties, improvements are suggested, and lessons are noted. This method
fitted the company since we wanted everyone involved to have a chance to give
feedback or express their voice while the project is going on. Their suggestions were
very useful during and after the project was conducted.
There are several benefits of using formative evaluation method, those include
below ones.
• This method allowed us to clarify the need of the project and align them with some technological expectations.
• It allowed us to have better understanding of the project’s process change, meaning that what works what, what don’t and why.
• There was always a change to improve any service components along the way.
• We are able to acquire successful feedback from project parties.
• Ability to have clear future goals.
The evaluation took place in three phases; this is because of the nature of the topic
and these phases below have fitted our evaluation needs.
• Planning the evaluation process, this was the initial phase where it was planned how the evaluation should occur: what tools were going to be used, prioritizations, and informing the audiences about the schedule.
• The second phases were actual evaluation implementations, which means the audience were concentrated on evaluating and aligning their needs to the research results.
• The last phase was conclusion, meaning that it was decided on what the long-term impacts of the company’s operations were based on.

72
6.5 Evaluation results
Results from the evaluation phase of the project, it was decided by team members
that Grafana is the tool needed to address the ongoing problems and needs.
Decisions of the evaluation were based on the personnel involved in the evaluation
process, each gave an opinion about Grafana and how this tool will improve the
services.
7 Production deployment
7.1 Deployment process
After everything was confirmed to be working as expected, it was planned to deploy
the changes to production so that production environment will be monitored. Since
all production hosts were already listed somewhere together with their credentials it
was a matter of adding these hosts and point Grafana to monitor production
environment instead of developments one.
As seen from Figure 31, there was a list of these host, so by adding production
inventory file and add proper access rights and definitions Grafana was able to access
production database and start to collect data.

73
Figure 31. Production environment hosts
7.2 Project timeframe
This project had a timeline, this was an essential part of the project to ensure that it
has transparency, well planned and also several team members involved will be
constantly aligned and informed about the project. This project consisted of several
tasks with each of them had its own due date, this assisted in the productivity for the
project and engagement.
Each step was broken down into smaller pieces those includes researching of the
tool, benchmarking, installation process details gathering, implementation of the
project in the test environments, evaluations from team members and production
deployment. Since the project tasks were completely new there were many learning
curves on the way, what worked and what didn’t along the process. The project
technical implementation took a month and half to complete, this means that few
hours a day were invested to the project technical implementation. Some delays
were caused on finding solutions for elements or processes that didn’t work or had
difficulties in their implementation.

74
Figure 32 shows the project completion on Git.
Figure 32. Project end results on Git
8 Discussion
8.1 Project conclusion.
The project came to a successful result, automated system monitoring tools was
established, and DevOps team started to collect useful data and visualize it. Having
monitoring tool in place ensured that at any time no faults and errors would go
unnoticed by end users.
The tool sends instant alert notifications to Microsoft teams and Outlook, which
notifies the team for first respond to the process of fixing the faults. This has reduced
the time invested in the investigations of the faults where the tool inform exactly
which host is problematic and what is the problem. And also, the team is instantly
notified of the problem rather than waiting for someone to report it.. Overall alerting

75
part of the implementation has been successful, and the DevOps teams was satisfied
of the alerting results.
The project scope was to monitor complex system architecture and that was
achieved. Discussing about the Ansible, it is a very well-maintained tool with very
good documentations and step by step instructions on how to work with the
playbook. This means that Ansible can still be viable tool for several automation
needs in the present and near future.
8.2 Fitted our needs
Upon concluding the project and discussions we had together with colleagues it was
concluded that the tool Grafana has fitted our needs or even most of the needs. This
tool was able to meet our system observability needs and also improving system
performances.
The tool was able to visualize all the details related to data monitoring gathered from
different data sources and also real-time tracking with alerting. Since the tool is an
open-source platform, it does not cost anything but still it gave a lot of features,
excellent documentation and most importantly it was easy to read visual
representations of the most important data. With this tool, it means that it was able
to minimize even cut some of the internal costs related to system performances
monitoring.
8.3 Maintenance
As part of development life cycle, Grafana and its components should be maintained.
This means that maintaining monitoring process should be an endless process, new
hosts should be added to the configurations so that they can be monitored. Old and
unused ones should be removed from the configurations, so that the code remains
clean and updated with the changes. Depending on the organizations and their
practices but for this project the whole process was clearly documented so that any

76
professional will understand where to start whenever they need to work with the
Ansible playbook. Maintenance plan should be defined among the DevOps
professionals on how they will maintain the tool and the services.
The maintenance fundamentals are same as the general system development
lifecycle. All the steps and methods will not be covered in this report if a reader is
interested to find out more there are sources explaining in detail how to achieve this
e.g. from (https://www.smartsheet.com/system-development-life-cycle-guide ).
Figure 33 (smartsheet 2020) illustrates briefly on system development life cycle
where the maintenance of this will follow same methods with slight modifications
based on Organizational needs.
Figure 33. System development lifecycle

77
References
Berman, D. 2019. Metricsbeat vs Telegraf: Side-by-Side Comparison. Access on 3
November 2020. Retrieved from
https://logz.io/blog/metricbeat-vs-telegraf/
Bertram, A. 2020. How to use Ansible Vault to Store Secret Keys. Accessed on 5
October 2020. Data retrieved from
https://www.cloudsavvyit.com/3902/how-to-use-ansible-vault-to-store-secret-keys/
Baghel, A. 2020. Article: Spark Application Performance Monitoring using Uber JVM
Profiler, Influx DB and Grafana. Accessed on 3 November 2020. Retrieved from
https://mobilemonitoringsolutions.com/article-spark-application-performance-
monitoring-using-uber-jvm-profiler-influxdb-and-grafana/
Castle, S. 2018. Evaluating Service Delivery. Accessed on 10 March 2020. Data
retrieved from
https://www.sheffield.ac.uk/sss/ssid/service-quality/evaluation
Devconnected 2019. How to setup Telegraf Influx SB and Grafana on Linux. Accessed
on 15 October 2020. Data retrieved from
https://devconnected.com/how-to-setup-telegraf-influxdb-and-grafana-on-linux/
Dockerhub 2020. Supported tags and respective Dockerfile links. Accessed on 5
November 2020. Retrieved from
https://hub.docker.com/_/influxdb
Dockerhub 2020. Grafana docker image. Accessed on 5 November 2020. Retrieved
from
https://hub.docker.com/r/grafana/grafana/
EAUC University of Gloucestershire 2018. Project Monitoring Training: Capturing
Evidence of Progress (Monitoring & Evaluation Series). Accessed on 15 February
2020. Data retrieved from
https://www.eauc.org.uk/shop/mms_single_event.php?event_id=5957

78
Ellingwood, J. 2017. An Introduction to Metrics, Monitoring and Alerting. Access on
29 May 2020. Data retrieved from
https://www.digitalocean.com/community/tutorials/an-introduction-to-metrics-
monitoring-and-alerting
Grafana Labs 2020. Grafana. Accessed on 20 October 2020. Data retrieved from
https://grafana.com/docs/grafana/latest/getting-started/what-is-grafana/
Hoffman, J. 2020. Grafana vs. Prometheus: What’s the Difference? Accessed on 1
November 2020. Retrieved from
https://wisdomplexus.com/blogs/grafana-vs-prometheus/
Indeed 2020. How to succeed in unstructured interview. Accessed on 4 November
2020. Retrieved from
https://www.indeed.com/career-advice/interviewing/unstructured-interviews
Influx Data 2020. Influx DB 1.x. Accessed on 27 June 2020. Data retrieved from
https://www.influxdata.com/time-series-platform/
Influx Data 2020. Telegraf 1.14 documentation. Accessed on 27 June 2020. Data
retrieved from
https://docs.influxdata.com/telegraf/v1.14/
InspireOne 2016. What is Benchmarking & Why it is important? Accessed on 5
September 2020. Data retrieved from
https://inspireone.in/blog/what-is-benchmarking-why-is-it-important/
M & E Studies. What is monitoring. Accessed on 14 June 2020. Retrieved from
http://www.mnestudies.com/monitoring/what-monitoring
Mikhailau, A. 2019. A practical Guide to the Software QA Process. Accessed on 3
November 2020. Retrieved from
https://www.scnsoft.com/blog/qa-process
Nigam, V. 2018. Processing Time Series Data in Real-Time with IngluxDB Structured
Streaming. Accessed on 12 April 2020. Data retrieved from

79
https://medium.com/analytics-vidhya/processing-time-series-data-in-real-time-with-
influxdb-and-structured-streaming-d1864154cf8b
Onsolve 2020. What is an IT Alerting System? Accessed on 2 November 2020.
Retrieved from
https://www.onsolve.com/blog/what-is-an-it-alerting-system/
Pearlman, S. 2017. What is API-led Connectivity? Accessed on 3 November 2020.
Retrieved from
https://blogs.mulesoft.com/dev/api-dev/what-is-api-led-connectivity/
Project Manager 2020. How to Improve Your Project Evaluation Process. Accessed on
5 March 2020. Data retrieved from
https://www.projectmanager.com/blog/improving-project-evaluation-process
Red Hat 2019. Ansible documentation. Accessed on 24 June 2020. Data retrieved
from
https://docs.ansible.com/ansible/latest/index.html
Smartbear 2020. What is API Monitoring? Accessed on 3 November 2020. Retrieved
from
https://smartbear.com/solutions/api-monitoring/
Suresh, A. 2020. What is Application Performance monitoring? Accessed on 10
September 2020. Data retrieved from
https://www.eginnovations.com/blog/what-is-application-performance-monitoring/
Tiempo Development 2019. What is QA in Software Testing. Accessed on 15
September 2020. Data retrieved from
https://www.tiempodev.com/blog/what-is-qa-in-software-testing/

80
Appendices
Appendix 1. Telegraf services settings on the tasks folder
Here are the settings for Telegraf services.
- name: "Make sure that directories exist"
file:
path: "{{ item }}"
state: directory
recurse: yes
with_items:
- '/etc/fp/telegraf'
tags:
- setup
- name: "Template tefegraf configuration file"
template:
src: "telegraf.conf.j2"
dest: "/etc/fp/telegraf/telegraf.conf"
backup: yes
mode: 0644
notify: reload_telegraf
tags:
- setup
- config
- name: "Start Telegraf service container"
docker_container:
state: started
restart_policy: unless-stopped
name: telegraf
image: "{{ telegraf_docker_image }}"
pull: no
recreate: no
env:
HOST_ETC: '/hostfs/etc'
HOST_PROC: '/hostfs/proc'
HOST_SYS: '/hostfs/sys'
HOST_VAR: '/hostfs/var'
HOST_RUN: '/hostfs/run'
HOST_MOUNT_PREFIX: '/hostfs'
log_driver: 'json-file'
log_options:
max-size: '200m'
max-file: '5'
network_mode: host
volumes:
- /:/hostfs:ro
- /etc:/hostfs/etc:ro
- /proc:/hostfs/proc:ro
- /sys:/hostfs/sys:ro
- /var:/hostfs/var:ro
- /run:/hostfs/run:ro
- /etc/fp/telegraf/telegraf.conf:/etc/telegraf/telegraf.conf:ro
tags:
- setup