automated dissolved gas analysis report generator for
TRANSCRIPT

2415Sensors and Materials, Vol. 33, No. 7 (2021) 2415–2426MYU Tokyo
S & M 2627
*Corresponding author: e-mail: [email protected]://doi.org/10.18494/SAM.2021.3313
ISSN 0914-4935 © MYU K.K.https://myukk.org/
Automated Dissolved Gas Analysis Report Generator for Monitoring Condition of High-voltage Transformers
Passara Chanchotisatien1* and Suwilai Phumpho2
1School of Information, Computer and Communication Technology, Sirindhorn International Institute of Technology, Thammasat University,
Phahonyothin Rd., Khlong Nueng, Khlong Luang District, Pathum Thani 12120, Thailand2Ekarat Engineering Public Limited, 28th floor, UM Tower,
291 Ramkhamhaeng Rd, Suan Luang, Bangkok 10250, Thailand
(Received January 31, 2021; accepted June 16, 2021)
Keywords: dissolved gas analysis, Power Automate, web application, DGA, report generator, SharePoint
Dissolved gas analysis (DGA) is a commonly used method that allows pending or occurring faults within transformers to be determined. DGA has been widely used for many years. There are various DGA techniques, including the evaluation of individual and total dissolved combustible gas (TDCG) concentrations, the Doernenburg method, the Rogers method, and Duval’s triangle. To facilitate the process of monitoring the condition of transformers and reduce potential human error, we discuss how to create a user-friendly system to monitor and evaluate the condition of high-voltage transformers. The system receives key gas values, which are extracted from oil samples inside transformers obtained by gas chromatography (GC), and is capable of automatically generating downloadable reports of specified transformers and gives insight on any faults found. It also visualizes the changes in extracted key gas values of transformers over time. To develop this system, the front end of the application was made with HTML and CSS, and the back end was made with JavaScript with MySQL as a database combined with Microsoft SharePoint. The automatic downloadable report generator was made with Power Automate. This system assists the monitoring of transformer conditions.
1. Introduction
Transformers are used in a wide range of applications and can help improve the safety and efficiency of power systems by raising and lowering voltages where necessary. Transformers are mainly responsible for the distribution and regulation of power across long distances. The primary goal of any power system is to provide high-quality electric power reliably and efficiently. Consequently, power transformers must be regularly checked for pending or occurring faults as the impact of a faulty transformer can be very costly.(1–3) Therefore, it is important to identify and prevent these faults in their earliest stages. Various gases are generated within a transformer from the breakdown of electrical insulating materials and associated elements inside the transformer. These gases are considered to provide useful information for the maintenance of the transformer.(4) Gases in the transformer are

2416 Sensors and Materials, Vol. 33, No. 7 (2021)
quantified via the gas chromatography (GC), which analyzes the chemical components of a sample mixture to determine how much of each component is present. Dissolved gas analysis (DGA) is the study of key dissolved gases in transformer oil and is helpful for determining the condition and identifying underlying faults in power transformers.(5–7) DGA techniques can be used to help monitor the condition of the transformer and give possible explanations for faults and precautions to take upon discovering a fault. Faults in transformers are classified into four main types: a thermal fault of the oil, a thermal fault of the cellulose, a partial discharge, and arcing.(8,9) A thermal fault of the oil can be identified when the decomposition products include ethylene and methane with smaller amounts of hydrogen and ethane. When the fault is severe or involves electrical contacts, traces of acetylene can also be found.(10,11) A thermal fault of the cellulose is caused when the cellulose in the transformer is overheated, which produces significant amounts of carbon monoxide and carbon dioxide. A partial discharge is identified when hydrogen, methane, and small quantities of ethane and ethylene are detected as they are produced by low-energy electrical discharges.(12) Arcing is accompanied by the generation of large quantities of hydrogen and acetylene with small amounts of methane and ethylene.(13) In cases where the fault involves cellulose, carbon dioxide and carbon monoxide may also be found. Even though DGA is commonly used in many companies and has been used for many years, it can still be inaccurate and erroneous due to various human errors that occur during the monitoring and evaluation of transformers. Carrying out the DGA process manually can be time-consuming, inefficient, and inconvenient. Additionally, it can be difficult to visualize changes in gas concentrations of a transformer over a longer time span such as over many years. Furthermore, when performing DGA analysis manually, it can be difficult to see how the diagnosis result was calculated and to make a comparison between different methods. To tackle these problems, a user-friendly system was created to help its users analyze, identify, and monitor the condition of high-voltage transformers. This was achieved by implementing various DGA techniques, including the evaluation of individual and total dissolved combustible gas (TDCG) concentrations, the Doernenburg method, the Rogers method, and Duval’s triangle into a web application using HTML and CSS to create the user interface, JavaScript for the back end, MySQL as the database, and SharePoint and Microsoft Power Automate to automatically generate a customized report of the evaluation of the transformer condition. Users can compare results between various methods side-by-side to obtain a more accurate and suitable diagnosis and solution. The proposed system is an end-to-end system, which is fully automated from obtaining gas values by GC to analyzing, visualizing, and interpreting the gas values on an accessible web application. This paper is organized as follows. Section 2 explains the different methods, tools, and technologies used to create the system. Section 3 shows the results and discusses how the system improves the traditional DGA process. Finally, Sect. 4 presents our conclusions.
2. Materials and Methods
This section outlines how gas samples are acquired from the extracted oil samples, the DGA techniques implemented in the software, and how the web application was implemented.

Sensors and Materials, Vol. 33, No. 7 (2021) 2417
2.1 Acquiring gas samples from GC
To perform DGA to determine whether a transformer is faulty, gas concentration values must first be extracted from oil samples obtained from the transformer. For this purpose, we used GC, which is a widely used technique in many industries. This technique utilizes a GC machine, which separates the chemical components of a sample to determine how much of each component is present.(14,15) The principle of GC is described as follows.(16–18) The oil solution extracted from the transformer is inserted into the GC machine. After that, the oil solution enters a gas stream, with helium or nitrogen usually being the carrier gas. The gas stream then carries the solution into a separation tube, also known as a column. The different components of the sample are then separated inside the column and a detector determines the amount of each component that leaves the column. The components leaving the column are then injected into the detector. The detector responds to the components by producing a signal, which is recorded by software installed in a computer. The software depicts a chromatogram showing the result of the separated components. The GC technique is illustrated in Fig. 1. Various sensors and detectors are used inside the GC machine, including general-purpose detectors and high-sensitivity detectors.(19,20) Some general-purpose detectors include a flame ionization detector to detect organic compounds, a thermal conductivity detector to detect all compounds other than the carrier gas, and a barrier discharge ionization detector to detect all compounds other than He and Ne. The high-sensitivity sensors include an electron capture detector to detect organic halogen compounds and organic metal compounds; a flame thermionic detector to detect organic nitrogen compounds and phosphorus compounds; a flame photometric detector to detect organic nitrogen compounds, inorganic and organic phosphorus compounds, and organic tin compounds; and a sulfur chemiluminescence detector to detect inorganic and organic sulfur compounds.
2.2 Algorithms used
Four different DGA techniques were implemented in the web application. The gases of interest when performing DGA are hydrogen (H2), methane (CH4), ethylene (C2H4), ethane
Fig. 1. (Color online) Schematic of GC technique.

2418 Sensors and Materials, Vol. 33, No. 7 (2021)
(C2H6), acetylene (C2H2), propene (C3H6), propane (C3H8), carbon monoxide (CO), carbon dioxide (CO2), oxygen (O2), and nitrogen (N2).(21) The four techniques were the evaluation of individual and TDCG gas concentrations, the Doernenburg method, the Rogers method, and Duval’s triangle. These techniques were implemented following the C57.104 IEEE Guide for the Interpretation of Gases Generated in Oil Immersed Transformers.(22) Each technique is described in the following sections.
2.2.1 Evaluation of transformer condition using individual and TDCG concentrations
This technique deploys a four-level criterion to classify existing faults in transformers based on the different gas concentrations. Table 1 shows each gas concentration and range of concentration values for each condition. Sudden increases in the concentration of dissolved gases can be caused by internal faults inside the transformer. Table 2 shows the operating procedures used for each condition according to the TDCG concentration.
Table 1 Four-level criterion based on dissolved key gases.
Status Dissolved key gas concentration limits (ppm2)H2 CH4 C2H2 C2H4 C2H6 CO CO2 TDCG
Condition 1 100 120 1 50 65 350 2500 720Condition 2 101–700 121–400 2–9 51–100 66–100 351–570 2500–4000 721–1920Condition 3 701–1800 401–1000 10–35 101–200 101–150 571–1400 4001–10000 1921–4630Condition 4 >1800 >1000 >35 >200 >150 >1400 >10000 >4630
Table 2 Operating procedures based on TDCG levels.
TCG level TCG rate (%/day)
Sampling interval and operating procedures for gas generation ratesSampling interval Operating procedures
Condition 4 ≥5
>0.03 Daily Consider removal from service.
0.01–0.03 DailyExercise extreme caution.Analyze for individual gases.Plan outage. Advise manufacturer.<0.01 Weekly
Condition 3 ≥2–<5
>0.03 Weekly Exercise extreme caution.Analyze for individual gases.Plan outage.Advise manufacturer.
0.01–0.03 Weekly
<0.01 Monthly
Condition 2 ≥0.5–< 2
>0.03 Monthly Exercise caution.Analyze for individual gases.Determine load dependence.Plan outage.Advise manufacturer.
0.01–0.03 Monthly
<0.01 Quarterly
Condition 1 <0.5
>0.03 Monthly Exercise caution.Analyze for individual gases.Determine load dependence.0.01–0.03 Quarterly
<0.01 Annual Continue normal operation.

Sensors and Materials, Vol. 33, No. 7 (2021) 2419
2.2.2 Evaluation of transformer condition by analysis of separate combustible gases
The following sections describe the Doernenburg method and Rogers method. These two methods use an array of ratios of specific key combustible gases to indicate whether there are any faults present in a transformer. The five ratios are calculated using Eqs. (1)–(5).
Ratio 1 (R1) = CH4 / H2 (1)
Ratio 2 (R2) = C2H2 / C2H4 (2)
Ratio 3 (R3) = C2H2 / CH4 (3)
Ratio 4 (R4) = C2H6 / C2H2 (4)
Ratio 5 (R5) = C2H4 / C2H6 (5)
2.2.2.1 Doernenburg method
The Doernenburg method utilizes ratios R1, R2, R3, and R4. Figure 2 depicts a flow chart illustrating the steps used to determine the fault type of the transformer.(23) First, concentrations
Fig. 2. Flow chart of Doernenburg method.

2420 Sensors and Materials, Vol. 33, No. 7 (2021)
of key gases are obtained by extracting the gases and separating them via the GC machine. After that, it is checked whether one of the gas concentrations of H2, CH4, C2H2, and C2H4 exceeds the limit L1 values shown in Table 3. If one of the gas concentrations mentioned exceeds its L1 value, it means that the ratio procedure is invalid, meaning the oil should be resampled. If the sample passes the ratio validity check, ratios R1, R2, R3, and R4 are compared with the different values shown in Fig. 2 to diagnose the condition of the transformer.
2.2.2.2 Rogers method
Similar to the Doernenburg method, the Rogers method also utilizes ratios. However, for the Rogers method, only R1, R2, and R5 are used. The calculation in the Rogers method is illustrated in the flow chart in Fig. 3.(24)
Table 3Maximum allowable L1 values.Key gas Concentration L1 (ppm2)Hydrogen 100Methane 120Carbon monoxide 350Acetylene 1Ethylene 50Ethane 65
Fig. 3. Flow chart of Rogers method.

Sensors and Materials, Vol. 33, No. 7 (2021) 2421
2.2.3 Duval’s triangle
Duval’s triangle employs a triangular plot to evaluate the gases as shown in Fig. 4.(25) The gases used in this method are CH4, C2H4, and C2H2. Before using Duval’s triangle, it is important to determine whether it can be used. This is done by comparing the concentration of each used gas with the maximum allowable L1 value in Table 3. Assuming that the gas concentrations are valid, we then calculate the percentages of CH4, C2H4, and C2H2 using Eqs. (6)–(8), from which we are able to determine the fault type. Fault symbols and their meanings are shown in Table 4.
% CH4 = (CH4 / (CH4 + C2H4 + C2H2)) × 100 (6)
% C2H4 = (CH4 / (CH4 + C2H4 + C2H2)) × 100 (7)
% C2H2 = (CH4 / (CH4 + C2H4 + C2H2)) × 100 (8)
2.3 Software implementation
This system includes an authentication system that allows users to register and sign into the web application. After logging in, the user is capable of viewing their dashboard, which visualizes changes in the concentrations of gases in the selected transformer over time. This information is shown in the form of line graphs and bar graphs. The user can generate a new DGA report. They will be asked whether they want to create a report for a specific transformer or a stand-alone report. After that, the user has the option to either upload an Excel file that is produced from the GC or fill in the values themselves. After submitting the gas concentration values, they receive a DGA report along with a customized downloadable Word file of the report. Other features include the ability to add a new transformer to the system, view transformer details, and view reports.
Fig. 4. Duval’s triangle.
Table 4Fault symbols and meanings for Duval’s triangle.Symbol FaultPD Partial dischargeD1 Discharge of low energyD2 Discharge of high energyT1 Thermal Fault T < 300 °CT2 Thermal Fault 300 < T < 700 °CT3 Thermal Fault T > 700 °C
2422 Sensors and Materials, Vol. 33, No. 7 (2021)
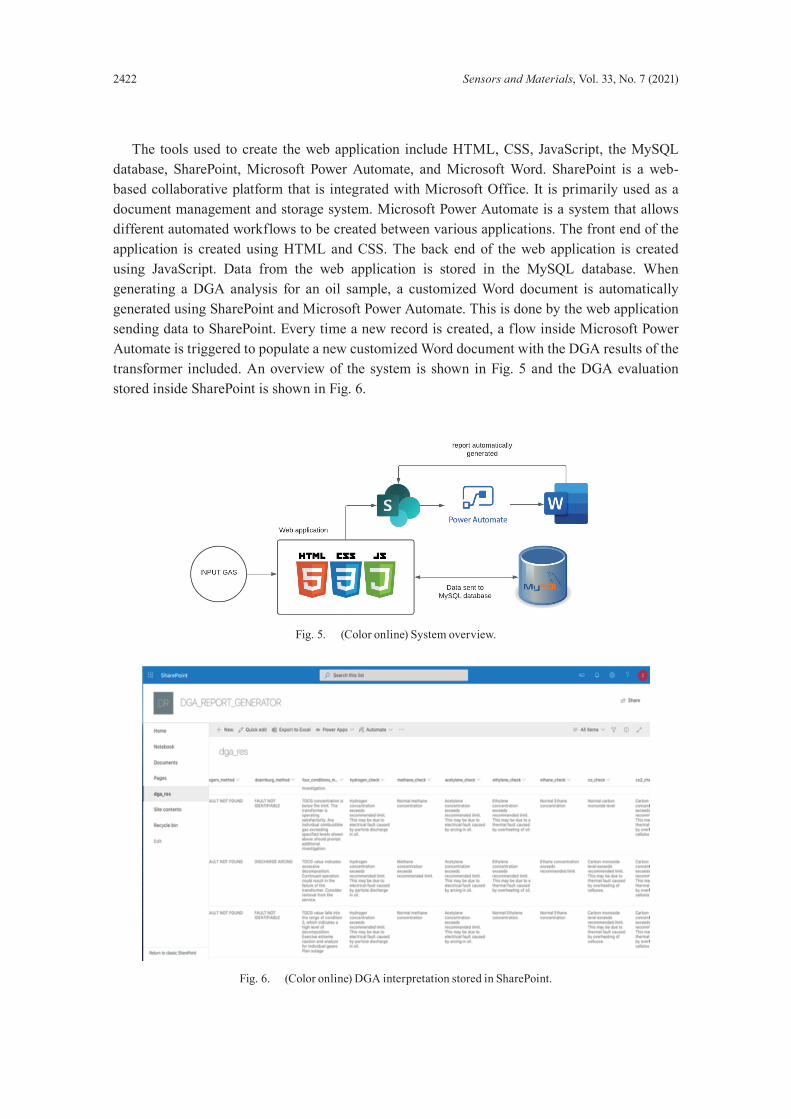
The tools used to create the web application include HTML, CSS, JavaScript, the MySQL database, SharePoint, Microsoft Power Automate, and Microsoft Word. SharePoint is a web-based collaborative platform that is integrated with Microsoft Office. It is primarily used as a document management and storage system. Microsoft Power Automate is a system that allows different automated workflows to be created between various applications. The front end of the application is created using HTML and CSS. The back end of the web application is created using JavaScript. Data from the web application is stored in the MySQL database. When generating a DGA analysis for an oil sample, a customized Word document is automatically generated using SharePoint and Microsoft Power Automate. This is done by the web application sending data to SharePoint. Every time a new record is created, a flow inside Microsoft Power Automate is triggered to populate a new customized Word document with the DGA results of the transformer included. An overview of the system is shown in Fig. 5 and the DGA evaluation stored inside SharePoint is shown in Fig. 6.
Fig. 5. (Color online) System overview.
Fig. 6. (Color online) DGA interpretation stored in SharePoint.

Sensors and Materials, Vol. 33, No. 7 (2021) 2423
3. Results and User Interface
We implemented and tested our system on a gas concentration dataset from Ekarat Engineering Public Limited. Upon logging into the web application, the user is brought to the dashboard page shown in Fig. 7. In this page, the user can search for the transformer they want to inspect and the time range for which they want data to be shown for. A graph displaying changes in gas concentrations is shown in the dashboard along with insights into how much the concentration of a key gas has increased since the last sampling. The dashboard also allows users to see gas concentrations for each sample in the form of a bar graph. When the user clicks on the Transformer List tab from the sidebar, they are brought to a page with a list of all the registered transformers in the system as shown in Fig. 8. The user can see the current status and condition of the transformer and click on the View button to see more details related to the transformer and reports associated with it. To create a new analysis, the user clicks on the Create Analysis tab on the sidebar, which allows the user to choose whether they want to create an analysis for a specific transformer (shown in Fig. 9) or an immediate stand-alone analysis (shown in Fig. 10). After that, the user can either fill in the gas values or upload an Excel file containing the gas concentration values as shown in Fig. 10. Figures 11–13 show the analyses generated using different methods.
4. Discussion
Although the DGA methods are generally capable of accurately diagnosing the condition of transformers, the calculated diagnosis can differ between methods. When it is unclear which method to follow, the gas data should be analyzed in detail separately as each method has its advantages and drawbacks.(26,27) In the following, we discuss the nature and limitations of each method used and what should be done when two methods give contradictory results. As the key gas method is used to determine faults from a transformer’s unique gas profile, it tends to return inconclusive results when a severe fault occurs because all gas values will be high. Therefore, if
Fig. 7. (Color online) Dashboard. Fig. 8. (Color online) Transformer list.

2424 Sensors and Materials, Vol. 33, No. 7 (2021)
all gas concentrations are noticeably abnormally high, it is best to consider other DGA approaches. Additionally, since the TDCG method does not provide the fault type, it should be incorporated into other methods in the system to obtain an accurate diagnosis. Lastly, a limitation of methods that utilize the gas ratios, such as the Rogers method and Doernenburg method, is that sometimes no diagnosis is given because the gas values fall outside the defined ranges. If this occurs, the use of Duval’s triangle is recommended because it will always provide a diagnosis.
Fig. 11. (Color online) Output of Rogers method. Fig. 12. (Color online) Output of Doernenburg method.
Fig. 10. (Color online) Generated stand-alone analysis.
Fig. 9. (Color online) Generated analysis for transformer.

Sensors and Materials, Vol. 33, No. 7 (2021) 2425
5. Conclusions
To combat the problems of the traditional DGA condition monitoring process and reduce time and human errors, a system that takes in gas concentration values obtained from GC via numerous gas detection sensors was created to generate an analysis and monitor the oil condition. Quantities of extracted gas components obtained from GC are sent automatically to a web application created with HTML and CSS as the front end, JavaScript as the back end, and MySQL as the database. A report is automatically generated through the integration of SharePoint and Power Automate. The application implements several DGA techniques: the individual and TDCG evaluation methods, the Doernenburg method, the Rogers method, and Duval’s triangle. The system has been demonstrated to considerably reduce mistakes, labor, and time. It also assists users in visualizing gas changes in a transformer. Future developments for this system include implementing machine learning or deep learning algorithms to assist the diagnosis of the transformer condition, especially when the results obtained from the DGA methods in the system differ.
Acknowledgments
The authors would like to express their special thanks to Ekarat Engineering Public Limited for providing all the necessary resources and facilities to make this project possible.
Fig. 13. (Color online) Output of Duval’s triangle method.

2426 Sensors and Materials, Vol. 33, No. 7 (2021)
References
1 D. Arvind, S. Khushdeep, and K. Deepak: Proc. 2008 IEEE/PES Transmission and Distribution Conf. and Exposition (2008) 1–6. https://doi.org/10.1109/TDC.2008.4517046
2 A. El-Bassiouny, M. El-Shimy, and R. Hammouda: 2017 19th Int. Middle East Power Systems Conf. (MEPCON, 2017) 565–570. https://doi.org/10.1109/MEPCON.2017.8301237
3 S. T. Jan, R. Afzal, and A. Z. Khan: Proc. Int. Conf. on Data Mining, Civil and Mechanical Engineering (ICDMCME’2015, 2015). https://doi.org/10.15242/iie.e0215039
4 T. B. Shanker, H. N. Nagamani, D. Antony, and G. S. Punekar: Proc. 2017 IEEE PES Asia-Pacific Power and Energy Engineering Conf. (APPEEC, 2017) 1–3. https://doi.org/10.1109/APPEEC.2017.8309010
5 V. Rusov and S. Zhivodernikov: Proc. 2008 Int. Conf. Condition Monitoring and Diagnosis (2008) 1012–1014. https://doi.org/10.1109/CMD.2008.4580453
6 Q. Yang, M. Li, X. Mu, and J. Wang: Proc. 2009 Int. Conf. Artificial Intelligence and Computational Intelligence (AICI, 2009) 442–445. https://doi.org/10.1109/AICI.2009.497
7 A. K. Merita, R. N. Sharma, and S. Chauhan: Proc. 2011 3rd Int. Conf. Electronics Computer Technology (2011) 343–347. https://doi.org/10.1109/ICECTECH.2011.5941917
8 S. Apte, R. Somalwar, and A. Wajirabadkar: Proc. 2018 IEEE Int. Conf. Power Electronics, Drives and Energy Systems (PEDES, 2018) 1–5. https://doi.org/10.1109/PEDES.2018.8707928
9 H. Ding, R. Heywood, J. Lapworth, R. Josebury, A. Roxborough, and E. McCulloch: Proc. 2017 IEEE 19th Int. Conf. Dielectric Liquids (ICDL, 2017) 1–5. https://doi.org/10.1109/ICDL.2017.8124735
10 Y. Liu, J. Li, and Z. Zhang: Proc. 2012 IEEE Int. Symp. Electrical Insulation (2012) 223–226. https://doi.org/10.1109/ELINSL.2012.6251462
11 X. F. Wang, Z. D. Wang, Q. Liu, G. Wilson, D. Walker, and P. W. R. Smith: Proc. 2017 IEEE 19th Int. Conf. Dielectric Liquids (ICDL, 2017) 1–4. https://doi.org/10.1109/ICDL.2017.8124635
12 S. Maneerot and N. Pattanadech: Proc. 2020 Int. Symp. Electrical Insulating Materials (ISEIM, 2020) 363–366. https://ieeexplore.ieee.org/document/9275717
13 P. Henault: Proc. 2011 IEEE PES 12th Int. Conf. Transmission and Distribution Construction, Operation and Live-Line Maintenance (ESMO, 2011) 1–7. https://doi.org/10.1109/TDCLLM.2011.6042220
14 P. Connig and J. Swinley: A Practical Guide to Gas Analysis by Gas Chromatography (Elsevier, Amsterdam, 2019) 1st ed., pp. 77–290.
15 R. J. Flanagan, E. Cuypers, H. H. Maurer, and R. Whelpton: Fundamentals of Analytical Toxicology: Clinical and Forensic (John Wiley & Sons, New Jersey, 2020) 2nd ed., Chap. 9. https://doi.org/10.1002/9781119122357.ch9
16 R. Wolstenholme, S, Jickells, and S. Forbes: Analytical Techniques in Forensic Science (John Wiley & Sons, New Jersey, 2021) 1st ed., Chap. 13. https://doi.org/10.1002/9781119373421.ch13
17 J. C. Dennison and J. M. Trout: Proc. 2016 IEEE/PES Transmission and Distribution Conference and Exposition (T&D, 2016) 1–5. https://doi.org/10.1109/TDC.2016.7519918
18 J. Fan, F. Wang, Q. Sun, F. Bin, J. Ding, and H. Ye: IEEE Trans. Dielectr. Electr. Insul. 24 (2017) 2854. https://doi.org/10.1109/TDEI.2017.006438
19 P. Zylka and B. Mazurek: Proc. 2002 IEEE 14th Int. Conf. Dielectric Liquids. ICDL 2002 (Cat. No.02CH37319, 2002) 325–328. https://doi.org/10.1109/ICDL.2002.1022760
20 N. A. Bakar, A. Abu-Siada, and S. Islam: IEEE Electr. Insul. Mag. 30 (2014) 39. https://doi.org/10.1109/MEI.2014.6804740
21 R. A. Prasojo, K. Diwyacitta, Suwarno, and H. Gumilang: Proc. 2017 Int. Conf. High Voltage Engineering and Power Systems (ICHVEPS, 2017) 40–45. https://doi.org/10.1109/ICHVEPS.2017.8225864
22 IEEE Guide for the Interpretation of Gases Generated in Mineral Oil-Immersed Transformers, in IEEE Std C57.104-2019 (Revision of IEEE Std C57.104-2008, 2019) 1–98. https://doi.org/10.1109/IEEESTD.2019.8890040
23 I. B. M. Taha, H. G. Zaini, and S. S. M. Ghoneim: Proc. 2015 IEEE Conf. Energy Conversion (CENCON, 2015) 363–367. https://doi.org/10.1109/CENCON.2015.7409570
24 I. B. M. Taha, S. S. M. Ghoneim, and H. G. Zaini: Proc. 2015 North American Power Symp. (NAPS, 2015) 1–5. https://doi.org/10.1109/NAPS.2015.7335098
25 S. S. Desouky, A. E. Kalas, R. A. A. El-Aal, and A. M. M. Hassan: Proc. 2016 IEEE 16th Int. Conf. Environment and Electrical Engineering (EEEIC, 2016) 1–5. https://doi.org/10.1109/EEEIC.2016.7555796
26 O. Shutenko and O. Kulyk: Proc. 2020 IEEE Problems of Automated Electrodrive, Theory and Practice (PAEP, 2020) 1–6. https://doi.org/10.1109/PAEP49887.2020.9240911
27 J. I. Aizpurua, V. M. Catterson, B. G. Stewart, S. D. J. McArthurt, B. Lambert, B. Ampofo, G. Pereira, and J. G. Cross: Proc. 2017 IEEE Electrical Insulation Conf. (EIC, 2017) 286–289. https://doi.org/10.1109/EIC.2017.8004698