automated consensus-based data verification in the ...amaccarl/calpolypublications/tr… · changes...
TRANSCRIPT
MacCarley and Slonaker Page 1
Automated Consensus-based Data Verification in the Caltrans Detector Testbed
C. Arthur MacCarley Electrical and Computer Engineering California Polytechnic State University San Luis Obispo, California 93407 USA Ph: 805 781-8461 FAX: 805 781-0768 [email protected] John Slonaker California Department of Transportation Division of Innovation and Research 3337 Michelson Drive, Suite CN380, California 92612 USA Ph: 949 724-2940 [email protected] Originally submitted as 2007 TRB Annual Meeting paper number 07-0703. Word count 3521 + 1 Table + 9 figures. Abstract. A practical need to assess the accuracy and attributes of each of the many types of roadway sensors and detectors motivated the California Department of Transportation to construct a traffic detector test bed on I-405 in Southern California. With up to ten detectors of different types under concurrent test in each of six lanes, a means for automating the testing process became imperative, since traditional human verification methods were not practical. This paper describes an automated data acquisition and verification system that utilizes a consensus of the results from all detectors under test, along with those of a reference image processing system, to create a preliminary ground truth record requiring manual verification for only a small percentage of ambiguous cases. Individual detector performance is then assessed by comparison with this verified dataset. The test bed architecture, data fusion methodology, computer vision methods, operator interface and performance results are discussed.
BACKGROUND
The detection of the presence, speed and/or length of vehicles on roadways is recognized as critical for effective roadway congestion management and safety. The use of vehicle presence sensors is common practice for traffic volume measurement and control of signalized intersections and ramp meters. In addition, vehicle speed and classification from length are important for automated incident detection and the characterization and prediction of traffic demand. Real-time detection is also used for actuation of automated driver information systems, for example, the Caltrans Automated Warning System (CAWS) on I-5 in central California (1). The Traffic Operations Division of the California Department of Transportation is expanding its vehicle detector infrastructure to provide more traffic information to its TMCs (traffic management centers). Recently, the market has seen an increasing number of “out-of-pavement” detection systems, that have an advantage over conventional inductive loop detectors because they do not require lane closures for installation and subsequent maintenance. These systems use various non-intrusive sensing methods, and there is evidence from pilot installations, however anecdotal, that these detectors have different detection characteristics and yield different accuracies than inductive loop systems. Knowledge is needed about how these various types of detectors perform in different situations in order to design installations and specify equipment for specific detection environments. The various out-of-pavement detection systems along with an inductive loop system installed in the Testbed generate an event record for each northbound vehicle that passes by. However, due to the different sensing mechanisms, and possible occlusion, lane changing, vehicles with trailers and other situations, the detectors will occasionally miss or double count vehicles. There was previously no way to compile and compare these anomalies without manually reviewing each individual event record for each data collection session, which is practically impossible. With these and other concerns in mind, Caltrans DRI (Division of Research and Innovation) established the ATMS (Advanced Traffic Management Systems) Detector Testbed on Route 405 in the city of Irvine. A central feature of the Testbed is the Video Vehicle Detector Verification System (V2DVS) that automates the collection and reduction of data for detector tests. The V2DVS system performs a number of functions that greatly reduce the human workload associated with detector performance assessments, especially for long test periods and large datasets: It records an event record including a digital image acquired at the time of detection for every detector under test. It implements a computer
MacCarley and Slonaker Page 2
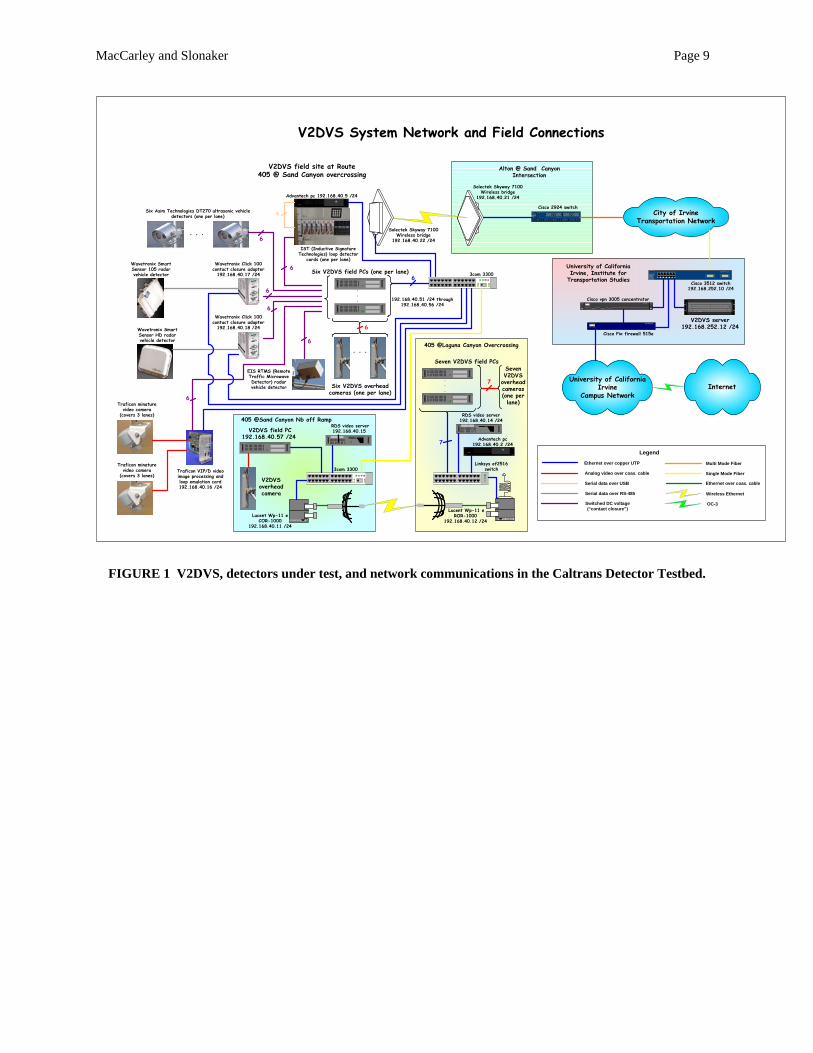
vision system to provide a reference image and record of every vehicle in a standard detection zone. It implements a distributed database system for storage and processing of all data and images. For every vehicle, it compares the results of each detector, including its own video detection record, to create a preliminary “ground truth” reference dataset against which the performance of individual detectors may be compared. It provides graphical tools for rapid human resolution of reported detections for which a clear consensus does not exist. It compares the results of individual detectors to the ground truth record to generate an overall report of the performance of all detectors under test. It also allows secure Internet-based remote control of all system functions and settings. With the V2DVS, the Testbed provides DRI and Traffic Operations personnel with valuable insight into the characteristics of out of pavement vehicle detection systems with different technologies and manufacturers. It also provides the manufacturers of the detectors being tested with a visually verifiable account of exactly how errors occurred, suggesting ways that the systems could be improved. FIGURE 1 depicts the current Testbed components, including the V2DVS, detectors currently under test, and the network communications components.
EVALUATION METHODOLOGY
Among the sensing mechanisms used by the various detectors to be tested in the Testbed are changes in inductance, changes in magnetic field strength, video image processing, microwave RADAR, optical or infrared transmission, laser reflection or pulse time-of-flight, and ultrasonic pulse return (2,3). Detectors based on each method are known to have advantages and limitations that make them appropriate for some applications, but inappropriate for others. The greatest challenge in any large-scale roadway test involving individual vehicle records is the creation of a “ground truth” reference dataset that represents the actual history of the traffic. This traditionally requires human verification of each vehicle, either by direct observation or from playback of video tapes. We solve this problem in the Testbed by employing an automated data acquisition and verification process that combines the results of all detectors to pre-screen obviously correct and incorrect detections from unambiguous cases. This process relies on the formation of a consensus among proximate reported detections after correction for different detection positions and processing time delays. The correction method requires knowledge of vehicle speeds, which are determined by processing of the image stream from over-lane video cameras. Manual verification by a human operator is required only for reported detections that cannot be correlated with those of a weighted majority of all the detectors under test, as well as the video detection record generated by V2DVS itself. For the small number of cases that cannot be automatically classified, human verification is required. This labor-intensive task is made easier by a network client application that displays an interactive graphical time-line of all detections along with roadway images acquired at the time of each detection. Once the verification of the ground truth dataset is complete, individual performance statistics are automatically generated by comparison of the results produced by each detector with the confirmed dataset. Without such a labor-saving system, 100% data verification is not considered practical, considering the large traffic volume (typically 6000 vehicles per hour) and as many as ten detectors tested concurrently. The discussion below focuses on the automated data reduction and verification method, and the video processing techniques used for robust detection and measurement of the speed of each vehicle.
SYSTEM ARCHITECTURE AND FEATURES
The Video Vehicle Detector Verification System is physically comprised of a cluster of rack-mount Linux computers (field machines), one per lane, and a LAN or Internet-connected central database server. In addition, a PC-based client program facilitates remote monitoring and control of all field machines, and manual ground truth verification. Each field machine interfaces to a video camera positioned on an overcrossing above an assigned traffic lane. Detectors under test are connected to the V2DVS, and each reported vehicle detection generates a record consisting of a JPEG compressed image and the time of arrival and speed of the vehicle. A maximum of eight contact closures or logic level inputs, and an unlimited number of network or serial signal inputs are accepted for each lane. Although only one test site is currently operational, multiple test sites are supported. At maximum traffic capacity, as many as 96,000 records per hour may be generated at one site. The primary test site is equipped with poles on the median and roadside on which wide-area detectors can be mounted. Each of the traffic lanes has duplex inductive loops. The camera structures on the overcrossing provide mounting points for other over-lane detectors. Detector electronics and the V2DVS field machines are housed in three roadside Caltrans Type 334C cabinets, one shown in FIGURE 2. Video verification uses down-looking high-resolution NTSC video cameras placed 10 meters above each traffic lane as shown in FIGURE 3. Cameras have manual electronic shutters set at 1/4000 sec. to prevent image blur from moving vehicles. The field of view of each camera extends from immediately below the overcrossing deck to approximately 25 meters down-road, to contain

MacCarley and Slonaker Page 3
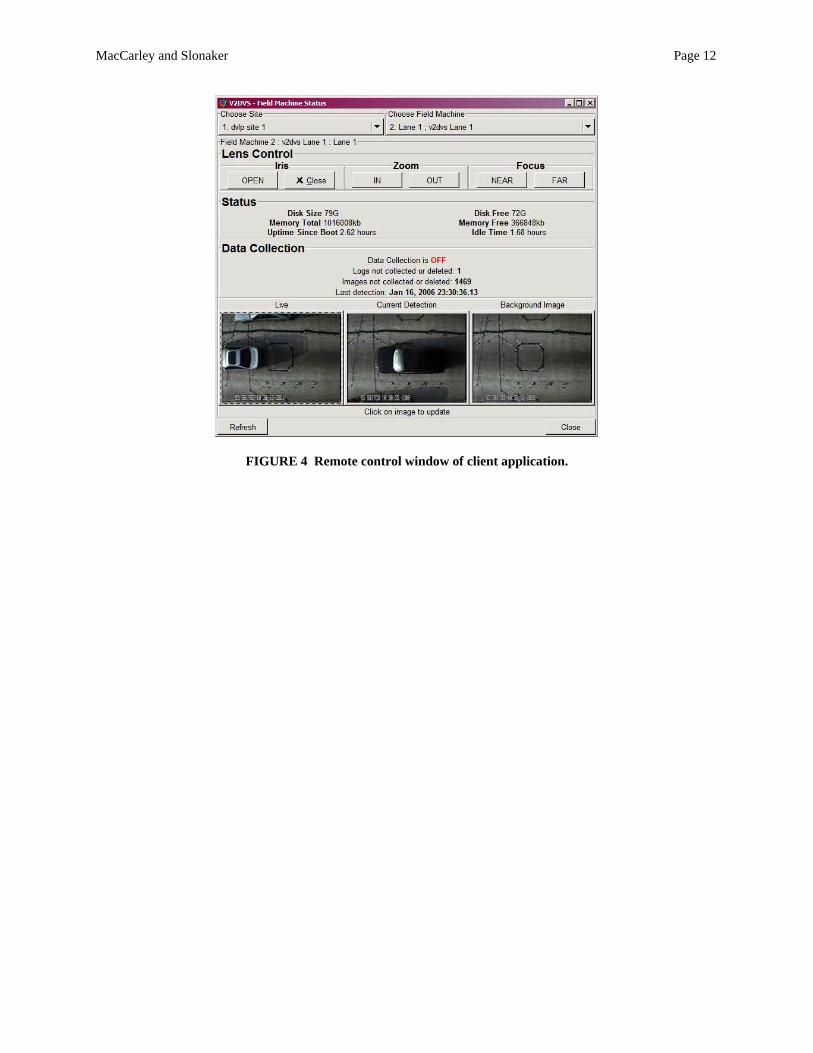
most of the zones of detection used by different detectors; exceptions are video-based detection systems which use far-field approaching or departing traffic views. This camera deployment is optimal for Testbed research purposes, but is not considered practical for general-purpose traffic monitoring since individual-lane overhead camera placements are usually only possible on overcrossings. Each detector under test signals the system for each vehicle detected. Signaling may be real-time in which a record is acquired immediately, or delayed up to 5 seconds after the actual time of detection to accommodate some detectors that have processing delays. The image acquisition function maintains a circular buffer of the most recent 300 video images (fields) acquired at 60 video fields per second for this purpose. Signaling is accepted by two physical methods: 1. Hardware signaling (contact closure or open-collector active-low logic level), or 2. Network or serial port signaling. Most detectors use hardware signaling. The latter method provides a means for a detector to report the exact time of detection for delayed signaling, and additional information that may be included in the event record. A typical data string, if displayed on a terminal, might be: A 5 06010114301550 65.0 150.0 S Where: Detector code = A (each detector is assigned single letter ID) Lane = 5 Year = 2006, Month = January, Day = 1 Time = 2:30 PM and 15.50 seconds Speed = 65.0 MPH Distance offset from baseline (if not constant) = 150.0 feet Site Code = S (Sand Canyon) For real-time signaling, the most recently acquired image is recorded along with the exact time that the signal was received, accurate to 0.001 second. For delay-time signaling, the queued image closest to the time of detection is stored for that record. To assure exact time synchronization for delayed detectors which report specific detection times, V2DVS provides an NTP (Network Time Protocol) local time server which must be referenced by any detector which uses delay-time signaling. Different detection zones and processing delays are accommodated for each detector, to be discussed later. All records (image and data) are stored locally on each field machine, and automatically pushed via SFTP on a bandwidth-available basis to the central server, which stores data objects in a MySQL (4) database, and images in indexed directories. Local storage capacity allows tests up to twenty days in duration prior to the need to off-load data to the server. While connectivity between elements at the field site(s) is provided by a 100 Mbps LAN, the field site(s) are connected to the server via multiple networks including a relatively slow 802.11b wireless link, as shown in FIGURE 1. As a result, up to 20 hours may be required to transfer as little as two hours of test data and images from all lanes and detectors. The server is currently set up on-site to avoid these network bandwidth limitations. Computer control of the camera iris is critical for maintaining an optimal and consistent scene intensity level for image processing. Each field machine provides this function via a 68HC12 microcontroller interface and lens motor driver subsystem. The field machines may be controlled locally or remotely from any Internet-connected computer via the V2DVS client application, including manual override of the camera iris, focus and zoom controls. The client remote control screen is shown in FIGURE 4.
VIDEO DETECTION AND SPEED CALCULATION
As previously mentioned, the V2DVS field machine for each lane acquires a record including an image for each signaled detection event. It also functions as a reference detector, acquiring a time-of-detection record and image when each vehicle arrives at a baseline position in the field of view of the camera. The video stream is also processed to provide the vehicle speed data needed to correlate detections reported in different zones. A typical detection verification image is shown in FIGURE 5. As with any video-based traffic detector, the V2DVS is susceptible to errors due to the inherent limitations of natural scene illumination at various sun angles or from vehicle headlights. A major problem is false detection due to shadows, especially those cast by vehicles in adjacent lanes. These image artifacts often meet the same texture, contrast and motion requirements as an actual vehicle, and therefore may be incorrectly detected. Long shadows are a particular issue during morning and evening rush hours, which are the most interesting traffic conditions for detector testing. A special effort was made to improve the ability to distinguish shadows from actual

MacCarley and Slonaker Page 4
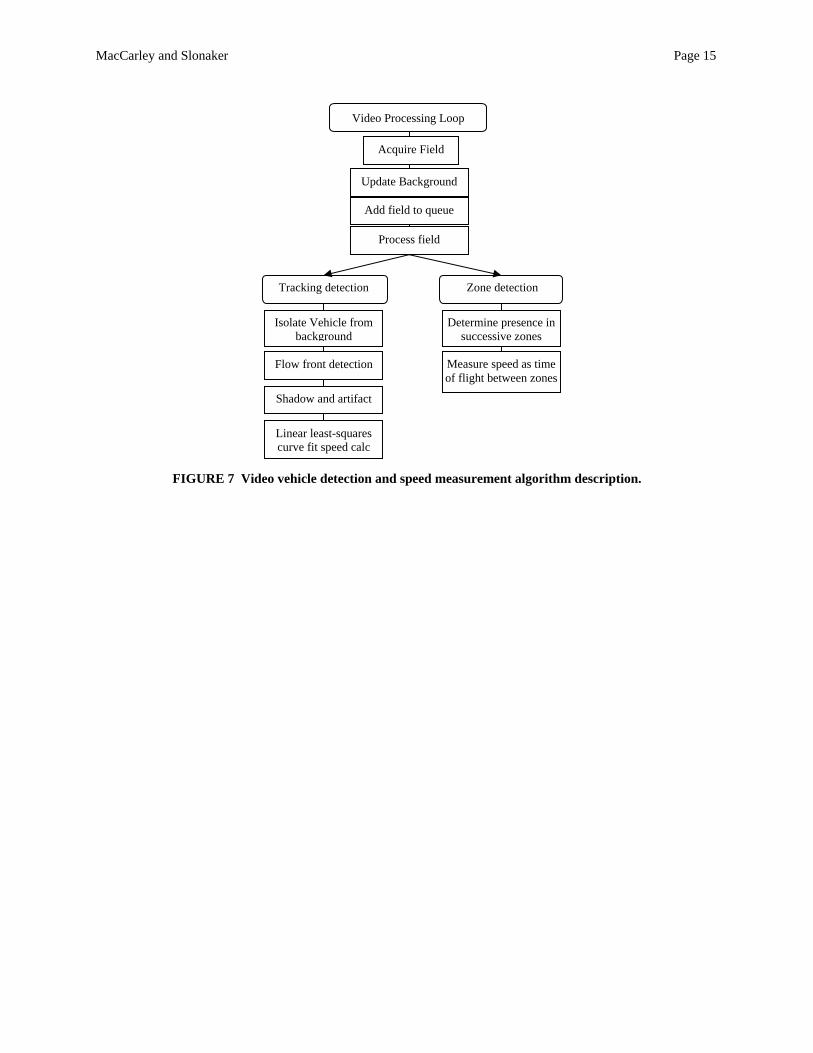
vehicles, and to also correctly detect vehicles imbedded in or connected to shadows cast by other vehicles. The most successful approach involves tests of texture and contrast, such as those used by (5,6), but primarily relies on the continuity of a shadow originating from an adjacent lane. Processed image areas include adjacent lanes on either side of the lane under test. A long-shadow situation is illustrated in FIGURE 6, which shows the video processor user interface in diagnostic mode with optical flow scan lines visible. In this example, the continuity of the vehicle shadow extending from the adjacent lane into the detection zone effectively discriminates the shadow from an actual vehicle, while texture tests avoid incorrect rejection of a possible vehicle embedded in the shadow. The ability to compare the results of several detectors, each that identify the same vehicle at different positions on the roadway, requires knowledge of the vehicle speed. Since few detectors under test report vehicle speeds, the V2DVS must generate an accurate measurement of speed for each vehicle detected. A multi-tiered algorithm is used, described from a high-level view in FIGURE 7. The position of the vehicle leading edge is tracked as it passes through the camera field of view. Position samples are stored for each video field, vetted for forward progression and reasonableness, and then used to define a linear equation by least-squares curve fitting. The linear coefficient is the estimated speed value. The sample variance about the linear function is tested, and if found to be excessive, the algorithm reverts to one of two alternative methods: A histogram is generated for speed calculated from the elapsed times between every reasonable pairing of position samples. The median speed value from the histogram serves as the vehicle speed estimate. Or in very sparse data situations, detection may be based on simple volume intensity change in two consecutive zones along the path the vehicle, and speed calculated as time-of-flight between the zones (a method commonly used by video-based intersection vehicle detectors). A speed measurement is required as a qualification for a valid vehicle detection. Video detection accuracy is affected primarily by the scene illumination and secondarily by the characteristics or lane position of the vehicle. Manually confirmed accuracy over a range of possible daylight conditions is reported in TABLE 1. In this table, “Velocity calc.” is expressed as the number of speed measurements that were consistent with proximate vehicles and were therefore considered “reasonable”. This machine-generated qualitative measure was necessary since there was no absolute speed reference for comparison of the V2DVS measurements. We note that high presence detection accuracy does not necessarily assure high accuracy in velocity measurement, since the shadow rejection methods that improve presence detection are less effective on the tracking of an optical flow front.
AUTOMATED DATA VERIFICATION
In post-processing, a composite ground truth dataset is derived from all detector data, based upon user-selectable confidence criteria. The primary automation task is to identify records of the same vehicle reported by different detectors having different detection zones and processing delays. Adjusted detection times are calculated from the distance (offset) of each zone from a baseline position, using the assumption of constant vehicle speed over the offset interval. As previously discussed, speed is estimated by video processing for each proximate candidate vehicle, and when available, also measured by duplex loop detectors. When both sources are available, the values are averaged. The time adjustment for vehicle j reported by detector i is:
ji
iji v
xt
,, =
where: is the pre-signal delay for the detection (sec.) jit ,
is the offset of the detection zone from the baseline (m.) ix = the velocity of the vehicle (m/s) jiv ,
MacCarley and Slonaker Page 5
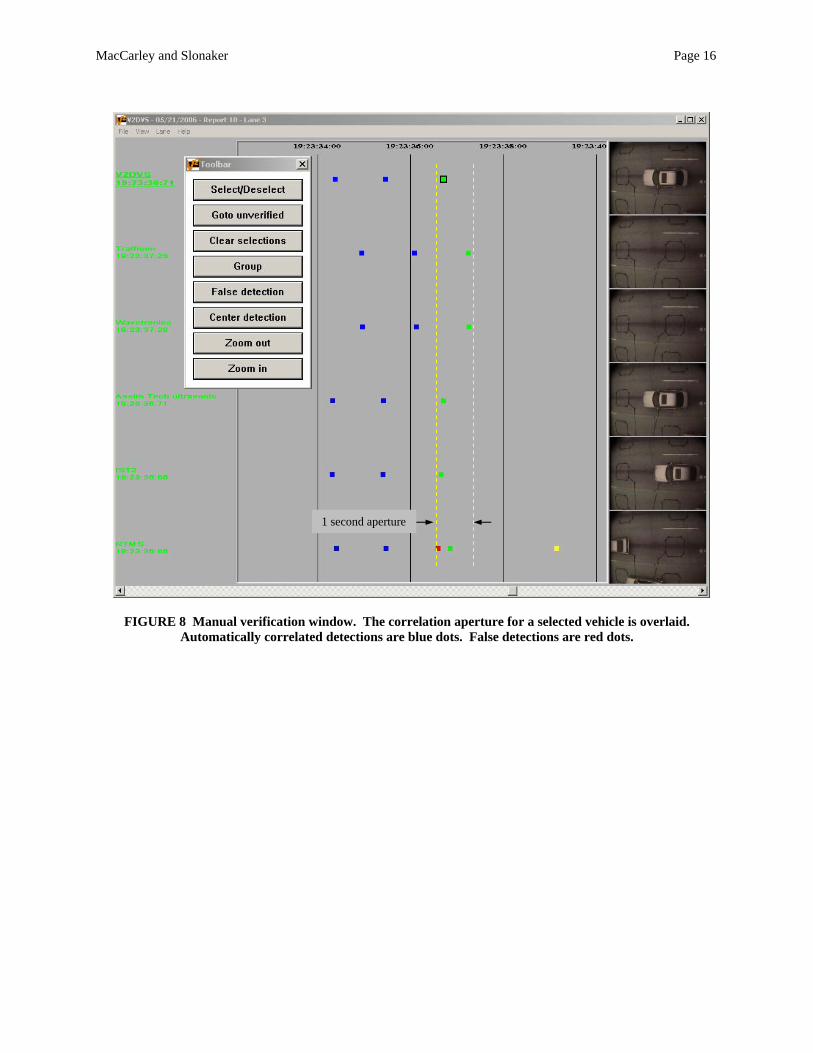
Raw detection times are corrected by subtraction of the pre-signal delay to generate the compensated time of detection. A false detection may not have a corresponding speed measurement if it is not detected by either V2DVS or the duplex loop detector. In this case, the speed of the nearest proximate vehicle in that lane is used. A reported detection is considered valid if it occurs within a user-defined admissible time/distance aperture, centered about the average compensated time of detection from all detectors, or a designated subset thereof referred to as trusted detectors. The failure of a detector to report a vehicle within the aperture is considered a potential failure-to-detect error, unless a proximate detection is later associated with that grouping during manual verification. Detections occurring outside of an aperture, or multiple detections inside the same non-overlapping aperture, are considered potential false detections. Proximity to the center time is used to discriminate cases of nearly equal admissibility when apertures for closely following vehicles overlap. A one-second aperture is illustrated in FIGURE 8 by lines overlaid on the manual verification window provided by the V2DVS client application. This window graphically depicts on a common time line the results from all detectors for a given lane. Automatically correlated detections appear as blue dots, and false detections in red. One ambiguous detection appears as a yellow dot. Mouse-click selection of any dot brings up the corresponding image acquired at the time of that detection, that makes clear why a detection was not automatically correlated (grouped). The members of the currently selected group are highlighted in green. The classification of any detection (dot), including those that may have been incorrectly grouped by the automated process, can be changed by clicking on the toolbar buttons shown in the inset window. For the second and third detectors shown in FIGURE 8, the blank vehicle images are due to detection positions beyond the camera field of view. For these cases, a pre-trigger image recording mechanism can optionally be activated that uses the vehicle speed determined by the V2DVS, and an internal queue of the last 300 video fields, to acquire the vehicle at the time it was within the camera field of view. Multiple windows can be activated to examine multiple lanes. The client application communicates with the server over a secure Internet connection, downloading new datasets to the PC client, and storing manually verified results back to the server. Once manual verification has been completed for all lanes, the dataset is marked by the operator as closed, and V2DVS compiles test results for all detectors under test, including itself. The “Statistics” window is shown in FIGURE 9 for a preliminary test run conducted prior to the final optimization of the detectors under test.
RESULTS AND EXPERIENCE GAINED
Automated data reduction greatly reduces the workload associated with ground truth generation, since it requires human verification only for detections that cannot be automatically correlated. In preliminary testing with 9600 detections (approximately 1600 vehicles) under various conditions, approximately 97% of vehicle detections were properly classified as correct, false, or failure-to-detect by the automated process, leaving only 3% for manual verification. This number depends heavily upon the number of reported false detections, which are liberally admitted as ambiguous rather than false by the automated process to reduce the possibility of rejecting a correct detection that did not meet the consensus requirements. Since the designated trusted detectors are weighted most heavily in the consensus process, the most egregious error in automated correlation occurs if all (one or two) fail to detect an actual vehicle – a very rare occurrence. For the detectors under test, failure-to-detect errors observed to date have been most commonly related to ambiguous vehicle lane positions, non-ideal image processing conditions for video-based detectors e.g., shadows or vehicle occlusion, or difficulties of roadside-mounted RADAR detectors with reflections and occlusion for distant lanes (e.g., Lane 1). Frequent false detection errors by some detectors can usually be reduced by improved calibration at the site. In general, the effectiveness of V2DVS at pre-screening the detection data is dependent upon the size of the admissible time/distance aperture, with more conservative settings tending to reject valid detections, while less conservative settings admitting incorrect matches that can lead to misalignment errors that propagate to other proximate vehicles in the ground truth data set. Preliminary tests indicate that an admissibility aperture of approximately ±10 feet (9.2 meters) provides the best tradeoff between these constraints. Further details may be obtained from (7).
ACKNOWLEDGEMENTS AND DISCLAIMER
This work was supported by the California Department of Transportation, Division of Innovation and Research. Statements and results reported herein are the responsibility of the authors exclusively. This report does not constitute a standard, specification or regulation.
MacCarley and Slonaker Page 6
REFERENCES
1. MacCarley, C.A., C. Ackles, T. Watts. A Study of the Response of Highway Traffic to Dynamic Fog Warning
and Speed Advisory Messages, 06-3086, Transportation Research Board Annual Meeting, National Research Council, Washington, D.C., January 2006.
2. Kell, J.H., Iris J. Fullerton, Milton K. Mills, Traffic Detector Handbook, U.S. Department of Transportation Federal Highway Administration, Office of Research and Development, FHWA-IP-90-002, July 1990.
3. US Dept. of Transportation, Field Test of Monitoring of Urban Vehicle Operations Using Non-Intrusive Technologies, FHWA-PL-97-018, U.S. Dept. of Transportation, Federal Highway Administration, 1997.
4. DuBois, Paul, MySQL, 2nd ed. Pearson Education, ISBN 0-7357-1212-3, Jan 2003. 5. Cho, Jeong-Hoon, Tae-Gyun Kwon, Dae-Geun Jang, Chan-Sik Hwang. Advances in Artificial Intelligence, Proc.
18th Australian Joint Conf. on Artificial Intelligence, 2005, p 746-755. 6. Xu, Haixiang, Guangxi Zhu, Fuyuan Peng, Wei Ge, Lei Xie, Pingan Tao. Proc. SPIE, v 6044, MIPPR 2005:
Image Analysis Techniques, 2005, p. 60441T. 7. MacCarley, C.A., Video Vehicle Detector Verification System (V2DVS) Operators Manual, Calif. Dept. of
Transportation Task Order 5327, Cal Poly Corp. Project No. 48020, May 18, 2006.

MacCarley and Slonaker Page 7
LIST OF TABLES AND FIGURES
TABLE 1 Manually Verified Detection and Speed Measurement Performance of V2DVS for Range of Lighting Conditions..............................................................................................................................................................8
FIGURE 1 V2DVS, detectors under test, and network communications in the Caltrans Detector Testbed.................9 FIGURE 2 V2DVS field computers in cabinet...........................................................................................................10 FIGURE 3 Video cameras above each lane................................................................................................................11 FIGURE 4 Remote control window of client application...........................................................................................12 FIGURE 5 Typical detection image. ..........................................................................................................................13 FIGURE 6 Shadow rejection method illustrated in diagnostic mode. Detection scan lines in lane do not terminate
on leading edge of shadow, indicating rejection of shadow flow front. ..............................................................14 FIGURE 7 Video vehicle detection and speed measurement algorithm description. .................................................15 FIGURE 8 Manual verification window. The correlation aperture for a selected vehicle is overlaid. Automatically
correlated detections are blue dots. False detections are red dots. ......................................................................16 FIGURE 9 Statistics window showing a sample of results from preliminary system testing in four lanes. Numbers
shown are not necessarily representative of the potential performance of the listed detectors............................17

MacCarley and Slonaker Page 8
TABLE 1 Manually Verified Detection and Speed Measurement Performance of V2DVS for Range of Lighting Conditions
Illumination condition Sample size
(actual vehicles) Correctly detected Failed to detect
False detected Velocity calc.
(% reasonable*)
Overhead sun 300 299 (99.7%) 1 (0.3%) 0 (0%) 299 (99.7%)
Diffuse moving shadows 300 298 (99.3%) 2 (0.7%) 0 (0%) 298 (99.3%)
Crisp moving shadows from adjacent lane
300 295 (98.3%) 5 (1.7%) 0 (0%) 295 (98.3%)
Fixed (bridge) shadow in detection zone
200 197 (98.5%) 3 (1.5%) 0 (0%) 195 (97.5%)
Dappled shadows from adjacent lane
200 197 (98.5%) 3 (1.5%) 3 (1.5%)
193 (96.5%)
Low light ( < 30/255 mean image intensity)
300 298 (99.3%) 2 (0.7%) 1 (0.3%) 290 (96.7%)
* Consistent with human verification from field-by-field video sequence.
MacCarley and Slonaker Page 9
Traficon minature video camera
(covers 3 lanes)
V2DVS System Network and Field Connections
City of IrvineTransportation Network
Advantech pc 192.168.40.5 /24
V2DVS field site at Route 405 @ Sand Canyon overcrossing
Solectek Skyway 7100 Wireless bridge
192.168.40.22 /24
3com 3300
RDS video server 192.168.40.14 /24
RDS video server 192.168.40.15
SDSER IESCat aly st 2 900
Cisco 2924 switch
Alton @ Sand CanyonIntersection
Solectek Skyway 7100 Wireless bridge
192.168.40.21 /24
Six V2DVS field PCs (one per lane)
Six V2DVS overhead cameras (one per lane)
192.168.40.51 /24 through192.168.40.56 /24
V2DVS field PC 192.168.40.57 /24
Six Asim Technologies DT270 ultrasonic vehicle detectors (one per lane)
Wavetronix Smart Sensor 105 radar vehicle detector
Wavetronix Smart Sensor HD radar vehicle detector
Traficon VIP/D video image processing and loop emulation card192.168.40.16 /24
EIS RTMS (Remote Traffic Microwave Detector) radar vehicle detector
Wavetronix Click 100 contact closure adapter
192.168.40.17 /24
Wavetronix Click 100 contact closure adapter
192.168.40.18 /24
IST (Inductive Signature Technologies) loop detector
cards (one per lane)
CIS CO SYSTEM S
SYSTE M RP S
MODE
1 2
XL
100BaseF X
1 2 3 4 5 6 8 9 10 11 127
SD
WS-X2961-XL
SD
WS-X2961-XL
Linksys ef2516 switch
Lucent Wp-11 e ROR-1000
192.168.40.12 /24
405 @Laguna Canyon Overcrossing
Advantech pc192.168.40.2 /24
Seven V2DVS field PCs
3com 3300
405 @Sand Canyon Nb off Ramp
Lucent Wp-11 e COR-1000
192.168.40.11 /24
. . .
6
6
6
6
6
6
6
6
6
Traficon minature video camera
(covers 3 lanes)
Cisco 3512 switch 192.168.252.10 /24
Cisco vpn 3005 concentrator
Cisco Pix firewall 515e
SDSERIESCatalyst 3500 XL
PWR
SD
LINK ACTW AN
LINK AC TLAN
POWER/ALARM
FirerunnerCISCO YSTEMSS
®
SD
POWER N ETWOR KACT
PIX FirewallSERIESCISCO SYSTEMS
V2DVS server192.168.252.12 /24
SD
RESETRUN STATUS
University of California Irvine, Institute for
Transportation Studies
University of California Irvine
Campus Network
. . .
.
.
.
Internet
Ethernet over coax. cable
Legend
Multi Mode Fiber
Wireless Ethernet
OC-3
Single Mode Fiber
Ethernet over copper UTP
Analog video over coax. cable
Serial data over USB
Serial data over RS-485
Switched DC voltage (“contact closure”)
.
.
.
Seven V2DVS
overhead cameras (one per lane)
V2DVS overhead camera
7
7
FIGURE 1 V2DVS, detectors under test, and network communications in the Caltrans Detector Testbed.

MacCarley and Slonaker Page 10
FIGURE 2 V2DVS field computers in cabinet.

MacCarley and Slonaker Page 11
FIGURE 3 Video cameras above each lane.
MacCarley and Slonaker Page 12
FIGURE 4 Remote control window of client application.

MacCarley and Slonaker Page 13
FIGURE 5 Typical detection image.

MacCarley and Slonaker Page 14
FIGURE 6 Shadow rejection method illustrated in diagnostic mode. Detection scan lines in lane do not terminate on leading edge of shadow, indicating rejection of shadow flow front.
MacCarley and Slonaker Page 15
Isolate Vehicle from background
Video Processing Loop
Acquire Field
Update Background
Add field to queue
Process field
Tracking detection
Flow front detection
Shadow and artifact j i
Linear least-squares curve fit speed calc
Zone detection
Determine presence in successive zones
Measure speed as time of flight between zones
FIGURE 7 Video vehicle detection and speed measurement algorithm description.
MacCarley and Slonaker Page 16
1 second aperture
FIGURE 8 Manual verification window. The correlation aperture for a selected vehicle is overlaid.
Automatically correlated detections are blue dots. False detections are red dots.

MacCarley and Slonaker Page 17
FIGURE 9 Statistics window showing a sample of results from preliminary system testing in four lanes. Numbers shown are not necessarily representative of the potential performance of the listed detectors.