auto-organized visual perception using distributed camera network
TRANSCRIPT
Robotics and Autonomous Systems 57 (2009) 1075–1082
Contents lists available at ScienceDirect
Robotics and Autonomous Systems
journal homepage: www.elsevier.com/locate/robot
Auto-organized visual perception using distributed camera networkRichard Chang ∗, Sio-Hoi Ieng, Ryad BenosmanInstitut des Systemes Intelligents et de Robotique (ISIR-CNRS), 4 Place Jussieu, 75252 Paris Cedex 05, France
a r t i c l e i n f o
Article history:Received 22 July 2008Received in revised form2 July 2009Accepted 8 July 2009Available online 23 July 2009
Keywords:Camera networkImage codingGMMInformation extractionDynamic organization
a b s t r a c t
Camera networks are complex vision systems difficult to control if the number of sensors is getting higher.With classic approaches, each camera has to be calibrated and synchronized individually. These tasks areoften troublesome because of spatial constraints, and mostly due to the amount of information that needto be processed. Cameras generally observe overlapping areas, leading to redundant information that arethen acquired, transmitted, stored and then processed. We propose in this paper a method to segment,cluster and codify images acquired by cameras of a network. The images are decomposed sequentially intolayers where redundant information are discarded. Without the need of any calibration operation, eachsensor contributes to build a global representation of the entire network environment. The informationsent by the network is then represented by a reduced and compact amount of data using a codificationprocess. This framework allows structures to be retrieved and also the topology of the network. It can alsoprovide the localization and trajectories of mobile objects. Experiments will present practical results inthe case of a network containing 20 cameras observing a common scene.
© 2009 Elsevier B.V. All rights reserved.
1. Introduction
As cameras are becoming common in public areas they area powerful information source. Camera networks have been in-tensively used in tracking or surveillance tasks [1,2]. Most multi-camera systems assume that the calibration and the pose of thecameras are known, standard networks applications also implyother highly constraining tasks such as: 3D reconstruction, framessynchronization, etc. Baker and Aloimonos [3], Han and Kanade [4]introduced pioneering approaches of calibration and 3D recon-struction from multiple views. The reader may refer to [5–7] forinteresting works on camera networks and to [8–10] for synchro-nization issues. Another limitation is that the cameras must alsobe stationary, the field of view of the network is then rigidly setand cannot be adapted according to the events in the scene. Mostof the applications implying that the use of a set of cameras areprocessing information by incrementing acquired data. Every sin-gle camera acts as an individual entity that does not necessarilyinteract with the other ones. Usually the camera transfers its in-formation regardless to the behavior of the other ones. Thus, ifthe network is dense enough, obvious redundancies are unavoid-able and resources like bandwidth,mass storage system are simplywasted. One can expect to overcome these problems by coordinat-ing smartly the efforts of each camera relying on themain idea thatthey are forming a unique vision sensor. It is also unreasonable
∗ Corresponding author.E-mail address: [email protected] (R. Chang).
0921-8890/$ – see front matter© 2009 Elsevier B.V. All rights reserved.doi:10.1016/j.robot.2009.07.008
to use raw images, to avoid unnecessary data transfer within thenetwork. Data compression methods preserving relevant informa-tion should then be used. Scenes can be described using their con-tents relying on lines and edges to build geometric models fromimages [11]. In other cases, visual features can be merged withother modalities such as ultrasound sensors [12] to introduce ro-bustness. Several aspects of the environment can also be extractedfrom images like walls, doors and vacant spaces [13]. Recent workson bag-of-features [14] representations have become popular, asthey introduce geometry-free features to characterize local subim-age using statistical tools.It is often constraining to use camera networks as the high
number of sensors needs permanent external tuning usually per-formed by a human operator. The aim of this paper is to introducea geometry-free method that allows camera networks systems toestimate their topology and auto-organize their own activities ac-cording to the content of the scene and the task to be achieved.The paper introduces a common description visual language usedby all cameras to exchange information about scenes. A samplingmethod of acquired images into subimages combined with bag-of-feature allowing their codification is presented. In a second stage, amulti-layer data reduction architecture is introduced, it is inspiredby the statistical organization of the human retina [15]. This con-vergent structure as will be seen allows to remove redundancies.Finally a functional layer gathers cameras as single visual entitiesperforming identified tasks.This paper is organized as follows: in the next section, themulti-
layer coding is presented. Each transition from the lowest stageto the higher one is detailed. In the third section we show thatgeometric structures can be recovered from such coded camera
1076 R. Chang et al. / Robotics and Autonomous Systems 57 (2009) 1075–1082
C7
Ci
C1 C16
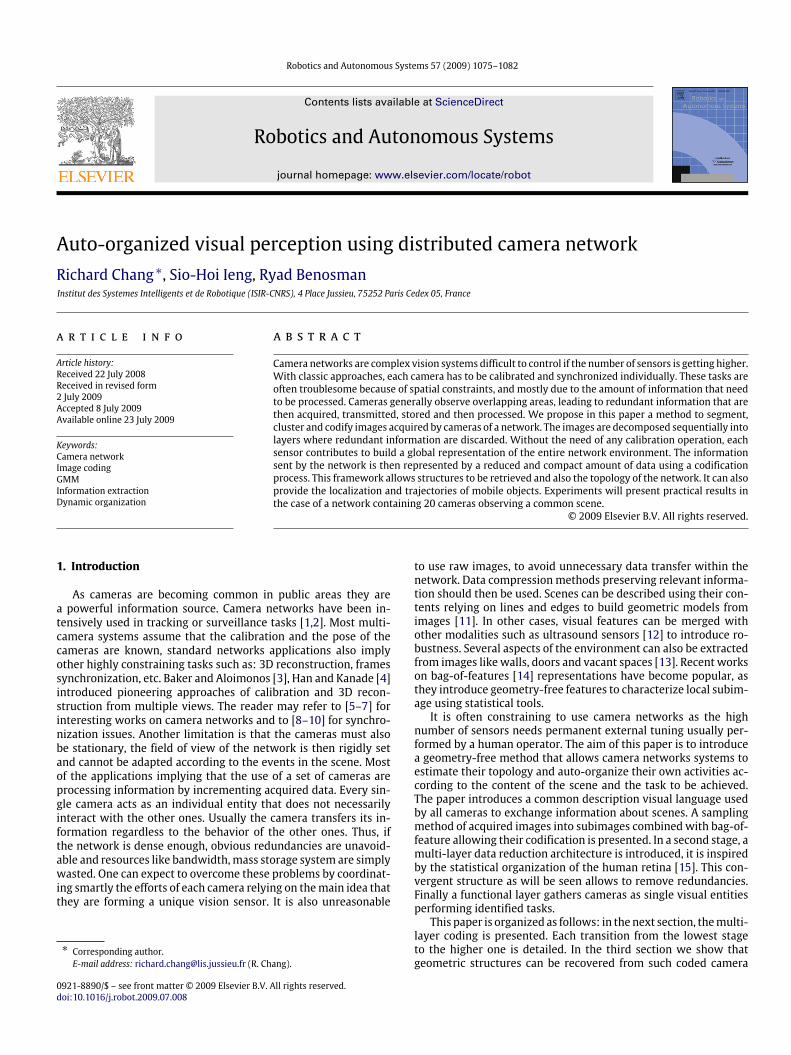
Fig. 1. Planar representation of the cameras’ location in 3D onto a planerepresenting the first layer ν0 .
network: both cameras relative positions and scene object local-ization can be estimated up to some metric properties. In the lastsection, experimentations are tested on real images and results areprovided.
2. Multi-layer image coding
To allow an easier handling of the camera network and thelocation of cameras, a planar topology of the network is introduced.As shown in Fig. 1 the relative position of the cameras arerepresented in a plane ν0 set as the first layer. The multi-layerstructure only need the coarse topology of the camera network(i.e. knowing which cameras are direct neighbors). We assumed inthis section that this topology is known. The layer ν0 deals with aplanar representation of the camera network. Each camera is onlyplaced relatively to its neighbors without any metric position.In what follows ν j is a plane at level j and ν ji will represent its
ith element.
2.1. From acquired images to codified images (ν0 to ν1)
The goal of this section is to sample acquired images intorepresentative patches. Eachpatch aswill be seenwill be comparedto a codebook, and a codified image is produced. It is importantto notice that the codebook is the same for all cameras, allowingfurther comparisons.
2.1.1. Characterizing textureTexture can be measured using different approaches. In what
follows we choose to use a measure similar to [16]. It relies on thecomputation of a histogram of the difference between the value ofpixels of images. Given an image I , each value of its histogram ofdifferences hI is given by:
hI(i) =x6=x′∨y6=y′∑x,y,x′,y′∈I
diff(I, x, y, x′, y′, i), i ∈ [0, 255]
with
diff(I, x, y, x′, y′, i) ={1 if |I(x, y)− I(x′, y′)| = i0 else.
In a second stage, the histogram hI is normalized, to ensure an in-variance according to the size of I .
2.1.2. Generating codebooksLet Fz(I) be a function allowing the decomposition of an image
I into several textured patches:
Fz(I) = {z0, z1, . . . , zn} with I =n⋃i=0
zi.
Let T = {hz0 , hz1 , . . . hzn} be the set containing all texturedescriptors of patches zi of I . The idea is to sample T to reducethe number of descriptors to m ≤ n. We then add to T a metric
(2)
0 hl
(1)
(3)
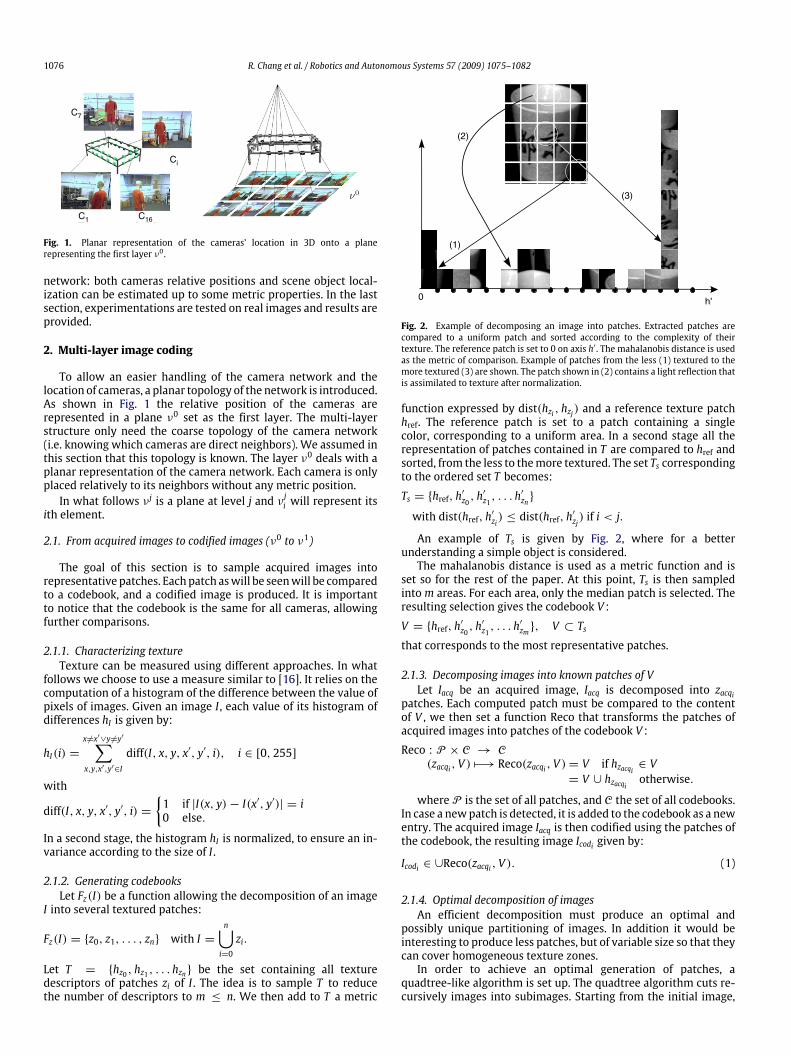
Fig. 2. Example of decomposing an image into patches. Extracted patches arecompared to a uniform patch and sorted according to the complexity of theirtexture. The reference patch is set to 0 on axis h′ . The mahalanobis distance is usedas the metric of comparison. Example of patches from the less (1) textured to themore textured (3) are shown. The patch shown in (2) contains a light reflection thatis assimilated to texture after normalization.
function expressed by dist(hzi , hzj) and a reference texture patchhref. The reference patch is set to a patch containing a singlecolor, corresponding to a uniform area. In a second stage all therepresentation of patches contained in T are compared to href andsorted, from the less to themore textured. The set Ts correspondingto the ordered set T becomes:
Ts = {href, h′z0 , h′
z1 , . . . h′
zn}
with dist(href, h′zi) ≤ dist(href, h′
zj) if i < j.
An example of Ts is given by Fig. 2, where for a betterunderstanding a simple object is considered.The mahalanobis distance is used as a metric function and is
set so for the rest of the paper. At this point, Ts is then sampledintom areas. For each area, only the median patch is selected. Theresulting selection gives the codebook V :
V = {href, h′z0 , h′
z1 , . . . h′
zm}, V ⊂ Tsthat corresponds to the most representative patches.
2.1.3. Decomposing images into known patches of VLet Iacq be an acquired image, Iacq is decomposed into zacqi
patches. Each computed patch must be compared to the contentof V , we then set a function Reco that transforms the patches ofacquired images into patches of the codebook V :
Reco : P × C → C(zacqi , V ) 7−→ Reco(zacqi , V )= V if hzacqi ∈ V
= V ∪ hzacqi otherwise.
whereP is the set of all patches, and C the set of all codebooks.In case a newpatch is detected, it is added to the codebook as a newentry. The acquired image Iacq is then codified using the patches ofthe codebook, the resulting image Icodi given by:
Icodi ∈ ∪Reco(zacqi , V ). (1)
2.1.4. Optimal decomposition of imagesAn efficient decomposition must produce an optimal and
possibly unique partitioning of images. In addition it would beinteresting to produce less patches, but of variable size so that theycan cover homogeneous texture zones.In order to achieve an optimal generation of patches, a
quadtree-like algorithm is set up. The quadtree algorithm cuts re-cursively images into subimages. Starting from the initial image,
R. Chang et al. / Robotics and Autonomous Systems 57 (2009) 1075–1082 1077
Original image
Codified image
Step 2
Step 0 Step 1
Step 3 Step 4
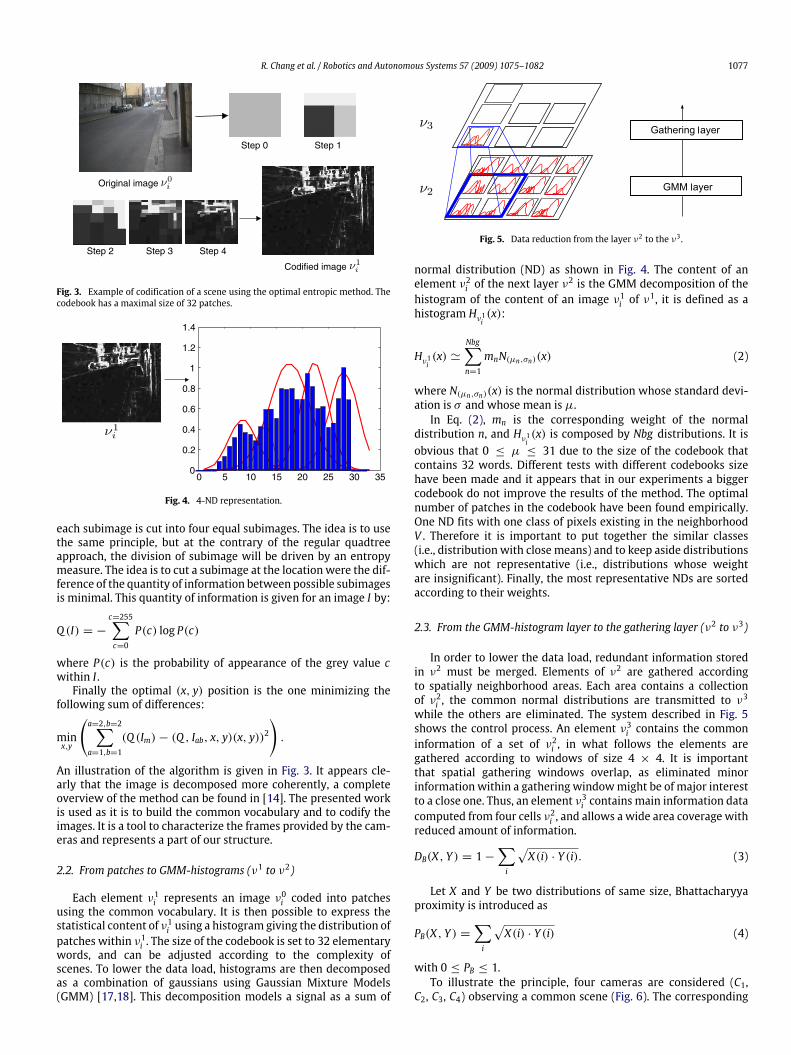
Fig. 3. Example of codification of a scene using the optimal entropic method. Thecodebook has a maximal size of 32 patches.
Fig. 4. 4-ND representation.
each subimage is cut into four equal subimages. The idea is to usethe same principle, but at the contrary of the regular quadtreeapproach, the division of subimage will be driven by an entropymeasure. The idea is to cut a subimage at the location were the dif-ference of the quantity of information between possible subimagesis minimal. This quantity of information is given for an image I by:
Q (I) = −c=255∑c=0
P(c) log P(c)
where P(c) is the probability of appearance of the grey value cwithin I .Finally the optimal (x, y) position is the one minimizing the
following sum of differences:
minx,y
(a=2,b=2∑a=1,b=1
(Q (Im)− (Q , Iab, x, y)(x, y))2).
An illustration of the algorithm is given in Fig. 3. It appears cle-arly that the image is decomposed more coherently, a completeoverview of the method can be found in [14]. The presented workis used as it is to build the common vocabulary and to codify theimages. It is a tool to characterize the frames provided by the cam-eras and represents a part of our structure.
2.2. From patches to GMM-histograms (ν1 to ν2)
Each element ν1i represents an image ν0i coded into patches
using the common vocabulary. It is then possible to express thestatistical content of ν1i using a histogram giving the distribution ofpatches within ν1i . The size of the codebook is set to 32 elementarywords, and can be adjusted according to the complexity ofscenes. To lower the data load, histograms are then decomposedas a combination of gaussians using Gaussian Mixture Models(GMM) [17,18]. This decomposition models a signal as a sum of
Fig. 5. Data reduction from the layer ν2 to the ν3 .
normal distribution (ND) as shown in Fig. 4. The content of anelement ν2i of the next layer ν
2 is the GMM decomposition of thehistogram of the content of an image ν1i of ν
1, it is defined as ahistogram Hν1i (x):
Hν1i (x) 'Nbg∑n=1
mnN(µn,σn)(x) (2)
where N(µn,σn)(x) is the normal distribution whose standard devi-ation is σ and whose mean is µ.In Eq. (2), mn is the corresponding weight of the normal
distribution n, and Hν1i (x) is composed by Nbg distributions. It isobvious that 0 ≤ µ ≤ 31 due to the size of the codebook thatcontains 32 words. Different tests with different codebooks sizehave been made and it appears that in our experiments a biggercodebook do not improve the results of the method. The optimalnumber of patches in the codebook have been found empirically.One ND fits with one class of pixels existing in the neighborhoodV . Therefore it is important to put together the similar classes(i.e., distribution with close means) and to keep aside distributionswhich are not representative (i.e., distributions whose weightare insignificant). Finally, the most representative NDs are sortedaccording to their weights.
2.3. From the GMM-histogram layer to the gathering layer (ν2 to ν3)
In order to lower the data load, redundant information storedin ν2 must be merged. Elements of ν2 are gathered accordingto spatially neighborhood areas. Each area contains a collectionof ν2i , the common normal distributions are transmitted to ν
3
while the others are eliminated. The system described in Fig. 5shows the control process. An element ν3i contains the commoninformation of a set of ν2i , in what follows the elements aregathered according to windows of size 4 × 4. It is importantthat spatial gathering windows overlap, as eliminated minorinformation within a gathering windowmight be of major interestto a close one. Thus, an element ν3i contains main information datacomputed from four cells ν2i , and allows a wide area coverage withreduced amount of information.
DB(X, Y ) = 1−∑i
√X(i) · Y (i). (3)
Let X and Y be two distributions of same size, Bhattacharyyaproximity is introduced as
PB(X, Y ) =∑i
√X(i) · Y (i) (4)
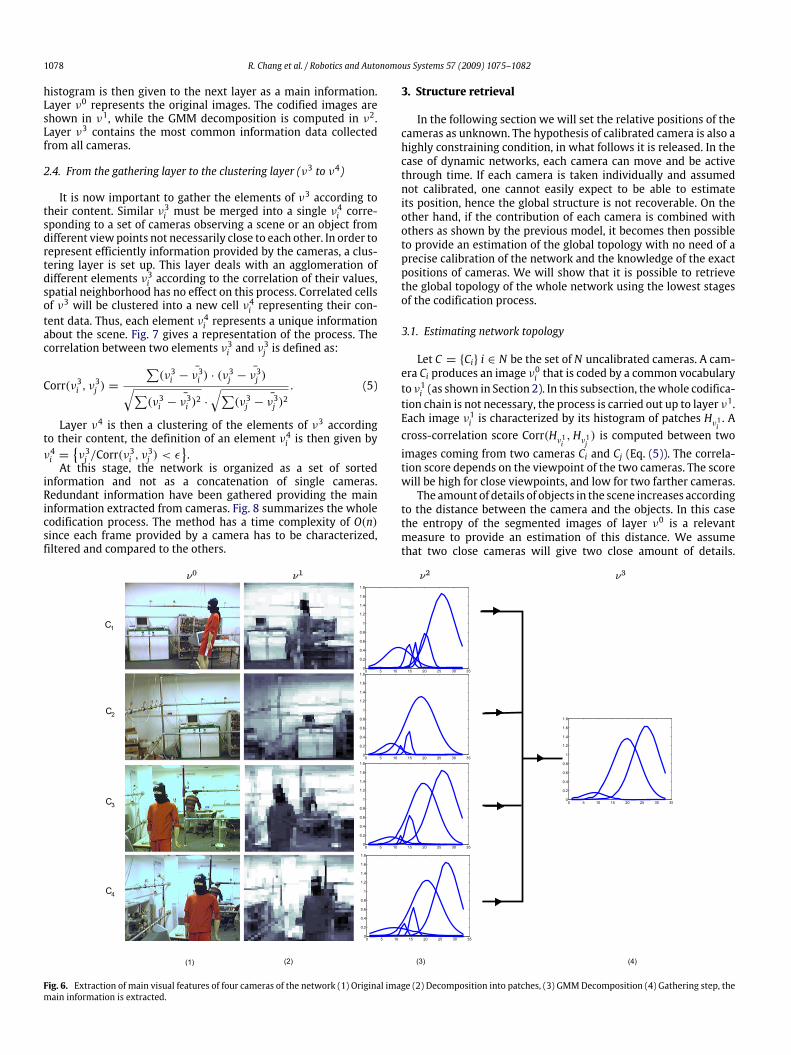
with 0 ≤ PB ≤ 1.To illustrate the principle, four cameras are considered (C1,
C2, C3, C4) observing a common scene (Fig. 6). The corresponding
1078 R. Chang et al. / Robotics and Autonomous Systems 57 (2009) 1075–1082
histogram is then given to the next layer as a main information.Layer ν0 represents the original images. The codified images areshown in ν1, while the GMM decomposition is computed in ν2.Layer ν3 contains the most common information data collectedfrom all cameras.
2.4. From the gathering layer to the clustering layer (ν3 to ν4)
It is now important to gather the elements of ν3 according totheir content. Similar ν3i must be merged into a single ν
4i corre-
sponding to a set of cameras observing a scene or an object fromdifferent viewpoints not necessarily close to each other. In order torepresent efficiently information provided by the cameras, a clus-tering layer is set up. This layer deals with an agglomeration ofdifferent elements ν3i according to the correlation of their values,spatial neighborhood has no effect on this process. Correlated cellsof ν3 will be clustered into a new cell ν4i representing their con-tent data. Thus, each element ν4i represents a unique informationabout the scene. Fig. 7 gives a representation of the process. Thecorrelation between two elements ν3i and ν
3j is defined as:
Corr(ν3i , ν3j ) =
∑(ν3i −
¯ν3i ) · (ν3j −¯ν3j )√∑
(ν3i −¯ν3i )2 ·
√∑(ν3j −
¯ν3j )2. (5)
Layer ν4 is then a clustering of the elements of ν3 accordingto their content, the definition of an element ν4i is then given byν4i =
{ν3j /Corr(ν
3i , ν
3j ) < ε
}.
At this stage, the network is organized as a set of sortedinformation and not as a concatenation of single cameras.Redundant information have been gathered providing the maininformation extracted from cameras. Fig. 8 summarizes the wholecodification process. The method has a time complexity of O(n)since each frame provided by a camera has to be characterized,filtered and compared to the others.
3. Structure retrieval
In the following section we will set the relative positions of thecameras as unknown. The hypothesis of calibrated camera is also ahighly constraining condition, in what follows it is released. In thecase of dynamic networks, each camera can move and be activethrough time. If each camera is taken individually and assumednot calibrated, one cannot easily expect to be able to estimateits position, hence the global structure is not recoverable. On theother hand, if the contribution of each camera is combined withothers as shown by the previous model, it becomes then possibleto provide an estimation of the global topology with no need of aprecise calibration of the network and the knowledge of the exactpositions of cameras. We will show that it is possible to retrievethe global topology of the whole network using the lowest stagesof the codification process.
3.1. Estimating network topology
Let C = {Ci} i ∈ N be the set of N uncalibrated cameras. A cam-era Ci produces an image ν0i that is coded by a common vocabularyto ν1i (as shown in Section 2). In this subsection, thewhole codifica-tion chain is not necessary, the process is carried out up to layer ν1.Each image ν1i is characterized by its histogram of patches Hν1i . Across-correlation score Corr(Hν1i ,Hν1j ) is computed between twoimages coming from two cameras Ci and Cj (Eq. (5)). The correla-tion score depends on the viewpoint of the two cameras. The scorewill be high for close viewpoints, and low for two farther cameras.The amount of details of objects in the scene increases according
to the distance between the camera and the objects. In this casethe entropy of the segmented images of layer ν0 is a relevantmeasure to provide an estimation of this distance. We assumethat two close cameras will give two close amount of details.
Fig. 6. Extraction of main visual features of four cameras of the network (1) Original image (2) Decomposition into patches, (3) GMMDecomposition (4) Gathering step, themain information is extracted.
R. Chang et al. / Robotics and Autonomous Systems 57 (2009) 1075–1082 1079
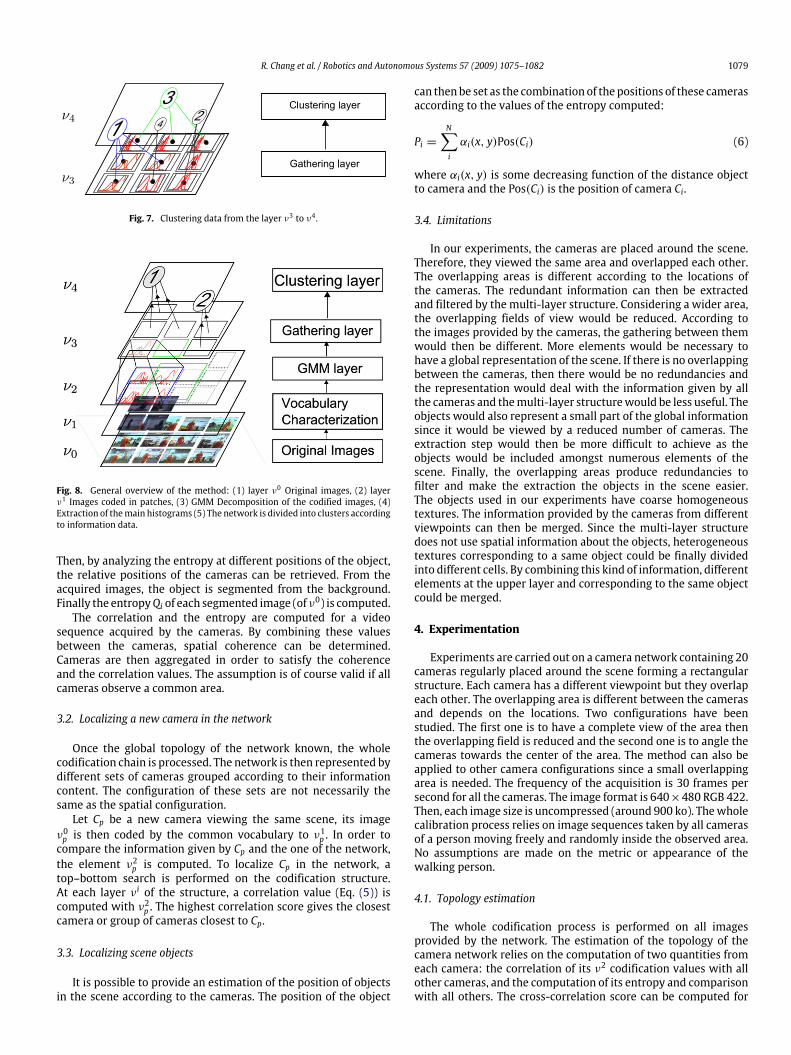
Fig. 7. Clustering data from the layer ν3 to ν4 .
Fig. 8. General overview of the method: (1) layer ν0 Original images, (2) layerν1 Images coded in patches, (3) GMM Decomposition of the codified images, (4)Extraction of themain histograms (5) The network is divided into clusters accordingto information data.
Then, by analyzing the entropy at different positions of the object,the relative positions of the cameras can be retrieved. From theacquired images, the object is segmented from the background.Finally the entropyQi of each segmented image (of ν0) is computed.The correlation and the entropy are computed for a video
sequence acquired by the cameras. By combining these valuesbetween the cameras, spatial coherence can be determined.Cameras are then aggregated in order to satisfy the coherenceand the correlation values. The assumption is of course valid if allcameras observe a common area.
3.2. Localizing a new camera in the network
Once the global topology of the network known, the wholecodification chain is processed. The network is then represented bydifferent sets of cameras grouped according to their informationcontent. The configuration of these sets are not necessarily thesame as the spatial configuration.Let Cp be a new camera viewing the same scene, its image
ν0p is then coded by the common vocabulary to ν1p . In order to
compare the information given by Cp and the one of the network,the element ν2p is computed. To localize Cp in the network, atop–bottom search is performed on the codification structure.At each layer ν i of the structure, a correlation value (Eq. (5)) iscomputed with ν2p . The highest correlation score gives the closestcamera or group of cameras closest to Cp.
3.3. Localizing scene objects
It is possible to provide an estimation of the position of objectsin the scene according to the cameras. The position of the object
can thenbe set as the combination of the positions of these camerasaccording to the values of the entropy computed:
Pi =N∑i
αi(x, y)Pos(Ci) (6)
where αi(x, y) is some decreasing function of the distance objectto camera and the Pos(Ci) is the position of camera Ci.
3.4. Limitations
In our experiments, the cameras are placed around the scene.Therefore, they viewed the same area and overlapped each other.The overlapping areas is different according to the locations ofthe cameras. The redundant information can then be extractedand filtered by the multi-layer structure. Considering a wider area,the overlapping fields of view would be reduced. According tothe images provided by the cameras, the gathering between themwould then be different. More elements would be necessary tohave a global representation of the scene. If there is no overlappingbetween the cameras, then there would be no redundancies andthe representation would deal with the information given by allthe cameras and themulti-layer structurewould be less useful. Theobjects would also represent a small part of the global informationsince it would be viewed by a reduced number of cameras. Theextraction step would then be more difficult to achieve as theobjects would be included amongst numerous elements of thescene. Finally, the overlapping areas produce redundancies tofilter and make the extraction the objects in the scene easier.The objects used in our experiments have coarse homogeneoustextures. The information provided by the cameras from differentviewpoints can then be merged. Since the multi-layer structuredoes not use spatial information about the objects, heterogeneoustextures corresponding to a same object could be finally dividedinto different cells. By combining this kind of information, differentelements at the upper layer and corresponding to the same objectcould be merged.
4. Experimentation
Experiments are carried out on a camera network containing 20cameras regularly placed around the scene forming a rectangularstructure. Each camera has a different viewpoint but they overlapeach other. The overlapping area is different between the camerasand depends on the locations. Two configurations have beenstudied. The first one is to have a complete view of the area thenthe overlapping field is reduced and the second one is to angle thecameras towards the center of the area. The method can also beapplied to other camera configurations since a small overlappingarea is needed. The frequency of the acquisition is 30 frames persecond for all the cameras. The image format is 640×480 RGB 422.Then, each image size is uncompressed (around 900 ko). Thewholecalibration process relies on image sequences taken by all camerasof a person moving freely and randomly inside the observed area.No assumptions are made on the metric or appearance of thewalking person.
4.1. Topology estimation
The whole codification process is performed on all imagesprovided by the network. The estimation of the topology of thecamera network relies on the computation of two quantities fromeach camera: the correlation of its ν2 codification values with allother cameras, and the computation of its entropy and comparisonwith all others. The cross-correlation score can be computed for
1080 R. Chang et al. / Robotics and Autonomous Systems 57 (2009) 1075–1082
a b
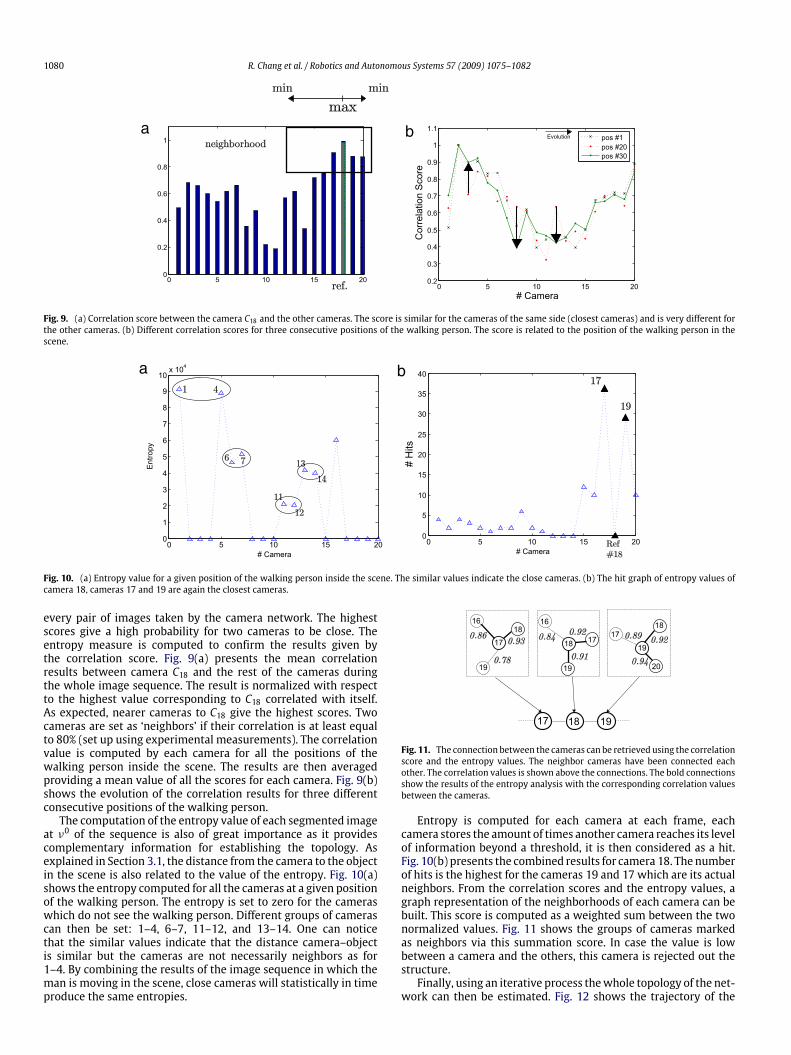
Fig. 9. (a) Correlation score between the camera C18 and the other cameras. The score is similar for the cameras of the same side (closest cameras) and is very different forthe other cameras. (b) Different correlation scores for three consecutive positions of the walking person. The score is related to the position of the walking person in thescene.
a b
Fig. 10. (a) Entropy value for a given position of the walking person inside the scene. The similar values indicate the close cameras. (b) The hit graph of entropy values ofcamera 18, cameras 17 and 19 are again the closest cameras.
every pair of images taken by the camera network. The highestscores give a high probability for two cameras to be close. Theentropy measure is computed to confirm the results given bythe correlation score. Fig. 9(a) presents the mean correlationresults between camera C18 and the rest of the cameras duringthe whole image sequence. The result is normalized with respectto the highest value corresponding to C18 correlated with itself.As expected, nearer cameras to C18 give the highest scores. Twocameras are set as ‘neighbors’ if their correlation is at least equalto 80% (set up using experimental measurements). The correlationvalue is computed by each camera for all the positions of thewalking person inside the scene. The results are then averagedproviding a mean value of all the scores for each camera. Fig. 9(b)shows the evolution of the correlation results for three differentconsecutive positions of the walking person.The computation of the entropy value of each segmented image
at ν0 of the sequence is also of great importance as it providescomplementary information for establishing the topology. Asexplained in Section 3.1, the distance from the camera to the objectin the scene is also related to the value of the entropy. Fig. 10(a)shows the entropy computed for all the cameras at a given positionof the walking person. The entropy is set to zero for the cameraswhich do not see the walking person. Different groups of camerascan then be set: 1–4, 6–7, 11–12, and 13–14. One can noticethat the similar values indicate that the distance camera–objectis similar but the cameras are not necessarily neighbors as for1–4. By combining the results of the image sequence in which theman is moving in the scene, close cameras will statistically in timeproduce the same entropies.
Fig. 11. The connection between the cameras can be retrieved using the correlationscore and the entropy values. The neighbor cameras have been connected eachother. The correlation values is shown above the connections. The bold connectionsshow the results of the entropy analysis with the corresponding correlation valuesbetween the cameras.
Entropy is computed for each camera at each frame, eachcamera stores the amount of times another camera reaches its levelof information beyond a threshold, it is then considered as a hit.Fig. 10(b) presents the combined results for camera 18. Thenumberof hits is the highest for the cameras 19 and 17 which are its actualneighbors. From the correlation scores and the entropy values, agraph representation of the neighborhoods of each camera can bebuilt. This score is computed as a weighted sum between the twonormalized values. Fig. 11 shows the groups of cameras markedas neighbors via this summation score. In case the value is lowbetween a camera and the others, this camera is rejected out thestructure.Finally, using an iterative process thewhole topology of the net-
work can then be estimated. Fig. 12 shows the trajectory of the
R. Chang et al. / Robotics and Autonomous Systems 57 (2009) 1075–1082 1081
0.88
0.93
0.87
0.95
0.90
0.88
0.86
0.72 0.89 0.66
0.82
0.90
0.95
0.97
0.92
0.96
0.84 0.91 0.85 0.83
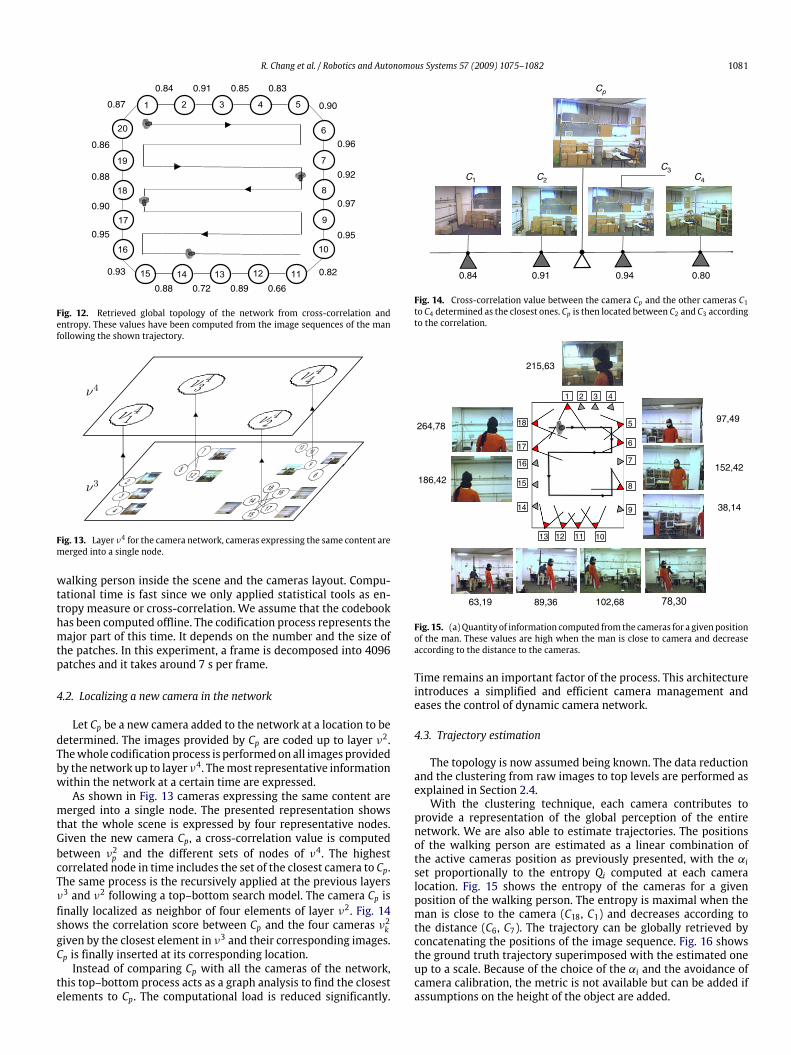
Fig. 12. Retrieved global topology of the network from cross-correlation andentropy. These values have been computed from the image sequences of the manfollowing the shown trajectory.
Fig. 13. Layer ν4 for the camera network, cameras expressing the same content aremerged into a single node.
walking person inside the scene and the cameras layout. Compu-tational time is fast since we only applied statistical tools as en-tropy measure or cross-correlation. We assume that the codebookhas been computed offline. The codification process represents themajor part of this time. It depends on the number and the size ofthe patches. In this experiment, a frame is decomposed into 4096patches and it takes around 7 s per frame.
4.2. Localizing a new camera in the network
Let Cp be a new camera added to the network at a location to bedetermined. The images provided by Cp are coded up to layer ν2.Thewhole codification process is performedon all images providedby the network up to layer ν4. Themost representative informationwithin the network at a certain time are expressed.As shown in Fig. 13 cameras expressing the same content are
merged into a single node. The presented representation showsthat the whole scene is expressed by four representative nodes.Given the new camera Cp, a cross-correlation value is computedbetween ν2p and the different sets of nodes of ν
4. The highestcorrelated node in time includes the set of the closest camera to Cp.The same process is the recursively applied at the previous layersν3 and ν2 following a top–bottom search model. The camera Cp isfinally localized as neighbor of four elements of layer ν2. Fig. 14shows the correlation score between Cp and the four cameras ν2kgiven by the closest element in ν3 and their corresponding images.Cp is finally inserted at its corresponding location.Instead of comparing Cp with all the cameras of the network,
this top–bottom process acts as a graph analysis to find the closestelements to Cp. The computational load is reduced significantly.
0.84
C1 C2 C4
C3
Cp
0.91 0.94 0.80
Fig. 14. Cross-correlation value between the camera Cp and the other cameras C1to C4 determined as the closest ones. Cp is then located between C2 and C3 accordingto the correlation.
1 2 3 4
5
6
7
8
9
10111213
14
15
16
17
18
215,63
97,49
152,42
38,14
78,30102,6889,3663,19
186,42
264,78
Fig. 15. (a) Quantity of information computed from the cameras for a givenpositionof the man. These values are high when the man is close to camera and decreaseaccording to the distance to the cameras.
Time remains an important factor of the process. This architectureintroduces a simplified and efficient camera management andeases the control of dynamic camera network.
4.3. Trajectory estimation
The topology is now assumed being known. The data reductionand the clustering from raw images to top levels are performed asexplained in Section 2.4.With the clustering technique, each camera contributes to
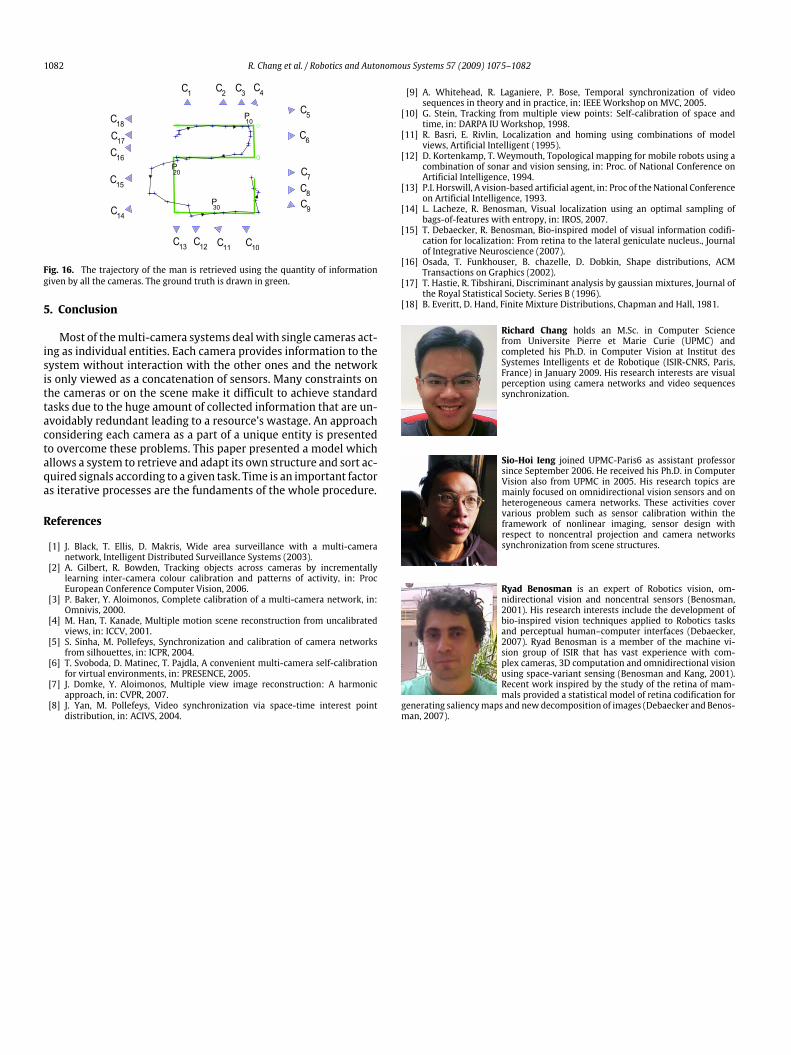
provide a representation of the global perception of the entirenetwork. We are also able to estimate trajectories. The positionsof the walking person are estimated as a linear combination ofthe active cameras position as previously presented, with the αiset proportionally to the entropy Qi computed at each cameralocation. Fig. 15 shows the entropy of the cameras for a givenposition of the walking person. The entropy is maximal when theman is close to the camera (C18, C1) and decreases according tothe distance (C6, C7). The trajectory can be globally retrieved byconcatenating the positions of the image sequence. Fig. 16 showsthe ground truth trajectory superimposed with the estimated oneup to a scale. Because of the choice of the αi and the avoidance ofcamera calibration, the metric is not available but can be added ifassumptions on the height of the object are added.
1082 R. Chang et al. / Robotics and Autonomous Systems 57 (2009) 1075–1082
Fig. 16. The trajectory of the man is retrieved using the quantity of informationgiven by all the cameras. The ground truth is drawn in green.
5. Conclusion
Most of themulti-camera systems dealwith single cameras act-ing as individual entities. Each camera provides information to thesystem without interaction with the other ones and the networkis only viewed as a concatenation of sensors. Many constraints onthe cameras or on the scene make it difficult to achieve standardtasks due to the huge amount of collected information that are un-avoidably redundant leading to a resource’s wastage. An approachconsidering each camera as a part of a unique entity is presentedto overcome these problems. This paper presented a model whichallows a system to retrieve and adapt its own structure and sort ac-quired signals according to a given task. Time is an important factoras iterative processes are the fundaments of the whole procedure.
References
[1] J. Black, T. Ellis, D. Makris, Wide area surveillance with a multi-cameranetwork, Intelligent Distributed Surveillance Systems (2003).
[2] A. Gilbert, R. Bowden, Tracking objects across cameras by incrementallylearning inter-camera colour calibration and patterns of activity, in: ProcEuropean Conference Computer Vision, 2006.
[3] P. Baker, Y. Aloimonos, Complete calibration of a multi-camera network, in:Omnivis, 2000.
[4] M. Han, T. Kanade, Multiple motion scene reconstruction from uncalibratedviews, in: ICCV, 2001.
[5] S. Sinha, M. Pollefeys, Synchronization and calibration of camera networksfrom silhouettes, in: ICPR, 2004.
[6] T. Svoboda, D. Matinec, T. Pajdla, A convenient multi-camera self-calibrationfor virtual environments, in: PRESENCE, 2005.
[7] J. Domke, Y. Aloimonos, Multiple view image reconstruction: A harmonicapproach, in: CVPR, 2007.
[8] J. Yan, M. Pollefeys, Video synchronization via space-time interest pointdistribution, in: ACIVS, 2004.
[9] A. Whitehead, R. Laganiere, P. Bose, Temporal synchronization of videosequences in theory and in practice, in: IEEE Workshop on MVC, 2005.
[10] G. Stein, Tracking from multiple view points: Self-calibration of space andtime, in: DARPA IU Workshop, 1998.
[11] R. Basri, E. Rivlin, Localization and homing using combinations of modelviews, Artificial Intelligent (1995).
[12] D. Kortenkamp, T. Weymouth, Topological mapping for mobile robots using acombination of sonar and vision sensing, in: Proc. of National Conference onArtificial Intelligence, 1994.
[13] P.I. Horswill, A vision-based artificial agent, in: Proc of theNational Conferenceon Artificial Intelligence, 1993.
[14] L. Lacheze, R. Benosman, Visual localization using an optimal sampling ofbags-of-features with entropy, in: IROS, 2007.
[15] T. Debaecker, R. Benosman, Bio-inspired model of visual information codifi-cation for localization: From retina to the lateral geniculate nucleus., Journalof Integrative Neuroscience (2007).
[16] Osada, T. Funkhouser, B. chazelle, D. Dobkin, Shape distributions, ACMTransactions on Graphics (2002).
[17] T. Hastie, R. Tibshirani, Discriminant analysis by gaussian mixtures, Journal ofthe Royal Statistical Society. Series B (1996).
[18] B. Everitt, D. Hand, Finite Mixture Distributions, Chapman and Hall, 1981.
Richard Chang holds an M.Sc. in Computer Sciencefrom Universite Pierre et Marie Curie (UPMC) andcompleted his Ph.D. in Computer Vision at Institut desSystemes Intelligents et de Robotique (ISIR-CNRS, Paris,France) in January 2009. His research interests are visualperception using camera networks and video sequencessynchronization.
Sio-Hoi Ieng joined UPMC-Paris6 as assistant professorsince September 2006. He received his Ph.D. in ComputerVision also from UPMC in 2005. His research topics aremainly focused on omnidirectional vision sensors and onheterogeneous camera networks. These activities covervarious problem such as sensor calibration within theframework of nonlinear imaging, sensor design withrespect to noncentral projection and camera networkssynchronization from scene structures.
Ryad Benosman is an expert of Robotics vision, om-nidirectional vision and noncentral sensors (Benosman,2001). His research interests include the development ofbio-inspired vision techniques applied to Robotics tasksand perceptual human–computer interfaces (Debaecker,2007). Ryad Benosman is a member of the machine vi-sion group of ISIR that has vast experience with com-plex cameras, 3D computation and omnidirectional visionusing space-variant sensing (Benosman and Kang, 2001).Recent work inspired by the study of the retina of mam-mals provided a statistical model of retina codification for
generating saliencymaps and newdecomposition of images (Debaecker and Benos-man, 2007).