author's personal copy - university of washington
TRANSCRIPT
This article appeared in a journal published by Elsevier. The attachedcopy is furnished to the author for internal non-commercial researchand education use, including for instruction at the authors institution
and sharing with colleagues.
Other uses, including reproduction and distribution, or selling orlicensing copies, or posting to personal, institutional or third party
websites are prohibited.
In most cases authors are permitted to post their version of thearticle (e.g. in Word or Tex form) to their personal website orinstitutional repository. Authors requiring further information
regarding Elsevier’s archiving and manuscript policies areencouraged to visit:
http://www.elsevier.com/copyright
Author's personal copy
Immigration and the American industrial revolution from 1880 to 1920 q
Charles Hirschman a,*, Elizabeth Mogford b
a Department of Sociology and Center for Studies in Demography and Ecology, University of Washington, Seattle, WA 98195-3340, USAb Department of Sociology, Western Washington University, Bellingham, WA 98225-9081, USA
a r t i c l e i n f o
Article history:Available online 8 April 2009
Keywords:ImmigrationIndustrializationManufacturingMigration
a b s t r a c t
In this study, we measure the contribution of immigrants and their descendents to thegrowth and industrial transformation of the American workforce in the age of mass immi-gration from 1880 to 1920. The size and selectivity of the immigrant community, as well astheir disproportionate residence in large cities, meant they were the mainstay of the Amer-ican industrial workforce. Immigrants and their children comprised over half of manufac-turing workers in 1920, and if the third generation (the grandchildren of immigrants) areincluded, then more than two-thirds of workers in the manufacturing sector were of recentimmigrant stock. Although higher wages and better working conditions might haveencouraged more long-resident native-born workers to the industrial economy, the scaleand pace of the American industrial revolution might well have slowed. The closing ofthe door to mass immigration in the 1920s did lead to increased recruitment of native bornworkers, particularly from the South, to northern industrial cities in the middle decades ofthe 20th century.
� 2009 Elsevier Inc. All rights reserved.
1. Introduction
Within the span of a few decades from the late 19th to the early 20th century, the United States was transformed from apredominately rural agrarian society to an industrial economy centered in large metropolitan cities. Prior to the Americanindustrial revolution, most Americans were reared in largely isolated agricultural households and small towns that werelinked to the external world by horse drawn wagons (Olmstead and Rhode, 2000: 711). Except for towns that were con-nected to railroads or water borne shipping, isolation and the costs of overland transportation meant that many rural com-munities were largely self sufficient in food, clothing, and many other essentials of everyday life. This changed dramaticallyin the early decades of the 20th century, as the supply and lowered costs of manufactured goods created a consumer revo-lution for both urban and rural households. Many of these goods, which did not even exist a few decades earlier, were man-ufactured, marketed, and transported through a rapidly expanding national network of rail lines and highways. By 1920, onehalf of northern farms had automobiles and telephones (Olmstead and Rhode, 2000: 712–713).
Theses changes were the direct result of the American industrial revolution that was founded on rising investment,employment, and productivity in the manufacturing sector. In 1880, when the agricultural frontier had largely disappeared,almost one-half of the American workers were still farmers and only one in seven workers (less than 15%) worked in
0049-089X/$ - see front matter � 2009 Elsevier Inc. All rights reserved.doi:10.1016/j.ssresearch.2009.04.001
q Earlier versions of this paper were presented at the 2006 annual meetings of the Population Association of America and at colloquia at the Department ofSociology, University of British Columbia, the Center for Studies in Demography and Ecology, University of Washington, and the Minnesota PopulationCenter at the University of Minnesota. The authors are deeply indebted to Patty Glynn for her statistical advice and assistance and to Brian Gatton, AveryGuest, Matthew Sobek, Stewart Tolnay, and the anonymous reviewers for their detailed criticisms and comments of earlier visions of this paper. Allremaining errors are the responsibility of authors.
* Corresponding author.E-mail addresses: [email protected] (C. Hirschman), [email protected] (E. Mogford).
Social Science Research 38 (2009) 897–920
Contents lists available at ScienceDirect
Social Science Research
journal homepage: www.elsevier .com/locate /ssresearch
Author's personal copy
manufacturing of any sort. The industrial sector, as late as 1870, consisted primarily of small firms and workshops that reliedon artisan technology to produce tools, furniture, building materials, and other goods for local markets (Abramovitz and Da-vid, 2000: 45). Many small industries, such as grain mills and sawmills, were often located in rural areas close to flowingrivers in order to power machinery. Following the technological revolutions of the early industrial age, workshops and smallfoundries were supplemented by large factories engaged in mass production. The development of commercial electricity atthe end of the 19th century allowed industries to take advantage of the labor supply in large cities. The scale of change isillustrated by the rise in the share of manufacturing horsepower generated by electrical motors from 23% in 1909 to 77%in 1929 (Goldin and Katz, 1998: 712).
Enormous gains in industrial productivity, accompanied by institutional change and much lower transportation costs,created national markets with goods and people moving in every direction. Perhaps the most consequential change of theAmerican industrial revolution was the increasing urbanization of society and the shift of labor from farms to factoriesand offices (Guest 2005). In 1880, workers in agriculture outnumbered industrial workers three to one, but by 1920, thenumbers were approximately equal. Employment in the manufacturing sector expanded four-fold from 2.5 to 10 millionworkers from 1880 to 1920.1
The decades surrounding 1900 were not only the age of industrialization in the United States, but were also the age ofurbanization and immigration. The 1880s were the first decade in American history, with the exception of the Civil War dec-ade, when the urban population increased more than the rural population (in absolute numbers). From 1880 to 1920, pop-ulation growth was concentrated in cities—the urban fraction expanded from a little more than one quarter of the nationalpopulation to more than one half (Carter et al. 2006: 1-105).
The pace of rural to urban migration of the native born picked up during this era, but domestic urbanward migrants weredwarfed by the flood of immigrants coming to cities. From 1880 to 1920, the number of foreign born increased from almost 7million to a little under 14 million (Gibson and Jung, 2006: 26). These figures, however, underestimate the economic anddemographic contribution of immigration (Kuznets, 1971b). Immigrants inevitably lead to a second generation—the childrenof immigrants—whose social, cultural, and economic characteristics are heavily influenced by their origins. Counting the 23million children of immigrants2, in addition to the 14 million immigrants, means that over one-third of the 105 million Amer-icans in the 1920 population belonged to the ‘‘immigrant community,” defined as inclusive of the first and second generations.
1.1. Immigration, urbanization, and industrialization
Immigrants, as well as manufacturing enterprises, were concentrated in the rapidly growing cities of the Northeast andMidwest during the age of industrialization (Gibson and Jung, 2006: 72). In 1900, about three-quarters of the populations ofmany large cities were composed of immigrants and their children, including New York, Chicago, Boston, Cleveland, SanFrancisco, Buffalo, Milwaukee, and Detroit (Carpenter, 1927: 27). Immigration and industrialization were correlated, bothspatially and temporally in American history (Taeuber and Taeuber, 1971: 117), but is there a causal impact? Addressing thisquestion, the objective of this analysis, requires consideration of the counterfactual of what would have been the course ofthe industrialization process in the United States if there had not been an immigrant workforce.
The most commonly cited reasons for the rapid American industrial revolution are the abundance of mineral resources,technological innovation, the evolution of the American system of manufacturing, railroads and lowered costs of transpor-tation, education and human resources, and the rise of the managerial firm (Abramovitz and David, 2000; Chandler, 1977;Denison, 1974; Hounshell, 1984; Wright, 1990). Among the studies that address the relationship between immigration andindustrialization, few go beyond a general or abstract discussion. In a classic survey of the literature on the American indus-trial revolution in the Cambridge Economic History of the United States, the role of immigration is summarized in a single par-agraph, which simply notes the overrepresentation of immigrants in the manufacturing labor force (Engerman and Sokoloff,2000: 387). There are some studies that conclude that the flood of immigration in the late 19th and early 20th centuries hadan adverse impact on the per-capita economic growth, the wages of native workers, and diverted domestic migration awayfrom industrializing cities (Hatton and Williamson, 1998: Chapter 8; Goldin, 1994). However, other researchers have ques-tioned these conclusions and suggested that immigrants had a generally positive impact on the American economy and facil-itated the economic mobility of native born workers during the age of industrialization (Carter and Sutch, 1999; Haines,2000: 202; Muller, 1993: 83-85; Thomas, 1973: 174).
1.2. Research objectives
In this study, we address two specific empirical questions, namely: ‘‘What was the role of immigration on changes in theindustrial structure of the American economy from 1880 to 1920?”, and ‘‘How much did immigrants and their descendents(children and grandchildren) contribute to the manufacturing sector in 1920?” The findings reported here show that recentimmigrants and their descendents were the primary workforce in the rapidly expanding manufacturing economy of the early
1 Industrial production experienced an almost five-fold expansion of value added in manufacturing and mining from 1880 to 1915 (Davis 2006: 3-23-24 and3-25). Manufacturing’s share of value added in commodity production rose more rapidly from 1879 to 1894 than in any other period of the 19th century (Fogel1964: 121).
2 The children of immigrants includes native born persons who have at least one foreign born parent.
898 C. Hirschman, E. Mogford / Social Science Research 38 (2009) 897–920

Author's personal copy
20th century. Demographic and economic pressures on agricultural households in the late 19th and early 20th centurypushed an increasing share of the children of farmers off the land, but only a minority were willing to join ‘‘the pool of east-ern industrial and commercial labor” (Atack et al., 2000: 322). When immigrant labor was cutoff in the 1920s, the nativepoor population, especially poor whites and blacks from the South, began migrating to northern industrial cities in muchlarger numbers. But in the early 20th century, when manufacturing jobs were dirty, dangerous, and heavily regimented,immigrant workers were the mainstay of industrial employment.
Native born of native parentage (NBNP) Americans continued to be over-represented in the agricultural sector in the early20th century, but they were also well represented in many of the better jobs in the public and business sectors that were alsoexpanding rapidly with the industrial economy. The managerial elite during the age of industrialization were almost exclu-sively native born whites (Zunz, 1982: 2).
2. How might immigration affect industrialization
There is a long list of potential factors—variables or conditions—that might have caused the American industrial revolu-tion, including the discovery or adoption of new technologies, the availability and mobility of capital, the expansion of mar-kets as a result of new transportation systems, added demand from a growing population and the expansion of trade,increasing entrepreneurship, stable political and institutional systems that foster cheaper credit and the enforcement of con-tracts, improvements in human capital and meritocratic social mobility of talent, the increasing division of labor in produc-tion, and the specialization of enterprises (see Engerman and Gallman, 2000, especially volume 2). This list, which is neitherexhaustive nor mutually exclusive, does not specify which factors are exogenous nor does it address the question of whichfactors are absolutely necessary and which may simply facilitate economic growth and industrialization.
Without a comparative analysis across countries or regions, it is impossible to test which factors were necessary or suf-ficient conditions to cause industrialization. Such studies are not always definitive, however, because labor, capital, andother resources can flow across regions and countries. The analytical strategy adopted here is of a detailed case study ofone country, the United States, with a primary focus on measuring the increasing share of immigrants and their descendentsin the mobilization of labor during the American industrial revolution from 1880 to 1920. The counterfactual, namelywhether the domestic labor supply would have been sufficient for rapid industrial development in the absence of immigra-tion, cannot be directly observed. Our strategy, which draws on theory and prior research in addition to empirical analysis,cannot fully adjudicate between competing explanations. Our conclusion about the centrality of immigrant labor is based onthe fact that recent immigrants and their descendents were not just the majority of industrial workers, but the overwhelm-ing majority of workers in the emerging manufacturing sector in early 20th century America.
2.1. Economic theory
Labor is an indispensable source of economic production, and all other things being equal, more labor contributes to moreeconomic production. The magnitude of the impact of immigration on economic growth and welfare depends on the avail-ability of physical capital, the human capital of immigrants and natives, and assumptions about economies of scale (Fried-berg and Hunt, 1995: 39–42; Smith and Edmonston, 1997: chapter 4). Although there was neither a slackening of economicgrowth nor a slowdown in the trend of rising wages of native born workers during the age of mass immigration in the late19th and early 20th century (Carter and Sutch, 1999: 314–344; Rees 1961), Hatton and Williamson (1998: chapter 8) arguedthat wages would have grown even faster in the absence of immigration. Differences in the interpretation (or speculation) ofthe economic impact of immigration are typically based on assumptions of possible effects rather than on measured differ-ences. There is a wide range of mechanisms through which immigrants may affect labor markets and the economy, moregenerally.
One of the most fundamental effects of immigration is an increase in the number of workers relative to dependents in thepopulation. Immigrants are generally concentrated in the younger working ages. Carter and Sutch (1999: 326) observe thatwell over 70% of immigrants to the United States during the peak years of the age of mass immigration (1907– 1910) werebetween age 18 and 40. Even within the working-age population, immigrants are more likely to participate in the labor forcethan the native born population. The age selectivity of immigrants reduces the costs of social reproduction for a given pop-ulation size in the receiving society. Although the costs of support for the dependent population of children and the elderlyare generally borne privately by families, there are also public subsidies for education and health care. The costs of rearingand educating persons who immigrate as young adults have been borne by their foreign-resident families and their countriesof origin, and might be considered a transfer payment to the taxpayers of the receiving society.3
In an ingenious analysis of the potential impact of the differing age composition of immigrants and the native born pop-ulations, Neal and Uselding (1972) estimate the savings received by the United States through immigration from 1790 to1913 relative to the costs that would have been incurred if all immigrants were replaced by children of the native born
3 ‘‘Considering the magnitude and duration of this movement, it is difficult to exaggerate its importance as a factor in the economic growth of the UnitedStates. Since immigration brought in a large labor force, the cost of whose rearing and training was borne elsewhere, it clearly represented an enormous capitalinvestment that dwarfed any capital inflows of the more orthodox type—a conclusion that stands with any reasonable estimate we can make of the moneyvalue of labor.” (Kuznets 1971a: 357).
C. Hirschman, E. Mogford / Social Science Research 38 (2009) 897–920 899

Author's personal copy
population (this counterfactual is posed by the ‘‘Walker hypothesis” that posits that native born fertility was depressed bythe arrival of immigrants). Assuming these savings had been invested (not consumed by social reproduction), Neal andUselding (1972: 87) conclude that immigration had contributed from 13 to 42 percent of the capital stock of the UnitedStates by 1912. Several analysts have noted that the large number of immigrants in the North in the 1860s provided themanpower surplus that allowed the Union to triumph in the Civil War (Gallman, 1977: 31, Muller, 1993: 78–79).
2.2. Empirical studies
In their study of the impact of immigration on American industrialization and native born workers, Hatton and William-son (1998: chapter 8) asked whether immigrants accelerated industrialization by solving labor bottlenecks by entering high-wage high-growth occupations faster than native born workers (Hatton and Williamson, 1998: 161–164). Based on theirfindings that immigrants were more likely to be found in less skilled occupations and in slower growth occupations from1890 to 1900, Hatton and Williamson conclude that immigration did not contribute to economic development and rapidindustrialization. However, other analysts report that immigrants were no less skilled than native born workers (Schachter,1972). The real question, in our judgment, is not the skill level of immigrants, but their role in filling the demand for labor inmanufacturing and other key sectors of emerging industrial economy. The central element of the industrial revolution ismost appropriately measured by shifts across industrial sectors – the rise of manufacturing, in particular.
The other problem with Hatton and Williamson’s account is their focus on relative growth as the index of labor demand.Starting from a small base (or zero), new industries may experience extraordinarily rapid relative growth, but the absolutenumber of added workers may be relatively small. For example, the telephone industry grew over 80 times faster than theworkforce as a whole from 1880 to 1920, but the total growth was only a quarter of a million workers. On the other hand, themanufacturing sector grew much less rapidly—only about 2.4 times as fast as the work force as a whole, but added about 7.5million workers. Are immigrant workers in manufacturing not to be considered part of the ‘‘shock troops of structuralchange” (Hatton and Williamson 1998: 161) simply because of their relative share in the growth in selected high demandoccupations? The contribution of immigrants might be evaluated differently if the absolute numbers of workers in expand-ing industries were counted. In this analysis, we consider the contribution of immigrants to absolute and relative changes inthe industrial structure.
One of the most important theoretical claims about the positive impact of immigration on industrialization centers on thecreation of economies of scales—both in the production of and the demand for industrial goods (Abramovitz and David,2000: 12; Carter and Sutch, 1999: 331–332; Romer, 1996). The creation of economies of scale was possible only with thegrowth of cities and urban industries. Before the age of industrialization, per-capita productivity was rarely increased byhaving large numbers of workers concentrated in one location (Ward, 1971: 90). Artisan labor in most industries, such asgrain milling, iron working, and leather goods, did not rely on a complex division of labor. Overall, there were few advantagesof locating a factory in large cities. The important considerations for site location were access to sources of raw materials,nearby flowing water, and transportation. There is some evidence that some ‘‘non-mechanized” factories in the mid 19thcentury were more productive than artisan shops, but these factories were distinctive in employing women and children(e.g. textiles), and economies of scale were only significant for factories with about 20 or fewer employees (Engermanand Sokoloff, 2000: 375).
With electricity to power machinery, it became possible to redesign the organization of factories to create an integratedflow of work (assembly lines) to take advantage of a larger number of workers in one location. Larger factories were locatedin cities where labor was more plentiful. And cities were disproportionately the home of immigrants. Even in 1850, whenonly 15% of the American population lived in cities, more than one-third of the population of most large American citieswas foreign born. Assuming that second generation immigrants (the children of immigrants) were as numerous as the for-eign born, it seems reasonable to conclude that almost all large American cities were predominantly composed of immi-grants and their children as early as 1850 (Gibson and Jung, 2006: 82).4
In the middle decades of the 19th century, new immigrants were the ready source of labor to unload ships, to build roadsand canals, and to transport goods (Carter, 2006: I-590–591). With the growth of factories and the demand for unskilled la-bor, immigrants, primarily young men in the working years, continued to be the ideal source of labor. Immigrants were gen-erally more willing to accept lower wages and inferior working conditions than native born workers (Zolberg, 2006: 69).Great efficiencies in production led to higher profits that could be reinvested in new technology, which led to even moreproduction and eventually higher wages for workers.
Although, the demand for manufactured goods gradually grew to encompass the entire country, the initial demand wasfrom the urban population. Unlike farm families that were largely self sufficient in food and made most of their clothing,urban families needed to purchase everything in the market. The large and growing urban populations, primarily fueledby immigration throughout the second half of the 19th century and the first two decades of the 20th century, created a hugedemand for the increased production of the emerging industrial sector. Carter and Sutch (1999: 330–331) claim that econ-omies of scale in demand and production also stimulated inventive activity and the diffusion of technological knowledge andinnovation. In his analysis of long swings, or Kuznets cycles, Easterlin (1968) found that immigration (and populationgrowth) and subsequent family formation stimulated economic growth through increasing demand for housing, urban
4 The major exceptions were Charlestown, South Carolina and Washington, DC.
900 C. Hirschman, E. Mogford / Social Science Research 38 (2009) 897–920
Author's personal copy
development, and other amenities. This association was strongest, Easterlin noted, in the century prior to World War II. Inthe post World War II era, the federal government assumed more responsibility for maintaining aggregate demand regard-less of population dynamics.
If capital is fixed, additional immigrant labor would lead to lowered productivity as capital stocks are spread more thinlyand as less capital is invested per worker (capital dilution). However, there is some evidence that capital follows the inter-national movements of labor, especially in labor scarce economies (Hatton and Williamson, 1998: 214–215). In addition tointernational capital flows, immigrants are thought to save a higher proportion of their incomes than native born workers.Much of this savings is remitted to family and kin in their countries of origin, but there is also evidence that immigrants pur-chase homes, open small businesses and invest heavily in the education of their children. These claims suggest that immi-grants contribute to economic growth by increasing the supply of (or attracting) capital as well as the supply of labor.Rosenberg (1972: 32–33) concludes that immigrants to the United States also brought European technology that increasedthe productivity of American industry.
Carter and Sutch (1999: 323) reviewed the historical evidence on the debate over immigration and capital dilution at theturn of the 20th century, with a focus on the claim that immigrants increased the returns to capital (and hence capitalists),but harmed the economic fortunes of native born workers. They conclude that the division between capital and labor wasnot as clear cut as many have assumed. A substantial share of American workers owned capital through home ownership andas operators of farms and small shops. About half of American households in 1905 might have been considered as equityinvestors through their ownership of insurance policies that were self-financed pensions (Ransom and Sutch, 1987 citedin Carter and Sutch, 1999: 323).
3. Data and measurement
The decennial census data analyzed here have been extracted from the IPUMS (Integrated Public Use Microdata Samples)files that have been produced and distributed by researchers at the University of Minnesota (Ruggles et al., 2004). The IPUMSfiles are created by extracting samples of household records and all persons in sampled households from the original man-uscript (microfilm) records. The samples of the IPUMS census files are sufficiently large to reproduce, within the range ofsampling error, published figures in the original census reports. Moreover, the IPUMS files, with complete individual (andfamily) unit records, can be recoded and tabulated, limited only by the scope and detail of the original census questionsand classifications. In addition to the standard census variables, the IPUMS files also contain many new recoded variablesto facilitate comparisons across censuses (Sobek, 2001).
Although the classification of workers by industrial sectors is sometimes conflated with occupations, these two dimen-sions of work are conceptually distinct. Industries refer to product produced or service delivered (by a firm or family runenterprise) while occupations refer to actual work activities and skills of workers (Sobek, 2006; Sutch, 2006). There is overlapin some categories – most farmers (occupations) work in the agricultural sector, but there are significant differences in thewide range of occupations (e.g., unskilled labor, clerical workers, managers) for those who work in the manufacturing, con-struction, and retail trade sectors.
The process of industrialization is associated with industrial restructuring as well as changes in the skills and actual tasksperformed by workers. We focus on the shifts in the industrial distribution of workers because technological and organiza-tional change typically results in the origin, growth, decline, and disappearance of businesses and forms of production. Asagricultural productivity increased, workers were drawn into manufacturing and services.
Shifts in occupations and the division of labor are likely to be derivative of the changes in industrial structure and techno-logical change. As factories replaced farms (the prototypical shift in the organization of work), many new occupations were cre-ated. Aside from the link to industrial structure, there is less theoretical clarity in the expected changes in occupations withindustrialization. A widespread assumption is that technological change leads to an upgrading of occupational skills. However,early mass production probably led to a replacement of skilled craft workers with unskilled production workers. Goldin andKatz (1998) argue that this process was reversed in the years around World War I when technological change may have hada pro skill bias. Regardless of changes in the content of nonfarm occupations, the shift from farming to factory work was prob-ably not considered as a step upward, or to a more technologically challenging job, by farmers.5 In addition to their autonomy,farmers have to master a number of trades including animal husbandry, crop management, and the entrepreneurial activities ofbuying and marketing. With our focus on industrial sectors, we attempt to capture the direct impact of industrialization on thestructure of the labor force without additional assumptions of the skill levels or status of workers.
3.1. A detailed industrial classification
For this analysis, we rely on the IPUMS variable ‘‘IND 1950,” which represents a recoding of the reported industries fromeach decennial census from 1850 to 2000 to the 1950 census industry classification (for additional details, see http://www.ipums.org/usa/pwork/ind1950a.html). The industry question was first asked in the 1910 census. For prior censuses, IND1950 was inferred from responses to the census question on occupations. The IND 1950 classification consists of 152 detailed
5 Occupational prestige scales rank farmers above unskilled workers, while occupational socioeconomic scales consider them about the same, see Duncan1961.
C. Hirschman, E. Mogford / Social Science Research 38 (2009) 897–920 901

Author's personal copy
(three-digit) categories plus ‘‘nonclassifiable” and ‘‘industry not reported” categories.6 Detailed industrial categories are gen-erally nested within primary (one digit) and secondary (two digit) categories. The classification includes some detailed indus-tries that emerged from technological change over time. For example, the detailed category #376 ‘‘Motor vehicles and motorvehicle equipment” did not include any workers until the 1910 census.
Any study of industrial change must attempt to reconcile the need for detail revealed by the tertiary level categories withthe need for parsimony evident in the broader categories. The summary industrial classification used here is ad hoc, reflect-ing elements of both principles with the objective of understanding the creation and expansion of specialized industries dur-ing the Age of Industrialization. Two major sectors, AGRICULTURE and CONSTRUCTION, are only reported at the primarylevel, while TRADE is shown for only the two major secondary levels: WHOLESALE TRADE and RETAIL TRADE. The other pri-mary sectors are subdivided into their detailed (tertiary) industries, though quite a few of the detailed categories have beenaggregated. Our primary emphasis is on the MANUFACTURING sector which includes all secondary level categories and mostof the tertiary industries. Following Singelmann (1978: 31), we reorganized the very heterogeneous SERVICE sector intothree new major categories: BUSINESS SERVICES, PERSONAL SERVICES, and SOCIAL SERVICES. Our final classification is dis-played in Appendix 1.
4. Changes in the industrial structure and immigrant participation: 1880–1920
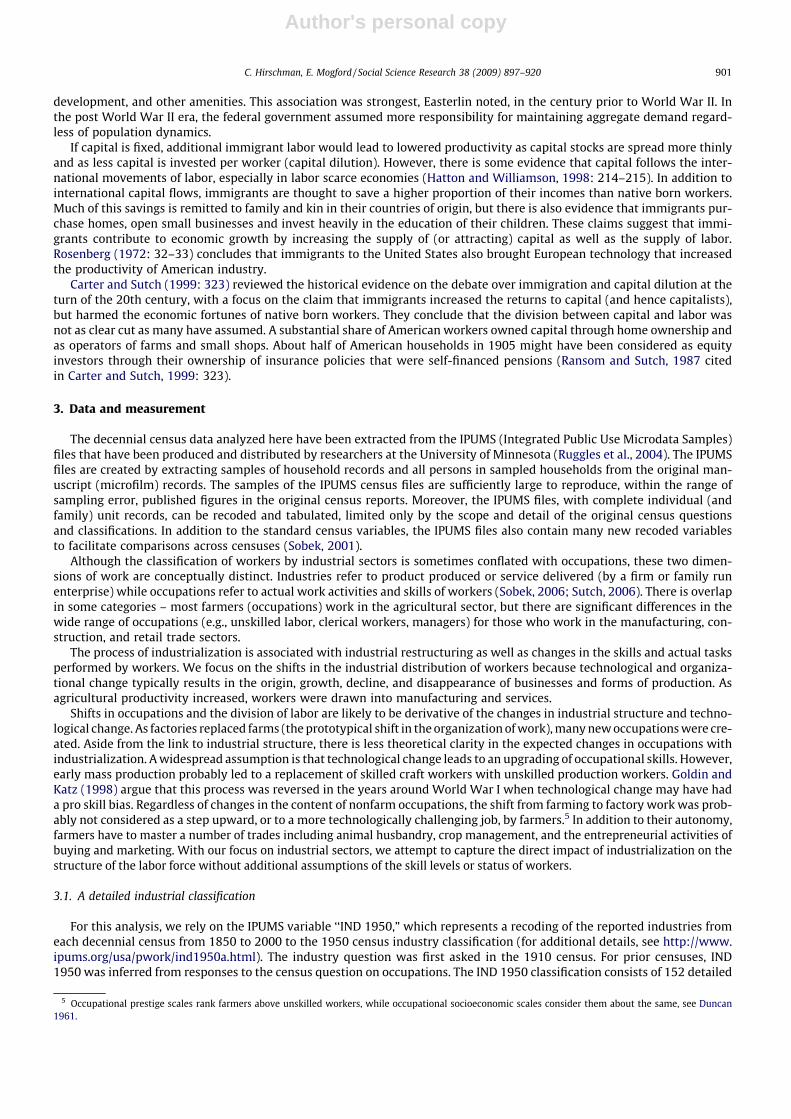
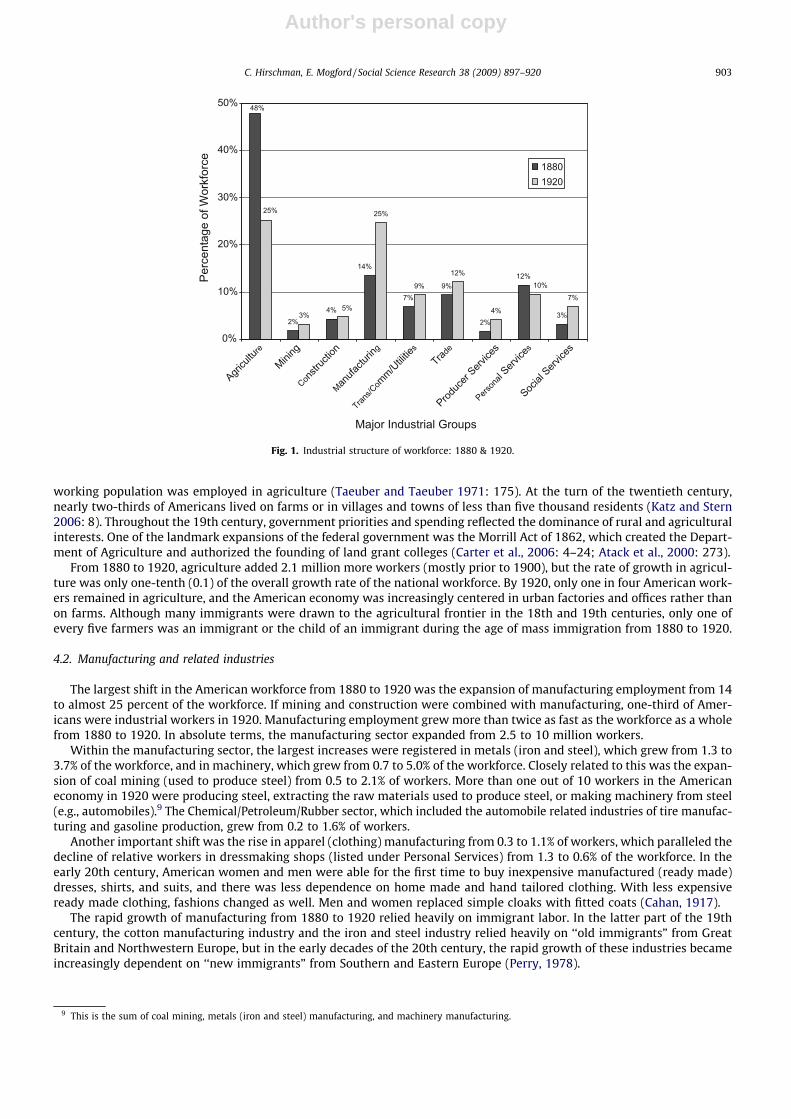
Our first objective is to describe changes in the industrial structure of the gainful workforce from 1880 to 1920, and theshare of recent immigrants and their descendents in this industrial transformation. Fig. 1 shows the dramatic changes in thestructure of the workforce in 1880 and 1920 for the 9 major industrial sectors. The single most striking change was the de-cline in agriculture (from 48 to 25% of the workforce) and the rise of manufacturing employment (up from 14 to 25%). Thereare also significant increases in the proportions working in mining, transportation and utilities, trade, producer services andsocial services. There was relative stability (from 4.6 to 4.8%) in construction, and a relative decline of employment in per-sonal services (from 11.5 to 9.5%).
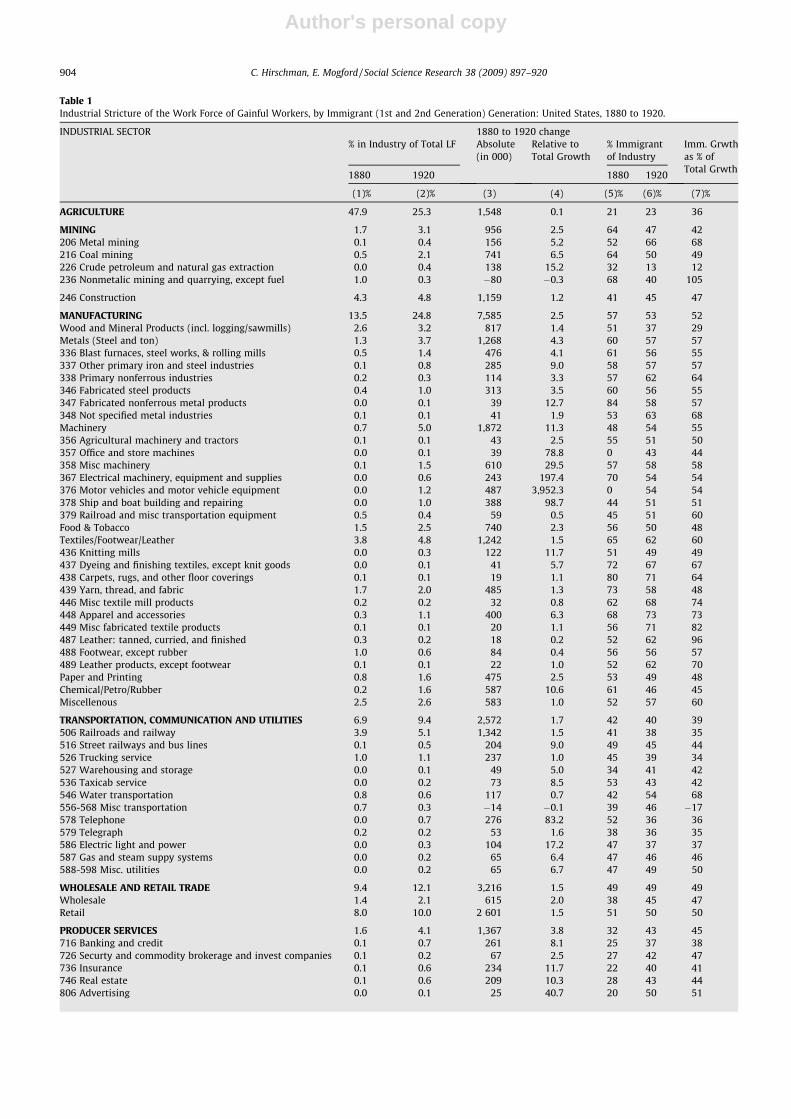
The source percentages in Fig. 1 are presented for detailed industry categories in the first two columns in Table 1, whichprovides an overview of the growth and transformation of the American workforce from 1880 to 1920. Columns 3 and 4show the absolute and relative growth of workers in each industry over the forty years. Columns 5 and 6 show the immigrantshare (both first and second generation) of each industrial sector. The final column shows the ratio of the growth of immi-grant workers to the overall growth (or decline) of workers in each industry from 1880 to 1920.
Although we consider these data comparable to the labor force during this period, technically, the data refer to gainfulworkers or all persons who reported a ‘‘gainful occupation” in the census enumeration (Bancroft 1958: Appendix C; Carter,2006). Accordingly, we refer to the gainful working population as the workforce, which does not connote the precision of themodern labor force concept and measurement.
Rapid growth and structural transformation are the two major trends in the American workforce from 1880 to 1920. Thenumber of gainful workers in the United States more than doubled from 1880 to 1920 (18.1 to 40.5 million).7 Even moresignificant was the shift from an employment structure centered on agriculture to a much more diversified industrial employ-ment structure. These patterns are illustrated with summary measures of ‘‘absolute growth” (indexed by the increase in thenumber of workers in the industry from 1880 to 1920) and ‘‘relative growth” (indexed by dividing the absolute growth in eachindustry by the expected growth, assuming that every industry grew at the same rate as the national workforce). A relativegrowth index value of 1.0 means the particular industry grew at the same rate as the national workforce (which more than dou-bled). A value of less than 1.0 means the industry experienced a below-average growth rate, and values greater than 1.0 above-average growth for the sector.
In 1880, at the eve of the age of mass migration and when almost half of the workforce was in the agricultural sector,immigrants and their children comprised about one-third of all workers. We include the second generation (the childrenof immigrants) as part of the immigrant community because they are reared and socialized by their foreign born parentsand would not have been in the United States except for the migration of their parents.8 The immigrant share increased to40 percent of the workforce in 1920. Almost half of the total growth of 22 million workers from 1880 to 1920 can be attributedto the increase of first and second generation immigrant workers (the last column of Table 1).
4.1. Agriculture
For the first century after the nation’s founding, the United States was an agricultural society, and most American farmswere small scale household enterprises that relied on family labor. In the early 19th century, upwards of two-thirds of the
6 About 13% of workers in the 1880 census IPUMS file did not have a known industry (codes 997 and 998). However, almost all did have a reportedoccupation (most were laborers), and this allowed us to impute industries based on the distribution of industries for those with a known occupation. We aregrateful to Matthew Sobek who suggested this method.
7 This fast pace of growth has not slackened. The U.S. labor force also doubled from about 70 to 140 million workers from 1960 to 2000 (Carter et al. 2006: 2:83-86).
8 The second generation is defined by census practice to include those with two foreign born parents and those with one foreign born parent.
902 C. Hirschman, E. Mogford / Social Science Research 38 (2009) 897–920
Author's personal copy
working population was employed in agriculture (Taeuber and Taeuber 1971: 175). At the turn of the twentieth century,nearly two-thirds of Americans lived on farms or in villages and towns of less than five thousand residents (Katz and Stern2006: 8). Throughout the 19th century, government priorities and spending reflected the dominance of rural and agriculturalinterests. One of the landmark expansions of the federal government was the Morrill Act of 1862, which created the Depart-ment of Agriculture and authorized the founding of land grant colleges (Carter et al., 2006: 4–24; Atack et al., 2000: 273).
From 1880 to 1920, agriculture added 2.1 million more workers (mostly prior to 1900), but the rate of growth in agricul-ture was only one-tenth (0.1) of the overall growth rate of the national workforce. By 1920, only one in four American work-ers remained in agriculture, and the American economy was increasingly centered in urban factories and offices rather thanon farms. Although many immigrants were drawn to the agricultural frontier in the 18th and 19th centuries, only one ofevery five farmers was an immigrant or the child of an immigrant during the age of mass immigration from 1880 to 1920.
4.2. Manufacturing and related industries
The largest shift in the American workforce from 1880 to 1920 was the expansion of manufacturing employment from 14to almost 25 percent of the workforce. If mining and construction were combined with manufacturing, one-third of Amer-icans were industrial workers in 1920. Manufacturing employment grew more than twice as fast as the workforce as a wholefrom 1880 to 1920. In absolute terms, the manufacturing sector expanded from 2.5 to 10 million workers.
Within the manufacturing sector, the largest increases were registered in metals (iron and steel), which grew from 1.3 to3.7% of the workforce, and in machinery, which grew from 0.7 to 5.0% of the workforce. Closely related to this was the expan-sion of coal mining (used to produce steel) from 0.5 to 2.1% of workers. More than one out of 10 workers in the Americaneconomy in 1920 were producing steel, extracting the raw materials used to produce steel, or making machinery from steel(e.g., automobiles).9 The Chemical/Petroleum/Rubber sector, which included the automobile related industries of tire manufac-turing and gasoline production, grew from 0.2 to 1.6% of workers.
Another important shift was the rise in apparel (clothing) manufacturing from 0.3 to 1.1% of workers, which paralleled thedecline of relative workers in dressmaking shops (listed under Personal Services) from 1.3 to 0.6% of the workforce. In theearly 20th century, American women and men were able for the first time to buy inexpensive manufactured (ready made)dresses, shirts, and suits, and there was less dependence on home made and hand tailored clothing. With less expensiveready made clothing, fashions changed as well. Men and women replaced simple cloaks with fitted coats (Cahan, 1917).
The rapid growth of manufacturing from 1880 to 1920 relied heavily on immigrant labor. In the latter part of the 19thcentury, the cotton manufacturing industry and the iron and steel industry relied heavily on ‘‘old immigrants” from GreatBritain and Northwestern Europe, but in the early decades of the 20th century, the rapid growth of these industries becameincreasingly dependent on ‘‘new immigrants” from Southern and Eastern Europe (Perry, 1978).
2%4%
7%9%
2%
12%
3%3%
25%
9%
12%
4%
7%
14%
48%
10%
25%
5%
0%
10%
20%
30%
40%
50%
Agricu
lture
Mining
Constr
uctio
n
Manufa
cturin
g
Trans/C
omm/U
tilities
Trade
Produc
er Serv
ices
Person
al Serv
ices
Social
Service
s
Major Industrial Groups
Perc
enta
ge o
f Wor
kfor
ce 18801920
Fig. 1. Industrial structure of workforce: 1880 & 1920.
9 This is the sum of coal mining, metals (iron and steel) manufacturing, and machinery manufacturing.
C. Hirschman, E. Mogford / Social Science Research 38 (2009) 897–920 903
Author's personal copy
Table 1Industrial Stricture of the Work Force of Gainful Workers, by Immigrant (1st and 2nd Generation) Generation: United States, 1880 to 1920.
INDUSTRIAL SECTOR 1880 to 1920 change% in Industry of Total LF Absolute
(in 000)Relative toTotal Growth
% Immigrantof Industry
Imm. Grwthas % ofTotal Grwth
1880 1920 1880 1920
(1)% (2)% (3) (4) (5)% (6)% (7)%
AGRICULTURE 47.9 25.3 1,548 0.1 21 23 36
MINING 1.7 3.1 956 2.5 64 47 42206 Metal mining 0.1 0.4 156 5.2 52 66 68216 Coal mining 0.5 2.1 741 6.5 64 50 49226 Crude petroleum and natural gas extraction 0.0 0.4 138 15.2 32 13 12236 Nonmetalic mining and quarrying, except fuel 1.0 0.3 �80 �0.3 68 40 105
246 Construction 4.3 4.8 1,159 1.2 41 45 47
MANUFACTURING 13.5 24.8 7,585 2.5 57 53 52Wood and Mineral Products (incl. logging/sawmills) 2.6 3.2 817 1.4 51 37 29Metals (Steel and ton) 1.3 3.7 1,268 4.3 60 57 57336 Blast furnaces, steel works, & rolling mills 0.5 1.4 476 4.1 61 56 55337 Other primary iron and steel industries 0.1 0.8 285 9.0 58 57 57338 Primary nonferrous industries 0.2 0.3 114 3.3 57 62 64346 Fabricated steel products 0.4 1.0 313 3.5 60 56 55347 Fabricated nonferrous metal products 0.0 0.1 39 12.7 84 58 57348 Not specified metal industries 0.1 0.1 41 1.9 53 63 68Machinery 0.7 5.0 1,872 11.3 48 54 55356 Agricultural machinery and tractors 0.1 0.1 43 2.5 55 51 50357 Office and store machines 0.0 0.1 39 78.8 0 43 44358 Misc machinery 0.1 1.5 610 29.5 57 58 58367 Electrical machinery, equipment and supplies 0.0 0.6 243 197.4 70 54 54376 Motor vehicles and motor vehicle equipment 0.0 1.2 487 3,952.3 0 54 54378 Ship and boat building and repairing 0.0 1.0 388 98.7 44 51 51379 Railroad and misc transportation equipment 0.5 0.4 59 0.5 45 51 60Food & Tobacco 1.5 2.5 740 2.3 56 50 48Textiles/Footwear/Leather 3.8 4.8 1,242 1.5 65 62 60436 Knitting mills 0.0 0.3 122 11.7 51 49 49437 Dyeing and finishing textiles, except knit goods 0.0 0.1 41 5.7 72 67 67438 Carpets, rugs, and other floor coverings 0.1 0.1 19 1.1 80 71 64439 Yarn, thread, and fabric 1.7 2.0 485 1.3 73 58 48446 Misc textile mill products 0.2 0.2 32 0.8 62 68 74448 Apparel and accessories 0.3 1.1 400 6.3 68 73 73449 Misc fabricated textile products 0.1 0.1 20 1.1 56 71 82487 Leather: tanned, curried, and finished 0.3 0.2 18 0.2 52 62 96488 Footwear, except rubber 1.0 0.6 84 0.4 56 56 57489 Leather products, except footwear 0.1 0.1 22 1.0 52 62 70Paper and Printing 0.8 1.6 475 2.5 53 49 48Chemical/Petro/Rubber 0.2 1.6 587 10.6 61 46 45Miscellenous 2.5 2.6 583 1.0 52 57 60
TRANSPORTATION, COMMUNICATION AND UTILITIES 6.9 9.4 2,572 1.7 42 40 39506 Railroads and railway 3.9 5.1 1,342 1.5 41 38 35516 Street railways and bus lines 0.1 0.5 204 9.0 49 45 44526 Trucking service 1.0 1.1 237 1.0 45 39 34527 Warehousing and storage 0.0 0.1 49 5.0 34 41 42536 Taxicab service 0.0 0.2 73 8.5 53 43 42546 Water transportation 0.8 0.6 117 0.7 42 54 68556-568 Misc transportation 0.7 0.3 �14 �0.1 39 46 �17578 Telephone 0.0 0.7 276 83.2 52 36 36579 Telegraph 0.2 0.2 53 1.6 38 36 35586 Electric light and power 0.0 0.3 104 17.2 47 37 37587 Gas and steam suppy systems 0.0 0.2 65 6.4 47 46 46588-598 Misc. utilities 0.0 0.2 65 6.7 47 49 50
WHOLESALE AND RETAIL TRADE 9.4 12.1 3,216 1.5 49 49 49Wholesale 1.4 2.1 615 2.0 38 45 47Retail 8.0 10.0 2 601 1.5 51 50 50
PRODUCER SERVICES 1.6 4.1 1,367 3.8 32 43 45716 Banking and credit 0.1 0.7 261 8.1 25 37 38726 Securty and commodity brokerage and invest companies 0.1 0.2 67 2.5 27 42 47736 Insurance 0.1 0.6 234 11.7 22 40 41746 Real estate 0.1 0.6 209 10.3 28 43 44806 Advertising 0.0 0.1 25 40.7 20 50 51
904 C. Hirschman, E. Mogford / Social Science Research 38 (2009) 897–920
Author's personal copy
More than one-half of the net growth of 7.5 million workers in manufacturing from 1880 to 1920 was due to the increaseof first and second generation workers over this period. The immigrant share was significant in all manufacturing industries,but proportionally less in wood and mineral products and a few other categories. Immigrants provided the majority of addedworkers in the rapidly growing iron and steel industry, machinery manufacturing, and textiles and apparel. The dominanceof the Eastern European immigrants in apparel manufacture (and trade) in New York City is well known (Kahan, 1978), butimmigrants were also over-represented in mining and construction and throughout the heavy industries in the Northeastand Midwest.
4.3. Transportation, communications, and utilities
The consequences of expansion in the manufacturing sector rippled through other sectors. This led to major changes inthe organization of the economy and the structure of employment. The distribution of goods from manufacturing plants tohouseholds also required massive investments and expansion in transportation, communications, retailing, and a supportiveinstitutional structure for the expansion of business, and an increasingly urban society. A governmental bureaucracy wasneeded to build roads, manage cities, and to educate the population for employment in factories and offices.
The transportation and communication sector added more than 2.3 million workers from 1880 to 1920, of which 1.2 mil-lion were added to the railway and railroad sector alone. The two million workers employed in the railroads and railwaysector in 1920 comprised 5% of the total workforce. The telegraph was the only means of rapid long-distance communication
Table 1 (continued)
INDUSTRIAL SECTOR 1880 to 1920 change
% in Industry of Total LF Absolute(in 000)
Relative toTotal Growth
% Immigrantof Industry
Imm. Grwth as% of Total Grwth
1880 1920 1880 1920
(1)% (2)% (3) (4) (5)% (6)% (7)%
807 Accounting, auditing, and bookkeeping services 0.3 0.3 39 0.5 41 49 61808 Misc business services 0.4 1.1 379 4.8 42 52 53808 Misc business services 0.4 1.1 379 4.8 42 52 53879 Legal services 0.4 0.4 79 1.0 21 35 46898 Engineering and architectural services 0.1 0.2 69 3.8 34 37 38
PERSONAL SERVICES 11.5 9.5 1,763 0.7 43 39 34816 Auto repair services and garages 0.0 0.8 342 32 32.3817 Misc repair services 1.3 0.6 �7 0.0 47 42 188826 Private households 7.3 4.3 403 0.2 41 34 14836 Hotels and lodging places 0.6 1.3 406 3.3 41 43 43846 Laundering, cleaning, and dyeing 0.3 0.5 145 2.0 53 46 43847 Dressmaking shops 1.3 0.6 5 0.0 50 44 �243848 Shoe repair shops 0.0 0.2 73 17.9 45 72 73849 Misc personal services 0.4 0.7 225 2.4 49 42 40857 Theaters and motion pictures 0.0 0.3 114 928.3 100 43 43858 Bowling alleys, and billiard and pool parlors 0.0 0.1 34 17.1 44 45 45859 Misc entertainment and recreation services 0.3 0.2 24 0.4 48 50 54
SOCIAL SERVICES 3.2 6.9 2,205 3.1 27 36 38868 Medical and other health services, excpthospitals
0.6% 0.8 212 1.6 18 36 45
869 Hospitals 0.0 0.4 167 90.6 60 46 46888 Educational services 1.3 2.4 739 2.5 24 30 32896 Welfare and religious services 0.4 0.5 127 1.3 37% 42 45897 Nonprofit membership organizs. 0.0 0.1 38 25.6 25 39 39899 Misc professional and related 0.1 0.1 23 1.7 34 48 55906 Postal service 0.1 0.5 192 6.1 23 32 33916 Federal public administration 0.2 0.9 318 5.9 44 33 31926 State public administration 0.0 0.1 26 4.5 35 34 34936 Local public administration 0.4 1.1 364 4.6 34 46 49
TOTAL WORK FORCE (GAINFUL WORKERS) 100 100 22,371 1.0 34 40 45Census count (from PUMS) 18,147,884 40,518,636
Sources: 1880 and 1920 PUMS from Ruggles et al. (2004).Notes: Gainful workers in 1880 not reporting an industry (codes 997/998) are distributed prorata by the industry of their reported occupation.(1). Percentage by major and selected industrial sectors of employment of 1880 total labor force.(2). Percentage by major and selected industrial sectors of employment of 1920 total labor force.(3). Change (in thousands) in absolute number of workers, by industrial sector from 1880 to 1920.(4). Ratio of the percent change from 1880 to 1920 of each industrial sector to the percent change of the total work force from 1880 to 1920 (123%).(5). Percent immigrant (first and second generation) of workers, by industrial sector in 1880.(6). Percent immigrant (first and second generation) of workers, by industrial sector in 1920.(7). Ratio of the change in the absolute number of immigrants (first and second generation) to the absolute change of workers in each industry from 1880 to1920.
C. Hirschman, E. Mogford / Social Science Research 38 (2009) 897–920 905
Author's personal copy
in 1880 and the small number of workers employed in the sector (about 27,000) reflected the limited role of long distancecommunications (there were an additional 26,000 workers employed in postal services). By 1920, a brand new communica-tions industry—the telephone—grew from zero to 279,000 workers or about 0.7 of the 1920 workforce.10
Immigrants played an important role in the growing transportation and communications sector, but their role was sec-ondary to the 3rd and higher generation population—the NBNP (Native Born of Native Parentage) population. For example,nearly two-thirds of the added workers in railroads were 3rd and higher generation Americans. There was a great boom inrailroad construction in late 19th century America. By 1899, ‘‘every major city had a rail head that was connected to the na-tional system” (Cain, 2006: 4–771; also see Mayer, 1989: 928). The geographic dispersion of railroads, and relatively goodwages in the industry, undoubtedly pulled many descendents of the native born workers into the railroad sector.
4.4. Wholesale and Retail Trade
The enormous outpouring of goods from the nation’s factories had to be distributed and sold, mostly to domestic markets.Wholesale trade added almost 600,000 workers from 1880 to 1920, and retail trade grew by almost 2.4 million workers. Oneof every eight American workers in 1920 was employed in retail or wholesale trade—about one-half of the size of the man-ufacturing sector.
The late 19th century witnessed the beginnings of mass retailing and the emergence of department stores in large cities(Ward, 1971: 94; Raff, 2006: 4–706). Although most studies in the business literature focus on larger firms, most retail enter-prises were probably small family owned stores. As late as 1899, the number of proprietors in retail sales was approximatelyequal to the number of employees in the sector (Carter et al., 2006: 4–713). The rapid growth of workers in sales were mostlikely employed in very small shops or as peddlers who sold goods to farm families and other households in scattered ruralcommunities. The availability of new manufactured goods, linked by an expanding transportation system and a network ofwholesale and retail enterprises, created a national market for consumer goods that would gradually supplant homeproduction.
Immigrants, especially the second generation, provided for about half of the added workers in trade from 1880 to 1920,primarily in general merchandise, food, and apparel stores. Immigrant merchants were often reputed to create new marketsthrough peddling goods to remote regions and in extending credit to people without accumulated savings.
4.5. Services
The very heterogeneous collection of service industries is reorganized here to emphasize the key distinctions betweenproducer, personal, and social services (Singelmann, 1978). Producer services include banking, insurance, real estate,accounting, and other business services that play an important intermediary role in urban and industrial economies. Socialservices include education, health care, public administration, and other services that are generated by the government tomeet the collective needs of communities and individuals. Personal services is the residual category and corresponds mostclosely to the image of service occupations, and it includes private household workers, dressmakers, and shoe repair shops.This sector also includes repair services (including auto repair), and entertainment services (including movie theaters andrecreation). There is a certain amount of arbitrariness in all industrial classifications, including this one. Hotels and lodgingplaces are classified as a personal service, but eating and drinking establishments are considered as part of the retail tradesector.
Concurrent with the creation of an industrial society from 1880 to 1920 was the expansion of business and the beginningsof public provision of education, health care, and welfare – these are evident in the increases of workers in producer servicesand social services. As business and social services expanded from 1880 to 1920, personal services declined. The decline ofpersonal services was primarily of private household workers (domestics), which declined from 7 to just over 4% of workersfrom 1880 to 1920. There were also relative declines in some other traditional personal services (dressmaking and repairservices), but increases in some ‘‘modern” personal services, such as auto repair services, hotels, and the theatre and motionpicture industry.
Producer services grew almost 4 times as fast as the overall workforce from 1880 to 1920, and more than doubled theirrelative share from 1.6 to 4.1% of all workers. The largest components of the increase in producer services were in banking,insurance, real estate, and related business services (Ward, 1971: 99). The absolute number of workers in these businessindustries is small, but rapid expansion reflects the increasing complexity of an industrial economy. The efficient manage-ment and coordination of large firms and corporations required a growing army of accountants, bookkeepers, and other of-fice personnel.
The relative growth of social services from 3.2 to 6.9% was fueled by increasing numbers of teachers, health and hospitalworkers, and governmental employment at all levels, including postal workers. The expansion of government services wasshaped by the increasing urbanization of the population. The concentration of people in cities made it easier to provide prox-imate access to schooling, health care, and other services including transportation, sanitation, and public safety. Custom, kin-ship networks, and voluntary associations are often sufficient to satisfy collective welfare needs in low density settlements
10 The absolute figures are not reported in Table 1, but can be obtained by multiplying the proportion in the industry by the total workforce.
906 C. Hirschman, E. Mogford / Social Science Research 38 (2009) 897–920

Author's personal copy
and rural areas, but the growth of government appears to be an inevitable concomitant of an urban and industrial society.Government employment grew from 3 to 5 times faster than the workforce as a whole.
As the new service industries, including education, government employment, and business services, grew from 1880 to1920, the second generation participated proportional to their numbers, but 3rd and higher generation Americans were themajority of added workers. This was particularly true in social service fields such as health, education, the post office, andgovernment employment more generally. By and large, these were good jobs that required educational credentials and socialcapital, which immigrants were much less likely to possess.
The growth of professional employment in the service economy was a natural accompaniment of the expansion anddevelopment. Perhaps, immigrants were more likely to ‘‘push up” native born workers than to crowd them out. MichaelHaines (2000: 202) observes that as immigrants occupied ‘‘a disproportionate share of the lower skill and lower status posi-tions, they made possible, in some sense, the better-paid higher status occupations of the native white population.” Thisinterpretation has also been made by Lieberson (1980: chapter 10) in his theory of labor market queues. Lieberson’s focuswas on the concentration of African Americans in the least desirable occupations in 1900, as they had few resources andencountered the greatest discrimination in northern labor markets. Although new immigrants were ahead of African Amer-icans in most labor queues, the growth of the overall labor market through immigration created demand for managerial, pro-fessional, and clerical employment that was more likely to be filled by older stock white Americans than by immigrants orAfrican Americans.
5. A model to estimate the 3rd generation immigrants by industry
The underlying question that motivates this analysis is the impact of immigration on the transformation of the Americaneconomy from a primarily agrarian structure to one based on manufacturing and associated industries. Would it have beenpossible to have had the American industrial revolution without immigrants? Or alternatively, would the industrial revolu-tion have been smaller, slower, or more costly? In the prior section, we focused on the magnitude and economic roles of thefirst and second generation immigrant population. In this section, we extend the analysis with an estimate of magnitude of3rd generation immigrants—the grandchildren of immigrants and their economic roles.
The grandchildren of immigrants are unlikely to have attachments to their ancestral homeland and are probably wellassimilated into American society. If we desire to attribute the 3rd generation as part of the immigrant contribution, theskeptical reader may wonder why we do not also count the 4th and higher generations as also part of the immigrant share.Clearly, there is a thin line from ‘‘reasonable” assumptions to a reductio ad absurdum argument that the immigrant contri-bution includes all Americans. Our claim is that 3rd generation immigrants in the early 20th century are the recent descen-dants of European immigrants who were more likely to have settled in cities than to have moved to the agricultural frontier.In 1880, one-third of all workers were composed of first and second generation immigrants and most lived in cities. We as-sume that 3rd generation immigrants were much more likely to have been exposed to emerging opportunities in the urbanindustrial economy than older stock native born Americans in the late 19th and early 20th century.
In this section, we present the methods and results of a ‘‘Shift-Share” estimation (akin to indirect standardization) of theindustrial structure of the grandchildren of immigrants in 1920. There are two components to estimate: immigration genera-tions and the industrial structure by immigrant generation. We first address the measurement of immigration generations.
The 1920 work force can be divided into two components: immigrants (counting both the foreign born and the secondgeneration) and the native born of native parentage (NBNP). Although the NBNP population is typically assumed to reflecta society without immigration, the distinction between the immigrant and NBNP populations is not fixed, since the 3rd andhigher order generation descendents of immigrants are counted as part of the native born population. Since immigrants weredisproportionately living in cities and held industrial jobs in 1880, it seems plausible to assume that their grandchildren areprobably over-represented in industrial employment in 1920 relative to the grandchildren of the 1880 NBNP Population.
The logic of our analytical approach is diagrammed in Fig. 2. The two columns represent the 1880 and 1920 work force byimmigrant generation. In both years, we can measure only three generational groupings: (1) the foreign born, (2) the secondgeneration—the children of immigrants, and (3) third and higher generations—NBNP. The 1920 workforce is composed ofsome 1880 workers (those age 20 in 1880 would be age 60 in 1920), the descendants of the 1880 population, and recentimmigrants and their descendants. It is impossible to make precise estimates of generational continuity and succession be-cause of the complexity of demographic structure and changes, including variations in age structure, labor force exits andentries, mortality, and differential fertility (Duncan 1966a). Although most workers in 1880 would have retired (or died) be-fore 1920, some are still working. Some 1880 workers have no children (or no working children) 40 years later, while other1880 workers may have been ‘‘replaced” by one or more descendents.
Nonetheless, we can provide a crude estimate of the contribution of recent immigration to the 1920 workforce with sev-eral simplifying assumptions. The first assumption is that the majority of the first and second generation workers in 1920were recent immigrants. Some of these immigrants (or their parents) may well have arrived before 1880. Thus, the labelof ‘‘recent immigrants” is somewhat broader than the 1880 to 1920 period. The estimation of the third generation requireseven more heroic assumptions about the fraction of the 1920 third and higher generation workers (NBNP) that are descen-dents of immigrants in 1880.
The analytical task is illustrated in Fig. 2, by the dashed line that identifies the 1920 3rd generation from the broader cat-egory of the 3rd and higher generation population. To do this, we assume that the ratio of the 3rd generation population
C. Hirschman, E. Mogford / Social Science Research 38 (2009) 897–920 907
Author's personal copy
(grandchildren of immigrants) to the 3rd and higher generation population in 1920 is proportional to the ratio of the 2ndgeneration to the 2nd and higher generation population in 1880. We have three of the four numbers in this equation(1880 2nd generation, 1880 2nd and higher generations, and 1920 3rd and higher generation populations), and it is straight-forward to estimate the missing element—the 1920 3rd generation.
1920 3rd Gen ¼ ½1880 2nd Gen=1880 2nd & Higher Gen� � 1920 3rd & Higher Gen
This equation assumes that the relative magnitude of 1920 3rd generation is roughly comparable to the descendents of the1880 2nd generation. The demographic metabolism that leads to generational replacement over time is exceedingly complex,and our simple model does not directly measure these processes (for more discussion, see Blau and Duncan 1967: 112). Ourestimation rests on an assumption about proportionality—that the 1880 2nd generation (relative to the 2nd and higher gener-ational total) is proportional to the 1920 3rd generation (relative to the 3rd and higher generational total). One virtue of thisassumption is its transparency – it does not specify demographic mechanisms, but simply assumes that generational replace-ment over a 40 year period (from all mechanisms) is roughly proportional to the initial generational composition.
The next step is to measure the industrial composition of the 1920 labor force within each immigrant generation: 1st,2nd, 3rd, and 4th and higher. The industrial composition of the 1st and 2nd generations is directly measured, but estimatingthe industrial classification of 1920 3rd generation (and 4th & higher) can be done with an adaptation of the standard ‘‘Shift-Share” model. The Shift-Share model is often used to measure the expected changes in a subset of the population (state orlocality) by assuming that change (share) is proportional to the change in the total population (national). The difference be-tween the expected distribution and the actual distribution for the local area is a residual (shift) that is due to local factorsthat are independent of the national trend.
In this analysis, we first estimate an expected distribution by industry assuming that the growth rate of workers in eachindustry from 1880 to 1920 is equal to the national growth rate of the workforce. The next step is to measure the differencebetween the expected and actual workers in each industry. The logic of the estimation of these two components of industrialtransformation—Continuity and Shifts—is diagramed in Fig. 3.
Continuity is measured as the ‘‘expected 1920 work force by industry”, which assumes 1920 workers are distributed byindustry proportional to the industry structure of their ancestors in the 1880 workforce. In other words, the expected work-ers in each industry in 1920 are assumed to increase at the same rate as ‘‘natural growth” of the workforce from 1880 to1920. The natural growth of the workforce (excluding 1st generation immigrants) ‘‘r” is measured as the ratio of the 3rdand higher generation population in 1920 to the 2nd and higher generation labor force in 1880. Specifically, we assume that24.2 million 3rd and higher generation workers in 1920 are (approximately) the descendents of the 12.9 million 2nd andhigher generation workers in 1880. This succession process or ‘‘continuity” includes a host of demographic processes includ-ing aging and the differential ‘‘replacement” of 1880 workers by their adult children and grandchildren in 1920. The multi-plication of this ratio (approximately 1.9) times the number of 1880 2nd and higher generation workers in each industry in1880 yields an ‘‘expected” number of 1920 3rd and higher generation workers in each industry.
Exp 1920 3rd & Higher Gen in IndðiÞ ¼ 1880 2nd & Higher Gen in IndðiÞ � r ð1Þ
5.1. Estimation of expected number of workers by industry and generation
This formula assumes that the overall growth rate ‘‘r,” is the same across all industries. This formula can be extended todivide the 1920 3rd & higher generation expected populations into two components: the expected 1920 3rd generation pop-ulation and the expected 1920 4th & higher generation population.
1880 1920
2nd Gen
1st Gen
Immigration
3rd Gen
4th Gen & Higher
2nd Gen
1st Gen
3rd Gen & Higher
Fig. 2. The demographic components of the 1920 gainful workforce.
908 C. Hirschman, E. Mogford / Social Science Research 38 (2009) 897–920
Author's personal copy
Exp 1920 3rd Gen in IndðiÞ ¼ 1880 2nd Gen in IndðiÞ � r ð2ÞExp 1920 4th & Higher Gen in IndðiÞ ¼ 1880 3rd & Higher Gen in IndðiÞ � r ð3Þ
The overall natural growth rate is assumed to be equivalent for the 3rd generation population and the 4th and highergeneration population. The expected distributions of the labor force by industry (and generation) from 1880 to 1920 assumecontinuity—1920 workers followed their parents (or grandparents) in the same industries. This assumes that skills, prefer-ences, and informal mechanisms of recruitment are passed along across generations. As measured by the index of dissimi-larity, the industrial structure of the 1880 first generation is more similar to that of the 1920 second generation than to the1920 3rd and higher generations. Of course, workers change employment from time to time, and children do not always fol-low in the same line of work as their parents. The forces of supply and demand, technological change, and other marketforces create pressures to which workers must respond. The measured differences between the ‘‘actual” 1920 workers ineach industry and the ‘‘expected” number are labeled (net) ‘‘Shifts.”
Shift of 1920 3rd & Higher Gen in IndðiÞ ¼ ðActual 1920 3rd & Higher Gen in IndðiÞÞ� ðExp 1920 3rd and Higher Gen in IndðiÞÞ ð4Þ
The next step is to allocate the Shifts between industries to the 3rd generation and the 4th and higher generations in1920. The overall Shift for the 3rd and higher generations in 1920 is distributed proportional to the relative size of the1880 generations. Specifically,
Shift of 1920 3rd Gen in IndðiÞ ¼ ½Shift of 1920 3rd & Higher Gen in IndðiÞ�� ½1880 2nd Gen in IndðiÞ=1880 2nd & Higher Gen in IndðiÞ� ð5Þ
Shift of 1920 4th Gen in IndðiÞ ¼ ½Shift of 1920 3rd & Higher Gen in IndðiÞ�� ½1880 3rd Gen in IndðiÞ=1880 2nd & Higher Gen in IndðiÞ� ð6Þ
The results of this simple estimation of Continuity and Shifts are show in Table 2.Column 1 through 4 in Table 2 show the 1920 workforce by industrial sector for all workers and for each immigrant gen-
eration (3rd and higher, 2nd, and 1st). The next two columns show the estimated workforce for the 4th and higher and the3rd generations by industry in 1920, assuming intergenerational continuity. The next columns show net shifts, or the differ-ences between the actual and expected workforce by industry, for the same immigrant generations. Let’s consider the man-ufacturing sector as an example to illustrate these calculations.
5.2. The contribution of the 3rd generation
There were a little more than 10 million workers in manufacturing in 1920—about one quarter of the total workforce. Thisfigure is in the first column of Table 2 in the row labeled MANUFACTURING. The next three columns show the absolute num-ber of workers in each industry by generation in 1920. First and second generation immigrants comprised 2.9 and 2.5 millionworkers in manufacturing –or about 53% of the 10 million workers in the sector in 1920 (as noted in Table 1). This figure, aslarge as it is, is an underestimate of the contribution of immigration to the manufacturing sector in 1920. Recall that 58% of1880 immigrant workers (which included both 1st and 2nd generation) were employed in manufacturing (Table 1). Some ofthe 1880 immigrants and their descendents are included in the 1st and 2nd generation in 1920, but many others have beenabsorbed into the NBNP (3rd and higher generation).
Following the logic of the formulae presented above, Columns 5 and 6 show the expected numbers of 1920 workers ineach industry for the 1920 4th & higher generations and the 1920 3rd generation, respectively. A shorthand designationof these calculations is that the expected 1920 4th and higher workers are the descendents of the 1880 3rd and higher
1880 1920
Industry A
Industry B
Industry A
Industry B
Continuity
Continuity
Shift
Fig. 3. Estimating the sources of change in the industrial structure of the gainful workforce from 1880 to1920.
C. Hirschman, E. Mogford / Social Science Research 38 (2009) 897–920 909
Author's personal copy
Table 2Estimation of the composition of the 1920 industrial structure by immigraton generation based on assumptions of generational replacement from 1880 to 1920.
Actual 1920 Workforce(in thousands)
Expected Workforce in 1920 Shift (Actual-expected)
Share of 1920 labor force from:
Immigrant Generation 4th + Gen 3rd Gen 4th + Gen 3rd Gen From 1920 From1880 2nd Gen Total
Total 3rd + 2nd 1st Based on 1880: Based on 1880: 1st & 2nd Expected Shift Imm. Share
3+ Gen 2nd Gen 3+ Gen 2nd Gen
1 2 3 4 5 6 7 8 9 10 11 12(r � 1880 3rd +) (r � 1880 2nd) (3+4)/(1) (6/1) (8/1) (9+10+11)
Agriculture 10,235 7,897 1,373 967 11,667 1,167 �4,488 �449 23% 11% �4% 30%
Mining 1,270 668 192 410 189 83 275 121 47% 7% 10% 64%206 Metal mining 181 62 34 85 20 5 30 7 66% 3% 4% 72%216 Coal mining 834 414 130 291 56 28 221 109 50% 3% 13% 67%226 Crude petroleum and natural gas extraction 145 126 12 6 8 2 92 24 13% 2% 16% 31%236 Nonmettalic mining and quarrying, except fuel 110 66 16 28 104 49 �59 �28 40% 44% �25% 59%
246 Construction 1,942 1,077 394 471 778 185 92 22 45% 10% 1% 55%
Manufacturing 10,039 4,724 2,451 2,863 1,793 971 1.272 689 53% 10% 7% 69%
Wood and Mineral Products 1,288 809 203 276 390 141 205 74 37% 11% 6% 54%Metals (Steel and Iron) 1,509 647 326 536 164 115 217 151 57% 8% 10% 75%336 Blast furnaces, steel works, & rolling mills 570 252 99 219 62 43 86 60 56% 8% 11% 74%337 Other primary iron and steel industries 310 133 61 116 18 13 60 42 57% 4% 14% 75%338 Primary nonferrous industries 142 53 28 60 20 12 13 8 62% 9% 6% 77%346 Fabricated steel products 386 170 105 110 49 39 46 36 56% 10% 9% 75%347 Fabricated nonferrous metal products 42 17 15 9 1 1 7 9 58% 2% 21% 82%348 Not specified metal industries 59 22 17 21 14 7 1 0 63% 11% 0% 75%
Machinery 2,007 921 554 531 119 45 548 209 54% 2% 10% 67%356 Agricultural machinery and tractors 57 28 13 16 11 8 5 4 51% 14% 7% 72%357 Office and store machines 39 22 11 6 1 0 22 0 43% 0% 0% 43%358 Misc machinery 626 260 190 176 12 8 145 95 58% 1% 15% 75%367 Electrical machinery, equipment and supplies 244 112 81 50 1 1 56 55 54% 0% 23% 77%376 Motor vehicles and motor vehicle equipment 487 225 125 137 0 0 225 0 54% 0% 0% 54%378 Ship and boat building and repairing 391 193 98 100 3 1 142 47 51% 0% 12% 63%379 Railroad and misc transportation equipment 158 78 35 45 91 28 �32 �10 51% 18% �6% 62%
Food & Tobacco 1,007 504 224 278 199 93 144 68 50% 9% 7% 66%Textiles/Footwear/Leather 1,933 738 509 686 407 312 10 8 62% 16% 0% 78%436 Knitting mills 130 66 37 27 7 5 31 23 49% 4% 18% 71%437 Dyeing and finishing textiles, except knit goods 47 15 13 19 3 2 5 5 67% 5% 10% 83%438 Carpets, rugs, and other floor coverings 34 10 11 13 5 8 �1 �2 71% 25% �6% 89%439 Yarn, thread, and fabric 792 334 193 265 138 163 15 18 58% 21% 2% 81%446 Misc textile mill products 63 20 18 26 20 15 �8 �6 68% 23% �10% 82%448 Apparel and accessories 451 123 121 207 28 31 30 34 73% 7% 8% 87%449 Misc fabricated textile products 35 10 10 14 11 5 �4 �2 71% 15% �6% 80%487 Leather: tanned, curried, and finished 82 31 19 32 52 22 �30 �12 62% 27% �15% 73%488 Footwear, except rubber 260 113 77 70 130 52 �49 �20 56% 20% �8% 69%489 Leather products, except footwear 39 15 11 13 14 7 �4 �2 62% 19% �6% 75%
Paper and Printing 628 318 199 111 121 84 67 47 49% 13% 7% 70%Chemical/Petro/Rubber 632 341 134 157 30 17 185 108 46% 3% 17% 66%Miscellenous 1,035 446 302 288 363 163 �56 �25 57% 16% �2% 70%
910C.H
irschman,E.M
ogford/Social
ScienceR
esearch38
(2009)897–
920
Author's personal copy
Transportation, communication and utilities 3,825 2,300 833 692 1,228 305 614 153 40% 8% 4% 52%506 Railroads and railway 2,047 1,280 403 365 698 153 352 77 38% 7% 4% 49%516 Street railways and bus lines 223 123 49 51 16 8 67 33 45% 3% 15% 63%526 Trucking service 428 261 108 59 176 62 17 6 39% 14% 1% 55%527 Warehousing and storage 57 34 14 9 9 1 20 3 41% 2% 5% 48%536 Taxicab service 80 46 21 13 6 2 27 11 43% 3% 13% 59%546 Water transportation 255 118 45 92 136 33 �41 �10 54% 13% �4% 63%556-568 Misc transportation 120 64 26 30 138 28 �84 �17 46% 23% �14% 55%578 Telephone 279 178 85 16 2 2 83 90 36% 1% 32% 69%579 Telegraph 81 51 22 7 29 11 8 3 36% 14% 4% 54%586 Electric light and power 109 68 27 14 4 2 46 16 37% 1% 15% 54%587 Gas and steam supply systems 74 40 17 17 7 2 24 6 46% 3% 8% 57%588–598 Misc. utilities 73 37 16 20 7 2 22 6 49% 3% 9% 61%
0
Wholesale and retail trade 4,919 2,493 1,223 1,202 1,456 538 364 135 49% 11% 3% 63%Wholesale 870 481 228 160 265 54 135 28 45% 6% 3% 54%Retail 4,050 2,012 995 1,043 1,191 484 240 97 50% 12% 2% 65%
producer services 1,657 942 494 221 333 77 432 100 43% 5% 6% 54%716 Banking and credit 287 181 83 23 33 6 121 21 37% 2% 7% 46%726 Security and commodity brokerage and invest companies 89 51 29 9 27 4 18 3 42% 4% 3% 49%736 Insurance 250 150 70 29 21 3 112 14 40% 1% 6% 47%746 Real estate 226 129 50 47 20 4 88 17 43% 2% 7% 52%806 Advertising 26 13 9 4 1 0 12 0 50% 0% 0% 50%807 Accounting, auditing, and bookkeeping services 102 52 37 13 63 24 �25 �9 49% 23% �9% 63%808 Misc business services 443 214 154 74 62 19 102 31 52% 4% 7% 63%879 Legal services 145 95 40 11 88 15 �7 �1 35% 10% �1% 44%898 Engineering and architectural services 84 53 20 11 17 4 27 6 37% 4% 7% 48%
Personal services 3,851 2,350 678 823 2,001 628 �213 �67 39% 16% �2% 54%816 Auto repair services and garages 342 232 77 33 32%817 Misc repair services 224 130 46 48 208 65 �109 �34 42% 29% �15% 56%826 Private households 1,728 1,135 244 350 1,331 360 �438 �118 34% 21% �7% 48%836 Hotels and lodging places 507 291 91 125 100 20 143 28 43% 4% 6% 52%846 Laundering, cleaning, and dyeing 204 111 43 51 47 12 41 11 46% 6% 5% 57%847 Dressmaking shops 242 135 65 43 200 125 �117 �73 44% 52% �30% 66%848 Shoe repair shops 76 22 5 49 3 1 12 5 72% 2% 7% 80%849 Misc personal services 300 173 51 76 65 26 58 23 42% 9% 8% 59%857 Theaters and motion pictures 115 65 28 21 43%858 Bowling alleys, and billiard and pool parlors 35 20 7 8 2 1 12 5 45% 2% 15% 62%859 Misc entertainment and recreation services 77 39 20 19 47 18 �19 �7 50% 23% �9% 64%
0
Social services 2,782 1,782 676 324 707 128 803 145 36% 5% 5% 46%868 Medical and other health services, except hospitals 319 204 73 42 148 13 39 3 36% 4% 1% 41%869 Hospitals 169 90 44 34 1 0 67 22 46% 0% 13% 60%888 Educational services 978 686 226 66 308 64 260 54 30% 7% 6% 42%896 Welfare and religious services 206 120 41 46 84 15 18 3 42% 7% 2% 51%897 Nonprofit membership organizs 39 24 11 4 2 0 20 2 39% 0% 6% 45%899 Misc professional and related 34 18 9 8 12 2 3 0 48% 7% 1% 57%906 Postal service 217 148 55 14 33 5 96 14 32% 2% 6% 40%916 Federal public administration 362 243 80 39 41 11 151 39 33% 3% 11% 47%926 State public administration 30 20 8 3 5 1 11 3 34% 4% 9% 46%
(continued on next page)
C.Hirschm
an,E.Mogford
/SocialScience
Research
38(2009)
897–920
911

Author's personal copy
Table 2 (continued)
Actual 1920 Workforce(in thousands)
Expected Workforce in 1920 Shift (Actual-expected) Share of 1920 labor force from:
Immigrant Generation 4th + Gen 3rd Gen 4th + Gen 3rd Gen From 1920 From1880 2nd Gen Total
Total 3rd + 2nd 1st Based on 1880: Based on 1880: 1st & 2nd Expected Shift Imm. Share
3+ Gen 2nd Gen 3+ Gen 2nd Gen1 2 3 4 5 6 7 8 9 10 11 12
(r � 1880 3rd +) (r � 1880 2nd) (3+4)/(1) (6/1) (8/1) (9+10+11)
936 Local public administration 429 230 131 68 73 16 116 26 46% 4% 6% 56%
Total work force (Gainful workers) 40,519 24232 8,314 7973 20,150 4082 0 0 40% 10% 0% 50%
Notes: (1) The generational composition of each industrial sector is estimated in two steps:a). Growth: The expected 1920 workers in each industry is assumed to be proportional to the national growth rate appied to the number of 1880 workers in the industry:–the 1920 4th and higher generation is assumed to be the descendants of the 1880 3rd and higher generations in that industry – the 1920 3rd generation is assumed to be the descendants of the 1880 2ndgeneration in that industry–the 1920 3rd generation is assumed to be the descendants of the 1880 2nd generation in that industryb) Shift: The difference between the actual 1920 3rd and higher number in each industry and the expected based on assumed GROWTH– the estimated SHIFT for the 1920 3rd and higher generations is allocated proportional to the relative size of the 3rd and higher and 2nd generations in 1880.(2). Columns 1, 2, 3 and 4 are the actual number (in thousands) of gainful workers in each industry, by immigrant generation (3rd & higher, 2nd, and 1st) in 1920.(3). Columns 5 and 6 are the expected number of gainful workers in each industry in 1920 assuming proportional change from the the 1880 2nd & higher gen in to the 1920 3rd and higher gen:
a) Col 5: Expected 1920 gainful workers in each industry from 1880 3rd and higher gen workers = r � 1880 3rd and higher gen workers in the industry.b) Col 6: Expected 1920 gainful workers in each industry from 1880 2nd gen workers = r � 1880 2nd gen workers in the industry where r = the ratio of total 3rd and higher gen wokers in 1920 to the 1880 total
2nd gen and higher workers(4) Columns 7 and 8 are the Shift of Workers (Actual – Expected) from 1880 to 1920 in each industry, assuming that the 1920 3rd and higher gen workers ‘‘inherit” the industry composition of the 2nd & higher genworkers in 1880. The expected 1920 workers are distributed proportionally to the 1880 generations of 3rd and higher and 2nd.:
(a) Col 7: The proportional share of the 1920 3rd gen & higher actual workers in each industry minus the expected 1920 ‘‘descendants” of the 1880 2nd and higher generation workers.(b) Col 8: The proportional share of the 1920 3rd gen and higher actual workers in each industry minus the expected 1920 ‘‘descendants” of the 1880 2nd and higher generation workers.
Sources: 1880 and 1920 PUMS from Ruggles et al. (2004)
912C.H
irschman,E.M
ogford/Social
ScienceR
esearch38
(2009)897–
920
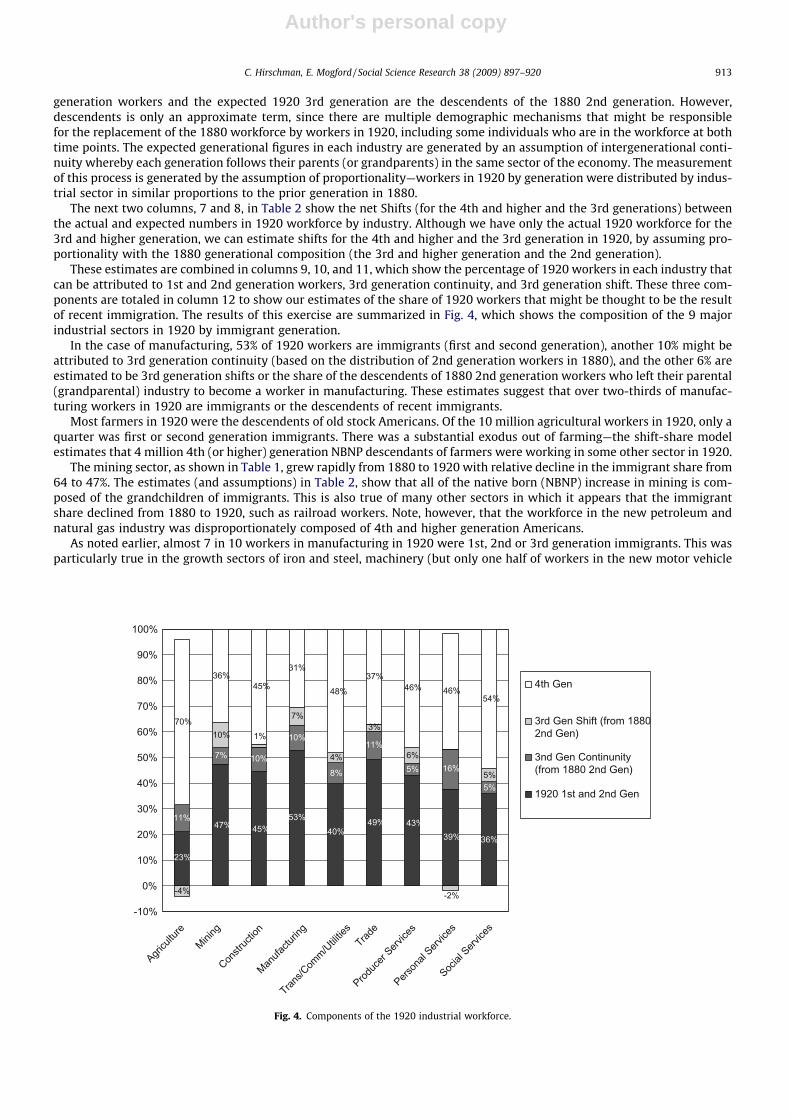
Author's personal copy
generation workers and the expected 1920 3rd generation are the descendents of the 1880 2nd generation. However,descendents is only an approximate term, since there are multiple demographic mechanisms that might be responsiblefor the replacement of the 1880 workforce by workers in 1920, including some individuals who are in the workforce at bothtime points. The expected generational figures in each industry are generated by an assumption of intergenerational conti-nuity whereby each generation follows their parents (or grandparents) in the same sector of the economy. The measurementof this process is generated by the assumption of proportionality—workers in 1920 by generation were distributed by indus-trial sector in similar proportions to the prior generation in 1880.
The next two columns, 7 and 8, in Table 2 show the net Shifts (for the 4th and higher and the 3rd generations) betweenthe actual and expected numbers in 1920 workforce by industry. Although we have only the actual 1920 workforce for the3rd and higher generation, we can estimate shifts for the 4th and higher and the 3rd generation in 1920, by assuming pro-portionality with the 1880 generational composition (the 3rd and higher generation and the 2nd generation).
These estimates are combined in columns 9, 10, and 11, which show the percentage of 1920 workers in each industry thatcan be attributed to 1st and 2nd generation workers, 3rd generation continuity, and 3rd generation shift. These three com-ponents are totaled in column 12 to show our estimates of the share of 1920 workers that might be thought to be the resultof recent immigration. The results of this exercise are summarized in Fig. 4, which shows the composition of the 9 majorindustrial sectors in 1920 by immigrant generation.
In the case of manufacturing, 53% of 1920 workers are immigrants (first and second generation), another 10% might beattributed to 3rd generation continuity (based on the distribution of 2nd generation workers in 1880), and the other 6% areestimated to be 3rd generation shifts or the share of the descendents of 1880 2nd generation workers who left their parental(grandparental) industry to become a worker in manufacturing. These estimates suggest that over two-thirds of manufac-turing workers in 1920 are immigrants or the descendents of recent immigrants.
Most farmers in 1920 were the descendents of old stock Americans. Of the 10 million agricultural workers in 1920, only aquarter was first or second generation immigrants. There was a substantial exodus out of farming—the shift-share modelestimates that 4 million 4th (or higher) generation NBNP descendants of farmers were working in some other sector in 1920.
The mining sector, as shown in Table 1, grew rapidly from 1880 to 1920 with relative decline in the immigrant share from64 to 47%. The estimates (and assumptions) in Table 2, show that all of the native born (NBNP) increase in mining is com-posed of the grandchildren of immigrants. This is also true of many other sectors in which it appears that the immigrantshare declined from 1880 to 1920, such as railroad workers. Note, however, that the workforce in the new petroleum andnatural gas industry was disproportionately composed of 4th and higher generation Americans.
As noted earlier, almost 7 in 10 workers in manufacturing in 1920 were 1st, 2nd or 3rd generation immigrants. This wasparticularly true in the growth sectors of iron and steel, machinery (but only one half of workers in the new motor vehicle
36%
11%
7% 10%8%
11%
5% 16%
5%
-4%
7%
4%
3%
6%
5%
31%
49% 43%39%40%
53%45%47%
23%
10%
-2%
10% 1%
54%46%45%
37%36%
48%
70%
46%
-10%
0%
10%
20%
30%
40%
50%
60%
70%
80%
90%
100%
Agricu
lture
Mining
Constr
uctio
n
Manufa
cturin
g
Trans/C
omm/U
tilities
Trade
Produc
er Serv
ices
Person
al Serv
ices
Social
Service
s
4th Gen
3rd Gen Shift (from 18802nd Gen)
3nd Gen Continunity(from 1880 2nd Gen)
1920 1st and 2nd Gen
Fig. 4. Components of the 1920 industrial workforce.
C. Hirschman, E. Mogford / Social Science Research 38 (2009) 897–920 913
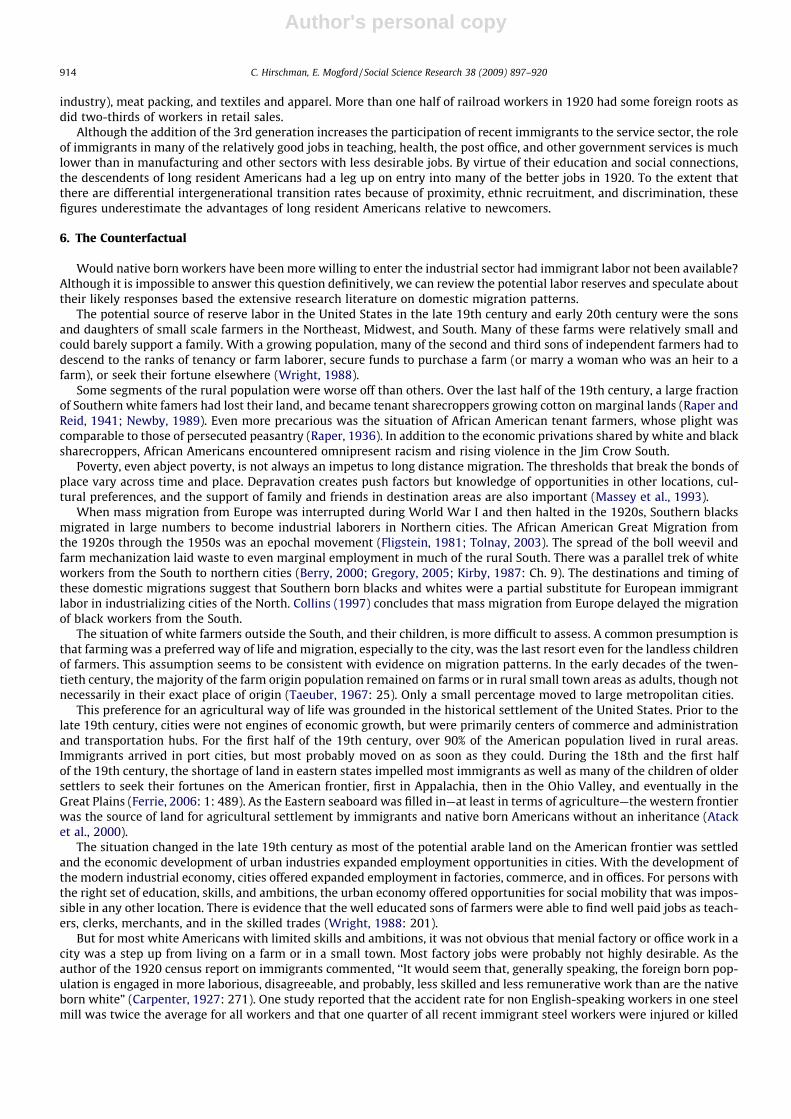
Author's personal copy
industry), meat packing, and textiles and apparel. More than one half of railroad workers in 1920 had some foreign roots asdid two-thirds of workers in retail sales.
Although the addition of the 3rd generation increases the participation of recent immigrants to the service sector, the roleof immigrants in many of the relatively good jobs in teaching, health, the post office, and other government services is muchlower than in manufacturing and other sectors with less desirable jobs. By virtue of their education and social connections,the descendents of long resident Americans had a leg up on entry into many of the better jobs in 1920. To the extent thatthere are differential intergenerational transition rates because of proximity, ethnic recruitment, and discrimination, thesefigures underestimate the advantages of long resident Americans relative to newcomers.
6. The Counterfactual
Would native born workers have been more willing to enter the industrial sector had immigrant labor not been available?Although it is impossible to answer this question definitively, we can review the potential labor reserves and speculate abouttheir likely responses based the extensive research literature on domestic migration patterns.
The potential source of reserve labor in the United States in the late 19th century and early 20th century were the sonsand daughters of small scale farmers in the Northeast, Midwest, and South. Many of these farms were relatively small andcould barely support a family. With a growing population, many of the second and third sons of independent farmers had todescend to the ranks of tenancy or farm laborer, secure funds to purchase a farm (or marry a woman who was an heir to afarm), or seek their fortune elsewhere (Wright, 1988).
Some segments of the rural population were worse off than others. Over the last half of the 19th century, a large fractionof Southern white famers had lost their land, and became tenant sharecroppers growing cotton on marginal lands (Raper andReid, 1941; Newby, 1989). Even more precarious was the situation of African American tenant farmers, whose plight wascomparable to those of persecuted peasantry (Raper, 1936). In addition to the economic privations shared by white and blacksharecroppers, African Americans encountered omnipresent racism and rising violence in the Jim Crow South.
Poverty, even abject poverty, is not always an impetus to long distance migration. The thresholds that break the bonds ofplace vary across time and place. Depravation creates push factors but knowledge of opportunities in other locations, cul-tural preferences, and the support of family and friends in destination areas are also important (Massey et al., 1993).
When mass migration from Europe was interrupted during World War I and then halted in the 1920s, Southern blacksmigrated in large numbers to become industrial laborers in Northern cities. The African American Great Migration fromthe 1920s through the 1950s was an epochal movement (Fligstein, 1981; Tolnay, 2003). The spread of the boll weevil andfarm mechanization laid waste to even marginal employment in much of the rural South. There was a parallel trek of whiteworkers from the South to northern cities (Berry, 2000; Gregory, 2005; Kirby, 1987: Ch. 9). The destinations and timing ofthese domestic migrations suggest that Southern born blacks and whites were a partial substitute for European immigrantlabor in industrializing cities of the North. Collins (1997) concludes that mass migration from Europe delayed the migrationof black workers from the South.
The situation of white farmers outside the South, and their children, is more difficult to assess. A common presumption isthat farming was a preferred way of life and migration, especially to the city, was the last resort even for the landless childrenof farmers. This assumption seems to be consistent with evidence on migration patterns. In the early decades of the twen-tieth century, the majority of the farm origin population remained on farms or in rural small town areas as adults, though notnecessarily in their exact place of origin (Taeuber, 1967: 25). Only a small percentage moved to large metropolitan cities.
This preference for an agricultural way of life was grounded in the historical settlement of the United States. Prior to thelate 19th century, cities were not engines of economic growth, but were primarily centers of commerce and administrationand transportation hubs. For the first half of the 19th century, over 90% of the American population lived in rural areas.Immigrants arrived in port cities, but most probably moved on as soon as they could. During the 18th and the first halfof the 19th century, the shortage of land in eastern states impelled most immigrants as well as many of the children of oldersettlers to seek their fortunes on the American frontier, first in Appalachia, then in the Ohio Valley, and eventually in theGreat Plains (Ferrie, 2006: 1: 489). As the Eastern seaboard was filled in—at least in terms of agriculture—the western frontierwas the source of land for agricultural settlement by immigrants and native born Americans without an inheritance (Atacket al., 2000).
The situation changed in the late 19th century as most of the potential arable land on the American frontier was settledand the economic development of urban industries expanded employment opportunities in cities. With the development ofthe modern industrial economy, cities offered expanded employment in factories, commerce, and in offices. For persons withthe right set of education, skills, and ambitions, the urban economy offered opportunities for social mobility that was impos-sible in any other location. There is evidence that the well educated sons of farmers were able to find well paid jobs as teach-ers, clerks, merchants, and in the skilled trades (Wright, 1988: 201).
But for most white Americans with limited skills and ambitions, it was not obvious that menial factory or office work in acity was a step up from living on a farm or in a small town. Most factory jobs were probably not highly desirable. As theauthor of the 1920 census report on immigrants commented, ‘‘It would seem that, generally speaking, the foreign born pop-ulation is engaged in more laborious, disagreeable, and probably, less skilled and less remunerative work than are the nativeborn white” (Carpenter, 1927: 271). One study reported that the accident rate for non English-speaking workers in one steelmill was twice the average for all workers and that one quarter of all recent immigrant steel workers were injured or killed
914 C. Hirschman, E. Mogford / Social Science Research 38 (2009) 897–920
Author's personal copy
(Brody 1960: 100-101). Most historical and comparative studies conclude that the process of industrialization was a pro-foundly alienating experience for most workers (Kerr et al. 1964: Chapter 6, Rodgers 1981). Factories that tried to imposeindustrial discipline were plagued by high rates of absenteeism and turnover.
The children of farmers who left farming were disproportionately represented in the lower rungs of the occupational hier-archy (Freedman and Freedman 1956; Blau and Duncan 1967: 28). In addition to the loss of autonomy in factory employ-ment, migrants from farm families had to give up the familiarity of family and friends and the economic security of foodproduction. If forced to migrate, many native born white Americans from rural or small towns may have preferred to seektheir fortune in the West than to join the ranks of the urban proletariat in industrializing cities. In the late 19th and early20th century long distance (interstate) migration was much more likely to lead to greater occupational mobility than shortdistance moves (Ferrie, 2005: 213).
Almost 90% of native-born white inter-state migrants went to rural areas during the 19th century, and the proportionmigrating to cities remained modest in the early decades of the 20th century (Hall and Ruggles, 2004). Similar patternsare also evident in Table 3, which shows net lifetime migration of African Americans and of whites by nativity for each dec-ade from 1870 to 1950. The rapidly expanding industrial economy of the North and Midwest drew disproportionately onimmigrant labor and then on African American workers from the South. From 1870 to 1920, the population growth of theNortheast and Midwest included almost 14 million immigrants, but there was negative net migration of 2.5 million nativeborn whites out of the region. Following the closing of the immigration door, more than 2.5 million African American netmigrants (from the South) were added to the population of the Northeast and Midwest from 1920 to 1950, while therewas a continuing exodus of native born whites from the region (3.3 million from 1920 to 1950).
Examining these data, Hatton and Williamson (1998): (164-173) conclude that the competition with immigrants for jobslowered the wages of the native born (or slowed their rate of increase) and that native born workers were crowded-out fromurban labor markets in the Northeast and Midwest. In a detailed empirical study of the relationship between immigrant con-centrations, manufacturing wages, and the inter-state (and inter-county) migration of the native born, Carter and Sutch(2006) find no support for Hatton and Williamson’s claims that the presence of immigrants lowered the wages and ‘‘crowdedout” native born workers in industrial labor markets.11
Wages, adjusted for cost of living, rose for manufacturing workers and unskilled workers during the age of immigration(Rees, 1961; Margo, 2006). Moreover, Carter and Sutch (2006) show that there is a positive correlation between the desti-nations of immigrants and native born workers from 1900 to 1910. Rural laborers, both native-born and from abroad, wereresponding to declining prospects in their places of origin and to the new opportunities in the same destinations.
Many native born workers did go to the industrial cities, but many more sought their fortune in the West. The majority ofimmigrants, and the African Americans that followed them, settled in the industrial cities of the Northeast and Midwest. The will-ingness of immigrants and African Americans to work in the lowest rungs of urban employment may have been largely due to thelack of better alternatives. Most immigrants had been pushed out of their places of origin and had to brave considerable costs andhardship to emigrate to the United States. The fact that one-third of European immigrants from 1908 to 1923 returned to Europeis testimony of the difficulties of adjusting to life and of finding employment in industrializing America (Wyman 1993: 10).
Although industrial wages continued to rise during the age of industrialization and immigration, it seems that the pre-vailing wages, working conditions, and urban life were not sufficiently attractive to many native born workers who had so-cial attachments and security, if not prosperity, in their places of origin. Immigrants and their children remained themainstay of industrial labor until the 1920s. Perhaps higher wages and better working conditions were necessary to attracta sufficient supply of domestic labor to work in the steel mills, stockyards, and other sectors of the industrial economy in themiddle decades of the 20th century.
7. Discussion and Conclusions
As the American industrial revolution spread in the late 19th century and the early decades of the 20th century, the Uni-ted States passed Great Britain to become the most productive industrial nation in the world (Romer 1996). In one of themost widely cited studies of this transition, Wright (1990) identifies a number of factors, including the discovery and devel-opment of mineral resources (coal, iron, petroleum, copper, and others) and the export of high quality producer goods as keyto the American industrial development and rapid economic growth. Other researchers have emphasized the significance ofthe early American investment in human capital and the spread of public schooling as the primary reason for the ascendanceof the American economy during the age of industrialization. In an interesting aside, Wright (1990: 662) notes that most ofthe workers in the heavy industries were not well educated native born Americans, but immigrants who were not particu-larly well educated by world standards. He goes on to say, ‘‘Key industries like iron and steel and motor vehicles paid highwages to unskilled workers (who were nonetheless much cheaper than the skilled craft workers used with older technolo-gies) presumably because it was rough, disagreeable, demanding work, and because it was vital to have an ample excess la-bor supply available” (Wright, 1990: 662).
In this study, we have estimated the representation of the immigrant population, including the children and grandchil-dren of immigrants, in the industrial transformation of the American workforce from 1880 to 1920. This exercise involves a
11 A less technical version of Carter and Sutch’s working paper is available from the Social Science Research Council website (Carter and Sutch, 2007).
C. Hirschman, E. Mogford / Social Science Research 38 (2009) 897–920 915
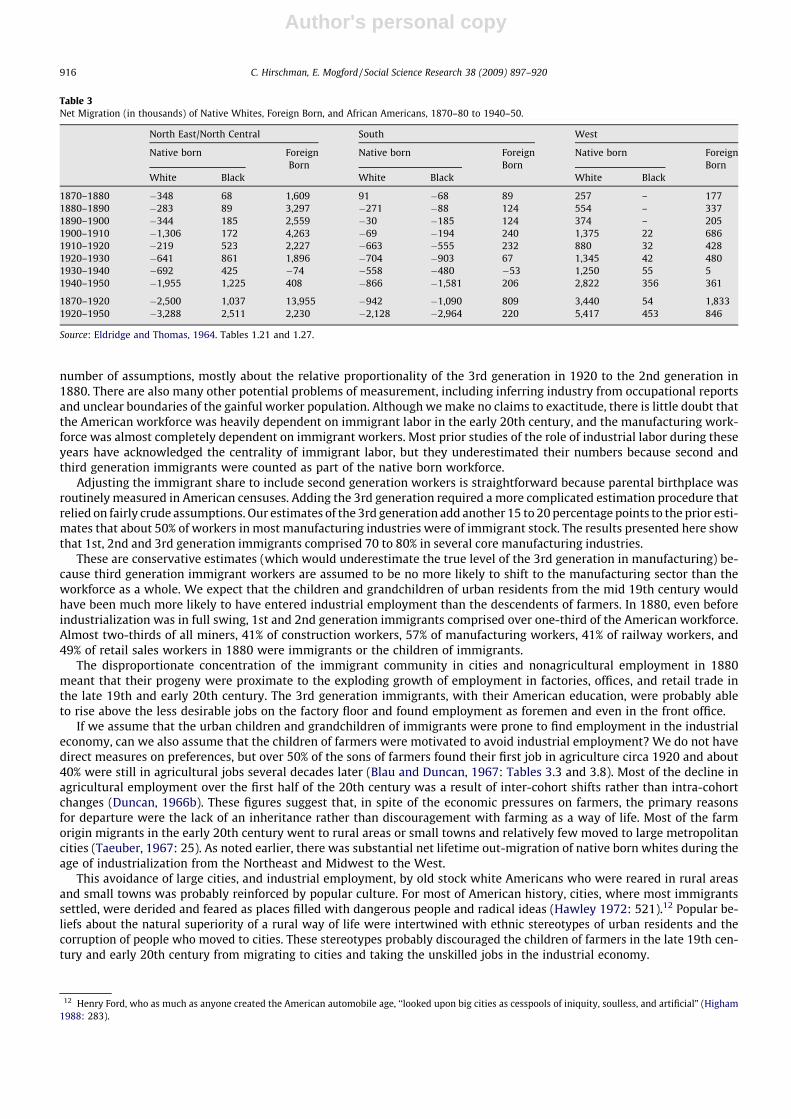
Author's personal copy
number of assumptions, mostly about the relative proportionality of the 3rd generation in 1920 to the 2nd generation in1880. There are also many other potential problems of measurement, including inferring industry from occupational reportsand unclear boundaries of the gainful worker population. Although we make no claims to exactitude, there is little doubt thatthe American workforce was heavily dependent on immigrant labor in the early 20th century, and the manufacturing work-force was almost completely dependent on immigrant workers. Most prior studies of the role of industrial labor during theseyears have acknowledged the centrality of immigrant labor, but they underestimated their numbers because second andthird generation immigrants were counted as part of the native born workforce.
Adjusting the immigrant share to include second generation workers is straightforward because parental birthplace wasroutinely measured in American censuses. Adding the 3rd generation required a more complicated estimation procedure thatrelied on fairly crude assumptions. Our estimates of the 3rd generation add another 15 to 20 percentage points to the prior esti-mates that about 50% of workers in most manufacturing industries were of immigrant stock. The results presented here showthat 1st, 2nd and 3rd generation immigrants comprised 70 to 80% in several core manufacturing industries.
These are conservative estimates (which would underestimate the true level of the 3rd generation in manufacturing) be-cause third generation immigrant workers are assumed to be no more likely to shift to the manufacturing sector than theworkforce as a whole. We expect that the children and grandchildren of urban residents from the mid 19th century wouldhave been much more likely to have entered industrial employment than the descendents of farmers. In 1880, even beforeindustrialization was in full swing, 1st and 2nd generation immigrants comprised over one-third of the American workforce.Almost two-thirds of all miners, 41% of construction workers, 57% of manufacturing workers, 41% of railway workers, and49% of retail sales workers in 1880 were immigrants or the children of immigrants.
The disproportionate concentration of the immigrant community in cities and nonagricultural employment in 1880meant that their progeny were proximate to the exploding growth of employment in factories, offices, and retail trade inthe late 19th and early 20th century. The 3rd generation immigrants, with their American education, were probably ableto rise above the less desirable jobs on the factory floor and found employment as foremen and even in the front office.
If we assume that the urban children and grandchildren of immigrants were prone to find employment in the industrialeconomy, can we also assume that the children of farmers were motivated to avoid industrial employment? We do not havedirect measures on preferences, but over 50% of the sons of farmers found their first job in agriculture circa 1920 and about40% were still in agricultural jobs several decades later (Blau and Duncan, 1967: Tables 3.3 and 3.8). Most of the decline inagricultural employment over the first half of the 20th century was a result of inter-cohort shifts rather than intra-cohortchanges (Duncan, 1966b). These figures suggest that, in spite of the economic pressures on farmers, the primary reasonsfor departure were the lack of an inheritance rather than discouragement with farming as a way of life. Most of the farmorigin migrants in the early 20th century went to rural areas or small towns and relatively few moved to large metropolitancities (Taeuber, 1967: 25). As noted earlier, there was substantial net lifetime out-migration of native born whites during theage of industrialization from the Northeast and Midwest to the West.
This avoidance of large cities, and industrial employment, by old stock white Americans who were reared in rural areasand small towns was probably reinforced by popular culture. For most of American history, cities, where most immigrantssettled, were derided and feared as places filled with dangerous people and radical ideas (Hawley 1972: 521).12 Popular be-liefs about the natural superiority of a rural way of life were intertwined with ethnic stereotypes of urban residents and thecorruption of people who moved to cities. These stereotypes probably discouraged the children of farmers in the late 19th cen-tury and early 20th century from migrating to cities and taking the unskilled jobs in the industrial economy.
Table 3Net Migration (in thousands) of Native Whites, Foreign Born, and African Americans, 1870–80 to 1940–50.
North East/North Central South West
Native born ForeignBorn
Native born ForeignBorn
Native born ForeignBorn
White Black White Black White Black
1870–1880 �348 68 1,609 91 �68 89 257 – 1771880–1890 �283 89 3,297 �271 �88 124 554 – 3371890–1900 �344 185 2,559 �30 �185 124 374 – 2051900–1910 �1,306 172 4,263 �69 �194 240 1,375 22 6861910–1920 �219 523 2,227 �663 �555 232 880 32 4281920–1930 �641 861 1,896 �704 �903 67 1,345 42 4801930–1940 �692 425 �74 �558 �480 �53 1,250 55 51940–1950 �1,955 1,225 408 �866 �1,581 206 2,822 356 361
1870–1920 �2,500 1,037 13,955 �942 �1,090 809 3,440 54 1,8331920–1950 �3,288 2,511 2,230 �2,128 �2,964 220 5,417 453 846
Source: Eldridge and Thomas, 1964. Tables 1.21 and 1.27.
12 Henry Ford, who as much as anyone created the American automobile age, ‘‘looked upon big cities as cesspools of iniquity, soulless, and artificial” (Higham1988: 283).
916 C. Hirschman, E. Mogford / Social Science Research 38 (2009) 897–920

Author's personal copy
The continued demand for unskilled labor in industrial cities after the cutoff of immigration in the 1920s certainlyplayed a major role in continuing, if not originating, the African American Great Migration from the 1920s to the1960s (Collins, 1997; Tolnay, 2003). There was also a parallel wave of Southern white labor to Northern industrial citiesthat began during World War I and grew during the 1920s, 1940s, and 1950s (Berry, 2000; Gregory, 2005). If there hadnot been the massive wave of European immigration from 1880 to 1920, the demand for labor may have started earlierand drew even larger numbers from the dispossessed Southern peasantry. There is substantial literature on the povertyand hardships of sharecroppers and tenant farmers, both black and white in the rural south (Raper, 1936, 1943; Raperand Reid, 1941).
However, the scale of the demand for industrial employment from 1880 to 1920 might have overwhelmed the potentiallabor reserves. For readers who may not accept the assumptions used to pad our estimate of the impact of immigration with2.8 million 3rd generation workers in 1920, there were still 5.3 million 1st and 2nd generation workers in manufacturing(directly measured in the 1920 census). Replacing these 5.3 million immigrant workers in manufacturing would have re-quired shifting one-quarter of all 3rd and higher generation workers in 1920 from other sectors to manufacturing.13 Toaccomplish even some fraction of this would have required much greater incentives, both in terms of pay and working condi-tions, than those offered to immigrants. Without immigrant labor, it seems unlikely that the American industrial revolutionwould have been achieved at the same pace, scale, and profitability that it did. Our claim is not that immigrant labor causedthe American industrial revolution; there were a number of factors that played an important role in this epochal process. Immi-grant labor, however, may well have been a necessary condition for the pace and scale of the rise of the manufacturing sectorfrom 1880 to 1920.
Appendix A
Industry classification used in this study.
Agriculture
Mining206 Metal mining216 Coal mining226 Crude petroleum and natural gas extraction236 Nonmettalic mining and quarrying, except fuel
246 Construction
Manufacturing306-326 Wood and Mineral Products (incl. logging/sawmills)Metals (Steel and Iron)
336 Blast furnaces, steel works, & rolling mills337 Other primary iron and steel industries338 Primary nonferrous industries346 Fabricated steel products347 Fabricated nonferrous metal products348 Not specified metal industries
Machinery356 Agricultural machinery and tractors357 Office and store machines358 Misc machinery367 Electrical machinery, equipment and supplies376 Motor vehicles and motor vehicle equipment378 Ship and boat building and repairing379 Railroad and misc transportation equipment406-429 Food & Tobacco
Textiles/Footwear/Leather436 Knitting mills437 Dyeing and finishing textiles, except knit goods438 Carpets, rugs, and other floor coverings439 Yarn, thread, and fabric
(continued on next page)
13 There were 24.3 million NBNP workers in 1920 and 4.7 were already employed in manufacturing. The 5.3 million immigrant (1st and 2nd generation)workers in manufacturing are 27.2 % of the 19.5 million non-manufacturing NBNP workers.
C. Hirschman, E. Mogford / Social Science Research 38 (2009) 897–920 917

Author's personal copy
Appendix A (continued)
446 Misc textile mill products448 Apparel and accessories449 Misc fabricated textile products487 Leather: tanned, curried, and finished488 Footwear, except rubber489 Leather products, except footwear457-459 Paper and Printing466-478 Chemical/Petro/Rubber387-399 & 499 Miscellaneous
Transportation, communication and utilities506 Railroads and railway516 Street railways and bus lines526 Trucking service527 Warehousing and storage536 Taxicab service546 Water transportation578 Telephone579 Telegraph586 Electric light and power587 Gas and steam supply systems
Wholesale and retail trade606-627 Wholesale636-699 Retail
Producer services716 Banking and credit726 Security and commodity brokerage and invest companies736 Insurance746 Real estate806 Advertising807 Accounting, auditing, and bookkeeping services808 Misc business services879 Legal services898 Engineering and architectural services
Personal services816 Auto repair services and garages817 Misc repair services826 Private households836 Hotels and lodging places846 Laundering, cleaning, and dyeing847 Dressmaking shops848 Shoe repair shops849 Misc personal services857 Theaters and motion pictures858 Bowling alleys, and billiard and pool parlors859 Misc entertainment and recreation services
Social services868 Medical and other health services, except hospitals869 Hospitals888 Educational services896 Welfare and religious services897 Nonprofit membership organizs.899 Misc professional and related906 Postal service916 Federal public administration926 State public administration936 Local public administration
918 C. Hirschman, E. Mogford / Social Science Research 38 (2009) 897–920

Author's personal copy
References
Abramovitz, Moses, David, Paul A., 2000. American macroeconomic growth in the era of knowledge-based progress: the long run perspective. In: Engerman,Stanley L., Gallman, Robert E. (Eds.), The Cambridge Economic History of the United States, vol. 3. Cambridge University Press, Cambridge, pp. 1–92.
Atack, Jeremy, Bateman, Fred, Parker, William N., 2000. The farm, the farmer, and the market. In: Engerman, Stanley L., Gallman, Robert E. (Eds.), TheCambridge Economic History of the United States, vol. 2. Cambridge University Press, Cambridge, pp. 245–284.
Bancroft, Gertrude, 1958. The American Labor Force: Its Growth and Changing Composition. John Wiley and Sons, New York.Berry, Chad, 2000. Southern Migrants, Northern Exiles. University of Illinois Press, Urbana.Blau, Peter, Duncan, Otis Dudley, 1967. The American Occupational Structure. Wiley, New York.Brody, David, 1960. Steelworkers in America: The Nonunion Era. Harper, New York.Cahan, Abraham, 1917. The Rise of David Levinsky. Harper and Brothers, New York.Cain, Louis P., 2006. Transportation. In: Carter, Susan B., Gartner, Scott Sigmund, Haines, Michael R., Olmstead, Alan L., Sutch, Richard, Wright, Gavin (Eds.),
Historical Statistics of the United States: Earliest Times to the Present, Millennial Edition. Cambridge University Press, New York. pp. 4-761–4-778.Carpenter, Niles, 1927. Immigrants and Their Children. Census Monograph. Government Printing Office, Washington DC.Carter, Susan, 2006. Labor force. In: Carter, Susan B., Gartner, Scott Sigmund, Haines, Michael R., Olmstead, Alan L., Sutch, Richard, Wright, Gavin (Eds.),
Historical Statistics of the United States: Earliest Times to the Present, Millennial Edition. Cambridge University Press, New York. pp. 2-13–2-35.Carter, Susan, Sutch, Richard, 1999. Historical background to current immigration issues. In: Smith, James P., Edmonston, Barry (Eds.), The Immigration
Debate: Studies on the Economic, Demographic and Fiscal Effects of Immigration. National Academy Press, Washington, DC, pp. 289–366.Carter, Susan and Richard Sutch. 2006. Resident Impacts of Immigration: Perspectives from America’s Age of Mass Migration. Unpublished paper (August 3,
2006). Department of Economics. University of California-Riverside. Downloaded on November 10, 2008 from: http://www.economics.ucr.edu/papers/papers08/08-08.pdf.
Carter, Susan and Richard Sutch. 2007. ‘‘Labor Market Flooding? Migrant Destination and Wage Change during America’s Age of Mass Migration.” Availablefrom the Social Science Research Council ‘‘Border Battles: U.S. Immigration Debates” website at: http://borderbattles.ssrc.org/.
Carter, Susan B., Gartner, Scott Sigmund, Haines, Michael R., Olmstead, Alan L., Sutch, Richard, Wright, Gavin, 2006. Historical Statistics of the United States:Earliest Times to the Present, Millennial Edition. Cambridge University Press, New York.
Chandler, Alfred, 1977. The Visible Hand: The Managerial Revolution in American Business. Harvard University Press, Cambridge.Collins, William J., 1997. When the Tide Turned: Immigration and the Delay of the Great Migration. Journal of Economic History 57, 607–632.Davis, Joseph P., 2006. Index of industrial production. In: Carter, Susan B., Gartner, Scott Sigmund, Haines, Michael R., Olmstead, Alan L., Sutch, Richard,
Wright, Gavin (Eds.), Historical Statistics of the United States: Earliest Times to the Present, Millennial Edition. Cambridge University Press, New York.pp. 3-24–2-25.
Denison, Edward F. 1974. Accounting for United States Economic Growth, 1929–1969. Brookings Institution, Washington, DC.Duncan, Otis Dudley, 1961. A socioeconomic index for all occupations. In: Reiss, Albert J. (Ed.), Occupations and Social Status. Free Press, New York, pp. 109–
138.Duncan, Otis Dudley, 1966a. Methodological issues in the analysis of social mobility. In: Smelser, Neil J., Seymour, Martin Lipset (Eds.), Social Structure and
Mobility in Economic Development. Aldine, Chicago, pp. 51–97.Duncan, Otis Dudley, 1966b. Occupational Trends and Patterns in Net Mobility in the United States. Demography 3, 1–18.Easterlin, Richard, 1968. Population, Labor Force, and Long Swings in Economic Growth: The American Experience. Columbia University Press, New York.Eldridge, Hope T., Thomas, Dorothy Swaine, 1964. Population redistribution and economic growth, United States, 1870–1950. Demographic Analyses and
Interrelations, vol. III. American Philosophical Society, Philadelphia.Engerman, Stanley L., Gallman, Robert E. (Eds.), 2000. The Cambridge Economic History of the United States, vol. 3. Cambridge University Press, Cambridge.Engerman, Stanley L., Sokoloff, Kenneth, 2000. Technology and industrialization, 1790–1914. In: Engerman, Stanley L., Gallman, Robert E. (Eds.), The
Cambridge Economic History of the United States, vol. 2. Cambridge University Press, Cambridge, pp. 367–401.Ferrie, Joseph P., 2005. History lessons: the end of American exceptionalism? mobility in the United States since 1850. The Journal of Economic Perspectives
19, 199–215.Ferrie, Joseph P., 2006. Internal migration. In: Carter, Susan B., Gartner, Scott Sigmund, Haines, Michael R., Olmstead, Alan L., Sutch, Richard, Wright, Gavin
(Eds.), Historical Statistics of the United States: Earliest Times to the Present Millennial Edition. Cambridge University Press, New York, pp. 1:489–494.Fligstein, Neil, 1981. Going North: Migration of Blacks and Whites from the South, 1900–1950. Academic Press, New York.Fogel, Robert William, 1964. Railroads and American Economic Growth: Essays in Econometric History. The Johns Hopkins Press, Baltimore.Freedman, Ronald, Freedman, Deborah, 1956. Farm reared elements in the nonfarm population. Rural Sociology 21, 50–61.Friedberg, Rachel, Hunt, Jennifer, 1995. The impact of immigrants on host country wages, employment and growth. Journal of Economic Perspectives 9, 23–
44.Gallman, Robert, 1977. Human capital in the first eighty years of the Republic: how much did America owe the rest of the world?”. The American Economic
Review: Papers and Proceeedings 67, 27–31.Gibson, Campbell and Kay Jung. 2006. Historical Census Statistics on the Foreign-Born Population of the United States: 1850-2000. Working Paper no. 81.
Washington, D.C.: Population Division, U.S. Bureau of the Census. Accessed at http://www.census.gov/population/www/documentation/twps0081/twps0081.pdf.
Goldin, Claudia, 1994. The political economy of immigration restriction in the United States, 1890 to 1921. In: Goldin, Claudia, Libecap, Gary D. (Eds.), TheRegulated Economy: A Historical Approach to Political Economy. University of Chicago Press, Chicago, pp. 223–257.
Goldin, Claudia, Katz, Lawrence F., 1998. The origins of technology-skill complementarity. The Quarterly Journal of Economics 113, 693–732.Gregory, James, 2005. The Southern Diaspora: How the Migration of Black and White Southerners Transformed America. University of North Carolina Press,
Chapel Hill.Guest, Avery M., 2005. Frontier and urban-industrial explanations of US occupational mobility in the late 1800s. Social Science Research 34, 140–164.Haines, Michael R., 2000. The population of the United States, 1790–1920. In: Engerman, Stanley L., Gallman, Robert E. (Eds.), The Cambridge Economic
History of the United States, vol. 2. Cambridge University Press, Cambridge, pp. 143–205.Hall, Patricia Kelly, Ruggles, Steven, 2004. ‘Restless in the midst of their prosperity’: new evidence on the internal migration of Americans, 1850–2000. The
Journal of American History 91, 829–846.Hatton, Timothy J., Williamson, Jeffrey G., 1998. The Age of Mass Migration: Causes and Economic Impact. Oxford University Press, New York.Hawley, Amos, 1972. Population density and the city. Demography 9, 521–529.Higham, John 1988. (original publication 1955). Strangers in the Land: Patterns of American Nativism, 1860–1925, Second ed. Rutgers University Press, New
Brunswick.Hounshell, David A., 1984. From the American system to mass production, 1800–1932: the development of manufacturing technology in the United States.
The Johns Hopkins University Press, Baltimore.Kahan, Arcadius, 1978. Economic opportunities and some pilgrims’ progress: Jewish immigrants from Eastern Europe in the US, 1890–1914. The Journal of
Economic History 38, 235–251.Katz, Michael, Stern, Mark J., 2006. One Nation Divisible: What America Was and What it is Becoming. Russell Sage Foundation, New York.Kerr, Clark, Dunlop, John T., Harbison, Frederick, Myers, Charles A., 1964. Industrialism and Industrial Man. Oxford University Press, New York.Kirby, Jack Temple, 1987. Rural Worlds Lost: The American South, 1920–1960. Louisiana State University Press, Baton Rouge.Kuznets, Simon. 1971a (original publication 1964). Notes on the Pattern of US Economic Growth. In: Robert William Fogel and Stanley L. Engerman (Eds.),
The Reinterpretation of American Economic History, Harper and Row, New York, pp. 17–24.
C. Hirschman, E. Mogford / Social Science Research 38 (2009) 897–920 919

Author's personal copy
Kuznets, Simon. 1971b (original publication 1952). The contribution of immigration to the growth of the labor force. In: Robert William Fogel and Stanley L.Engerman (Eds.), The Reinterpretation of American Economic History. Harper and Row, New York, pp. 396–401.
Lieberson, Stanley, 1980. A Piece of the Pie: Blacks and White Immigrants Since 1880. University of California Press, Berkeley.Margo, Robert A., 2006. Index of money wages for unskilled labor. In: Carter, Susan B., Gartner, Scott Sigmund, Haines, Michael R., Olmstead, Alan L., Sutch,
Richard, Wright, Gavin (Eds.), Historical Statistics of the United States: Earliest Times to the Present, Millennial Edition. Cambridge University Press,New York. pp. 2-256–2-257.
Massey, Douglas, Arnago, Joaquin, Hugo, Graeme, Kouaouci, Ali, Pellegrino, Adela, Edward Taylor, J., 1993. Theories of international migration: a review andappraisal. Population and Development Review 19, 431–466.
Mayer, David, 1989. Midwestern industrialization and the American manufacturing belt in the nineteenth century. Journal of Economic History 49, 921–937.
Muller, Thomas, 1993. Immigrants and the American City. New York University Press, New York.Neal, Larry, Uselding, Paul, 1972. Immigration, a neglected source of American economic growth: 1790–1912. Oxford Economic Papers 24, 68–88.Newby, I.A., 1989. Plain Folk in the New South: Social Change and Cultural Persistence, 1880–1915. Louisiana State University Press, Baton Rouge.Olmstead, Alan L., Rhode, Paul W., 2000. The transformation of northern agriculture. In: Engerman, Stanley L., Gallman, Robert E. (Eds.), The Cambridge
Economic History of the United States, vol. 3. Cambridge University Press, Cambridge, pp. 693–742.Perry, Joseph McGarity, 1978. The Impact of Immigration on Three American Industries, 1865–1914. Arno Press, New York.Raff, Daniel M.G., 2006. Distribution. In: Carter, Susan B., Gartner, Scott Sigmund, Haines, Michael R., Olmstead, Alan L., Sutch, Richard, Wright, Gavin (Eds.),
Historical Statistics of the United States: Earliest Times to the Present Millennial Edition. Cambridge University Press, New York, pp. 707–712.Ransom, Roger L., Sutch, Richard, 1987. Tontine insurance and the Armstrong commission: a case of stifled innovation in the American life insurance
industry. Journal of Economic History 47, 379–390.Raper, Arthur, 1936. Preface to Peasantry. University of North Carolina Press, Chapel Hill.Raper, Arthur, 1943. Tenants of the Almighty. Macmillan, New York.Raper, Arthur, Reid, Ira, 1941. Sharecroppers All. University of North Carolina Press, Chapel Hill.Rees, Albert, 1961. Real Wages in Manufacturing. Princeton University Press, Princeton.Rodgers, Donald T., 1981. Tradition, modernity, and the American industrial worker: reflections and critique. In: Rabb, Theodore K., Rotberg, Robert I. (Eds.),
Industrialization and Urbanization: Studies in Interdisciplinary History. Princeton University Press, Princeton, pp. 217–243.Romer, Paul M., 1996. Why, indeed, in America? theory, history and the origins of modern economic growth. American Economic Review 86, 202–206.Rosenberg, Nathan, 1972. Technology and American Economic Growth. M. E. Sharpe, White Plains, NY.Ruggles, Steven, Matthew Sobek, Trent Alexander, Catherine A. Fitch, Ronald Goeken, Patricia Kelly Hall, Miriam King, and Chad Ronnander. 2004. Integrated
Public Use Microdata Series: Version 3.0 [Machine-readable database]. Minnesota Population Center [producer and distributor], Minneapolis, MN.http://www.ipums.org.
Schachter, Joseph, 1972. Net immigration of gainful workers into the United States, 1870–1930. Demography 9, 87–105.Singelmann, Joachim, 1978. From Agriculture to Services: The Transformation of Industrial Employment. Sage Publications, Beverly Hills.Smith, James P., Edmonston, Barry (Eds.), 1997. The New Americans: Economic, Demographic, and Fiscal Impacts of Immigration. National Academy Press,
Washington, DC.Sobek, Matthew, 2001. New statistics on the US labor force, 1850–1990. Historical Methods 34 (7), 1–87.Sobek, Matthew, 2006. Occupations. In: Carter, Susan B., Gartner, Scott Sigmund, Haines, Michael R., Olmstead, Alan L., Sutch, Richard, Wright, Gavin (Eds.),
Historical Statistics of the United States: Earliest Times to the Present, Millennial Edition, vol. 2. Cambridge University Press, New York, pp. 2:35–39.Sutch, Richard, 2006. Industrial classification. In: Carter, Susan B., Gartner, Scott Sigmund, Haines, MichaelR., Olmstead, Alan L., Sutch, Richard, Wright,
Gavin (Eds.), Historical Statistics of the United States: Earliest Times to the Present, Millennial Edition, vol. 4. Cambridge University Press, New York, pp.3–5.
Taeuber, Irene B., Taeuber, Conrad, 1971. People of the United States in the Twentieth Century. US Government Printing Office, Washington, DC.Taeuber, Karl, 1967. The residential redistribution of farm born cohorts. Rural Sociology 32, 20–36.Thomas, Brinley, 1973. Migration and Economic Growth: A Study of Great Britain and the Atlantic Economy, Second ed. Cambridge University Press,
Cambridge.Tolnay, Stewart, 2003. The African American ‘great migration’ and beyond. Annual Review of Sociology 29, 209–232.Ward, David, 1971. Cities and Immigrants: A Geography of Change in Nineteenth Century America. Oxford University Press, New York.Wright, Gavin, 1988. American agriculture and the labor market; what happened to proletarianization? Agricultural History 62, 182–209.Wright, Gavin, 1990. The origins of American industrial success: 1879–1940. American Economic Review 80, 651–678.Wyman, Mark, 1993. Roundtrip to America, The Immigrants Return to Europe: 1880–1930. Cornell University Press, Ithaca.Zolberg, Aristide R., 2006. A Nation by Design: Immigration Policy in the Fashioning of America. Harvard University Press and the Russell Sage Foundation,
Cambridge.Zunz, Olivier, 1982. The Changing Face of Inequality: Urbanization, Industrial Development, and Immigrants in Detroit, 1880–1920. University of Chicago
Press, Chicago.
920 C. Hirschman, E. Mogford / Social Science Research 38 (2009) 897–920