author's personal copy - korea university · author's personal copy ... since blocking...
TRANSCRIPT

Author's personal copy
GMAD: Graph-based Malware Activity Detection by DNS traffic analysis
Jehyun Lee, Heejo Lee ⇑Division of Computer and Communication Engineering, Korea University, Seoul 136-713, Republic of Korea
a r t i c l e i n f o
Article history:Received 4 August 2013Received in revised form 18 February 2014Accepted 28 April 2014Available online 9 May 2014
Keywords:Malware domain nameDNSBotnetSequential correlationGraph clustering
a b s t r a c t
Malicious activities on the Internet are one of the most dangerous threats to Internet users andorganizations. Malicious software controlled remotely is addressed as one of the most critical methodsfor executing the malicious activities. Since blocking domain names for command and control (C&C) ofthe malwares by analyzing their Domain Name System (DNS) activities has been the most effectiveand practical countermeasure, attackers attempt to hide their malwares by adopting several evasiontechniques, such as client sub-grouping and domain flux on DNS activities. A common feature of therecently developed evasion techniques is the utilization of multiple domain names for render malwareDNS activities temporally and spatially more complex. In contrast to analyzing the DNS activities for asingle domain name, detecting the malicious DNS activities for multiple domain names is not a simpletask. The DNS activities of malware that uses multiple domain names, termed multi-domain malware,are sparser and less synchronized with respect to space and time.
In this paper, we introduce a malware activity detection mechanism, GMAD: Graph-based MalwareActivity Detection that utilizes a sequence of DNS queries in order to achieve robustness against evasiontechniques. GMAD uses a graph termed Domain Name Travel Graph which expresses DNS query sequencesto detect infected clients and malicious domain names. In addition to detecting malware C&C domainnames, GMAD detects malicious DNS activities such as blacklist checking and fake DNS querying. Todetect malicious domain names utilized to malware activities, GMAD applies domain name clusteringusing the graph structure and determines malicious clusters by referring to public blacklists. Throughexperiments with four sets of DNS traffic captured in two ISP networks in the U.S. and South Korea,we show that GMAD detected thousands of malicious domain names that had neither been blacklistednor detected through group activity of DNS clients. In a detection accuracy evaluation, GMAD showedan accuracy rate higher than 99% on average, with a higher than 90% precision and lower than 0:5% falsepositive rate. It is shown that the proposed method is effective for detecting multi-domain malwareactivities irrespective of evasion techniques.
� 2014 Elsevier B.V. All rights reserved.
1. Introduction
Malicious software, namely, malware, is one of the mostsignificant sources of Internet intrusion. Uncountable maliciousactivities caused by malwares, including information theft, DDoSattack, and spamming, are the most critical problems in our infor-mation life. According to the report of an AV vendor, Kaspersky,over 1.5 billion attacks by malwares were observed in 2012, and6.5 million unique malicious domain names were used for theseattacks [1]. In comparison with 2011, the increment of maliciousdomain names in 2012 was 2.5 million. Another estimation resultfor 2013 reports that thousands of new malware web-sites haveappeared each day during the last several years [2].
From the efforts of anti-virus vendors and researchers to com-bat malwares, one of the most effective ways to reduce malwareactivity is to block network access to a remote control server, gen-erally called a command and control (C&C) server. This point ofview, of course, includes the malwares that are not remotely con-trolled but send stolen information to their remote server, as wellas botnet, which are controlled through the C&C servers. In severalsecurity reports [3,4], taking down malwares by blocking the C&Cservers has been shown to achieve an immediate reduction inmalicious activities.
Among the several approaches for detecting malicious remoteservers, Domain Name System (DNS) traffic monitoring has beenemployed in many previous studies [5–12] because of its efficiencyand effectiveness. The DNS is a centralized network point that isessential for using Internet services including the maliciousnetwork activities. As malwares use domain names instead of
http://dx.doi.org/10.1016/j.comcom.2014.04.0130140-3664/� 2014 Elsevier B.V. All rights reserved.
⇑ Corresponding author.E-mail addresses: [email protected] (J. Lee), [email protected] (H. Lee).
Computer Communications 49 (2014) 33–47
Contents lists available at ScienceDirect
Computer Communications
journal homepage: www.elsevier .com/locate /comcom

Author's personal copy
static IP addresses to access their remote servers, DNS trafficmonitoring is indispensable for detecting malicious servers.
Despite the many studies on malware and malicious domainname detection, recent intelligent malwares can survive even aftertheir C&C domain names are blocked. The main reason for this mal-ware survivability is that the malwares have numbers of alterna-tive C&C domain names. Traditional single domain malwareshave suffered from one-point failure problem. However, the recentmalwares [13–16] overcome the problem by using redundantdomain names for continuing to update the malware binarieswhen their C&C domain names are detected and blocked. Further-more, recent sophisticated malwares not only replace their C&Cdomain names after blocking occurs, but also use various evasiontechniques such as sub-grouping, fake-query and one-timedomain, through the multiple domain names. In this paper, we callthe malware that utilizes multiple domain names for maliciousactivities a multi-domain malware. In order to take down multi-domain malwares effectively, it is important to detect the domainnames in their entirety against the evasion. Unfortunately, themethods proposed in previous studies considered a single domainname and limited patterns of multi-domain such as randomdomain names, so that they are not robust enough to combat eva-sion techniques that use multi-domains.
In this paper, we propose a malware activity detection mecha-nism, GMAD: Graph-based Malware Activity Detection, which usesthe sequential correlation between domain names. GMAD detectsmalicious domain names used for malicious activities. Sequentialcorrelation is a spatial property among domain names, caused bythe query patterns of DNS clients. We express the sequential corre-lation of domain names on a graph structure called DNTG: DomainName Travel Graph, which was proposed in our preliminary work[17]. Using the graph expression, the proposed mechanism can findsuspicious domain names that have a high sequential correlationwith a known malicious domain name. In this way, our mechanismdetects malware domain names that have not yet been detectedand are not included in domain black lists.
Sequential correlation, which is the DNS behavior property usedin GMAD, is a spatial property that is robust against the malwaresthat evade legacy detection methods. Malware activity detectionmechanisms can be classified into two categories according tothe kind of properties of malware behaviors: temporal propertiesand spatial properties. Temporal properties, such as DNS querytiming synchronicity, have a weakness when combatting the eva-sion techniques mentioned above. On the other hand, comparedwith other approaches that use a spatial property, sequential cor-relation is much less influenced by the number of queries, infectedhosts, and activities of the legitimate users. This advantage allowsthe malicious domains that are queried at a low rate by lessinfected hosts that have not been covered by legacy detectionmethods to be detected. Several evasion techniques, such as sub-grouping [16] and one-time domain using domain generation[13–15], can be used for bypassing legacy detection methodsthrough a low query rate during the monitoring time and fewon-line hosts. Consequently, our mechanism has the advantagethat it can take down malwares more effectively by detecting themalware domains that, due to temporal and spatial evasion tech-niques, are not covered by legacy malware domain detectionapproaches.
In our experiments with real network DNS traffic, GMAD showsits ability to detect thousands of malware domain names. The DNStraffic is gathered from DNS servers of ISPs in Korea and the U.S. Indetection accuracy evaluation, GMAD shows an accuracy ratehigher than 99% on average with a precision rate higher than over90% and a false positive rate lower than 0:5%. In terms of detectionsensitivity, GMAD detects twenty-eight times more maliciousdomain names than one of the most sophisticated malicious
domain detection methods, BotGAD [8,9], in experiments usingthe same data set. The source of GMAD’s superior performance isin that it detects sparse and low-rate malware activities that havenot been detected by the previous approaches.
Through GMAD, we achieve a sensitive detection that has notbeen achieved in previous studies. Against the temporal and spatialevasion techniques of the recent intelligent malwares, GMAD accu-rately detects malicious domain names that are used at a low rateand by a few infected machines. Its detection sensitivity allows ofGMAD to respond effectively to rapidly increasing numbers of mali-cious domain names and malwares. In terms of efficiency, GMADachieves scalable malware detection in huge network environ-ments. Through our experiments with real-world ISP level DNSdata, we evaluated that GMAD successfully detects malwares inthe wild that use various DNS query patterns and evasion tech-niques and efficiently works in large and complex networkenvironments.
The rest of this paper is as follows. In Section 2, we review theprevious efforts for combating malwares by detecting their inher-ent features of network behaviors, and we point out advantage ofour proposal. Before the explanation for GMAD mechanism, weintroduce our behavior property, i.e., sequential correlation, andhow sequential correlation is used for solving several faced prob-lems in comparison with previously proposed behavior properties,in Section 3. We explain detailed processes of GMAD with algo-rithms in Section 4. In Section 5, we evaluate the performance ofGMAD in terms of accuracy and sensitivity using real world DNStraffic. After that, we analyze the effects of heuristic clusteringmetrics and data dependent features in experiment results forthe best configuration, and scalability of GMAD in Section 6. InSection 7, we discuss several issues we should consider. Finally,we conclude this paper in Section 8.
2. Related work
The DNS has been considered a monitoring place to detect mal-ware activity. As compared with other approaches, DNS monitor-ing has advantages when faced with encrypted protocols andchange of traffic behavior. Previous work can be classified intotwo categories; DNS monitoring approaches for malware detectionand graph-based approaches for malware and malicious domainname/URL detection.
DNS monitoring approaches, such as BotGAD [8], Pleiades [11],Bayesian DNS traffic similarity based detection [18], BotSniffer [19],and the black list extension mechanism using DNS queries [10],have been studied in several ways. DNS-based approaches sharethe advantages of robustness against encrypted communicationsand the efficiency of centralized detection. Choi et al. [8,9] distin-guished group activities in DNS traffic from legitimate users activ-ities in a study using the concept of the client set of a domainname. They measured the similarity of the DNS clients of eachdomain name using quantitative likelihood. This approach is coun-tered by recent multi-domain malwares that separate their activi-ties into multiple domain names.
The most recent study of the BotGAD [9] and a DGA detectionapproach of Yadav et al. [12] respond to the multi-domain mal-ware problem by grouping domain names based on the lexical sim-ilarity among the domain names and network features, such ascorresponding IP addresses. However, these approaches still havelimitations when faced with the multi-domain malwares that donot use DGA and have little lexical similarity in their domainnames.
Antonakakis et al.’s botnet C&C detection system [11] used NXdomain names for detecting DGA domain names. Use of DGA isone of the important features of recent malwares. Their DGA
34 J. Lee, H. Lee / Computer Communications 49 (2014) 33–47

Author's personal copy
models are efficient to classify newly generated domain names.However, it could not respond to most of malware DNS activitiesexcept DGA-based C&C queries, because the clustering method ofPleiades was dependent on lexical and structural features ofdomain names. Because DNS activities of malwares are not limitedon C&C communication, detecting DGA that are used only for C&Cdomain names has relatively small detection coverage.
Villamarín-Salomón and Brustoloni [18] proposed a Bayesianmethod for detecting botnet-based DNS traffic. Known botnet,mutations of the botnet, and their fluxed domain names can bedetected by the similarity of their DNS traffic by using this method.However, their study results can be affected by traffic noise frombackground traffic because there is a high possibility of a similarityof DNS traffic in famous domain names. In our study, we appliedthe sequence of queries to the concept of DNS traffic similarity. Ifthe concept of sequence is applied to previously proposed meth-ods, it may enhance their performance.
Guofei et al. [19]’s work focused on the spatial–temporalcorrelation and the similarity of botnet activities for detectingC&C servers. The approach was also based on the automated andrepeated activities of bots. Analysis of the temporal property ofbots is effective for detecting many traditional botnets, but notmodern botnets that use avoidance methods, such as fake queriesand asynchronous DNS queries. The spatial correlation which theyconsidered is a repeated similar pattern, and it can be evaded bythe scattered and randomized query patterns used by recentmalware.
Blacklist extension using the co-occurrence relationshipbetween DNS queries was proposed by Ishibashi et al. [10]. Themajor difference of our method is that a cascading co-occurrenceof DNS queries raises more than only at suspicion about thedomain names. The infected heavy user problem addressed in thisstudy is reduced, because the co-occurrence of domain names que-ried with an irregular sequence carries a low weight in our work.
Several studies have applied the graph structure to botnetdetection. Shishir et al. [20], attempted to distinguish botnetcommunications. In their graph approach, they represented com-munication relationships between bot hosts on a graph. Theirapproach shares several concepts with this study. However, thetype of botnets covered by their method is mainly P2P due to theirfocus and target data.
Yamada et al.’s study [21] applied a temporal relationship andgraph structure to URLs. Our work uses the topological feature ofsub graphs, which is hard to express at the degree of a node, ascompared to analyzing link features. However, the learningapproach that uses link features, which they applied, may be usefulfor expressing node characteristics and automating our detectionmechanism.
Jiang et al. [22] proposed a graph-based suspicious DNS activitydetection method from failed DNS queries. Using failed DNS que-ries is effective to detect abnormal DNS activities, such as domainfluxing and spamming, but it has limitation for detecting maliciousdomain names which are actually working. In addition, the tri-nonnegative matrix factorization algorithm that they used forextracting distinct DNS activities needs too large size of matrix toanalyze much larger DNS traffic which includes valid domainnames efficiently.
John et al. [23] reported a valuable analysis result using theirown system. Their approach and concrete analysis of active botnetare applicable, since they provide data basis for proving the prop-erties of botnet, although the observed results may have a limita-tion in the case of artificially generated malware traffic.
Lastly, our preliminary work [17] proposed a graph structure fordetecting multi-C&C botnets by clustering domain names accord-ing to the number of clients and DNS query density. It showedan ability to tracking continuously generated botnet domain
names which are hard to detect through temporal or spatialsimilarity. In GMAD, we attempts to extend the detection coveragefrom naive botnet activity to complex malware activity which ismore irregular and sparser. GMAD enhances the detection coverageby adopting domain clustering with client sharing in addition tothe simple graph filtering. As a result, we detected more than tentimes of malicious domain names in the same data set, as com-pared with the preliminary work which detected less than fivehundreds of botnet domain names.
Thus, previous studies on detecting malware including botnetare dependent on the temporally and spatially similar DNSactivity patterns, but recent intelligent malware processes nolonger work identically. A malware activity detection methodneeds to consider that different activity patterns generated bythe same malware need to be detected. Another important limita-tion is detection sensitivity. The detection ability of statisticalapproaches using graph analysis or machine learning techniquesis limited to distinguishing dense and regular activities from thelegitimate activities. The malwares that show similar or evensparser DNS activities with a few infected machines should beconsidered.
Our mechanism uses the graphs constructed from DNS moni-toring to detect malware activities. Because most of large scalemalicious activities have been occurred by remotely controlledgroups of malwares, i.e., botnet, previous studies for combattingto botnet share the fundamental problems and responseapproaches with our work.
As compared to the previous studies, our work considers tem-porally and spatially irregular DNS query patterns generated byevasion techniques and adapts a robust property, sequentialcorrelation. Moreover, our graph structure and clustering processwith an increasing threshold provide a wide detection spectrumfrom low-rate malware activity to C&C servers with hundreds ofmulti-domain malware.
3. Malware DNS behavior properties and problems
3.1. Proposed DNS behavior property: sequential correlation
Sequential correlation is the correlation between two domainnames that are queried after or before each other. The degree ofthe sequential correlation is determined by the client sharing ratio(CSR) between the connected domain names. The client sharing isestimated using the Jaccard similarity of query source IP addresses.The CSR formula CSRðv i;v jÞ is defined as Eq. (1), where Cv i
is the setof IP addresses querying a domain v i.
CSRðv i;v jÞ ¼jCv i\ Cv j
jjCv i[ Cv j
j ð1Þ
The higher the CSR the higher the dependency between twodomain names, but the opposite is not always true. In many prac-tical cases observed in our experiments, even if the CSR betweentwo domain names are low, the CSR among the entire domainmembers of a malware is observed to be high. For example, access-ing www.google.com through an Internet browser automaticallycauses DNS queries to the domain names of the statistics andimage server of google. Moreover, in many countries other thanthe U.S., a DNS query to www.google.com is redirected to a localdomain such as google.ca or google.co.kr. These DNS query patternsare forced by the system and have high sequential dependency.The sequence of the domain names is hardly changed and CSR ishigh. We categorize the causes of sequential DNS queries into threerelationships: server-driven, client-driven, and accidental. Theintentional sequential correlation is caused by either the server-driven or client-driven relationship.
J. Lee, H. Lee / Computer Communications 49 (2014) 33–47 35

Author's personal copy
� The server-driven relationship constitutes those cases wherethe subsequent domain names to be queried are determinedby the response of the prior query, or the content of theaccessed server. For example, imported images give rise toother DNS queries if they are below different domain names.Another important case is the pre-defined domain names forload balancing or contents distribution. These types ofsequential query are performed regardless of the user’s willand occur systematically with a high probability. Conse-quently, the sequential relationships among the domainnames have statistically high regularity with few exceptions.
� The client-driven relationship constitutes the cases wherethe sequence and list of querying domain names are deter-mined by the process or by a human on the client side. Theprograms that try to connect some domain names periodi-cally also cause periodic DNS queries. In many cases, theprograms have a static list and the order of queryingdomain names including the query strategy such as whenand how many times they are queried. In this context, itis hard for human users to generate the program-like querypattern and vice versa.
3.2. Previous malware behavior properties
The properties previously proposed for distinguishing malwareDNS activities from legitimate DNS activities can be classified intotwo classes: temporal and spatial. Fig. 1 illustrates the conceptualcomparison between previously proposed properties and our prop-erty for malicious DNS activity detection. A rectangle on the figurerepresents a DNS client ci, and a circle represents a domain namedi. An arrow from a client to a domain name represents a DNSquery for the domain name di from the clients at time ti. Thearrows that have the same query time on the first row of the figure,a temporal property approach, represent simultaneously generatedDNS queries within a time slot. On the other hand, in the case ofone of the most recent approaches using a spatial property, i.e.,DNS co-occurrence, the arrows do not have a query time because
the approach does not consider the time and order of the DNS que-ries. Finally, the proposed property, sequential correlation, consid-ers the order and the list of queried domain names, irrespective ofthe regularity of the time intervals between DNS queries and timesynchronicity of each client. These two properties have been usedfor detecting malwares from their DNS activities. The pros and consof the properties are as follows.
� The temporal property is an inherent feature of malwaredue to the centralized, automated, and time synchronizedC&C structure characteristics, such as DNS queries at thesame time and in a regular time period to a same domainname. The temporal property is effective for distinguishingdistinguish human user activities from those of traditionalIRC botnets and simple malware sending messages to theC&C server periodically. However, this property is also seenin legitimate background processes such as daemons com-municating with their update or remote support servers.Moreover, many sophisticated malwares that do not useIRC as the C&C protocol rarely show the temporal property.
� Conversely, spatial properties are manifested by a set ofmalwares that share an identical and pre-defined domainlist. A malware has a list of domain names for maliciousactivity and its C&C servers, and the domain names in thelist are queried to a DNS server by the same malwares onthe Internet. The spatial property is robust against inten-tionally and unintentionally unsynchronized DNS activitiesand changes in the member clients of malwares. Like thetemporal property, this property is also evident in the legit-imate processes that share centralized servers. Thus, sev-eral advanced approaches that use spatial propertiesadopt a knowledge-base such as a domain or IP blacklist,to estimate the credit of domains and clients. One ofthe recent approaches that use a spatial property, DNSco-occurrence [10], achieved black list enhancement bytracking domain names queried from the DNS clients thathad queried a known malicious domain name.
Fig. 1. Sequential correlation in compared with previous malware detection properties.
36 J. Lee, H. Lee / Computer Communications 49 (2014) 33–47

Author's personal copy
The most significant advantages of our property, sequential cor-relation are twofold. The first advantage is the sensitivity of itsdetection, which is achieved by gathering the scattered and indi-vidualized behaviors achieved by evasion techniques. In spite ofthe various approaches that have been developed, the evasiontechniques of recent malwares have succeeded in taking a step for-ward in the race between detection and avoidance. Recent mal-wares no longer repeat their DNS behaviors infinitely withouthibernation. Moreover, the behaviors of the infected clients arenot temporally synchronized. This means that we cannot find ver-tical (repeated similar patterns of a client) [24] and horizontal(shared similar patterns between clients) [8,19] correlations inthe DNS behaviors of infected clients. However, GMAD gathersthe temporally scattered behaviors of a client and unsynchronizedbehaviors between clients on a graph structure, DNTG.
The second advantage of sequential correlation is the accuracyof its detection, which is achieved by distinguishing the noiseDNS behavior toward legitimate domain names. Temporal proper-ties, such as the repeated query patterns of a client [24] and thesimilarity of the patterns between numbers of clients [8], are alsoshown for the legitimate domain names and provide few addi-tional evidence about their reputation because their reputation isevaluated only by the behavior of their clients. Spatial properties,such as lexical similarity among domain names and spatial similar-ity between DNS clients [19], are hardly shared between legitimateand malicious domain names, but they are satisfied only by limitedold types of malwares. Methods that use other spatial properties,such as co-occurrence [10], are practical against the evasion tech-niques by adopting obvious evidence, i.e., domain black lists. How-ever, they are not strict enough to distinguish intentional fake andcasually occurred noise legitimate queries from the infectedmachines. Several sophisticated malwares hide the spatial proper-ties of their DNS activities in noise by using fake-DNS queries gen-erating numbers of legitimate or invalid DNS queries. However,sequential correlation allows us to cluster legitimate domainnames to form a legitimate domain group even though the domainnames are intentionally queried by infected clients. The sequentialcorrelation of the domain names working together, which are sup-ported by legitimate clients, leads a domain name to belong to thecorresponding group of domain names that should be queriedtogether in a legitimate access case.
3.3. Robustness problem against evasion techniques
Given the escalation in the evasion techniques of malwares, adetection method should consider robustness against these eva-sion techniques. The key idea of known evasion techniques is tohide the group activity of the malware processes on the Internet.Malware authors construct their malwares such that they do notgenerate the same DNS queries at the same time, in order to imper-sonate a normal user. However, it is significantly difficult to makenumbers of malwares on remote hosts work individually withoutany shared domain names and common query patterns.
An evasion technique is used for hiding the infected clients andmalicious domain names from detection. The evasion techniquesagainst detection mechanisms that use DNS analysis can be classi-fied into two classes, in the same way as the detection approaches,i.e., temporal and spatial evasion. Temporal evasion techniquesdrive the DNS queries from infected machines to temporally scat-tered timing. Given that the C&C protocol of malwares has movedfrom IRC to HTTP and custom protocols, malwares no longer needto be temporally synchronized. Even during malicious activitycausing DNS queries, the attackers, generally called bot-mastersin much of the research papers, use only a part of their infectedmachines in order to avoid exposing all the members. Concrete
examples of the temporal evasion techniques that have beenobserved in malware in the wild are ‘‘client sub-grouping’’,‘‘domain sub-grouping’’, ‘‘query timing randomization’’ and so on.Sub-grouping means dividing the resources, such as infected cli-ents and C&C servers, for malicious activity into several smallgroups to avoid detection of all the resources and to hide theirgroup activities. Consequently, the DNS activities that adopt a tem-poral evasion technique shows different client sets at each timeslot for a domain name. For instance, malicious domain d1 d4
which are queried by infected client c1 and c2 in Fig. 2, evade thedetection based on DNS group activity by using temporal evasion,querying at each different time slot. Previous detection approachesusing temporal properties, such as time synchronized groupactivity from a static and exclusive client set of a domain name,are easily evaded by these techniques.
Spatial evasion techniques drive the DNS queries from infectedmachines to complex target domains and query orders. Static or
Fig. 2. Problem case 1: temporal and spatial evasion techniques and the counter-measure using sequential correlation.
J. Lee, H. Lee / Computer Communications 49 (2014) 33–47 37
Author's personal copy
random order query patterns with multiple C&C domain names arewell known spatial evasion techniques. The most sophisticatedspatial evasion technique uses domain names that are continu-ously generated by the domain generation algorithm (DGA). Thetremendous numbers of domain names are used for redundantC&C domain names and fake domain names to hide the real C&Cdomain names in the domain crowds. In terms of DNS analysis,the spatial evasion techniques show us different domain namesfor each query from an infected client. The spatial evasion tech-nique in the lower part of Fig. 2 using DGA and domain fluxing alsoevades the detection system based on temporal properties.
In contrast, the sequential correlation on a graph allows us totrack the newly generated domain names and represents theconnectivity between the old and new domain name. Even if eachclient makes queries to each different subset of the entire domainset, as in the temporal evasion case shown in Fig. 2, the sequentialcorrelation on a graph organizes an accumulated graph of theentire domain set as in the framed example against the temporalevasion techniques. In more severe cases, against the spatial eva-sion techniques used by several known malwares, such as Conficker[14] and Torpig [15], the domain names are distinguished as anindependent domain group, because the randomized sequentialcorrelation has exclusiveness with the sequential correlation ofthe other non-randomized domain names. GMAD solves this prob-lem of domain clustering through the DNTG as in the example inthe lowest frame of Fig. 2.
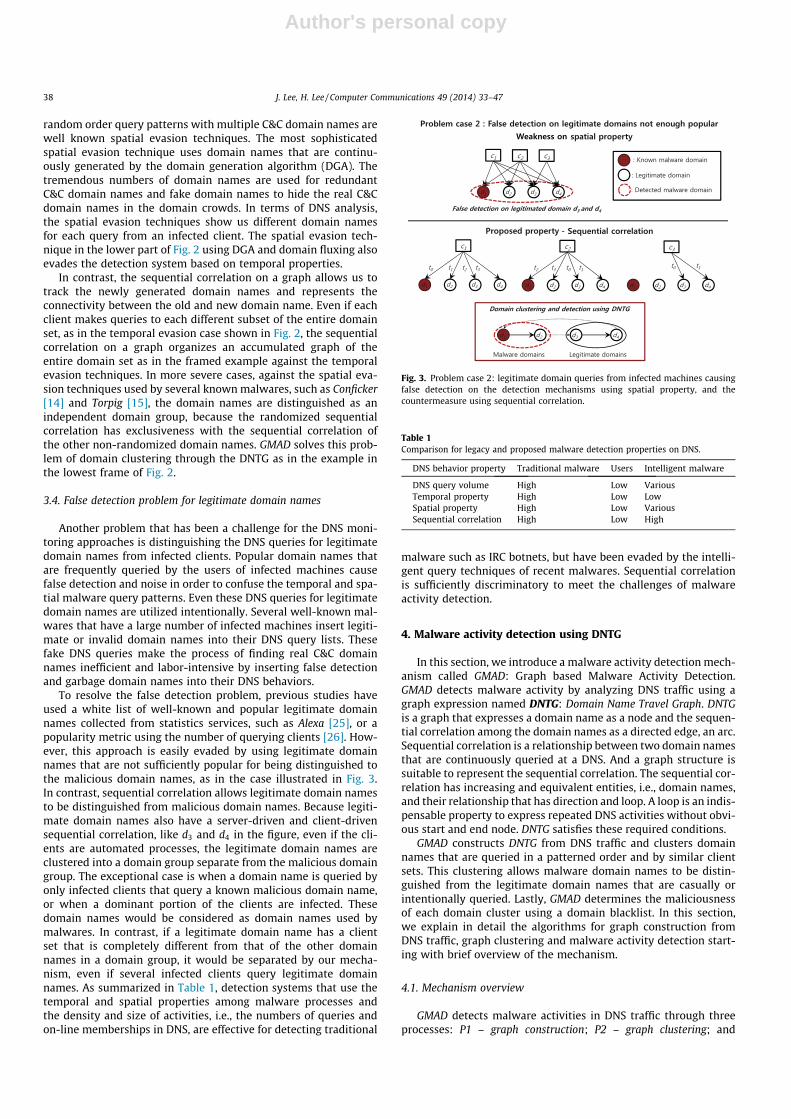
3.4. False detection problem for legitimate domain names
Another problem that has been a challenge for the DNS moni-toring approaches is distinguishing the DNS queries for legitimatedomain names from infected clients. Popular domain names thatare frequently queried by the users of infected machines causefalse detection and noise in order to confuse the temporal and spa-tial malware query patterns. Even these DNS queries for legitimatedomain names are utilized intentionally. Several well-known mal-wares that have a large number of infected machines insert legiti-mate or invalid domain names into their DNS query lists. Thesefake DNS queries make the process of finding real C&C domainnames inefficient and labor-intensive by inserting false detectionand garbage domain names into their DNS behaviors.
To resolve the false detection problem, previous studies haveused a white list of well-known and popular legitimate domainnames collected from statistics services, such as Alexa [25], or apopularity metric using the number of querying clients [26]. How-ever, this approach is easily evaded by using legitimate domainnames that are not sufficiently popular for being distinguished tothe malicious domain names, as in the case illustrated in Fig. 3.In contrast, sequential correlation allows legitimate domain namesto be distinguished from malicious domain names. Because legiti-mate domain names also have a server-driven and client-drivensequential correlation, like d3 and d4 in the figure, even if the cli-ents are automated processes, the legitimate domain names areclustered into a domain group separate from the malicious domaingroup. The exceptional case is when a domain name is queried byonly infected clients that query a known malicious domain name,or when a dominant portion of the clients are infected. Thesedomain names would be considered as domain names used bymalwares. In contrast, if a legitimate domain name has a clientset that is completely different from that of the other domainnames in a domain group, it would be separated by our mecha-nism, even if several infected clients query legitimate domainnames. As summarized in Table 1, detection systems that use thetemporal and spatial properties among malware processes andthe density and size of activities, i.e., the numbers of queries andon-line memberships in DNS, are effective for detecting traditional
malware such as IRC botnets, but have been evaded by the intelli-gent query techniques of recent malwares. Sequential correlationis sufficiently discriminatory to meet the challenges of malwareactivity detection.
4. Malware activity detection using DNTG
In this section, we introduce a malware activity detection mech-anism called GMAD: Graph based Malware Activity Detection.GMAD detects malware activity by analyzing DNS traffic using agraph expression named DNTG: Domain Name Travel Graph. DNTGis a graph that expresses a domain name as a node and the sequen-tial correlation among the domain names as a directed edge, an arc.Sequential correlation is a relationship between two domain namesthat are continuously queried at a DNS. And a graph structure issuitable to represent the sequential correlation. The sequential cor-relation has increasing and equivalent entities, i.e., domain names,and their relationship that has direction and loop. A loop is an indis-pensable property to express repeated DNS activities without obvi-ous start and end node. DNTG satisfies these required conditions.
GMAD constructs DNTG from DNS traffic and clusters domainnames that are queried in a patterned order and by similar clientsets. This clustering allows malware domain names to be distin-guished from the legitimate domain names that are casually orintentionally queried. Lastly, GMAD determines the maliciousnessof each domain cluster using a domain blacklist. In this section,we explain in detail the algorithms for graph construction fromDNS traffic, graph clustering and malware activity detection start-ing with brief overview of the mechanism.
4.1. Mechanism overview
GMAD detects malware activities in DNS traffic through threeprocesses: P1 – graph construction; P2 – graph clustering; and
Fig. 3. Problem case 2: legitimate domain queries from infected machines causingfalse detection on the detection mechanisms using spatial property, and thecountermeasure using sequential correlation.
Table 1Comparison for legacy and proposed malware detection properties on DNS.
DNS behavior property Traditional malware Users Intelligent malware
DNS query volume High Low VariousTemporal property High Low LowSpatial property High Low VariousSequential correlation High Low High
38 J. Lee, H. Lee / Computer Communications 49 (2014) 33–47

Author's personal copy
P3 – malware activity detection, as shown in Fig. 4. As its results, itreports malware domain names that are used not only for malwareC&C servers but also for malicious activities, such as malware drop-ping, update, spamming, and blacklist check. The summarizedfunctionality of each process is as follows.
� P1 – graph construction. DNS query traffic captured in frontof a DNS server is converted to a DNTG. Through P1, themechanism extracts the sequential correlation of domainnames as a pre-processing step for graph clustering. P1extracts four information from the DNS traffic: (1) A listof queried domain names as the nodes of a graph; (2)sequential correlations as the edges of a graph; (3) a tableof query source IP addresses for each domain name; and(4) the number of queries of each domain name. Thedomain names that are queried only by one client duringa monitoring time are removed.
� P2 – graph clustering. This process is a key part of the mecha-nism. P2 groups intentionally related domain names todetect malware domain names that are working together.P2 does not make decisions about the maliciousness of eachdomain name and each domain group, but it separatesdomainnamesthatareusedby differentprocessesandservices.According to a clustering feature, client sharing, P2 clusters thedomain names queried by the same process or service.
� P3 – malware activity detection. This process detects mal-ware domain names based on a domain black list. As men-tioned above, domain names on a blacklist are usually C&Cdomain names or the infection domain names of a Trojan;however, the detection covers the domain names for manyother malicious purposes, as well as C&C domain names.
4.2. Process 1: graph construction
Algorithm 1. P1: Graph construction
Input: Query set Q ¼ fqgOutput: Domain name travel graph G ¼ ðV ; EÞ1: V /;2: E /;3: qc GetFirstQueryðQÞ;4: while qc is not the end of Q do5: c GetClientIPðqcÞ;6: v i GetLastDomainðcÞ;7: v j GetDomainðqtÞ;8: V V [ v j;9: if v i is exist then10: E E [ Edgeðv i;v jÞ;11: e GetEdgeIndexðEdgeðv i;v jÞÞ;12: // Weight of the edge e13: W½e� W½e� þ 1;14: // Set of IP addresses contribute to the edge e15: Ce Ce [ c;16: else17: SetLastDomainðc;v jÞ;18: end if19: // Set of IP addresses which queried domain v j
20: Cv j Cv j [ c;21: qc GetNextQueryðQÞ;22: end while
The construction of the domain name travel graph is the firststep in constructing a graph from given DNS traffic. Convertingnetwork traffic or logs to the graph allows sequence of queries
from the DNS traffic to be traced. In the DNTG structure, eachdomain name is assigned to a node on a graph with a label, anordered query from an identical client to two domain names isexpressed as an edge. In the Google example mentioned at thestart of the section on sequential correlation 3.1, domainwww.google.com and www.google.co.kr are connected by an edgefrom www.google.com to www.google.co.kr, and www.google.co.krand www.gstatic.com are connected in the same manner. Thisgraph construction is performed on GMAD using Algorithm 1.
One of the key features of DNTG is that the DNS query activitiesfrom the DNS clients are accumulated on a graph. Graph operationson a single graph make the mechanism scalable in temporally andspatially. As a construction example, in Fig. 5, DNS queries of twoDNS clients are recorded on a graph. The order and timing of theDNS queries of each client do not affect those of the other clients.In the example case, a DNS query for a.com from Client 2 is not con-nected with c.name queried by Client 1.
4.3. Process 2: graph clustering
Algorithm 2. P2: Graph clustering
Input: Initial domain name travel graph Gi ¼ ðVi; EiÞOutput: Clustered domain name travel graph Gc ¼ ðVc; EcÞ1: Vc Vi;2: Ec Ei;3: tw GetEdgeWeightThresholdðÞ;4: tcss GetClientSetSizeThresholdðÞ;5: tcsr GetClientSharingThresholdðÞ;6: e GetFirstEdgeIndexðViÞ;7: while e is not the end of Ei do8: vsrc GetSrcNodeðeÞ;9: vdst GetDstNodeðeÞ;10: // Weight of the edge e11: w W½e�;12: // The number of distinct clients of the edge e13: c GetSetSizeðCeÞ;14: s ClientSharingRatioðCvsrc ;Cvdst Þ;15: if w < tw or c < tcss or s < tcsr then16: // Edge cut17: Ec Ec � e;18: Ce /;19: W½e� 0;20: end if21: endwhile
In the graph clustering step, domain groups are extractedfrom the entire set of domain names. The process makes aninitial DNTG for the numbers of components by cutting edges.A component represents a domain group. The clustering processremoves the edges whose CSR, number of clients, or number ofqueries are less than each threshold. If an edge connecting twodomain names has a lower CSR than the other edges, GMADconsiders that the domain name connected with the edge isnot utilized by the same client set. The number of clients andqueries represent the degree of regular and intended behaviors.As a result of edge removal, the nodes connected by the edgeslose their connection. The nodes that lose their connection forma connected-component. The edges that separate a connected-component from the initial graph are called the cut-edges ingraph theory fields. According to the definition of the DNTGstructure, a component that is an isolated set of nodes repre-sents an isolated domain group.
J. Lee, H. Lee / Computer Communications 49 (2014) 33–47 39

Author's personal copy
GMAD adopts increasing thresholds and iterated cutting in theclustering process. Because every potential component has adifferent cut-edge value, the clustering needs to be performed withvarious tcsr which is an upper bound threshold for edge cut. Forinstance, a malware whose query domain list and member clientsare static produces edges that have a CSR that is close to 100%. On
the other hand, a malware that queries a sub-set of the entirequery domain list at a monitoring time and is not time synchro-nized shows a relatively low level of client sharing. If a clusteringuses a tcsr of 90% as an edge-cut threshold, it acquires the formercomponent connected with the edges whose CSR values are over90%, but it loses the edges and nodes of the latter case. To obtainthe maximized member domains of each component, the cluster-ing process needs to adopt a minimized clustering threshold fora graph. To adopt the minimized threshold for the components,GMAD performs a clustering process on the initial graph iterativelywith a threshold that increases from a low starting value. We setthe starting threshold value as 0.2 in our experiments. Thedefinition of the clustering process is described as Algorithm 2.
4.4. Process 3: malware activity detection
The malware activity detection process determines the mali-cious domain names that are used for malware activities. Thedomain names that belong to a clustered graph are evaluatedaccording to whether the domain name set of the graph includesany known malicious domain names. Fig. 6 shows an example ofthe overall detection process using the graph. The graph clusteringprocess classifies the domain names on a graph into malicious andlegitimate. A clustered graph includes the domain names and theirsequential correlation information, and a clustered graph classifiedas a malicious graph provides a list of malicious domain namesworking together. As in the example, one clustered graph repre-sents one malware activity. Yet, if more than two malwares sharetheir clients, a graph represents all these malwares on a singlegraph. This exceptional case can be observed when the malwaresdownload another malware on infected machines, which areinstalled by a same dropper or from a same infection route.
Even though the detection is performed on a graph structure, nograph traversal or comparison operation is required. Because aclustered graph is a closed graph, the detection process only reads
Fig. 4. Process flow diagram of the malware activity detection mechanism usingDNTG.
Fig. 5. Example for DNTG construction from DNS traffic. Fig. 6. A real-case example of detection using GMAD process.
40 J. Lee, H. Lee / Computer Communications 49 (2014) 33–47

Author's personal copy
a list of node labels and finds each label on a black list using a hash-map based search algorithm that takes constant time. We will dis-cuss the time complexity of each process in the analysis section.
5. Experiments
In this section, we show the results of experiments on the DNStraffic of real networks, including the tracking ability of our mech-anism. We implemented DNTG constructor and clustering pro-cesses using C++ for experiments. A graph tool, Pajek [27], wasused for visualization. The Kamada–Kawai Algorithm [28], includedin Pajek was used as a graph layout algorithm. The experimentswere performed on a desktop PC with a 3.30 GHz Intel quad coreCPU, 8 GB main memory and Microsoft Windows 7 64 Bit. Themechanism is not yet fully automated and does not necessarilywork in real time, but the automated parts take only a few minutesto process two hours of ISP level DNS traffic.
5.1. Data sets
We performed an experiment with DNS traffic captured on realnetworks to show the effectiveness of GMAD. We captured DNSquery traffic in front of DNS servers in large ISP networks. We usedfour trace sets extracted from the traffic for our experiments anddetailed analysis. These were captured around midnight and inthe afternoon in the U.S. and South Korea. In this part, we callthe data sets US1; US2; KR1 and KR2. Each data set has two hoursof DNS traces. US1 and KR1 are afternoon traces, and US2 and KR2are middle of the night traces.
As shown in Table 2, US1, and US2 have a similar traffic volume,but KR1 has twice as many query and domain numbers and threetimes as many clients as KR2. In terms of malicious activity, KR2shows 80% of blacklist domain names as compared with KR1, eventhough it has only half of the query volume of KR1. It can be rea-soned that several malwares in KR2 are active at night time.
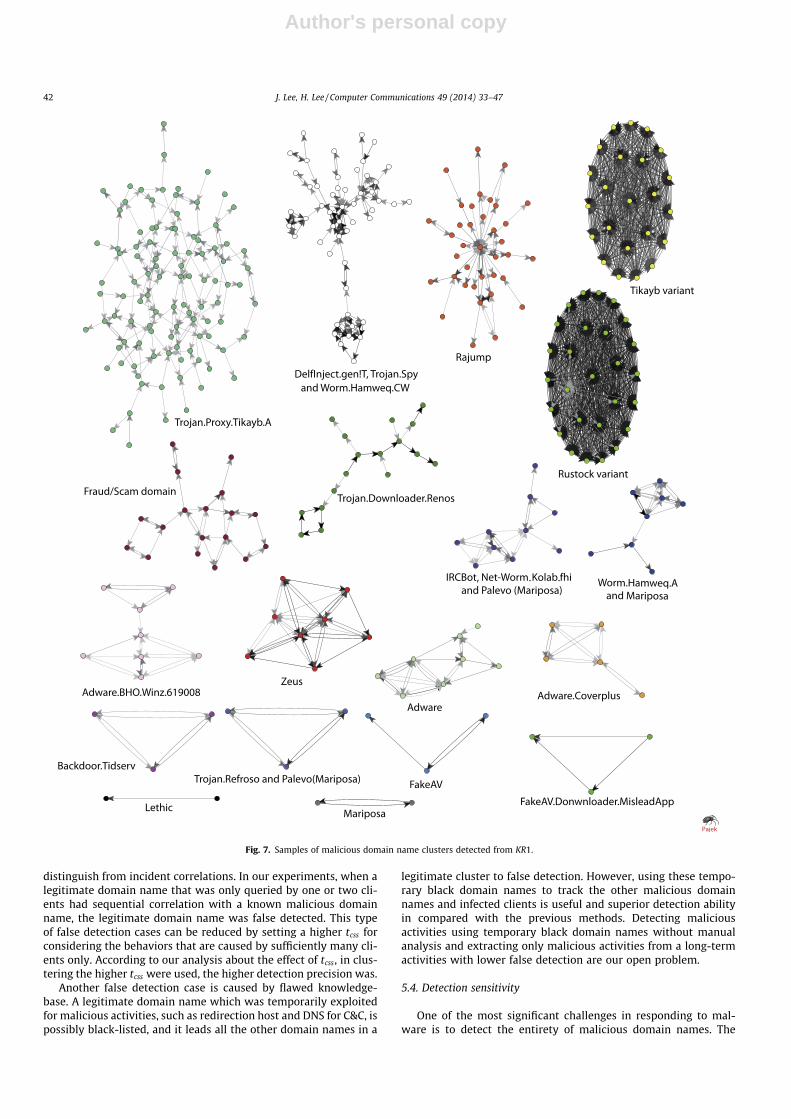
5.2. Detection result and clustered graphs
The malicious domain names detected by GMAD are structuredas domain name clusters, and a cluster is represented as a graph.The clustered graphs in Fig. 7 are the graphs of domain name clus-ters detected from KR1. In order to show graph topologies, we hidthe domain names on the nodes. The brightness of the edges rep-resents the CSR value of the edges: the darker edge represents ahigher CSR, and the brighter edge represents a lower CSR. The clus-tered graphs that have more than two malware labels are graphsthat contain the malicious domain names of plural malwares.These cases are observed when some clients are infected by pluralmalwares, or when the malwares share a domain name.
The number of detected domain names is affected mainly by themalwares using DGA. The multi-domain malwares using DGA gen-erate thousands of domain names per hour. In our experiments, themalicious domain names generated by DGA had various patterns,including fully randomized domain names. Several malwares makehundreds of domain names for querying their C&C domain namesat the public DNS blacklist services to check whether their C&C
domain names are listed. Another malware activity that uses thenumbers of domain names is attack target scanning for findingmail servers and vulnerable web and database servers. The scan-ning activity queries hundreds of domain names in the dictionaryorder. In this special case, although the scanning activities weredetected by GMAD, we excluded the detected domain names fromthe statistics because the target domain names of the DNS activi-ties were legitimate.
Another important contributions of our work to detect multi-domain malware activity is detecting domain name groups whichare not share lexical similarity as well as obviously randomly gen-erated domain names. In several previous approaches combattingthe multi-domain malwares such as Yadav’s work [12], their targetwas detecting randomly generated domain names by DGA. But,according to the reports analyzing recent malwares, many topranked large scale malwares have the domain names which arenot randomly generated. In practice, tens of malicious domainname groups which are detected by GMAD such as the maliciousdomain names on Table 3, have little lexical similarity among theirmember domain names. These types of malwares are hard todetect through their repeated patterns or probabilistic distributionof letters.
5.3. Detection accuracy
We gathered 13,392 distinct malicious domain names for per-formance evaluation from public black list: DNS-BH [29], Malwa-reDomainList.com [30] and malc0de.com [31]. Because GMADdetects malicious domain names which are not in the black list,we manually investigated non-listed domain names to determinetheir maliciousness. For the manual investigation, we used DNSactivity analysis reports posted on public malware and maliciousdomain name information sites, Threat Expert [32], MicrosoftMalware Protection Center [33], Symantec Threat Explorer [34], SiteAdvisor [35], MalwareURL.com [36] and SURBL [37]. Some of theinformation sites used for manual investigations provide theirown black lists, but they are not fully public.
Table 4 shows the evaluation results using accuracy metrics.GMAD shows over 80% precision and a false positive rate lowerthan 0.5% for the four data sets. The precision is rate of correctlydetected domain names among all detected domain names. Thefalse positive rate (FPR) is rate of incorrectly detected legitimatedomain names among all legitimate domain names. The definitionsof the precision and false positive rate are in Eqs. (2) and (3),respectively. In the equations and tables in the experiments andanalysis section, we abbreviate the true positive, true negative,and false positive as TP, TN and FP, respectively.
Precision ¼ TPTP þ FP
ð2Þ
FPR ¼ FPTN þ FP
ð3Þ
According to Table 4, GMAD showed up to seven hundreds offalse positive cases in two hour data sets. False positive of GMADis mainly caused by clustering failure. In several cases, sequentialcorrelations which are yielded by a too few clients are hard to
Table 2DNS trace sets for analysis and evaluation.
Data set Date Time Query Domains Clients Blacklisted
US1 June 22, 2010 13:00–15:00 1713 K 228 K 16 K 0.2 K (0.09%)US2 June 22, 2010 22:00–24:00 1737 K 221 K 15 K 0.2 K (0.10%)KR1 January 22, 2010 13:00–15:00 8661 K 1,151 K 183 K 1.0 K (0.09%)KR2 January 22, 2010 22:00–24:00 4210 K 614 K 52 K 0.8 K (0.17%)
J. Lee, H. Lee / Computer Communications 49 (2014) 33–47 41
Author's personal copy
distinguish from incident correlations. In our experiments, when alegitimate domain name that was only queried by one or two cli-ents had sequential correlation with a known malicious domainname, the legitimate domain name was false detected. This typeof false detection cases can be reduced by setting a higher tcss forconsidering the behaviors that are caused by sufficiently many cli-ents only. According to our analysis about the effect of tcss, in clus-tering the higher tcss were used, the higher detection precision was.
Another false detection case is caused by flawed knowledge-base. A legitimate domain name which was temporarily exploitedfor malicious activities, such as redirection host and DNS for C&C, ispossibly black-listed, and it leads all the other domain names in a
legitimate cluster to false detection. However, using these tempo-rary black domain names to track the other malicious domainnames and infected clients is useful and superior detection abilityin compared with the previous methods. Detecting maliciousactivities using temporary black domain names without manualanalysis and extracting only malicious activities from a long-termactivities with lower false detection are our open problem.
5.4. Detection sensitivity
One of the most significant challenges in responding to mal-ware is to detect the entirety of malicious domain names. The
Fig. 7. Samples of malicious domain name clusters detected from KR1.
42 J. Lee, H. Lee / Computer Communications 49 (2014) 33–47

Author's personal copy
redundancy provided by multiple domain names gives more resil-iency and functionality to the malwares. It is difficult to predict thedomain names that have not yet been used, but a detection methodshould detect at least newly generated and rarely used maliciousdomain names sensitively. Detection sensitivity is how many mali-cious domain names are detected in the sparser DNS query densityand the less active machines. In our experiment, we compared thedegree of the detection sensitivity using the number of detectedmalicious domain names over the same data set.
In this section, we describe our experimental comparison of thedetection sensitivity of GMAD with one of the most evolved mal-ware activity detection method, BotGAD [8]. BotGAD uses temporalgroup activity in malware DNS queries, i.e., time-synchronizedDNS queries on a domain name, and similarity among querying cli-ent sets, along with time slots. BotGAD is an advanced method ascompared with the other previous methods in that it detectsmalware domain names without any knowledge-base and consid-ers several evasion techniques, such as hibernation and randominterval activity. In addition, in the most recent study of BotGAD[9], the related malicious domain names are detected as a domaingroup using lexical similarity and network features, such ascorresponding IP addresses among the domain names. However,
its effectiveness is limited in the case of multi-domain malwareswhich have little lexical and networking similarity in their domainnames.
In terms of detection sensitivity, GMAD shows about a 28-foldimprovement over BotGAD on average over the four data sets.Detailed performance comparisons according to the detected mali-cious domain names along with the number of query clients foreach domain name are illustrated in Fig. 8. Detecting the morenumber of malicious domain names that are queried by a few cli-ents represents the more sensitive detection. Fig. 8 represents thenumber of domain names detected by GMAD and BotGAD in thedata sets US1 (upper-left), US2 (upper-right), KR1 (lower-left) andKR2 (lower-right). BotGAD responds to the multi-domain malwarespartly by grouping related domain names. However, it does notshow a sufficient performance as compared with GMAD, eventhough the detection coverage of GMAD is dependent on a blacklist.
The better domain clustering ability of GMAD gives advantage tothe detection sensitivity too. If a detection method cannot group therelated domain names, this means that the density of the maliciousactivities is too sparse to allow their maliciousness to be determinedusing that method. The source of the major quantitative differencebetween GMAD and BotGAD is the detection of malicious domainnames that are queried by fewer than two infected hosts. This resultshows the importance of detection sensitivity and the number ofmalicious domain names that are undetectable by previousdetection methods because of the density and size of the activity.
According to our analysis of the detection results, another rea-son for GMAD’s superiority is that BotGAD detects only C&C domainnames that are regularly accessed. In contrast, the domain namesdetected by GMAD include the domain names which are used formalicious DNS activities in a wider sense, such as blacklistchecking, spamming, domain scanning, fake C&C, as well as C&Cdomain names in sparse communication density. The fact thatdomain names are not detected by BotGAD as shown in Fig. 8,even though queried by more than three infected machines, meansthat the malwares evaded BotGAD using evasion techniques tocombat detection methods using temporal property and lexicalsimilarity.
On the other hand, compared with the Jiang et al.’s work [22]which has the most similar target to our work and also takesgraph-based clustering, GMAD shows better detection sensitivity.In the data sets US1 and US2 which are smaller but have similarquery-per-client rate to the data set that are used in [22], GMADshows 60% and 20% more domain detection than all of the suspi-cious domain names of their work. An obvious difference in detec-tion ability is the detection of valid domain names which was notconsidered at the Jiang et al’.s proposal. In their work, only invaliddomain names are considered, which have no correspondingresource records. It means their method does not cover the mali-cious domain names that are working actively, as well as active C&C.
In detail, the data set used in Jiang et al.’s experiments has 20%more queries and clients than our data set, i.e., US1 and US2. In theJiang et al.’s experiment, near 3000 invalid domain names wereconsidered as a suspicious domain. The actual number of domainnames which were verified as the malicious were not concretelydisclosed. However, in our result, GMAD detected 4917 and 3650domain names as the verified malicious domain names, i.e., TP onTable 4, from US1 and US2, respectively. Although this comparisonis not based on equivalent data set, the result obviously shows thedifference on detection performance caused by the detection abil-ity for the valid domain names and coverage.
6. Analysis
In this section, we analyze the effect of the metrics that repre-sent the degree of sequential correlation on detection performance.
Table 3Examples of detected malware domain names on KR1.
Idx Domain names Groupsize
Redirection URLs and variousmalwares
megaparty.ws 27
playnewforex.infofotovideo2009.biztotalinfluence.bizixxlkg.cntotalinfluence.info8ciehnvy.complaynewforex.rudjsu.info. . .
DelfInject.gen and Hamweq.CW thunder.ircdevils.net 514949.zerx-virus.bizthunder.helldark.bizyhtjanj.comyhtjanj.bizudptanj.comudptanj.net. . .
Tikayb.A. gotoplaywithme.name 101ac.ultima2009.infoae.ultima2009.infoec.gotoplaywithme.namehh.gotoplaywithme.namefk.gotoplaywithme.name. . .
IRCBot, Kolab.fhi and Palevo mails.pes2009.biz 10serv1.alwaysproxy8.infotes.enterhere2.biztes.stuckin.orgtes.memehehz.infoninja.ibedyou2.comidfc2.infohost.idfc2.info. . .
Table 4Detection performance for real-world DNS data sets.
Data set TP TN FP Precision (%) FPR (%)
US1 4917 223,175 588 89.31 0.26US2 3650 217,211 185 95.17 0.08KR1 5932 1,144,832 626 90.45 0.05KR2 3705 517,891 687 84.36 0.13
J. Lee, H. Lee / Computer Communications 49 (2014) 33–47 43

Author's personal copy
Through the analysis, we attempt to find the trade-off between, aswell as the most beneficial configuration of, detection coverage andaccuracy to detect real world malwares. The analysis showed thatthe different configurations make it possible to detect differentmalware activities which cannot be detected by the other configu-rations. This result indicates that we should adopt an optimizeddetection strategy along with the operation purpose and policy.Finally, we performed a scalability analysis in terms of timecomplexity to show the practicality and efficiency of GMAD.
6.1. Clustering accuracy as minimum valid DNS clients
GMAD effectively detects malicious domain names that are usedby only a few on-line infected hosts. However, most of the proper-ties estimated from DNS behavior, including that used in our pro-posed method, sequential correlation, are more reliable when thereare more behavior subjects, i.e., DNS clients. This means that therecan be a trade-off between the minimum number of infected cli-ents for estimating the maliciousness of a domain name and falsedetection. In other words, including DNS queries to a domain namequeried by fewer DNS clients for estimating a property render adetection mechanism more sensitive but less accurate. To maxi-mize the effectiveness of our mechanism, we analyzed the effecton the detection accuracy of GMAD when the minimum numberof valid DNS clients, denoted by tcss representing an edge-cut threshold for client set size (CSS), is applied in the clusteringalgorithm in Section 4.3. tcss causes GMAD to ignore sequentialcorrelation generated from clients whose number is less than tcss.
According to the results of experiments to analyze the effect ofsensitive detection, shown in Table 5, a higher tcss yields fewerdetected domain names but a higher accuracy level. A higher tcss
yields more true positive malicious domain names, quantitatively,but it does not include the result of the lower tcss cases. Where theset of true positive malicious domain names that are detectedwhen tcss is k is expressed as TPtcss¼k. We compared the results whileincreasing tcss from one to five. In the comparison betweenTPtcss¼1 and TPtcss¼5, the number of domain names detected only in
tcss ¼ 1 is represented as jðTPtcss¼1 � TPtcss¼5Þj. In the data setKR1; jðTPtcss¼1 � TPtcss¼5Þj was 2120 domain names and the oppositecase, jðTPtcss¼5 � TPtcss¼1Þj, was 2134. The commonly detecteddomain names in both TPtcss¼1 and TPtcss¼5 are 3812 domains. Thismeans that a different tcss leads to the detection of different typesof malicious activities.
In terms of detection sensitivity, the number of detecteddomain names decreased with a higher tcss as there was more lossof connectivity by the edge-cut using tcss. However, the number oftrue positive cases was increased. This means that the maliciousdomain names that were not detectable using a clustering basedon CSR value can be detected a clustering using CSS. According toour empirical analysis, a group of domain names which has a largerCSS possibly has low CSR and vice versa. A malicious activity whoseclients share a similar querying domain name set has high CSRamong the domain names, and it should be dealt with clusteringusing CSR. On the other hand, a malicious activity performed bynumbers of clients shows spatially scattered behavior unless thenumbers of clients are finely synchronized. A clustering using CSSis proper to this type of activity.
6.2. Client sharing ratio of malicious domain clusters
The CSR of each malicious domain name cluster represents themalwares’ client–server structure and C&C strategy. As discussedin the explanation of the graph clustering process, the CSR amongmalicious domain names is dependent on the communication
Fig. 8. Malware domain detection result comparing with BotGAD.
Table 5Detection performance as filtering threshold tcss on KR1.
tcss TP TN FP Precision (%) FPR (%)
1 5932 1,144,832 626 90,45 0.052 3946 1,147,066 378 91.26 0.033 3248 1,148,049 63 98.10 0.014 4901 1,146,445 44 99.11 0.005 5946 1,145,426 18 99.70 0.00
44 J. Lee, H. Lee / Computer Communications 49 (2014) 33–47

Author's personal copy
strategy between malwares and malicious domain names. A finelysynchronized group of machines infected by a malware that has astatic domain names list shows a high CSR in its DNS activities. Incontrast, the malwares operated in sub-grouping or sparse com-munication generate DNS queries only for a part of their domainnames at one time.
Within the malicious domain name clusters detected from KR1,the domain names in more than one third of the clusters were con-nected with edges that had an average CSR from 30% to 50%. Fig. 9shows the distribution of the average CSR values of the maliciousclusters. Most clusters had an average CSR of 30–40% and less than10% of the clusters were connected with fully shared clients. Interms of the number of infected clients, the malicious domainnames that had more clients showed a lower CSR. This can be inter-preted in two ways. The first possibility is that it is relatively hardto synchronize the larger malwares, which have more infected cli-ents, and the clients of each malicious domain name also may notbe synchronized. The second possibility is that the malwares areusing evasion techniques to hide their group activities, intention-ally. In conclusion, if we consider that the malwares that havemore on-line clients are more critical, even if their DNS activitiesare sparse and scattered, we should focus on detecting domainnames that have large client sets and a low CSR. A low CSR meansthat the entire number of infected clients is much greater than thatobserved. On the other hand, the largest portion of detected mal-wares consists of the small scale malwares which have only oneto three malicious domain names and clients within our monitor-ing time slot. Estimating the optimal time and resource consump-tion for revealing all the infected clients of a malware can beanother research topic.
6.3. Scalability analysis
GMAD has a practical performance that is robust against thehuge volume of input data, i.e., the DNS query traces. Accordingto time complexity analysis, where n is the number of the inputDNS queries, GMAD has OðnÞ time complexity through the entiredetection process. In the worst cases, the time complexity of eachstep is OðnÞ, and the reasoning is as follows.
� Graph Construction: twice of map searches which takes aconstant time [38] for n DNS queries.
� Graph Clustering: n� 1 times of comparison operation forn� 1 arcs.
� Weak-connected component separation: finding weak-connected component [39] from n and n� 1 nodes andedges respectively.
� Blacklist matching: n times hash-map search, which takes aconstant time.
In the worst case, the number of nodes and edges in the DNTG isas many as the number of DNS queries, however, in fact, they donot linearly increase with the size of the DNS queries. The timeand space complexity are dependent on the number of uniquedomain names, and the growth of unique domain names slowsdown as illustrated in Fig. 10 following Heaps’ law [40]. In ourempirical analysis, the Heaps’ law formula for the number ofunique domain names is DðnÞ ¼ 0:28 � n0:6. As an illustration, thesize of DNTG constructed from eight million DNS queries for twohours is only 21 MB. Computation overhead per each arc is alsoslight. Three processes except the graph clustering within the fourprocesses only need a couple of integer comparison and hashingper each arc. The graph clustering has the heaviest computationoverhead because it compares sets of IP address. However, thecomputation time and space consumption is minimized by hashingto the IP addresses of the clients which are the input data of esti-mating the CSR. The hash matching is much faster than original32 bit IP address matching.
On the other hand, GMAD is practically scalable to large scaledata, as compared with other previous studies [8,9,19,20,22] whichcompute information of the clients and domains at once. Con-cretely, GMAD minimized the data which must be analyzed simul-taneously. The topology of a graph only includes the connectivityinformation and their arc weight. In the same DNS query data size,the size of the topology information is much smaller than the tim-ing data of the previous temporal approaches must process simul-taneously. The spatial approaches based on the similarity of pluralDNS clients at once, not one by one, also have same memory over-head problem to the temporal approaches. In contract, the estima-tion of arc weight in GMAD can be processed independently.It means that the estimation procedure only needs to load theinformation of two nodes on the memory at once, and it can beprocessed in parallel.
7. Discussion
In this section, we discuss about considerable drawbacks andquestions, i.e., the limitation of sequential correlation against thetraditional single domain malware, and the universality of GMAD.
7.1. Drawback of sequential correlation approach
Though GMAD mainly focuses on the multi-domain maliciousactivities and evasion technique problems, GMAD covers a part ofsingle domain names which show the sequential correlation tothemselves. But the coverage is relatively limited. The sequentialcorrelation has a limitation on to detect malicious single domain
Fig. 9. The distribution of average CSR on the detected domain clusters as tcss .
Fig. 10. The number of unique domain names as the increase of input DNS queries.
J. Lee, H. Lee / Computer Communications 49 (2014) 33–47 45

Author's personal copy
activities which are different to the normal single domain activitiesonly on their temporal patterns. As a sequential correlation, thosetwo activities are considered as the same patterns. In contrast tothe multiple domain activities, the single domain activities haveto investigated by their strict regularity if they have, because tem-porally irregular queries to single domain name have little differ-ence to the normal activities. However, the lack of robustnesscaused by the strictness is a well-known limitation of previoustemporal approaches. To overcome this trade-off may need touse another property and data sources in addition to the DNS querypattern. It can be a topic for our future work.
7.2. Locality of experimental data sets and universality
A malicious activity detection method may show different per-formance to the different data sets which have their characteristiclocality. In many cases, domain black lists have been managed suit-able to each ISP. We observed that the kind of malwares wereslightly different between data sets gathered from U.S and SouthKorea. But GMAD has enough universality to this difference. Asshown on Table 5, it does not affect the detection performance.GMAD does not shows significant difference on accuracy for thefour different data sets. The number of detected domain namescan be different due to the number of domain flux malwares withthe DGA. In another point of view, even though KR1 has three timesof queries and twice of domain names compared with KR2, it doesnot affect to the accuracy.
8. Conclusion
Malwares on the Internet are becoming intelligent and com-plex, and therefore they can evade the legacy detection methods.DNS activity analysis, which has been one of the most effectiveresponse methods, also faces the evasion problems incurred bythe malware’s use of multiple domain names. In this paper, weproposed a malware activity detection mechanism named GMADthat uses graph expression and a robust DNS behavior property,sequential correlation. GMAD finds malicious domain names inDNS traffic, which are utilized by the malwares as C&C servers,DNSs, update servers, etc. Through the graph representing thesequential correlation and graph clustering, GMAD reveals themalicious domain names, even though the DNS activities forthe domain names are being adopted temporal or spatial evasiontechniques. In our experimental evaluation using DNS traffic datagathered from two ISP DNSs in the U.S. and South Korea, GMADshowed superior detection accuracy and sensitivity as comparedwith the previous DNS analysis approaches. The major contribu-tion of this study is to reveal the malicious domain names thathave not been detected by the legacy DNS analysis methods usingtemporal and spatial behavior properties. We extend the detectioncoverage to all the sequentially correlated domain names utilizedfor malware activities, even though the domain names are notregularly and periodically queried as are the legacy C&C domainnames. We believe that the contributions of our work will facilitatethe prevention of damage from malware infection and maliciousactivities on the Internet more effectively.
Acknowledgements
This research was supported by the Public Welfare & SafetyResearch Program through the National Research Foundation ofKorea (NRF) funded by the Ministry of Science, ICT & FuturePlanning (2012M3A2A1051118).
References
[1] D. Maslennikov, Y. amestnikov, Kaspersky Security Bulletin 2012, The overallstatistics for 2012, Tech. rep., Kaspersky Lab, December 2012.
[2] Symantec MessageLabs, Intelligence report, Tech. rep., Symantec Corporation,January 2013.
[3] Symantec MessageLabs, Intelligence report, Tech. rep., Symantec Corporation,March 2011.
[4] Symantec MessageLabs, Intelligence report, Tech. rep., Symantec Corporation,June 2011.
[5] R. Perdisci, I. Corona, D. Dagon, W. Lee, Detecting malicious flux servicenetworks through passive analysis of recursive DNS traces, in: Proc. of theAnnual Computer Security Applications Conf. (ACSAC), IEEE Computer Society,2009, pp. 311–320.
[6] A. Ramachandran, N. Feamster, D. Dagon, Revealing botnet membership usingdnsbl counter-intelligence, in: Proc. of the 2nd Conf. on Steps to ReducingUnwanted Traffic on the Internet (SRUTI), USENIX Association, 2006, pp. 49–54.
[7] J.A. Morales, A. Al-Bataineh, S. Xu, R. Sandhu, Analyzing DNS activities of botprocesses, in: Proc. of the 4th IEEE Intl. Conf. on Malicious and UnwantedSoftware (MALWARE), IEEE, 2009, pp. 98–103.
[8] H. Choi, H. Lee, H. Kim, BotGAD: detecting botnets by capturing group activitiesin network traffic, in: Proc. of the 4th Intl. ICST Conf. on COMmunicationSystem softWAre and middlewaRE (COMSWARE), ACM, 2009, pp. 1–8.
[9] H. Choi, H. Lee, Identifying botnets by capturing group activities in DNS traffic,Comput. Netw. 56 (1) (2012) 20–33.
[10] K. Ishibashi, T. Toyono, H. Hasegawa, H. Yoshino, Extending black domainname list by using co-occurrence relation between DNS queries, IEICE Trans.Commun. 95 (3) (2012) 794–802.
[11] M. Antonakakis, R. Perdisci, Y. Nadji, N. Vasiloglou, S. Abu-Nimeh, W. Lee, D.Dagon, From throw-away traffic to bots: detecting the rise of DGA-basedmalware, in: Proc. of the 21st USENIX Security Symposium, USENIXAssociation, 2012.
[12] S. Yadav, A.K.K. Reddy, A.L.N. Reddy, S. Ranjan, Detecting algorithmicallygenerated domain-flux attacks with DNS traffic analysis, IEEE/ACM Trans.Netw. 20 (5) (2012) 1663–1677.
[13] J. Wolf, Technical Details of Srizbi’s Domain Generation Algorithm, Tech. rep.,FireEye Malware Intelligence Lab, 2008.
[14] P. Porras, H. Saidi, V. Yegneswaran, Conficker C Analysis, Tech. rep., SRIInternational, 2009.
[15] B. Stone-Gross, M. Cova, L. Cavallaro, B. Gilbert, M. Szydlowski, R. Kemmerer, C.Kruegel, G. Vigna, Your botnet is my botnet: analysis of a botnet takeover, in:Proc. of the 16th ACM Conf. on Computer and Communications Security (CCS),ACM, 2009, pp. 635–647.
[16] P. Lin, Anatomy of the mega-D takedown, Network Secur. 2009 (12) (2009)4–7.
[17] J. Lee, J. Kwon, H.-J. Shin, H. Lee, Tracking multiple C&C botnets by analyzingDNS traffic, in: Proc. of the 6th IEEE Workshop on Secure Network Protocols(NPSec), IEEE, 2010, pp. 67–72.
[18] R. Villamarín-Salomón, J.C. Brustoloni, Bayesian bot detection based on DNStraffic similarity, in: Proc. of the 2009 ACM Symposium on Applied Computing(SAC, ACM, 2009, pp. 2035–2041.
[19] G. Guofei, Z. Junjie, W. Lee, BotSniffer: detecting botnet command and controlchannels in network traffic, in: Proc. of the 15th Annual Network andDistributed System Security Symposium (NDSS), ISOC, 2008.
[20] N. Shishir, M. Prateek, H. Chi-Yao, C. Matthew, B. Nikita, BotGrep: finding p2pbots with structured graph analysis, in: Proc. of the 19th USENIX SecuritySymposium, USENIX Association, 2010, pp. 95–110.
[21] A. Yamada, H. Masanori, Y. Miyake, Web tracking site detection based ontemporal link analysis, in: Proc. of Intl. Conf. on Advanced InformationNetworking and Applications Workshops, IEEE Computer Society, 2010, pp.626–631.
[22] N. Jiang, J. Cao, Y. Jin, L.E. Li, Z.-L. Zhang, Identifying suspicious activitiesthrough DNS failure graph analysis, in: Proc. of the 18th IEEE Intl. Conf. onNetwork Protocols (ICNP), IEEE, 2010, pp. 144–153.
[23] J.P. John, A. Moshchuk, S.D. Gribble, A. Krishnamurthy, Studying spammingbotnets using botlab, in: Proc. of the 6th USENIX Symposium on NetworkedSystems Design and Implementation (NSDI), USENIX Association, 2009, pp.291–306.
[24] G. Gu, P. Porras, V. Yegneswaran, M. Fong, W. Lee, Bothunter: detectingmalware infection through ids-driven dialog correlation, in: Proc. of 16thUSENIX Security Symposium, USENIX Association, 2007, pp. 1–16.
[25] Alexa Internet Inc, Alexa top sites. <http://www.alexa.com>.[26] J. Zhang, Y. Xie, F. Yu, D. Soukal, W. Lee, Intention and origination: an inside
look at large-scale bot queries, in: Proc. of the 20th Annual Network andDistributed System Security Symposium (NDSS), ISOC, 2013.
[27] V. Batagelj, A. Mrvar, M. Zaversnik, Pajek. <http://pajek.imfm.si>.[28] T. Kamada, S. Kawai, An algorithm for drawing general undirected graphs, Inf.
Process. Lett. 31 (1989) 7–15.[29] DNS-BH project team, DNS-BH. <http://www.malwaredomains.com>.[30] MalwareDomainList, Malwaredomainlist.com. <http://www.malwaredomainlist.
com>.[31] Malc0de, malc0de.com. <http://malc0de.com/database>.[32] Threat Expert Ltd., Threat expert. <http://www.threatexpert.com>.
46 J. Lee, H. Lee / Computer Communications 49 (2014) 33–47

Author's personal copy
[33] Microsoft Corporation, Microsoft malware protection center. <http://www.microsoft.com/security/portal>.
[34] Symantec Corporation, Symantec threat explorer. <http://us.norton.com/securityresponse/threatexplorer/index.jsp>.
[35] McAfee Inc, Site advisor. <http://www.siteadvisor.com>.[36] The MalwareURL Team, MalwareURL. <http://www.malwareurl.com>.[37] SURBL, SURBL: URI Reputation Data. <http://www.surbl.org>.
[38] Microsoft Corporation, ATL collection classes. <http://msdn.microsoft.com/en-us/library/vstudio/15e672bd(v=vs.100).aspx>.
[39] R.E. Tarjan, Depth-first search and linear graph algorithms, SIAM J. Comput. 1(2) (1972) 146–160.
[40] H. Heaps, Information Retrieval, Computational and Theoretical Aspects,Library and Information Science, Academic Press, 1978.
J. Lee, H. Lee / Computer Communications 49 (2014) 33–47 47