author template for journal articles - almalaurea
TRANSCRIPT

The AlmaLaurea working paper series is designed to make available to a wide readership selectedworks by AlmaLaurea staff or by outside, generally available in English or Italian. The series focuses on thestudy of the relationship between educational systems, society and economy, the quality of educationalprocess, the demand and supply of education, the human capital accumulation, the structure and working ofthe labour markets, the assessment of educational policies.Comments on this series are welcome and should be sent to [email protected].
AlmaLaurea is a public consortium of Italian universities which, with the support of the Ministry ofEducation, meets the information needs of graduates, universities and the business community. AlmaLaureahas been set up in 1994 following an initiative of the Statistical Observatory of the University of Bologna. Itsupplies reliable and timely data on the effectiveness and efficiency of the higher education system tomember universities’ governing bodies, assessment units and committees responsible for teaching activitiesand career guidance.
AlmaLaurea:
facilitates and improves the hiring of young graduates in the labour markets both at the national andinternational level;
simplifies companies' search for personnel reducing the gap between the demand for and supply of simplifies companies search for personnel, reducing the gap between the demand for and supply of qualified labour (www.almalaurea.it/en/aziende/);
makes available online more than 1.5 million curricula (in Italian and English) of graduates, including those with a pluriannual work experience (www.almalaurea.it/en/);
ensures the optimization of human resources utilization through a steady updating of data on the careers of students holding a degree (www.almalaurea.it/en/lau/).
Each year AlmaLaurea plans two main conferences (www.almalaurea.it/en/informa/news) in which the results of the annual surveys on Graduates’ Employment Conditions and Graduates’ Profile are presented.
___________________________________________________________________________________________
AlmaLaurea Inter-University Consortium | viale Masini 36 | 40126 Bologna (Italy)Website: www.almalaurea.it | E-mail: [email protected]
___________________________________________________________________________________________
The opinions expressed in the papers issued in this series do not necessarily reflect the position of AlmaLaurea
© AlmaLaurea 2011Applications for permission to reproduce or translate all or part of this material should be made to:AlmaLaurea Inter-University Consortiumemail: [email protected] | fax +39 051 6088988 | phone +39 051 6088919

1
Factors Contributing to Participation in Web-based Surveys among Italian University
Graduates
by
Chiara Cimini
, Giancarlo Gasperoni
, Claudia Girotti
Abstract
An established yearly survey aimed at monitoring the employment opportunities of Italian graduates, traditionally
carried out with Cati methods, has been integrated during the last few years with Cawi. Cawi has become increasingly
crucial due to the high number of graduates involved in the survey, which has mandated a reduction in fieldwork
duration and unit costs. Although the seven Cawi surveys used here have different substantive and methodological
characteristics, preliminary analysis reveals a common trend: the utmost participation is observed during the first few
days immediately following initiation of fieldwork and, to a lesser degree, the delivery of follow-up reminders. Web
respondents comprise a self-selected subgroup of the target population, having better academic performance and greater
computer skills. A Cox regression model estimating response probability (or response time) shows, besides the obvious
effects of certain personal and survey design characteristics, that faster response times are expressed by graduates in
science or engineering and reporting good computer skills, whereas the fields of medicine/health and defence/security
and no computer skills give rise to lower response probability. Ways to use these findings for fine-tuning data collection
are discussed.
Keywords: Cawi surveys / Response rate / University graduates / Cox regression
ALMALAUREA Interuniversity Consortium – [email protected] University of Bologna, Dept. of Communication Disciplines – [email protected] ALMALAUREA Interuniversity Consortium – [email protected]

2
1. Introduction
For over ten years the ALMALAUREA Interuniversity Consortium1 has conducted annual large-scale
surveys with the goal of recording occupational outcomes of Italian university graduates 1, 3, and 5
years after their having earned their degrees. These surveys allow in-depth analyses of labour
market trends for graduates through the detailed collection of data concerning graduates training
and working experiences in the five years following completion of a university degree programme.
Until recently, the annual survey was performed only on individuals earning their degree in the so-
called “summer session”, i.e., in the period stretching from May to August of each year; graduates
in this session were no different, in their overall profile, than those who completed their studies in
other periods of the year. Recently, with the increase in the number of “post-reform” graduates2, the
survey has been extended to all graduates, regardless of the time of year in which they completed
their programmes and earned their degrees. This decision is based on various elements, including
the following facts:
1. University authorities need more detailed information, linked to single degree programmes, in
order to better plan new teaching activities and programmes and assess their quality.
2. Whereas summer session graduates were generally representative of all graduates in the pre-
reform system, this is no longer true in the post-reform system.
Of course, the extension of data collection to the entire population of graduates (as well as the
constant increase in the number of universities joining the consortium) has entailed a dramatic
increase in the number of individuals to be interviewed and engendered a need to contain the
surveys’ duration and costs. Since the year 2008, therefore, ALMALAUREA’s data collection
structure has undergone major changes. In particular, its traditional Cati (computer-assisted
telephone interviewing) methods have incorporated Cawi (computer-assisted web interviewing)
approaches (Cammelli 2009). This shift towards mixed-mode data collection has been made
possible by two important developments: on the one hand, an increasingly wide availability of
graduate e-mail addresses (which in general tend to be up-to-date, in that the graduates themselves
provide them when they revise their on-line résumés hosted on ALMALAUREA’s website and offered
to potential employers); on the other hand, the consortium’s growing experience in other on-line
surveys (twenty over the last five years)3. More precisely, starting with the 2008, all first- and
second-level graduates (of member universities)4 who have provided an e-mail address are invited
1 ALMALAUREA was founded in 1994 by the Statistics Observatory of the University of Bologna and became an inter-
university consortium in the year 2000. In March 2009 the number of its member universities was 52, which account for
approximately 70% of all Italian university graduates. ALMALAUREA was established primarily as a service for
graduates, member universities and employers. It pursues these goals by providing a timely data-base concerning high-
level human capital which is available on-line in order to help match supply and demand on the national labour market
and favour International labour mobility. For more information on ALMALAUREA’s survey methods, see its website:
www.almalaurea.it. 2 After the Bologna Declaration (1999), the Italian university system was extensively reformed. The new system,
introduced at the beginning of this decade, provides for the institution of first- and second-level degree programmes
(typically lasting, respectively, 3 and 2 years: so-called “post-reform” programmes) which have been gradually
replacing prior 4- and 5-year (“pre-reform”) programmes. 3 The first pilot studies were carried out in order to explore specific phenomena, usually pertaining in a general way to
occupational outcomes, in a short time and with low costs. Examples include a study concerning the job condition of
graduates aged at most 23, a study on graduates residing in the town of Imola, a study on intercultural dialogue aimed at
recording graduates’ opportunities at having contacts with non-Italian people and cultures in their workplaces. 4 Second-level graduates include those completing two-year “specialist” programmes (enrolment in which requires a
first-level degree; such programmes are equivalent to master’s programmes in Anglo-Saxon countries) and those
completing five- or six-year “unified cycle specialist” programmes (enrolment in which is possible with an upper
secondary school diploma).

3
via e-mail to respond to an on-line questionnaire5. Subsequently, all those who do not complete the
on-line questionnaire (including, of course, graduates who provided no e-mail address) are
contacted by telephone in order to administer the same questionnaire. (It should be noted that
ALMALAUREA surveys of graduates’ occupational outcomes are not sample surveys; they aspire to
collect data on all members of the target population.)
This shift had to be implemented with great care, in that ALMALAUREA’s surveys on graduates’ job
conditions have been characterised by exceptionally high response rates6. For example, in 2005
ALMALAUREA aimed to interview over 75,000 individuals who had graduated from member
institutions in 2000, 2002 or 2004 (in order to record their working conditions 1, 3 or 5 years,
respectively, after having earned a degree); for 2004 graduates the response rates were 87.5 and
86.4% (for post-reform and pre-reform programmes, respectively); for 2002 graduates the rate was
81.4%; for 2000 graduates 76.3%. The survey involved approximately 62,500 completed
interviews. In the year 2008, the target population of graduates who had earned their degree in 2007
increased to over 156,000, 88% of whom were successful interviewed (almost 138,000 individuals,
plus over 40,000 others contacted 3 or 5 years after completing their studies); the combination of
the two data collection methods allowed ALMALAUREA to continue achieving its relatively high
response rates. The decision to resort to web-based interviewing was facilitated not only by the
generally acknowledged strengths of on-line surveys (relating to speed, cost efficiency, Internet’s
global reach, flexibility, opportunities for methodological control: Jackob and Zerback 2006), but
also by the following considerations (which offset some of the weaknesses usually associated with
on-line surveys): the target population was “special”, in that it comprises people who are (almost
always) young, highly-educated, prone to Internet usage (but we will explore the theme of computer
skills’ effects later), generally equipped with a strong sense of identity towards their alma mater –
and who perhaps see themselves as having a vested interest in participating in the ALMALAUREA
survey. The implementation of this new data collection strategy requires the acquisition of more
information, especially as regards factors that contribute to high response rates in web-based
interviews and, subsequently, the modification of future research operations. In order to obtain this
information, we have analyzed a selection of ALMALAUREA surveys of graduates which have used
web-based interviewing techniques.
2. Selected Structural Features of ALMALAUREA Post-Graduate Surveys Using Web-based
Interviewing
The need to identify variables that affect Cawi response rates among graduates when the survey
concerns working conditions is best served by examining surveys involving a similar target
population. We have thus excluded from our analysis some web-based surveys that involved either
specific populations (graduates in particular fields of study) or specific topics (intercultural
dialogue), which could have introduced unwanted bias in response rates and therefore in our
findings. We have thus focused exclusively on surveys which concern post-reform graduates’
educational and occupational experiences one year after earning their degree.
We thus focus on seven separate studies involving a population of almost 254 thousand graduates
(Table 1), over 200 thousand of which (79,6% of the total) had provided a valid e-mail address7.
5 Unlike Cati surveys, which are contracted to an external company as regards the actual interviews, ALMALAUREA’s
carries out all stages of Cawi surveys internally, from the development of the questionnaire to delivery of e-mail
messages, from the management of follow-up messages to data collection. 6 Strictly speaking, this shift toward mix-mode data collection has not been rendered necessary due to a strong decline
in response rates when using Cati-based methods, although the prevailing trend pointing in this direction – in Italy as
elsewhere – will undoubtedly begin to have significant effects in the future (Callegaro and Poggio 2004; Cutrtin et al
2005; Berinsky 2008; Lavrakas 2008). 7 The remaining 20.4% includes graduates reporting no e-mail address as well as those who received no e-mail message
due to “permanent rejections” (erroneous e-mail addresses) or “temporary rejections” (full mailboxes, automatic “out-
of-office” replies, etc.). On the whole, graduates who were not contacted via e-mail are mostly those who did not

4
The incidence of e-mail availability varies among the populations considered: it is only 74% among
first-level graduates in 2004, but rises to 83% among second-level graduates in July-December
2007. This difference is in all likelihood due to the fact that possession of an e-mail account (and/or
willingness to disclose it) has been gradually rising among university graduates and the fact that
information quality has also been rising (as shown by the diminishing incidence of non-operational
e-mail addresses over the last few years)8.
Table 1 – Features of the target population of seven web-based surveys on graduates’ occupational
and educational experience one year after earning their degrees
Survey
ID
code
Type of graduate and
period in which degree was
earned
Graduates E-mail-equipped
graduates
N % having
e-mail N %
07 L 2004 47,380 74.0 35,043 17.4
08 L 2005 (January-April) 23,697 74.7 17,696 8.8
10 L 2005 (September-
December) 39,054 77.9 30,415 15.1
16 L 2007 (January-April) 41,591 81.1 33,711 16.7
18 LS 2007 (January-June) 13,956 83.9 11,706 5.8
22 L 2007 (July-December) 63,848 83.4 53,258 26.4
23 LS 2007 (July-December) 24,114 83.2 20,062 9.9
TOTAL 253,640 79.6 201,891 100.0 Note: L = first-level 3-year degree; LS = second-level degree.
The graduates equipped with e-mail and that could have participated in one of the seven surveys
mentioned here9 have been pooled into a single data base for the analyses that will form the focus of
section 4. The composition of this pooled data-base is described, in part, in the last column of Table
1. Survey no. 22, involving July-December 2007 first-level graduates, accounts for over a quarter of
the pooled target population, whereas other three surveys (including the only two comprising
second-level graduates) each account for less than 10% of the pooled target population.
The surveys here considered are similar as regards the topics addressed by the questionnaire, but
they differ as regards other structural features, such as the time of day and the day of the week on
which the survey started; the overall duration of data collection; the length of the questionnaire in
terms of number of items10
; the number of follow-ups sent out to non-respondents11
; the day of the
week on which follow-ups were sent (Table 2).
complete a previous questionnaire described in footnote 16; such graduates tend to be more numerous among
individuals residing in Central or Southern Italy and who have earned degrees in medicine; they also tend to have lower
self-reported computer skills. 8 Non-operational e-mail addresses usually comprise about 3% of the target population, varying between 5% among
first-level graduates in 2004 and in September-December 2005 and 1% among graduates in the first part of 2007. 9 In order to ensure that graduates were interviewed at the same interval of time from their degree – a required condition
for safeguarding comparison among data refereed to an entire year, all surveys (with the exception of the one on 2004
graduates) were divided into two or three separate data collection periods: for the year 2005 January-April graduates
were interviewed first, then those having earned their degrees in May-August (only via Cati), and finally those having
graduated in September-December; in 2007 the first group of interviews involved January-June graduates, and the
second group comprised July-December graduates. 10 The variable pertaining to “number of questions” distinguishes between: apparent questions (i.e., the number of items
the interviewee actually sees when he or she initially accesses the on-line questionnaire), minimum number of questions
(the number of questions that must be answered in the shortest possible version of the questionnaire, usually involving
unemployed graduates) and maximum number of questions (associated with the longest possible version of the
questionnaire, involving employed graduates and contingent on their responses to various items leading to other
conditional items).

5
Table 2 – Structural features of seven web-based surveys on graduates’ occupational and
educational experience one year after earning their degrees
Structural variables
Survey ID code
07 08 10 16 18 22 23
Day of initiation of data collection Thursday Tuesday Tuesday Monday Monday Monday Monday
Time of day at which data
collection started
9-11:30
a.m.
9-11:30
a.m.
12:30-2
p.m.
12:30-2
p.m.
12:30-2
p.m.
12:30-2
p.m.
9-11:30
a.m.
Duration of data collection in days 27 21 21 30 29 23 22
Number of follow-ups 2 1 1 2 2 2 2
Day of week on which first follow-
up was sent Thursday Tuesday
Wednes-
day Tuesday Tuesday Tuesday Tuesday
Day of week on which second
follow-up was sent Thursday – – Monday Monday
Wednes-
day
Wednes-
day
No. of apparent questions* 6.5 6.5 7 8 8 8 8
Minimum no. of questions* 7.5 9.5 9 11 10 11 10
Maximum no. of questions* 50.5 18.5 18 23 19 23 19 * In batteries each single item was counted as half a question.
More specifically, each survey on 2007 graduates was initiated on a Monday, the two surveys on
2005 graduates began on a Tuesday, and the survey on 2004 graduates commenced on a Thursday.
Four of the seven surveys kicked off at lunch time (12:30-2: p.m.), whereas the other three (2004
first-level graduates, January-April 2005 first-level graduates, July-December 2007 second-level
graduates) started earlier in the morning. The surveys had variable durations of fieldwork, ranging
from 21 days for the two surveys involving 2005 graduates to 30 days for the January-June 2007
first-level graduates. It is important to underscore the fact that in our earlier web-based studies, the
primary goal was to maximize the number of completed interviews, while possibly avoiding any
“request overload” for the graduates. Therefore, the duration of fieldwork, the number of follow-ups
and the days on which they were sent were determined on a “decide-as-you-go” basis, i.e.,
according to the evolution of daily response rates. The recent introduction of mixed data collection
strategies (Cati + Cawi) entails a more precise schedule for web-based interviewing: in particular,
the latter’s duration must be pre-determined, for Cawi data collection must terminate before a
certain date in order to commence procedures for the following Cati phase; this also means a tight
organization of follow-ups (usually two, in order to maximize the response rate and check the
amount of resources devoted to telephone interviewing).
3. Response Rates
Participation in web-based interviews in the surveys here considered was relatively high: 43% of
eligible graduates completed the on-line questionnaire12
. This result is quite positive, but also
appreciably lower than the response rate usually achieved in AlmaLaurea telephone surveys on the
same target populations. For example, in the 2008 Cati survey on pre-reform graduates’ job
conditions, the response rate ranged from 75% (for graduates contacted five years after graduation)
and 90% (after 1 year). In addition, the response rate varies widely according to the specific survey
11 A follow-up is here understood to be an additional e-mail message, usually sent after a week or so from the initial
message (or initial follow-up), addressed solely to members of the target population who have yet to complete the on-
line questionnaire. In the studies here examined at least one follow-up was used. 12 This response rate refers to the set of graduates who were equipped with a functional e-mail address, and thus
excludes graduates who reported no e-mail address and those having accounts which rejected the initial message (see
footnotes 7 and 8).

6
considered (Figure 1): only 38% among July-December 2007 second-level graduates, but 52%
among 2004 first-level graduates.
Figure 1 – Final response rates and contribution of follow-ups in seven web-based surveys on
graduates’ occupational and educational experience one year after earning their degrees
Participation depends, as we shall see later in more detail, on various factors associated with both
the target populations and the data collection strategies. Particularly relevant, although not
surprising, is the role of follow-ups. Each follow-up produced an immediate, sizeable increase in
the number of completed questionnaires, ranging from 9 to 12.5 percentage points for the first
follow-up and from 9 to 15 points for the second (when used)13
.
With the exception of survey no. 23 (July-December 2007 second-level graduates), the lowest
response rates are observed among 2005 first-level graduates (surveys nos. 8 e 10). This lower
participation does not seem to have been determined by a lower degree of interest among these
graduates; in fact, the same surveys also produced the highest initial (i.e., before performing the
first follow-up) response rates (29 and 26%, respectively). They also featured a sole follow-up14
, so
it seems reasonable to argue that if a second follow-up had been carried out final response rates
would have been even higher than the average of the others employing two follow-ups.
A closer look at the response rates shows that each survey has a similar response rate curve, the
general shape of which, regardless of the absolute values obtained in the various surveys, seems to
13 The contribution of the first follow-up is the ratio between the number of questionnaires completed from the day the
first follow-up was sent to the day preceding the second follow-up (or the last day of fieldwork if no second follow-up
was performed) and the total number of members of the target population having a functional e-mail address. Similarly,
the contribution of the second follow-up is the ratio between the number of questionnaires completed between the day
said follow-up was sent and the end of fieldwork and the total number of graduates with e-mail addresses. 14 Only one follow-up was carried out in these surveys in that the initial first-week yield and that of the first follow-up
were relatively plentiful. As previously mentioned, in the first ALMALAUREA web-based surveys the data collection
procedures were not rigidly predetermined; some key decisions, relating for example to the number of follow-ups and
when to perform them, were made after the commencement of data collection activities and especially on the basis of
the actual evolution of daily response rates.
52,2
38,8 38,5
45,847,7
40,037,8
Additional responses after 2nd follow-up
Initial response rate
Additional responses after 1st follow-up
9,0
14,7
11,111,6
9,78,8
24,122,7
28,825,1 26,0
20,021,3
12,410,0
12,5
12,012,0
9,0
Survey number% values
07 08 10 16 18 22 23
52,2
38,8 38,5
45,847,7
40,037,8
Additional responses after 2nd follow-up
Initial response rate
Additional responses after 1st follow-up
9,0
14,7
11,111,6
9,78,8
24,122,7
28,825,1 26,0
20,021,3
12,410,0
12,5
12,012,0
9,0
Survey number% values
52,2
38,8 38,5
45,847,7
40,037,8
Additional responses after 2nd follow-up
Initial response rate
Additional responses after 1st follow-up
52,2
38,8 38,5
45,847,7
40,037,8
Additional responses after 2nd follow-upAdditional responses after 2nd follow-up
Initial response rateInitial response rate
Additional responses after 1st follow-upAdditional responses after 1st follow-up
9,0
14,7
11,111,6
9,78,8
24,122,7
28,825,1 26,0
20,021,3
12,410,0
12,5
12,012,0
9,0
Survey number% values
07 08 10 16 18 22 2307 08 10 16 18 22 23

7
be affected by the number of follow-ups and the time of day (morning or afternoon) when data
collection commences. Figure 2 shows the daily response rate curves of two surveys (involving
first-level graduates in January-April 2005 and January-June 2007). These two curves are generally
representative of the evolution of daily response rates in all seven surveys. More specifically, the
first example in Figure 2 is typical of surveys in which data collection begins in the morning and
features a sole follow-up; the second example is typical of surveys in which data collection starts in
the afternoon and features two follow-ups. The figure clearly shows that participation is
concentrated in the initial days (hours, almost) of data collection and then rapidly drops off. More
specifically, if data collection begins in the morning, the first day is the one achieving the highest
response rate; if it begins in the afternoon, the highest daily response rate is achieved the following
day. Subsequent follow-ups show a similar pattern: an immediate growth and peak in completed
questionnaires, followed by a quick reduction. The number of peaks obviously corresponds to the
number of follow-ups (see also Camillo and Girotti 2008).
Figure 2 – Evolution of daily response rates for two typical web-based surveys on graduates’
occupational and educational experience one year after earning their degrees
Note: The initiation of data collection and the sending of follow-up messages are indicated by circles in the two graphs.
4. Estimating Response Probability (or Response Time) in Web-Based Surveys
ALMALAUREA data-bases contain information relating to graduates’ socio-demographic
characteristics (such as gender, age, social origins), university experience (geographic location of
university, field of study, final mark, delay in earning degree15
, intention to continue university-
level studies, willingness to repeat one’s programme choices), and additional acquired abilities
(such as computer skills). Such information is drawn from two different sources: on the one hand,
member universities supply ALMALAUREA with administrative data concerning their graduates; on
the other, each member university graduate is invited to complete a questionnaire shortly before
completion of studies16
and draft a résumé to be published on-line for the benefit of prospective
employers (the résumé contains information regarding the individual’s university career, previous
university and work experiences, special skills, professional goals, etc.).
15 A graduate is considered as having earned her or his degree with no delay when the degree programme is completed
in the legally defined number of years associated with the programme (three academic years for first-level degrees, two
years for second-level “specialist” degrees, five or six years for unified cycle degrees); if the degree is earned in a
greater amount of time, then there is a delay. The incidence of such delay in Italy was 57% among first-level graduates
in 2007 and 37% among second-level graduates in the same year. 16 This questionnaire is administered to students upon completion of their programmes, through which information is
collected concerning previous university experience, jobs held during university studies, satisfaction for a set of
university services and structures, and so on.
0
10
20
1 6 11 16 21 26
Data collection duration in days
L 2005 1 year Jan.-April
0
10
20
1 6 11 16 21 26
Data collection duration in days
L 2007 1 year - Jan.-June
1 follow-up 2 follow-ups

8
This ample availability of personal information, combined with the structural features of the
interviewing undertaken by ALMALAUREA (day and time of data collection commencement, number
of follow-ups, etc.), makes it possible to identify a profile for respondents and non-respondents in
the web-based surveys. The method used, the DEMOD statistical procedure implemented in SPAD
software, identifies variables that, regardless of their nature, distinguish a certain group of subject
from others. Appropriate probability tests (based on chi-squared coefficients) identify variable
categories or means that differ significantly from the overall population values and order them
according to their discriminating power. The results of this analysis, reported in the remaining part
of this section, should thus be interpreted in probabilistic terms: some groups have greater or lower
chances of possessing certain traits than the target population on the whole.
4.1. Respondents
Graduates who responded to a web-based questionnaire had a greater probability of having
completed a programme in the field of engineering, political and social science, economics or
statistics; they had a greater chance of having been enrolled in a Central Italian university (and
residing in Central Italy), achieved better-than-average school and academic performances (in terms
of final marks at both school- and university-leaving exams, age at which their degree are earned
and length of time devoted to completing the programme, regular attendance of lessons, and
“purity”17
), and completed first-level programmes. About 70% of respondents had at least one
parent with an upper secondary school diploma (and 25% had at least one parent with a university
degree), 32% came from the white-collar middle class18
, 65% were “student-workers”19
and 26%
have no previous work experience: all these percentages are significantly higher than those
observed in the target population. Respondents tended not to have studied abroad during their
university years, nor had they any previous university experiences. They intended to continue their
studies at a higher level and would repeat the same academic choices if they could go back in time
(80% would have picked the very same programme they just completed). Moreover, respondents in
ALMALAUREA’s web-based studies had a greater chance of having completed the pre-graduation
questionnaire (thus displaying a relatively favourable attitude towards survey participation) and also
of having good (self-reported) skills in the field of web-surfing, word processing software, use of
spreadsheets and computer operating systems; 72% claim to have good knowledge of at least three
different categories of computer tools. As regards the structural features of the surveys themselves,
graduates turned into actual respondents with a greater frequency when there was only a year
separating the fieldwork and the introduction of the new university reform20
, when data collection
was initiated in the morning, on a Thursday, when fieldwork lasted longer than usual and the
number of follow-ups was higher, when the number of apparent questions was relatively low and
the time elapsed since completing the degree was relatively short21
.
4.2. Non-respondents
Non-respondents, obviously, display different characteristics. They came from Northern Italy (in
terms of both enrolment, 59%, and residence, 52%), were relatively older when they completed
17 “Pure” graduates have carried their entire programme within the post-reform framework; “hybrids” are generally
older students who started in the pre-reform framework and then decided to transfer to a post-reform programme. 18 This social class scheme here used is that used by Cobalti and Schizzerotto (1994). 19 “Worker students” report having been engaged continuously in a full-time job for at least half the duration of their
university studies. “Student workers” comprise all other graduates who worked, to a lesser degree, during their
university experience. 20 Since initial surveys on post-reform graduates emphasized the importance of participation for assessing the reform’s
consequences, this variable was introduced in order to record the potential effect of this potential motivational aspect on
response rates. 21 The interval between date of interview and date of degree is calculated using the initiation of fieldwork as a reference
point for the former.

9
their studies and took longer to do so, and had weaker marks in their school- and university-leaving
exams. In relative terms, they did not intend to continue with university-level studies, came from
lower social class backgrounds, have weaker computer skills (especially as regards operating
systems, multimedia applications, and creating websites), and tended to have “hybrid” university
careers22
. As regards structural features of surveys that encouraged non-participation, we may cite
starting data collection in the afternoon, on Mondays or Tuesdays, longer time spans between
fieldwork and the introduction of university reform (60% four years, 26% two years) and between
fieldwork and time of completion of studies. Also, non-response is greater when the number of
apparent questions is higher than usual, when duration of fieldwork is shorter than usual, and when
there are relatively few follow-ups.
4.3. Estimating Response Rates with a Cox Regression Model
The probability of participating in a web-based survey – and, in more general terms, response time
– thus seems to be linked to both structural features concerning survey design and individual
characteristics relating to the graduates comprising the target population. In order to further explore
this topic we employed a Cox regression model (also known as a proportional hazard regression
model), that estimates response time curves when a set of explanatory variables’ effects is
controlled (Biffignandi and Pratesi 2003). This model identifies various factors that contribute to
response time in web-based interviewing, namely graduates’ field of study, computer skills,
intention to continue studying, and the geographic area in which degrees were earned.
The Cox regression model follows the approach of models based on survival data analysis, which
attempt to ascertain simultaneously the effect of a set of variables on expected survival time and
compare survival distributions among different subpopulations. Recourse to Cox regression model
seemed appropriate due to the presence of censored observations, i.e., individuals who at any given
time may have responded but haven’t done so (yet). In this study the Cox model was used to
estimate the function of survival in the state on non-respondent of each individual i – Si(t) – given a
set of explanatory variables. In formal terms, the model is expressed by the following function:
where Si(t) is survival function of individual i, i.e., the individual i’s probability of being still a non-
respondent after t units of time from the initiation of the survey; xij is value of the variable Xj for the
individual i; ßj is the parameter which expresses the effect of variable Xj on the survival function;
and S0(t) is the baseline survival function, which corresponds to the individual for which xij=0 for
every j = 1, …, J.
This model was applied to the over 200 thousand graduates equipped with an e-mail account and
who had been invited to complete ALMALAUREA’s on-line questionnaire23
. Potentially relevant
variables in determining response time, and therefore included in the model, are of two types: the
first type relates to survey structure; the second are individual, i.e., relate to graduates’ personal or
university study characteristics. Survey structural features included in the model are: day of the
week and time of day when fieldwork started; number of apparent questions which can be seen at
initial access of the on-line questionnaire; minimum and maximum number of questions24
; elapsed
time since earning of degree; years since introduction of university reform. We did not include the
number of follow-ups nor the day of week on which they were implemented due to the fact, as we
22 See footnote 17. 23 As previously stated in section 2, the analyses focus on graduates having a functional e-mail account; graduates
having reported no e-mail address or invalid ones have been excluded from the analysis. 24 See footnote 10.
10
previously stated, that in some of the surveys these elements were not planned out beforehand but
decided post hoc, mostly on the basis of observed daily response rates.
Individual variables relating to graduates included in the model are: gender, age upon completion of
degree programme, geographical location of university25
, field of study, the mark earned in the final
university-leaving exam, delay in earning degree, intention to continue studying, willingness to
repeat past choices26
, and number of computer skill categories in which the graduate is proficient.
Among all these variables, only two were identified as having no significant effect on response time
and were consequently omitted from the final model: day of the week when fieldwork started and
minimum number of questions.
Table 3 – Cox model for response time to a web-based interview: estimated parameters and
goodness-of-fit (reference categories in parentheses)
B Exp(B) Sig. B Exp(B) Sig.
Time of day initiation data collection
(12:30-2 p.m. = 0) –0.144 0.866 0.000
Field of study (Science = 0)
0.000
Max no. of items –0.016 0.984 0.000 Chemistry & pharmaceutics –0.248 0.780 0.000
No. of apparent items –0.416 0.660 0.000 Geology & biology –0.116 0.890 0.000
Elapsed time since degree (no. semesters) –0.044 0.957 0.000 Medicine and health –0.736 0.479 0.000
Years since university reform (1 year = 0) 0.000 Engineering –0.087 0.917 0.000
2 years –0.673 0.510 0.000 Architecture –0.441 0.643 0.000
4 years –0.240 0.787 0.013 Agriculture & veterinarian
medicine –0.209 0.811 0.000
Gender (men = 0) +0.063 1.065 0.000 Economics & statistics –0.256 0.774 0.000
University area (North = 0) 0.000 Sociology, political science,
etc. –0.289 0.749 0.000
Central Italy +0.103 1.108 0.000 Law –0.437 0.646 0.000
Southern Italy +0.032 1.033 0.000 Letters –0.342 0.711 0.000
Degree mark (66-110 scale) +0.008 1.008 0.000 Foreign languages –0.244 0.784 0.000
Age when earning degree –0.008 0.992 0.000 Teaching –0.444 0.642 0.000
Delay in earning degree (no delay = 0) 0.002 Psychology –0.217 0.805 0.000
1 year –0.018 0.982 0.034 Physical education –0.451 0.637 0.000
2+ years –0.035 0.966 0.001 Defence & security –1.385 0.250 0.000
Intention to continue studies (yes = 0) 0.000 Self-reported computer skills
(high, 3+ = 0)
No –0.108 0.898 0.000 None –0.353 0.703 0.000
Not available –0.239 0.788 0.000 Intermediate (1-2 categories) –0.115 0.891 0.000
Willingness to confirm past choices (same
degree = 0) 0.000
Not available –0.168 0.845 0.021
Yes, different degree +0.021 1.022 0.021
No –0.070 0.933 0.024
Not available –0.171 0.843 0.000
Note: Model’s chi-squared coefficient = 6420.067 / Degrees of freedom = 36 / Significance = 0.000.
Table 3 lists the estimated parameters of the Cox model: each B parameter represents the effect on
response time of the corresponding variable category with respect to the same explanatory
variable’s reference category (which is highlighted in bold). If B has a positive value it means that
the corresponding variable category exerts, with respect to the reference category, a negative
influence on the probability of persisting in the state of non-response. Vice versa, if the parameter
has a negative value, the probability of remaining a non-respondent increases. The label Exp(B)
identifies how much the odds ratio (i.e., the ratio between the probability of the “response” event
25 We have included graduates’ area of university as an indicator of geography, instead of area of residence, in that the
former has greater explanatory power. 26 The tendency to confirm one’s past choices was included as a proxy of graduates’ attachment to their university.

11
occurring and the probability of the opposite event occurring) varies for each unit of variation of the
independent variable or for any change in the independent variable’s category. The probability of
the “response” event occurring increases when Exp(B) is greater than 1, decreases when Exp(B) is
less than 1, and remains the same when Exp(B) is equal to 1.
Usually the only effects that are deemed worthy of note are those for which the significance level
(i.e., the value in the “Sig.” Column in Table 3) is lower than 0.05. All the effects listed in Table 3
have significance levels that are lower than 0.035.
The probability of remaining in the “non-response” condition can be conceptualized in terms of
risk, i.e., the “risk” of experiencing the event of “questionnaire completion”. Thus, a higher or
lower probability of remaining in the state of “non-response” corresponds to a lower or higher risk
of experiencing the “response” event27
. Since time is in any case an underlying dimension for this
type of risk, the latter can be effectively interpreted in terms of response time.
In order to facilitate comprehension of our findings, we have also included two figures relating to
the two variables mostly closely associated with response time. In particular, we draw attention to
the curves relating to the risk of having experienced “response” at time t for a set of fields of study28
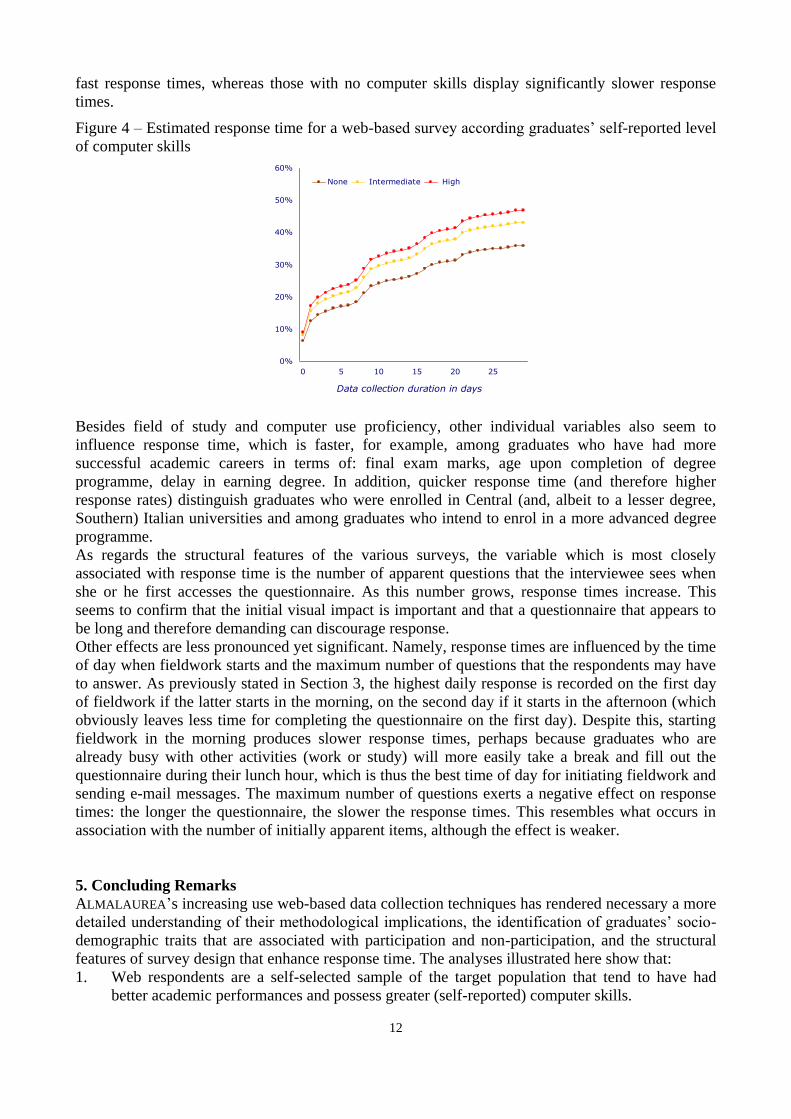
(Figure 3) and for differing levels of computer proficiency (Figure 4).
Figure 3 – Estimated response time for a web-based survey for a selection of graduates’ fields of
study
All other conditions being equal, graduated who earned a degree in science or engineering have
lower probabilities, at any time t, of having remained “non-respondents” and, therefore, faster
response times. Vice versa, individuals who majored in defence and security or in medicine and
health are distinguished by relatively slow response times. For example, on the tenth day of
fieldwork graduates belonging to one of the latter two groups have produced a response rate that is
lower than 22%, whereas more than 35% of their colleagues earning science or engineering degrees
have completed the questionnaires. The 35% threshold will not be achieved by the first two groups
even at the termination of fieldwork. The model estimated response rates on the 30th
day to be only
32% for medicine and health graduates and only 18% for defence and security graduates.
As Figure 4 shows, as computer skills grow the probability of response at time t also increases.
Graduates who claim to have good skills in at least three computer skill categories have relatively
27 The risk or probability of response is, obviously, the complement to 1 of the risk or probability of remaining in the
condition of non-respondent. 28 In order to render the graph more intelligible, only a selection of field of study response curves are depicted in Figure
3, and namely those with the fastest (“high” curves) or, vice versa, slowest (“low curves”) response times. Other fields
of study not represented in Figure 3 display intermediate response times.
0%
10%
20%
30%
40%
50%
60%
0 5 10 15 20 25
Data collection duration in days
Science
Engineering
Medicine and health
Defense & security

12
fast response times, whereas those with no computer skills display significantly slower response
times.
Figure 4 – Estimated response time for a web-based survey according graduates’ self-reported level
of computer skills
Besides field of study and computer use proficiency, other individual variables also seem to
influence response time, which is faster, for example, among graduates who have had more
successful academic careers in terms of: final exam marks, age upon completion of degree
programme, delay in earning degree. In addition, quicker response time (and therefore higher
response rates) distinguish graduates who were enrolled in Central (and, albeit to a lesser degree,
Southern) Italian universities and among graduates who intend to enrol in a more advanced degree
programme.
As regards the structural features of the various surveys, the variable which is most closely
associated with response time is the number of apparent questions that the interviewee sees when
she or he first accesses the questionnaire. As this number grows, response times increase. This
seems to confirm that the initial visual impact is important and that a questionnaire that appears to
be long and therefore demanding can discourage response.
Other effects are less pronounced yet significant. Namely, response times are influenced by the time
of day when fieldwork starts and the maximum number of questions that the respondents may have
to answer. As previously stated in Section 3, the highest daily response is recorded on the first day
of fieldwork if the latter starts in the morning, on the second day if it starts in the afternoon (which
obviously leaves less time for completing the questionnaire on the first day). Despite this, starting
fieldwork in the morning produces slower response times, perhaps because graduates who are
already busy with other activities (work or study) will more easily take a break and fill out the
questionnaire during their lunch hour, which is thus the best time of day for initiating fieldwork and
sending e-mail messages. The maximum number of questions exerts a negative effect on response
times: the longer the questionnaire, the slower the response times. This resembles what occurs in
association with the number of initially apparent items, although the effect is weaker.
5. Concluding Remarks
ALMALAUREA’s increasing use web-based data collection techniques has rendered necessary a more
detailed understanding of their methodological implications, the identification of graduates’ socio-
demographic traits that are associated with participation and non-participation, and the structural
features of survey design that enhance response time. The analyses illustrated here show that:
1. Web respondents are a self-selected sample of the target population that tend to have had
better academic performances and possess greater (self-reported) computer skills.
0%
10%
20%
30%
40%
50%
60%
0 5 10 15 20 25
Data collection duration in days
None Intermediate High

13
2. Follow-ups tend to produce an appreciable growth in response rates, which however is limited
to a short period immediately following the dispatch of follow-up messages.
3. Response time depends on both graduates’ personal characteristics (such as field of study,
intention to continue with university-level programmes, etc.) and survey design features (day
and time of data collection commencement, duration of fieldwork, etc.).
These findings can be useful for adapting ALMALAUREA’s future surveys in order to achieve the
highest possible response rates and reducing the amount of resources that have to be devoted to
more costly telephone interviewing. In other words, these results will inform decisions concerning
the advantageousness of implementing web-based data collection strategies and selected features of
web interviewing, including: apparent questionnaire length, day and time of initiation of data
collection, number of follow-ups, duration of fieldwork, and so on. Also, for example, as regards
graduate subpopulations having fast response times (i.e., graduates with majors in science or
engineering or having good computer skills), ALMALAUREA surveys could be performed
exclusively through web-based interviewing; whereas for subpopulations featuring slow response
times (security and defence or medicine and health majors, or those with rudimentary computer
skills) web-based interviewing could be ignored and data collection carried entirely via telephone.
Of course, such decisions need to consider (and require more research on) possible distortions in
data introduced by mixed-mode surveys (see, among others, Voogt and Saris 2005; de Leeuw 2005;
Dillman et al 2008).

14
References
Berinsky, AJ (2008): Survey non-response. In: Donsbach W, Traugott MW (eds) The Sage Handbook of Public
Opinion Research. Los Angeles: Sage, pp 310-321
Biffignandi S, Pratesi M (2003): Tempestività e qualità: aspetti concettuali e comportamenti di risposta nelle indagini
via Internet. Un’applicazione ad un’indagine regionale sulle imprese. In Biffignandi S, Gozzi G. (eds) Qualità e
informazione statistico economica territoriale. Aspetti del processo di formazione dei dati e delle metodologie di analisi.
Franco Angeli, Milan
Callegaro M, Poggio T, Espansione della telefonia mobile ed errore di copertura nelle inchieste telefoniche. Polis 18:
477-508. doi: 10.1424/18936
Camillo F, Girotti C (2007): L’impatto dell’integrazione di tecniche multiple di rilevazione nell’indagine sulla
condizione occupazionale ALMALAUREA: una misura di propensity score in spazi condizionati multivariati. In:
Consorzio Interuniversitario ALMALAUREA (ed) IX Profilo dei laureati italiani. La riforma allo specchio. Il Mulino,
Bologna, pp 289-309
Cammelli A (2009): XI Rapporto sulla condizione occupazionale dei laureati. Occupazione e occupabilità dei laureati a
dieci anni dalla Dichiarazione di Bologna, available on: http//www.almalaurea.it/universita/occupazione/occupazione07
Cobalti A, Schizzerotto A (1994): La mobilità sociale in Italia. Il Mulino, Bologna
Curtin R, Presser S, Singer E (2005): Changes in Telephone Survey Nonresponse over the Past Quarter Century. Public
Opinion Quarterly 69: 87–98
de Leeuw ED (2005): To mix or not to mix data collection modes in surveys. Journal of Official Statistics 21: 233–255
Dillman DA, Phelps G, Tortora R, Swift K, Kohrell J, Berck J, Messer BL (2009) Response rate and measurement
differences in mixed-mode surveys using mail, telephone, interactive voice response (IVR) and the Internet. Social
Science Research 38: 1-18. doi: 10.1016/j.ssresearch.2008.03.007
Heerwegh D, Loosveldt G (2008): Face-to-Face versus Web Surveying in a High-Internet-Coverage Population:
Differences in Response Quality. Public Opinion Quarterly 72:836-846. doi:10.1093/poq/nfn045
Jackob N, Zerback T (2006): Improving Quality by Lowering Non-Response: A Guideline for Online Surveys, paper
presented at the Sixth WAPOR Seminar on “Quality Criteria in Survey Research”, Cadenabbia
Lavrakas, PJ (2008): Surveys by telephone. In: Donsbach W, Traugott MW (eds) The Sage Handbook of Public
Opinion Research. Los Angeles: Sage, pp. 249-261
Voogt RJJ, Saris WE (2005): Mixed Mode Designs: Finding the Balance between Nonresponse Bias and Mode Effects.
Journal of Official Statistics 21:367-387