author manuscript nih public access howard e … · studies of human disease diagnosis and ......
TRANSCRIPT

See discussions, stats, and author profiles for this publication at: https://www.researchgate.net/publication/50267014
Loss of Neuronal Integrity During Progressive HIV-1 Infection of Humanized
Mice
Article in The Journal of Neuroscience : The Official Journal of the Society for Neuroscience · March 2011
DOI: 10.1523/JNEUROSCI.5473-10.2011 · Source: PubMed
CITATIONS
74
READS
56
10 authors, including:
Some of the authors of this publication are also working on these related projects:
MLK3 cancer View project
Translational humanized mouse models View project
Prasanta Dash
University of Nebraska at Omaha
111 PUBLICATIONS 682 CITATIONS
SEE PROFILE
Santhi Gorantla
University of Nebraska at Omaha
100 PUBLICATIONS 2,270 CITATIONS
SEE PROFILE
Howard E Gendelman
University of Nebraska Medical Center
597 PUBLICATIONS 29,334 CITATIONS
SEE PROFILE
Jackie Knibbe
University of Nebraska at Omaha
10 PUBLICATIONS 147 CITATIONS
SEE PROFILE
All content following this page was uploaded by Larisa Poluektova on 02 June 2014.
The user has requested enhancement of the downloaded file.
Loss of Neuronal Integrity During Progressive HIV-1 Infection ofHumanized Mice
Prasanta K. Dash1, Santhi Gorantla1, Howard E Gendelman1,4,*, Jaclyn Knibbe1, George PCasale3, Edward Makarov1, Adrian A Epstein1, Harris A Gelbard5, Michael D Boska2, andLarisa Y Poluektova11 Department of Pharmacology and Experimental Neuroscience, University of Nebraska MedicalCenter, Omaha, Nebraska, 68198 USA2 Department of Radiology, University of Nebraska Medical Center, Omaha, Nebraska, 68198USA3 Department of Surgery, University of Nebraska Medical Center, Omaha, Nebraska, 68198 USA4 Department of Internal Medicine, University of Nebraska Medical Center, Omaha, Nebraska,68198 USA5 Center for Neural Disease and Development and the Departments of Neurology, Pediatrics andMicrobiology, University of Rochester Medical Center, New York, NY, USA
AbstractNeuronal damage induced by ongoing HIV-1 infection was investigated in humanized NOD/scid-IL-2Rgc
null mice transplanted at birth with human CD34-positive hematopoietic stem cells. Miceinfected at 5 months of age and followed for up to 15 weeks maintained significant plasma viralloads and showed reduced numbers of CD4+ T cells. Prospective serial proton magnetic resonancespectroscopy tests showed selective reductions in cortical N-acetyl aspartate in infected animals.Diffusion tensor imaging revealed structural changes in cortical gray matter. Postmortemimmunofluorescence brain tissue examinations for neuronal and glial markers, captured bymultispectral imaging microscopy and quantified by morphometric and fluorescence emission,showed regional reduction of neuronal soma and synaptic architectures. This was evidenced byloss of microtubule-associated protein 2, synaptophysin and neurofilament antigens. This study isthe first, to our knowledge, demonstrating lost neuronal integrity following HIV-1 infection inhumanized mice. As such, the model permits studies of the relationships between ongoing viralreplication and virus-associated neurodegeneration.
IntroductionHIV-1-associated neurocognitive disorders (HAND) remain the most common centralnervous system (CNS) disease linked to advanced viral infection and present despite thewidespread use of antiretroviral therapy (Antinori et al., 2007). Although considerableresearch is directed toward understanding disease pathobiology, little is known about diseaseonset and progression. How advanced viral infection elicits neuronal damage is linked toimmune, neural cell, and tissue pathobiologic events. These are critical in ultimatelyproducing cognitive, behavioral, and motor disorders and causing disabling morbidity ininfected people (McArthur et al., 2010).
*Corresponding author: Howard E. Gendelman, M.D.; Department of Pharmacology and Experimental Neuroscience; University ofNebraska Medical Center; Omaha, NE 68198-5215; [email protected], phone 402 559 8920; fax 402 559 3744.
NIH Public AccessAuthor ManuscriptJ Neurosci. Author manuscript; available in PMC 2011 September 2.
Published in final edited form as:J Neurosci. 2011 March 2; 31(9): 3148–3157. doi:10.1523/JNEUROSCI.5473-10.2011.
NIH
-PA Author Manuscript
NIH
-PA Author Manuscript
NIH
-PA Author Manuscript
Virus invades the CNS within one to two weeks after viral infection coincident with thepeak of viremia and seen within perivascular macrophages and lymphocytes (Davis et al.,1992; Horn et al., 1998; Williams et al., 2001). During the seroconversion reaction mildaseptic meningitis is observed in up to 20% of infections (Atwood et al., 1993; Newton,1995; Gray et al., 1996; del Saz et al., 2008). The long-term sequelae of such events to thebrain are incompletely understood (Boufassa et al., 1995; Wallace et al., 2001). Althoughsuch pathobiological events are best studied in animal models of human disease (Kraft-Terryet al., 2009), gaps in understanding HIV-1 neuropathogenesis parallel the limited availabilityof relevant model systems. As lentiviral infections are host-cell specific, the mainstay forstudies of human disease have centered on the use of rhesus macaques infected with simianimmunodeficiency virus (Lackner et al., 1991; Narayan et al., 1995). While this model hasyielded insights into viral pathobiology and can, in part, mimic human disease, existinglimitations in terms of cost, conduct, and availability to investigators have hamperedresearch progress. This has galvanized efforts to develop disease-relevant rodent models(Santoro et al., 1994; Toggas et al., 1994; Persidsky et al., 1996; Reid et al., 2001; Kim etal., 2003; Potash et al., 2005). Nonetheless, such models, while demonstrating relevance forstudies of human disease diagnosis and therapies, have also met with limitations. Theselimitations include impaired graft survival and the inability to mimic progressive HIVinfection and neuroAIDS, in particular. The recent development of humanized NOD/scid-IL-2Rγc
null (NSG), Balb/c-Rag2−/−γc−/− (BRG), and NOD/scid mice by transplanting withhuman cord blood isolated CD34+ hematopoietic stem cells (HSC), or with fetal liver andthymus (BLT), have overcome many of these limitations. Indeed, humanized mice canfacilitate studies of chronic HIV-1 infection in immune grafts that are sustained for thelifetime of the animal [reviewed in (Van Duyne et al., 2009)]. Importantly, in the field ofneuroAIDS, this model may identify relationships between HIV-1 disease progression andneuropathobiology.
To these ends, NSG mice were transplanted at birth with CD34+ HSC (CD34-NSG) theninfected with HIV-1. During progressive viral infection we investigated when and to whatextent neuronal injuries occur after infection onset and how such changes correspond toimmune, neuronal and glial aberrations. The data showed that progressive viral infectioncorrelated with loss of neuronal integrity. As such, this model can uncover relationshipsbetween ongoing viral replication and its associated neural dysfunction, and is useful forstudies of HIV-1 neuropathogenesis and therapeutic development.
Materials and MethodsGeneration of CD34-NSG mice
Animals were obtained from the Jackson Laboratories (Bar Harbor, ME) and bred underspecific pathogen-free conditions in accordance with the ethical guidelines for care oflaboratory animals at the University of Nebraska Medical Center (UNMC) and set forth bythe National Institutes of Health.
CD34+ cells were obtained from fetal liver. Tissues were provided by the University ofWashington, Laboratory of Developmental Biology supported by NIH Award Number5R24HD000836 from the Eunice Kennedy Shriver National Institute of Child Health &Human Development. CD34+ cells were enriched using immunomagnetic beads (CD34+
selection kit; Miltenyi Biotec Inc., Auburn, CA). Purity of CD34+ cells was >90% by flowcytometry. Cells were transplanted into newborn mice irradiated at 1 Gy using a C9 cobalt60 source (Picker Corporation, Cleveland, OH). CD34+ cells were injected intrahepatically(i.h.) at 105 cells/mouse in 20μl phosphate-buffered saline using a 30-gauge needle. Thelevels of engraftment and number of human cells in peripheral blood were analyzed by flowcytometry.
Dash et al. Page 2
J Neurosci. Author manuscript; available in PMC 2011 September 2.
NIH
-PA Author Manuscript
NIH
-PA Author Manuscript
NIH
-PA Author Manuscript

Flow cytometryPeripheral blood was collected from the submandibular vein in ethylenediaminetetraaceticacid (EDTA)-coated tubes by using lancets (MEDI point, Inc., Mineola, NY) or bycardiocentesis at the study end. Blood leukocytes and spleen cell suspensions (collected atend point of the experiment) were tested for human pan-CD45, CD3, CD4, CD8, CD14, andCD19 markers as six-color combinations. Antibodies and isotype controls were obtainedfrom BD Pharmingen, San Diego, CA, and staining was analyzed with a FACSDiva (BDImmunocytometry Systems, Mountain View, CA). Results were expressed as percentages oftotal number of gated lymphocytes. The percentages of CD4 and CD8 positive cells wereobtained from the gate set on human CD3+ cells. Four HIV-1 infected and six control-uninfected animals (all male) were analyzed.
HIV-1 infection and peripheral VLAt 22 weeks of age male mice were injected intraperitoneally (i.p.) with HIV-1ADA using asingle dose of 105 50% tissue culture infectious doses (TCID50)/ml. Levels of viral RNAcopies/ml were analyzed with the automated COBAS Amplicor System V1.5 (RocheMolecular Diagnostics, Basel, Switzerland). For the assay, 10 μl of mouse sera were dilutedto 500 μl with sterile filtered normal human sera. The detection limit of the assay afterdilution is 2500 viral RNA copies/ml.
Quantitative localized 1H MRSSingle voxel localized spectra were acquired using point resolved spectroscopy (PRESS)with outer volume suppression and high bandwidth pulses to optimize sequenceperformance. Acquisitions were acquired with a repetition time of 4 seconds, echo time of33 ms, 256 averages, using volume coil transmit and surface coil receive on a 7 Tesla/16 cmBruker Pharmascan (Karlsure, Germany) MRI/MRS system. Single-scan-localizedunsuppressed water signals were acquired as a reference for metabolite quantification.Spectroscopic data were processed by removal of residual water signal using the HLVSDfilter. Spectra from 1H MRS data sets were curve fitted in the time domain. Time domainanalyses prevent the uncertainties associated with fitting the baseline to remove base lineintensity contributions to peak areas. Signals were fit in the time domain by the QUESTalgorithm (Ratiney et al., 2004; Ratiney et al., 2005) using spectra (basis set) obtained fromphantoms acquired by the same pulse sequence used during in-vivo acquisition. Data forbasis sets were used to calibrate signal intensities. These were normalized to water withoutcorrection for relaxation. Metabolite concentrations reported were semiquantitative. Topreclude concentration corrections for relaxation, water normalized signal amplitudes werepresented in institutional units (IU). IU approximates millimolar concentrations ofmetabolites.
DTI acquisitionMice were anesthetized by inhalation of 1–2% isoflurane in a nitrous oxide/oxygen mixture,during MRI data acquisition. DTI data were obtained using a 7 Tesla/16 cm BrukerPharmascan (Karlsure, Germany), an actively decoupled 72 mm volume coil transmitter anda laboratory built 1.25×1.5 cm surface coil receiver. Reference coronal mouse brain imageswere obtained using 3D FLASH with acquisition parameters of 24 × 24 × 16 mm field-of-view (FOV), a 128 × 128 × 32 matrix, 35° flip angle, 50 ms repetition time (TR), 3 ms echotime (TE), and two averages for a total acquisition time of 7.5 min. DTI data were acquiredusing single-shot diffusion-weighted spin-echo echo-planar imaging (TE=43 ms).Respiratory gating was used to prevent motion artifacts. Acquisition was repeated at TR =10–15 s depending on respiratory rate and one shot per breath. EPI acquisition parametersincluded: 14 slices, 200 kHz bandwidth, 96 × 96 in-plane acquisition zero-filled to 256 ×
Dash et al. Page 3
J Neurosci. Author manuscript; available in PMC 2011 September 2.
NIH
-PA Author Manuscript
NIH
-PA Author Manuscript
NIH
-PA Author Manuscript

256, and a 0.5-mm slice thickness. The diffusion encoding used was a balanced, rotationallyinvariant and alternating polarity icosahedral scheme (12 directions) (Boska et al., 2007).The encoding scheme was designed to reduce background-diffusion gradient coupling(Neeman et al., 1991a; Neeman et al., 1991b). Diffusion weighting b-factor = 800 s/mm,d=4 ms, D=15 ms, Gdmax = 40 G/cm, 200 ms rise time, 7 averages for b=0 acquisition, 3averages for each b=800 encoding direction, for a total acquisition time of 20–40 min,depending on respiratory rate. Respiratory monitoring of animals, gating of the MRI system,and temperature monitoring of phantoms were done using an SA instruments model 1025MRI compatible physiological monitoring system (Model 1025, SA Instruments, StonyBrook, NY). Animal temperature control was maintained using a circulating water bath(Gaymar Industries, Orchard Park, NY) with heat exchange coils surrounding the mousebody on a custom-constructed MRI-compatible stereotactic mouse holder to immobilize thehead. Water phantom studies using identical acquisition parameters and coils as the in vivodata were acquired monthly for quality assurance of instrument stability as well as tovalidate the lack of direct effect of HIV-1 on Dav and FA. Phantoms were chosen as theyclosely matched the coil loading of a mouse. Phantom temperature was monitored by thethermocouple of the MRI compatible monitoring system (SA Instruments). These studiesshow consistent temperature-corrected Dav (mean ± SD: 2.29±0.30×10⁻³ mm2/s at 24 °C)and low FA (0.065 ± 0.035).
Image analysesAnalyses of the diffusion-weighted data were performed using custom programs written inIDL as previously described (Basser et al., 1994b, a; Hassan et al., 2001). Analysesproduced maps of the tensor diffusivities (λ1, λ2, λ3), average diffusivity (Dav) where: Dav =1/3*(λ1 + λ2 + λ3) and fractional anisotropy (FA). Transverse (λ⊥ = (λ2 +λ3)/2) andlongitudinal (λ|| = λ1) components of the diffusion tensor were obtained as described (Hasanand Narayana, 2006).
Statistical analysisValues of Dav, FA, λ ⊥, and λll were acquired from both hemispheres of each mouse studied.The values from both regions of interest were averaged to arrive at the value of eachvariable as a single observation within each mouse, as paired t-test demonstrated nodifference between results in the two hemispheres. Changes of FA, Dav, λ ⊥, and λll afterinfection were compared to pre-infection values by an unpaired t-test as a preliminaryanalysis. Differences were considered significant at p<0.05. Statistical comparisons areperformed using SPSS 14 (SPSS Inc, Chicago, IL).
Histopathological evaluationBrains were perfused with phosphate buffer saline (PBS) followed by 4% paraformaldehydeand then post fixed overnight and embedded in paraffin. Sections 5μ-thick were cut from theparaffin blocks, mounted on glass slides and labeled with mouse monoclonal antibodies(DakoCytomation, Carpinteria, CA) for HLA-DQ/DP/DR (clone CR3/43, 1:100), HIV-1p24 (clone Kal-1, 1:10), glial fibrillary acidic protein (GFAP, 1:1000). Microglia andmacrophages were stained with rabbit polyclonal antibodies to ionized calcium bindingadaptor molecule 1 (Iba-1, 1:500, Wako Chemicals USA, Inc., Richmond, VA). Thepolymer-based HRP-conjugated anti-mouse and anti-rabbit Dako EnVision systems wereused as secondary detection reagents and developed with 3,3′-diaminobenzidine (DAB). Allparaffin-embedded sections were counterstained with Mayer’s hematoxylin. Deletion ofprimary antibodies or mouse IgG served as controls. Images were obtained with a NikonDS-Fi1 camera fixed to a Nikon Eclipse E800 (Nikon Instruments, Melville, NY) usingNIS-Elements F 3.0 software.
Dash et al. Page 4
J Neurosci. Author manuscript; available in PMC 2011 September 2.
NIH
-PA Author Manuscript
NIH
-PA Author Manuscript
NIH
-PA Author Manuscript

Immunofluorescence labeling, multispectral imaging and image analysesSlide specimens (5μ thick) of paraffin-embedded mouse brain were selected from thecorresponding regions analyzed by DTI. Brain sections were treated with different pairedcombinations of primary mouse monoclonal antibodies to 200kDa+68kDa neurofilaments(NF, clone 2F11, 1:200, DakoCytomation) and Synaptophysin (SYN, 1:1000, NovusBiologicals, Littleton, CO), and rabbit polyclonal antibodies to MAP2 and GFAP. Primaryantibodies were labeled with secondary anti-mouse and anti-rabbit antibodies conjugated tothe fluorescent probes Alexa Fluor® 488 and Alexa Fluor® 594 and nuclei were labeledwith 4′,6-diamidino-2-phenylindole (DAPI). Slides were cover slipped with ProLong Goldanti-fade reagent (Invitrogen, Carlsbad, CA), allowed to dry for 24 hr at room temp and thenstored at −20 °C for future use. Images were captured at wavelengths encompassing theemission spectra of the probes, with a 20× objective. The fluorescence emission of eachprobe and autofluorescence of the tissue samples were analyzed by multispectral imaging/image analysis, with an automated fluorescence microscope (Leica DMRXA2; NorthCentral Instruments, Minneapolis, MN), Nuance EX multispectral imaging system(Cambridge Research Instruments, Worburn, MA), and ImageProR Plus image analysissoftware (Media Cybernetics, Bethesda, MD). These spectra were incorporated into aspectral un-mixing algorithm (Nuance system) that quantitatively separated the grayscaleimages representing each spectral component. The grayscale images representing eachfluorescent probe were exported from the Nuance system to the ImageProR Plusenvironment where fluorescent events, in brain regions of interest, were partitioned and thefluorescence signal (same exposure times for controls and infected samples) was quantifiedas mean pixel intensity (12-bit grayscale) and total area (μ2) of positive labeling. Area-weighted average fluorescence intensity was calculated for MAP2 and SYN expression bydividing the sum of the product of area and mean fluorescence intensity, for each partitionedarea, by the sum of the partitioned areas. Low image resolution was achieved by confocalmicroscopy housed within this automated fluorescence microscope system. Flourescenceemission, across areas of hundreds of microns, were captured by wide-field microscopy.Loss of light at the perimeters was judged as negligible as partitions included areas ofinterest up to 200,000 sq microns and individual events of 25–50 sq microns.
ResultsHuman cell reconstitution and HIV-1 infection of mice
Four humanized animals were monitored prospectively for numbers of CD4+ and CD8+
cells in circulation and, at the end point of observation, in spleen. At 22 weeks of age micewere infected with HIV-1ADA and viral load (VL) was assayed at 2, 4, 8, 12 and 15 weekspost infection (wpi) (Figure 1A-D), this was performed at the same time as MRS/DTIimaging. VL peaked at 4 weeks after viral infection and all infected animals had a sustainedVL (1.7×10⁴ – 7.6×10⁵ RNA copies/ml). The decline of CD4+ cells progressed rapidly dueto disease between 8 and 15 weeks (Figure 1B) but did not change in control non-infectedmice observed over the same time period (n=30 weeks) (Fig. 1C). The rapid decrease in theCD4 count during the course of infection, forced us to terminate the study at 15 wpi. Thehuman cell profiles in the spleens of infected animals at the termination point were alsoanalyzed (Fig. 1E). Animals were stratified according to their immune status and peripheralVL. Animals m969, m973 had 21.1% and 36.4% of CD3+CD4+ cells in splenic lymphoidtissue, CD4:CD8 cell ratios 1.0 and 0.8 (lower compared to 2:1 – 3:1 in uninfected animals)and peripheral VL 1.71×10⁵ and 0.65×10⁵ viral RNA copies/ml, respectively. They wereconsidered less affected by HIV-1 infection compared to two other mice m983 and m985,which had higher VL (7.6×10⁵ and 4.81×10⁵ viral RNA copies/ml), inverted CD4:CD8ratios (0.1 and 0.4) and m983 had the lowest number (3.4%) CD3+CD4+ cells in spleen.
Dash et al. Page 5
J Neurosci. Author manuscript; available in PMC 2011 September 2.
NIH
-PA Author Manuscript
NIH
-PA Author Manuscript
NIH
-PA Author Manuscript

Brain immunopathobiologyBrain pathologies, which included influx of activated HLA-DR+ human cells, activation ofmicroglial cells (Iba-1), and astrogliosis (GFAP) were determined by immunohistology ofparaffin-embedded 5μ-thick sections (Fig. 2). Brain regions including frontal cortex,whisker barrel (WB) somatosensory cortex (not shown), cerebellum, corpus callosum,hippocampus and brainstem were investigated. Mouse m983 (with highest VL and lowestCD3+CD4+ cell percentage in spleen) had the most severe brain pathology. The presence ofscattered lymphocytes in brain parenchyma, accumulation of human cells in meninges, andformation of perivascular cuffs around brain microvessels were found (Fig. 2). In the pons/medulla, activation of microglial cells with nodule formation not directly associated withhuman cell infiltration was noted. The same markers in control uninfected humanized miceof the same age group were analyzed and the data of one representative mouse (m975) areshown in Fig. 2. Based on the CD4 cell profiles, viral load profiles, and brain pathologiesobserved, the animals were grouped into two categories as severe brain pathology (m983and m985) and moderate brain pathology (m969 and m973).
1H MRS measures1H-MRS tests were employed to determine if changes in neuronal integrity could be present.These results were validated by immunocytochemical tests for neuronal integrity. Theregions selected for spectroscopic examination using the PRESS volume selectivespectroscopic acquisitions included cerebral cortex, hippocampus, cerebellum andbrainstem/pons (Fig. 3A). 1H MRS was collected from 4 humanized NSG mice at differenttime points (0, 4, 8, 12 and 15 weeks post-infection with HIV). Preinfection reconstituted(time=0 weeks), unmanipulated humanized NSG mice aged three months (n=5) and NSGmice aged six months (n=3), showed no significant differences in N-Acetyl aspartate (NAA)concentrations among the different brain regions studied (data not shown). The NAAconcentration of uninfected mice of equivalent age (36 weeks) and time (equal to 15 weekspost-infection) was 10–12 IU as measured in the cerebral cortex. The nervous system-specific metabolite NAA, which is synthesized in neurons and appears to be a key link indistinct biochemical features of CNS metabolism, was measured at the time points describedabove. The means ± SEM of NAA concentration normalized to water for quantitativeassessments are presented in Fig. 3B. It can be clearly seen that NAA is significantlyreduced over the course of infection in the cerebral cortex (Fig. 3B) but not in thecerebellum, hippocampus or brainstem/pons regions. Moreover, one mouse (m983) showeda substantial reduction in NAA in the cerebellum (NAA=6.85 IU) at the 15 wpi. As NAA iscommonly presented as a ratio to creatine; we compared NAA levels normalized to creatineor to water. Both measures were nearly identical. Creatine remains constant over time in theanimals (data not shown). This enabled NAA ratios to be presented in results whennormalized to water
DTI testsThe DTI measures for FA reflect changes of the tissue organization at a microscopic levelby measuring water diffusion in different directions, which changes as a consequence ofstructural neuronal geometry. DTI examinations were performed over the same time periodas 1H MRS measurements. DTI results from the selected regions measured bilaterally fromthe four animals were divided based on peripheral immune status, VL and brainimmunopathology analyzed independently. Results from the severely affected mice (m983and m985) are presented in Fig. 4. Notable and consistent changes include increased FA inthe frontal cortex and hippocampus as well as decreased Dav, λll and λ⊥in the WB alongwith other cortical areas and hippocampus. Multiple grey matter regions show statisticallysignificant changes over the course of disease development, more than were found frommoderately affected mice m969 and m973 (data not shown). In the WB there was a strong
Dash et al. Page 6
J Neurosci. Author manuscript; available in PMC 2011 September 2.
NIH
-PA Author Manuscript
NIH
-PA Author Manuscript
NIH
-PA Author Manuscript
linear correlation between VL and FA, specifically when correlated magnitude of FAincrease (Δ) from pre-infection to 15 wpi (R2 = 0.9987). The same strong trends were foundfor decline of Dav diffusivity (Fig. 4E and F). Similar correlations of FA and VL wereobserved in the pons/medulla (R2 = -0.9811) (data not shown).
Quantitated neuronal morphology by multispectral fluorescence microscopyTo determine whether in vivo reduction of NAA concentration detected by 1H MRS andchanges in DTI values correspond to changes of brain architecture, at termination of theexperiment, immunofluorescence neuronal and glial antigens were analyzed by multispectralfluorescence microscopy of replicate brain regions. The images captured with the Nuancemultispectral imaging system (20× objective) were converted to 12-bit grey scale imagesand quantified using ImagePro® Plus software. Representative images of the labeledneuronal markers captured (40× objective) with the Nuance multispectral imaging systemare presented in Fig. 5. The cortical neurons of control animals showed normal MAP2-immunolabeled dendrites, whereas the HIV-1 infected humanized mice showed decreasedexpression of MAP2-immunolabeled dendrites with irregular and wavy contours. SYNlabeling in cortical areas of control animals was observed as diffusely punctate, whereasSYN expression was irregularly shaped in all infected animals. Reduction of NF-positivefibers was observed in the cortex of animals with significant immune and brain pathology(m983 and m985) compared to less affected (m969 and m973) and control animals. In WBof all infected animals the amount of NF was significantly reduced (Fig. 5). However, in thepons/medulla these changes were not as significant as seen in cortex and WB (Fig. 5 lowerright panel).
For MAP2 and SYN, the quantitative data were expressed as total positive area/total areaanalyzed in square microns and their corresponding mean pixel density intensity (Fig. 6).For NF and GFAP, data were expressed as total area labeled. There was a diminution in thecerebral cortex and WB of MAP2 and SYN levels compared to uninfected animal but not inthe pons/medulla. The most dramatic reduction of NF labeling was found in WB (Fig. 6).Observed changes allowed us to suggest that in addition to dendritic/synaptic proteinaberrations, the damage represented by NF also contributed to the changes of [NAA] andMRI/DTI metrics.
DiscussionHIV-1-associated neuropathology seen during progressive viral infection of humanizedCD34-NSG mice was linked to systemic viral infection. The sequence of events consisted ofviral invasion of the nervous system, glial neuroinflammatory responses, andneurodegeneration. Early development of aseptic meningitis and CD4+ T lymphocytedepletion was also observed, as reported (Gorantla et al., 2007; Gorantla et al., 2010b;Gorantla et al., 2010a). After the initiation of viral infection, development of neuronalabnormalities in cerebral cortex were seen in the animals for up to 15 weeks byspectroscopic and diffusion tensor imaging and confirmed by immunohistological tests.These revealed decreased expression of SYN, an integral protein in presynaptic terminals,and MAP2, a marker for neuronal cell bodies and dendrites, and axonal NF in cerebralcortex. Such changes reflect substantive neurodegeneration and are also found in the brainsof HIV-1-infected individuals.
Human neuropathology was previously studied in some depth during the later stages of viralinfection in the absence of combination antiretroviral therapy. This is where encephalitiswas commonly seen and was a result of virus-infected mononuclear phagocytes (bloodderived perivascular macrophages and microglia) and formation of multinucleated giantcells, astrogliosis, myelin pallor and neuronal morphologic changes. The latter was seen as
Dash et al. Page 7
J Neurosci. Author manuscript; available in PMC 2011 September 2.
NIH
-PA Author Manuscript
NIH
-PA Author Manuscript
NIH
-PA Author Manuscript
decreased synaptic density and neuronal dropout (Price et al., 1988; Budka, 1991; Gelman,1993; Wiley, 1995; Kraft-Terry et al., 2009). These morphological features of HIV-1-induced neurodegeneration have diminished in severity as a consequence of antiretroviralmedicines (Masliah et al., 1996; Everall et al., 1999; Zheng et al., 2001; McCarthy et al.,2006).
In recent years, clinical investigators have used MRS and DTI to assess the underlying basisfor cognitive dysfunction during progressive HIV-1 infection in its human host (Pomara etal., 2001; Lim and Helpern, 2002; Schifitto et al., 2009; Muller-Oehring et al., 2010). In thepresent, study we used both 1H MRS and DTI, to monitor biochemical and structuralalterations, respectively, in brain regions during the progression of HIV infection inhumanized mice. Our 1H MRS tests showed significant decreases in NAA concentration incerebral cortex. NAA, the most abundant neuron-specific metabolite reflects the degree ofneuronal injury (Chong et al., 1994; Meyerhoff et al., 1994; Laubenberger et al., 1996;Simone et al., 1998; Moffett et al., 2007). Moreover, NAA concentration is often used as amarker of neuronal viability in a range of neurodegenerative disorders that includes HAND,Alzheimer’s disease, epilepsy, multiple sclerosis and spinal cord injury (Meyerhoff et al.,1993; Meyerhoff et al., 1994; Marcus et al., 1998; Suwanwelaa et al., 2000; Tarasow et al.,2003; Chang et al., 2004; Soares and Law, 2009; Mohamed et al., 2010). Reductions inNAA were also seen in 1H MRS studies of simian immunodeficiency virus (SIV)-infectedmonkeys (Lentz et al., 2005; Lentz et al., 2008b; Lentz et al., 2008a; Ratai et al., 2009).Although prior studies showed changes in NAA concentrations as reflective of humancognitive impairment, their use has been hampered by variations in levels over time, co-morbid conditions, and the inability to co-register histopathologic correlates of affectedbrain regions. The decrease in NAA concentration in the cerebral cortex occurred in all fourHIV-1-infected humanized mice and correlated with diminution of MAP2, SYN expression.However, in two mice with the highest levels of viral infection (m983 and m985) NFexpression were also reduced. In contrast, astrogliosis, as measured by GFAP expression,was not uniformly altered. The diminished NAA concentration, seen in the cortex of theHIV-1-infected humanized mice, may not be directly related to neuronal apoptosis but rathermay be an indicator of neuronal abnormalities and is supported by the findings that thebiosynthetic enzyme for NAA, N-acetyl transferase, is localized in neuronal mitochondriaand synaptosomal cell fractions (Moffett et al., 2007). More work certainly remains to bedone to quantify the extent of neuronal damage and validate biomarkers of virus-associatedneurodegenerative disease in this model system.
In addition to biochemical changes, we found structural brain tissue alterations by DTI. Weobserved an increase of FA and a decrease of diffusivity in several gray matter regionsstarting 4 wpi in animals with higher viral load and established immunopathology. DTI canassess displacement of water on the micron scale, yielding information about white matterfiber integrity (Takahashi et al., 2000; Assaf and Pasternak, 2008; Chen et al., 2009b;Gongvatana et al., 2009) as well as gray matter during CNS development (McKinstry et al.,2002; Mukherjee et al., 2002; Mukherjee and McKinstry, 2006; Neil and Inder, 2006; Yassaet al., 2010) and neurodegeneration such as Alzheimers disease (Head et al., 2004; Rose etal., 2008; Chen et al., 2009a; Cherubini et al., 2010; Kantarci et al., 2010; Sexton et al.,2010). FA is highly sensitive to microstructural changes but is not very specific to the typeof changes. If in the developing brain a decrease in FA represents ongoing establishment ofcortical neuronal interconnectivity, then in earlier stages of HIV-1 infection in humanizedmice the changes observed could be associated with structural alteration of synaptic anddendritic processes. The reduction in expression of MAP2 and SYN and the abnormalappearance of SYN-positive structures in the cortex supports our findings of FA anddiffusivity values.
Dash et al. Page 8
J Neurosci. Author manuscript; available in PMC 2011 September 2.
NIH
-PA Author Manuscript
NIH
-PA Author Manuscript
NIH
-PA Author Manuscript
We also systematically studied and in replicate manner to the bioimaging andhistopathologic tests, cognitive and sensorimotor functions studying NOD/scid-IL2Rgcnull
(NSG) mice. Others and our previous experiences in shot-term rodent models of HIV-1encephalitis (HIVE) were founded on Morris water maze testing (Avgeropoulos et al., 1998;Zink et al., 2002) and a water escape radial arm maze test series (Sas et al., 2007). In theseworks cognitive deficits (spatial memory development and retention) were shown as wasseen in aged HIV-1 gp120 transgenic mice (D’Hooge et al., 1999). However, water mazecould not be easily used for our current model as NSG animals are substantivelyimmunologically impaired and any exposure to cold water significantly increases the risk ofinfection and subsequent death of the animal. To overcome such impediments and to testlearning and memory we selected the Barnes circular platform task (Markowska et al.,1989). This system was used to perform several basic testing. We found that NSG mice hadgender-dependent differences as males had significantly increased exploratory behavior onthe platform compared to females. We also observed age-dependent decline in learning andmemory in 12 months old compared to 6 months old males. We then compared learning andmemory in unmanipulated versus animals irradiated at birth. Here females werereconstituted at 6 months of age. The unmanipulated and irradiated/reconstituted mice didnot show statistically significant differences in cognition (our unpublished observations) andsuggested that such an approach would not readily yield changes in learning and memoryafter HIV infection. Currently, we are in the process of standardizing tests for behavioraltesting in this unique model.
The only other animal system that shows the changes observed herein in humanized mice isthe SIV-infected rhesus macaque (Bissel et al., 2002; Lentz et al., 2005; Scheller et al.,2005; Thompson et al., 2009). Importantly, and also operative in SIV-infected monkeys, fewnumbers of virus-infected and immune competent perivascular MP can affect widespreadneuronal dysfunction (Williams et al., 2001; Marcario et al., 2004; Williams et al., 2005;Crews et al., 2008). Nonetheless, expense and species specificity preclude the wide spreaduse of SIV models for the study of the early stages of infection. Thus, relevant rodentmodels that mimic human disease are sorely needed. To our knowledge, this is the firstreport to show associations between 1H MRS and DTI evidence of deficits in neuronalintegrity. These deficits were confirmed by immunohistochemical evaluation. This studyhighlights the relevance of humanized mouse models for research on the pathobiology ofhuman disease and underlies the future applications of non-invasively monitoring thesystemic effects of antiretrovirals and adjunctive therapeutics.
AcknowledgmentsThis work was supported by NIH grants P20 RR15635, 1 P01 NS043985-01, 2R37 NS36126, 5 P01 DA026146and 5 P01 MH64570-03. We acknowledge Deepa Roy, Sidra Akhter and Tanuja Gutti for technical assistance.
ReferencesAntinori A, et al. Updated research nosology for HIV-associated neurocognitive disorders. Neurology.
2007; 69:1789–1799. [PubMed: 17914061]Assaf Y, Pasternak O. Diffusion tensor imaging (DTI)-based white matter mapping in brain research: a
review. J Mol Neurosci. 2008; 34:51–61. [PubMed: 18157658]Atwood WJ, Berger JR, Kaderman R, Tornatore CS, Major EO. Human immunodeficiency virus type
1 infection of the brain. Clin Microbiol Rev. 1993; 6:339–366. [PubMed: 8269391]Avgeropoulos N, Kelley B, Middaugh L, Arrigo S, Persidsky Y, Gendelman HE, Tyor WR. SCID
mice with HIV encephalitis develop behavioral abnormalities. J Acquir Immune Defic Syndr HumRetrovirol. 1998; 18:13–20. [PubMed: 9593453]
Basser PJ, Mattiello J, LeBihan D. MR diffusion tensor spectroscopy and imaging. Biophys J. 1994a;66:259–267. [PubMed: 8130344]
Dash et al. Page 9
J Neurosci. Author manuscript; available in PMC 2011 September 2.
NIH
-PA Author Manuscript
NIH
-PA Author Manuscript
NIH
-PA Author Manuscript

Basser PJ, Mattiello J, LeBihan D. Estimation of the effective self-diffusion tensor from the NMR spinecho. J Magn Reson B. 1994b; 103:247–254. [PubMed: 8019776]
Bissel SJ, Wang G, Ghosh M, Reinhart TA, Capuano S 3rd, Stefano Cole K, Murphey-Corb M, PiatakM Jr, Lifson JD, Wiley CA. Macrophages relate presynaptic and postsynaptic damage in simianimmunodeficiency virus encephalitis. Am J Pathol. 2002; 160:927–941. [PubMed: 11891191]
Boska MD, Hasan KM, Kibuule D, Banerjee R, McIntyre E, Nelson JA, Hahn T, Gendelman HE,Mosley RL. Quantitative diffusion tensor imaging detects dopaminergic neuronal degeneration in amurine model of Parkinson’s disease. Neurobiol Dis. 2007; 26:590–596. [PubMed: 17428671]
Boufassa F, Bachmeyer C, Carre N, Deveau C, Persoz A, Jadand C, Sereni D, Bucquet D. Influence ofneurologic manifestations of primary human immunodeficiency virus infection on diseaseprogression. SEROCO Study Group. J Infect Dis. 1995; 171:1190–1195. [PubMed: 7751693]
Budka H. Neuropathology of human immunodeficiency virus infection. Brain Pathol. 1991; 1:163–175. [PubMed: 1669705]
Chang L, Lee PL, Yiannoutsos CT, Ernst T, Marra CM, Richards T, Kolson D, Schifitto G, Jarvik JG,Miller EN, Lenkinski R, Gonzalez G, Navia BA. A multicenter in vivo proton-MRS study of HIV-associated dementia and its relationship to age. Neuroimage. 2004; 23:1336–1347. [PubMed:15589098]
Chen TF, Chen YF, Cheng TW, Hua MS, Liu HM, Chiu MJ. Executive dysfunction andperiventricular diffusion tensor changes in amnesic mild cognitive impairment and earlyAlzheimer’s disease. Hum Brain Mapp. 2009a; 30:3826–3836. [PubMed: 19441023]
Chen Y, An H, Zhu H, Stone T, Smith JK, Hall C, Bullitt E, Shen D, Lin W. White matterabnormalities revealed by diffusion tensor imaging in non-demented and demented HIV+ patients.Neuroimage. 2009b; 47:1154–1162. [PubMed: 19376246]
Cherubini A, Peran P, Spoletini I, Di Paola M, Di Iulio F, Hagberg GE, Sancesario G, Gianni W,Bossu P, Caltagirone C, Sabatini U, Spalletta G. Combined volumetry and DTI in subcorticalstructures of mild cognitive impairment and Alzheimer’s disease patients. J Alzheimers Dis. 2010;19:1273–1282. [PubMed: 20308792]
Chong WK, Paley M, Wilkinson ID, Hall-Craggs MA, Sweeney B, Harrison MJ, Miller RF, KendallBE. Localized cerebral proton MR spectroscopy in HIV infection and AIDS. AJNR Am JNeuroradiol. 1994; 15:21–25. [PubMed: 8141061]
Crews L, Lentz MR, Gonzalez RG, Fox HS, Masliah E. Neuronal injury in simian immunodeficiencyvirus and other animal models of neuroAIDS. J Neurovirol. 2008; 14:327–339. [PubMed:18780234]
D’Hooge R, Franck F, Mucke L, De Deyn PP. Age-related behavioural deficits in transgenic miceexpressing the HIV-1 coat protein gp120. Eur J Neurosci. 1999; 11:4398–4402. [PubMed:10594667]
Davis LE, Hjelle BL, Miller VE, Palmer DL, Llewellyn AL, Merlin TL, Young SA, Mills RG,Wachsman W, Wiley CA. Early viral brain invasion in iatrogenic human immunodeficiency virusinfection. Neurology. 1992; 42:1736–1739. [PubMed: 1513462]
del Saz SV, Sued O, Falco V, Aguero F, Crespo M, Pumarola T, Curran A, Gatell JM, Pahissa A, MiroJM, Ribera E. Acute meningoencephalitis due to human immunodeficiency virus type 1 infectionin 13 patients: clinical description and follow-up. J Neurovirol. 2008; 14:474–479. [PubMed:19037815]
Everall IP, Heaton RK, Marcotte TD, Ellis RJ, McCutchan JA, Atkinson JH, Grant I, Mallory M,Masliah E. Cortical synaptic density is reduced in mild to moderate human immunodeficiencyvirus neurocognitive disorder. HNRC Group. HIV Neurobehavioral Research Center. BrainPathol. 1999; 9:209–217. [PubMed: 10219738]
Gelman BB. Diffuse microgliosis associated with cerebral atrophy in the acquired immunodeficiencysyndrome. Ann Neurol. 1993; 34:65–70. [PubMed: 8517682]
Gongvatana A, Schweinsburg BC, Taylor MJ, Theilmann RJ, Letendre SL, Alhassoon OM, Jacobus J,Woods SP, Jernigan TL, Ellis RJ, Frank LR, Grant I. White matter tract injury and cognitiveimpairment in human immunodeficiency virus-infected individuals. J Neurovirol. 2009; 15:187–195. [PubMed: 19306228]
Dash et al. Page 10
J Neurosci. Author manuscript; available in PMC 2011 September 2.
NIH
-PA Author Manuscript
NIH
-PA Author Manuscript
NIH
-PA Author Manuscript

Gorantla S, Makarov E, Finke-Dwyer J, Gebhart CL, Domm W, Dewhurst S, Gendelman HE,Poluektova LY. CD8+ cell depletion accelerates HIV-1 immunopathology in humanized mice. JImmunol. 2010a; 184:7082–7091. [PubMed: 20495069]
Gorantla S, Makarov E, Finke-Dwyer J, Castanedo A, Holguin A, Gebhart C, Gendelman H,Poluektova L. Links between progressive HIV-1 infection of humanized mice and viralneuropathogenesis. Am J Pathol. 2010b (In press).
Gorantla S, Sneller H, Walters L, Sharp JG, Pirruccello SJ, West JT, Wood C, Dewhurst S, GendelmanHE, Poluektova L. Human immunodeficiency virus type 1 pathobiology studied in humanizedBALB/c-Rag2−/−gammac−/− mice. J Virol. 2007; 81:2700–2712. [PubMed: 17182671]
Gray F, Scaravilli F, Everall I, Chretien F, An S, Boche D, Adle-Biassette H, Wingertsmann L,Durigon M, Hurtrel B, Chiodi F, Bell J, Lantos P. Neuropathology of early HIV-1 infection. BrainPathol. 1996; 6:1–15. [PubMed: 8866743]
Hasan KM, Narayana PA. Retrospective measurement of the diffusion tensor eigenvalues fromdiffusion anisotropy and mean diffusivity in DTI. Magn Reson Med. 2006; 56:130–137. [PubMed:16755537]
Hassan N, Olivier P, Marie PY, Danchin N, Karcher G, Bertrand A. Use of gated SPECT to identify acase in which tracer activity arising from the right ventricular free wall led to overestimation of theamount of viability within the septal wall. J Nucl Cardiol. 2001; 8:630–631. [PubMed: 11593230]
Head D, Buckner RL, Shimony JS, Williams LE, Akbudak E, Conturo TE, McAvoy M, Morris JC,Snyder AZ. Differential vulnerability of anterior white matter in nondemented aging with minimalacceleration in dementia of the Alzheimer type: evidence from diffusion tensor imaging. CerebCortex. 2004; 14:410–423. [PubMed: 15028645]
Horn TF, Huitron-Resendiz S, Weed MR, Henriksen SJ, Fox HS. Early physiological abnormalitiesafter simian immunodeficiency virus infection. Proc Natl Acad Sci U S A. 1998; 95:15072–15077.[PubMed: 9844017]
Kantarci K, Avula R, Senjem ML, Samikoglu AR, Zhang B, Weigand SD, Przybelski SA, EdmonsonHA, Vemuri P, Knopman DS, Ferman TJ, Boeve BF, Petersen RC, Jack CR Jr. Dementia withLewy bodies and Alzheimer disease: neurodegenerative patterns characterized by DTI. Neurology.2010; 74:1814–1821. [PubMed: 20513818]
Kim BO, Liu Y, Ruan Y, Xu ZC, Schantz L, He JJ. Neuropathologies in transgenic mice expressinghuman immunodeficiency virus type 1 Tat protein under the regulation of the astrocyte-specificglial fibrillary acidic protein promoter and doxycycline. Am J Pathol. 2003; 162:1693–1707.[PubMed: 12707054]
Kraft-Terry SD, Buch SJ, Fox HS, Gendelman HE. A coat of many colors: neuroimmune crosstalk inhuman immunodeficiency virus infection. Neuron. 2009; 64:133–145. [PubMed: 19840555]
Lackner AA, Smith MO, Munn RJ, Martfeld DJ, Gardner MB, Marx PA, Dandekar S. Localization ofsimian immunodeficiency virus in the central nervous system of rhesus monkeys. Am J Pathol.1991; 139:609–621. [PubMed: 1716047]
Laubenberger J, Haussinger D, Bayer S, Thielemann S, Schneider B, Mundinger A, Hennig J, LangerM. HIV-related metabolic abnormalities in the brain: depiction with proton MR spectroscopy withshort echo times. Radiology. 1996; 199:805–810. [PubMed: 8638009]
Lentz MR, Westmoreland SV, Lee V, Ratai EM, Halpern EF, Gonzalez RG. Metabolic markers ofneuronal injury correlate with SIV CNS disease severity and inoculum in the macaque model ofneuro AIDS. Magn Reson Med. 2008a; 59:475–484. [PubMed: 18306400]
Lentz MR, Lee V, Westmoreland SV, Ratai EM, Halpern EF, Gonzalez RG. Factor analysis revealsdifferences in brain metabolism in macaques with SIV/AIDS and those with SIV-inducedencephalitis. NMR Biomed. 2008b; 21:878–887. [PubMed: 18574793]
Lentz MR, Kim JP, Westmoreland SV, Greco JB, Fuller RA, Ratai EM, He J, Sehgal PK, Halpern EF,Lackner AA, Masliah E, Gonzalez RG. Quantitative neuropathologic correlates of changes in ratioof N-acetylaspartate to creatine in macaque brain. Radiology. 2005; 235:461–468. [PubMed:15798152]
Lim KO, Helpern JA. Neuropsychiatric applications of DTI - a review. NMR Biomed. 2002; 15:587–593. [PubMed: 12489105]
Dash et al. Page 11
J Neurosci. Author manuscript; available in PMC 2011 September 2.
NIH
-PA Author Manuscript
NIH
-PA Author Manuscript
NIH
-PA Author Manuscript
Marcario JK, Manaye KF, SantaCruz KS, Mouton PR, Berman NE, Cheney PD. Severe subcorticaldegeneration in macaques infected with neurovirulent simian immunodeficiency virus. JNeurovirol. 2004; 10:387–399. [PubMed: 15765810]
Marcus CD, Taylor-Robinson SD, Sargentoni J, Ainsworth JG, Frize G, Easterbrook PJ, Shaunak S,Bryant DJ. 1H MR spectroscopy of the brain in HIV-1-seropositive subjects: evidence for diffusemetabolic abnormalities. Metab Brain Dis. 1998; 13:123–136. [PubMed: 9699920]
Markowska AL, Stone WS, Ingram DK, Reynolds J, Gold PE, Conti LH, Pontecorvo MJ, Wenk GL,Olton DS. Individual differences in aging: behavioral and neurobiological correlates. NeurobiolAging. 1989; 10:31–43. [PubMed: 2569170]
Masliah E, Ge N, Achim CL, DeTeresa R, Wiley CA. Patterns of neurodegeneration in HIVencephalitis. J NeuroAIDS. 1996; 1:161–173. [PubMed: 16873160]
McArthur JC, Steiner J, Sacktor N, Nath A. Human immunodeficiency virus-associatedneurocognitive disorders: Mind the gap. Ann Neurol. 2010; 67:699–714. [PubMed: 20517932]
McCarthy M, Vidaurre I, Geffin R. Maturing neurons are selectively sensitive to humanimmunodeficiency virus type 1 exposure in differentiating human neuroepithelial progenitor cellcultures. J Neurovirol. 2006; 12:333–348. [PubMed: 17065126]
McKinstry RC, Mathur A, Miller JH, Ozcan A, Snyder AZ, Schefft GL, Almli CR, Shiran SI, ConturoTE, Neil JJ. Radial organization of developing preterm human cerebral cortex revealed by non-invasive water diffusion anisotropy MRI. Cereb Cortex. 2002; 12:1237–1243. [PubMed:12427675]
Meyerhoff DJ, MacKay S, Poole N, Dillon WP, Weiner MW, Fein G. N-acetylaspartate reductionsmeasured by 1H MRSI in cognitively impaired HIV-seropositive individuals. Magn ResonImaging. 1994; 12:653–659. [PubMed: 8057770]
Meyerhoff DJ, MacKay S, Bachman L, Poole N, Dillon WP, Weiner MW, Fein G. Reduced brain N-acetylaspartate suggests neuronal loss in cognitively impaired human immunodeficiency virus-seropositive individuals: in vivo 1H magnetic resonance spectroscopic imaging. Neurology. 1993;43:509–515. [PubMed: 8450992]
Moffett JR, Ross B, Arun P, Madhavarao CN, Namboodiri AM. N-Acetylaspartate in the CNS: fromneurodiagnostics to neurobiology. Prog Neurobiol. 2007; 81:89–131. [PubMed: 17275978]
Mohamed MA, Barker PB, Skolasky RL, Selnes OA, Moxley RT, Pomper MG, Sacktor NC. Brainmetabolism and cognitive impairment in HIV infection: a 3-T magnetic resonance spectroscopystudy. Magn Reson Imaging. 2010
Mukherjee P, McKinstry RC. Diffusion tensor imaging and tractography of human brain development.Neuroimaging Clin N Am. 2006; 16:19–43. vii. [PubMed: 16543084]
Mukherjee P, Miller JH, Shimony JS, Philip JV, Nehra D, Snyder AZ, Conturo TE, Neil JJ, McKinstryRC. Diffusion-tensor MR imaging of gray and white matter development during normal humanbrain maturation. AJNR Am J Neuroradiol. 2002; 23:1445–1456. [PubMed: 12372731]
Muller-Oehring EM, Schulte T, Rosenbloom MJ, Pfefferbaum A, Sullivan EV. Callosal degradation inHIV-1 infection predicts hierarchical perception: a DTI study. Neuropsychologia. 2010; 48:1133–1143. [PubMed: 20018201]
Narayan O, Joag SV, Stephens EB. Selected models of HIV-induced neurological disease. Curr TopMicrobiol Immunol. 1995; 202:151–166. [PubMed: 7587361]
Neeman M, Freyer JP, Sillerud LO. A simple method for obtaining cross-term-free images fordiffusion anisotropy studies in NMR microimaging. Magn Reson Med. 1991a; 21:138–143.[PubMed: 1943671]
Neeman M, Jarrett KA, Sillerud LO, Freyer JP. Self-diffusion of water in multicellular spheroidsmeasured by magnetic resonance microimaging. Cancer Res. 1991b; 51:4072–4079. [PubMed:1855222]
Neil JJ, Inder TE. Detection of wallerian degeneration in a newborn by diffusion magnetic resonanceimaging (MRI). J Child Neurol. 2006; 21:115–118. [PubMed: 16566874]
Newton HB. Common neurologic complications of HIV-1 infection and AIDS. Am Fam Physician.1995; 51:387–398. [PubMed: 7840035]
Dash et al. Page 12
J Neurosci. Author manuscript; available in PMC 2011 September 2.
NIH
-PA Author Manuscript
NIH
-PA Author Manuscript
NIH
-PA Author Manuscript

Persidsky Y, Limoges J, McComb R, Bock P, Baldwin T, Tyor W, Patil A, Nottet HS, Epstein L,Gelbard H, Flanagan E, Reinhard J, Pirruccello SJ, Gendelman HE. Human immunodeficiencyvirus encephalitis in SCID mice. Am J Pathol. 1996; 149:1027–1053. [PubMed: 8780406]
Pomara N, Crandall DT, Choi SJ, Johnson G, Lim KO. White matter abnormalities in HIV-1 infection:a diffusion tensor imaging study. Psychiatry Res. 2001; 106:15–24. [PubMed: 11231096]
Potash MJ, Chao W, Bentsman G, Paris N, Saini M, Nitkiewicz J, Belem P, Sharer L, Brooks AI,Volsky DJ. A mouse model for study of systemic HIV-1 infection, antiviral immune responses,and neuroinvasiveness. Proc Natl Acad Sci U S A. 2005; 102:3760–3765. [PubMed: 15728729]
Price RW, Brew B, Sidtis J, Rosenblum M, Scheck AC, Cleary P. The brain in AIDS: central nervoussystem HIV-1 infection and AIDS dementia complex. Science. 1988; 239:586–592. [PubMed:3277272]
Ratai EM, Pilkenton SJ, Greco JB, Lentz MR, Bombardier JP, Turk KW, He J, Joo CG, Lee V,Westmoreland S, Halpern E, Lackner AA, Gonzalez RG. In vivo proton magnetic resonancespectroscopy reveals region specific metabolic responses to SIV infection in the macaque brain.BMC Neurosci. 2009; 10:63. [PubMed: 19545432]
Ratiney H, Coenradie Y, Cavassila S, van Ormondt D, Graveron-Demilly D. Time-domainquantitation of 1H short echo-time signals: background accommodation. MAGMA. 2004; 16:284–296. [PubMed: 15168136]
Ratiney H, Sdika M, Coenradie Y, Cavassila S, van Ormondt D, Graveron-Demilly D. Time-domainsemi-parametric estimation based on a metabolite basis set. NMR Biomed. 2005; 18:1–13.[PubMed: 15660450]
Reid W, et al. An HIV-1 transgenic rat that develops HIV-related pathology and immunologicdysfunction. Proc Natl Acad Sci U S A. 2001; 98:9271–9276. [PubMed: 11481487]
Rose SE, Janke AL, Chalk JB. Gray and white matter changes in Alzheimer’s disease: a diffusiontensor imaging study. J Magn Reson Imaging. 2008; 27:20–26. [PubMed: 18050329]
Santoro TJ, Bryant JL, Pellicoro J, Klotman ME, Kopp JB, Bruggeman LA, Franks RR, Notkins AL,Klotman PE. Growth failure and AIDS-like cachexia syndrome in HIV-1 transgenic mice.Virology. 1994; 201:147–151. [PubMed: 7909972]
Sas AR, Bimonte-Nelson HA, Tyor WR. Cognitive dysfunction in HIV encephalitic SCID micecorrelates with levels of Interferon-alpha in the brain. AIDS. 2007; 21:2151–2159. [PubMed:18090041]
Scheller C, Sopper S, Jenuwein M, Neuen-Jacob E, Tatschner T, Grunblatt E, ter Meulen V, RiedererP, Koutsilieri E. Early impairment in dopaminergic neurotransmission in brains of SIV-infectedrhesus monkeys due to microglia activation. J Neurochem. 2005; 95:377–387. [PubMed:16190867]
Schifitto G, Zhong J, Gill D, Peterson DR, Gaugh MD, Zhu T, Tivarus M, Cruttenden K, MaggirwarSB, Gendelman HE, Dewhurst S, Gelbard HA. Lithium therapy for human immunodeficiencyvirus type 1-associated neurocognitive impairment. J Neurovirol. 2009; 15:176–186. [PubMed:19306230]
Sexton CE, Kalu UG, Filippini N, Mackay CE, Ebmeier KP. A meta-analysis of diffusion tensorimaging in mild cognitive impairment and Alzheimer’s disease. Neurobiol Aging. 2010
Simone IL, Federico F, Tortorella C, Andreula CF, Zimatore GB, Giannini P, Angarano G, LuciveroV, Picciola P, Carrara D, Bellacosa A, Livrea P. Localised 1H-MR spectroscopy for metaboliccharacterisation of diffuse and focal brain lesions in patients infected with HIV. J NeurolNeurosurg Psychiatry. 1998; 64:516–523. [PubMed: 9576546]
Soares DP, Law M. Magnetic resonance spectroscopy of the brain: review of metabolites and clinicalapplications. Clin Radiol. 2009; 64:12–21. [PubMed: 19070693]
Suwanwelaa N, Phanuphak P, Phanthumchinda K, Suwanwela NC, Tantivatana J, Ruxrungtham K,Suttipan J, Wangsuphachart S, Hanvanich M. Magnetic resonance spectroscopy of the brain inneurologically asymptomatic HIV-infected patients. Magn Reson Imaging. 2000; 18:859–865.[PubMed: 11027880]
Takahashi M, Ono J, Harada K, Maeda M, Hackney DB. Diffusional anisotropy in cranial nerves withmaturation: quantitative evaluation with diffusion MR imaging in rats. Radiology. 2000; 216:881–885. [PubMed: 10966726]
Dash et al. Page 13
J Neurosci. Author manuscript; available in PMC 2011 September 2.
NIH
-PA Author Manuscript
NIH
-PA Author Manuscript
NIH
-PA Author Manuscript

Tarasow E, Wiercinska-Drapalo A, Kubas B, Dzienis W, Orzechowska-Bobkiewicz A, ProkopowiczD, Walecki J. Cerebral MR spectroscopy in neurologically asymptomatic HIV-infected patients.Acta Radiol. 2003; 44:206–212. [PubMed: 12694109]
Thompson KA, Varrone JJ, Jankovic-Karasoulos T, Wesselingh SL, McLean CA. Cell-specifictemporal infection of the brain in a simian immunodeficiency virus model of humanimmunodeficiency virus encephalitis. J NeuroVirol. 2009; 15:300–311. [PubMed: 19593698]
Toggas SM, Masliah E, Rockenstein EM, Rall GF, Abraham CR, Mucke L. Central nervous systemdamage produced by expression of the HIV-1 coat protein gp120 in transgenic mice. Nature. 1994;367:188–193. [PubMed: 8114918]
Van Duyne R, Pedati C, Guendel I, Carpio L, Kehn-Hall K, Saifuddin M, Kashanchi F. The utilizationof humanized mouse models for the study of human retroviral infections. Retrovirology. 2009;6:76. [PubMed: 19674458]
Wallace MR, Nelson JA, McCutchan JA, Wolfson T, Grant I. Symptomatic HIV seroconverting illnessis associated with more rapid neurological impairment. Sex Transm Infect. 2001; 77:199–201.[PubMed: 11402229]
Wiley CA. Quantitative neuropathologic assessment of HIV-1 encephalitis. Curr Top MicrobiolImmunol. 1995; 202:55–61. [PubMed: 7587370]
Williams K, Alvarez X, Lackner AA. Central nervous system perivascular cells are immunoregulatorycells that connect the CNS with the peripheral immune system. Glia. 2001; 36:156–164. [PubMed:11596124]
Williams K, Westmoreland S, Greco J, Ratai E, Lentz M, Kim WK, Fuller RA, Kim JP, Autissier P,Sehgal PK, Schinazi RF, Bischofberger N, Piatak M, Lifson JD, Masliah E, Gonzalez RG.Magnetic resonance spectroscopy reveals that activated monocytes contribute to neuronal injury inSIV neuroAIDS. J Clin Invest. 2005; 115:2534–2545. [PubMed: 16110325]
Yassa MA, Muftuler LT, Stark CE. Ultrahigh-resolution microstructural diffusion tensor imagingreveals perforant path degradation in aged humans in vivo. Proc Natl Acad Sci U S A. 2010;107:12687–12691. [PubMed: 20616040]
Zheng J, Thylin MR, Cotter RL, Lopez AL, Ghorpade A, Persidsky Y, Xiong H, Leisman GB, CheMH, Gendelman HE. HIV-1 infected and immune competent mononuclear phagocytes inducequantitative alterations in neuronal dendritic arbor: relevance for HIV-1-associated dementia.Neurotox Res. 2001; 3:443–459. [PubMed: 14715458]
Zink WE, Anderson E, Boyle J, Hock L, Rodriguez-Sierra J, Xiong H, Gendelman HE, Persidsky Y.Impaired spatial cognition and synaptic potentiation in a murine model of humanimmunodeficiency virus type 1 encephalitis. J Neurosci. 2002; 22:2096–2105. [PubMed:11896149]
Dash et al. Page 14
J Neurosci. Author manuscript; available in PMC 2011 September 2.
NIH
-PA Author Manuscript
NIH
-PA Author Manuscript
NIH
-PA Author Manuscript

Figure 1.Time-frame of observation, immune and viral load status of experimental humanized mice.A, Human CD34+ cell reconstitution, MRSI/DTI analysis, HIV-1 infection, and splenichistological analysis of NSG mice are mapped to a study time line B and C, Analyses ofCD4 and CD8 cell populations in peripheral blood of four HIV-1-infected mice and sixcontrol mice. D, The dynamics of VL in peripheral blood of infected animals are shown.Mice were bled once every 4 weeks starting 2nd week post HIV-infection. E, Percent ofhuman T and B lymphocytes and macrophages in spleen were determined at the end point ofthe study and mapped with end point viral load (VL). B, C and D, Mean and S.E.M areshown, and E, individual numbers for each mouse.
Dash et al. Page 15
J Neurosci. Author manuscript; available in PMC 2011 September 2.
NIH
-PA Author Manuscript
NIH
-PA Author Manuscript
NIH
-PA Author Manuscript

Figure 2.Histopathology of brain subregions. Representative brain regions in control uninfected(HIV-1−) m975 and infected (HIV-1+) m983 animals. Paraffin sections (5μ) of brain werelabeled with anti-HLA-DR to identify human activated cells, anti-Iba-1 to detectmacrophages and microglia, and anti-GFAP antibodies for astrocytes (all positive labeling isbrown). Sections were counterstained with hematoxylin. Images of cortex, cerebellum,hippocampus, brain stem and corpus collosum were captured with a 40× objective.Accumulation of human cells in meninges, perivascular spaces with activation of microglialcells (pons/medulla) and astrocytes (cortex, hippocampus and pons/medulla) in infectedmouse were noted. Arrows indicate perivascular cuff of HLA-DR+ cells, arrowheadmicroglial nodules formation.
Dash et al. Page 16
J Neurosci. Author manuscript; available in PMC 2011 September 2.
NIH
-PA Author Manuscript
NIH
-PA Author Manuscript
NIH
-PA Author Manuscript

Figure 3.1H-MRS analyses. A, Brain regions of interests. B, N-acetyl aspartate concentrations inHIV-1-infected humanized mice. The means ± SEM of [NAA] from selected regions ofbrain are shown. The values were normalized to water for quantitative assessment. Thevalues were drawn at *p < 0.05 vs pre-infection and +p < 0.1 vs pre-infection. It can beclearly seen that NAA is significantly reduced over the course of infection in the cerebralcortex but not in the cerebellum, hippocampus or brainstem/pons region.
Dash et al. Page 17
J Neurosci. Author manuscript; available in PMC 2011 September 2.
NIH
-PA Author Manuscript
NIH
-PA Author Manuscript
NIH
-PA Author Manuscript

Figure 4.DTI tests. A, Fractional Anisotropy (FA), B, Mean Diffusivity (Dav), C, LongitudinalDiffusivity (λll), and D - Transverse Diffusivity (λ⊥). Notable and consistent changesinclude increased FA in the frontal cortex (FC) and hippocampus (Hip), as well as decreaseddiffusivity in the whisker barrels (WB), cerebral cortex (CCx), and hippocampus ofhumanized mice group with more severe brain pathology. Statistically significant changeswere not observed in the corpus callosum (CC), substantia nigra (SN), Medulla (M) andcerebellum (C). E, Correlation analyses of endpoint viral load with endpoint DTI metrics inWB. F, Correlation analysis of magnitude of changes of DTI metrics (Δ) pre and post HIVinfection with viral load in WB region.
Dash et al. Page 18
J Neurosci. Author manuscript; available in PMC 2011 September 2.
NIH
-PA Author Manuscript
NIH
-PA Author Manuscript
NIH
-PA Author Manuscript
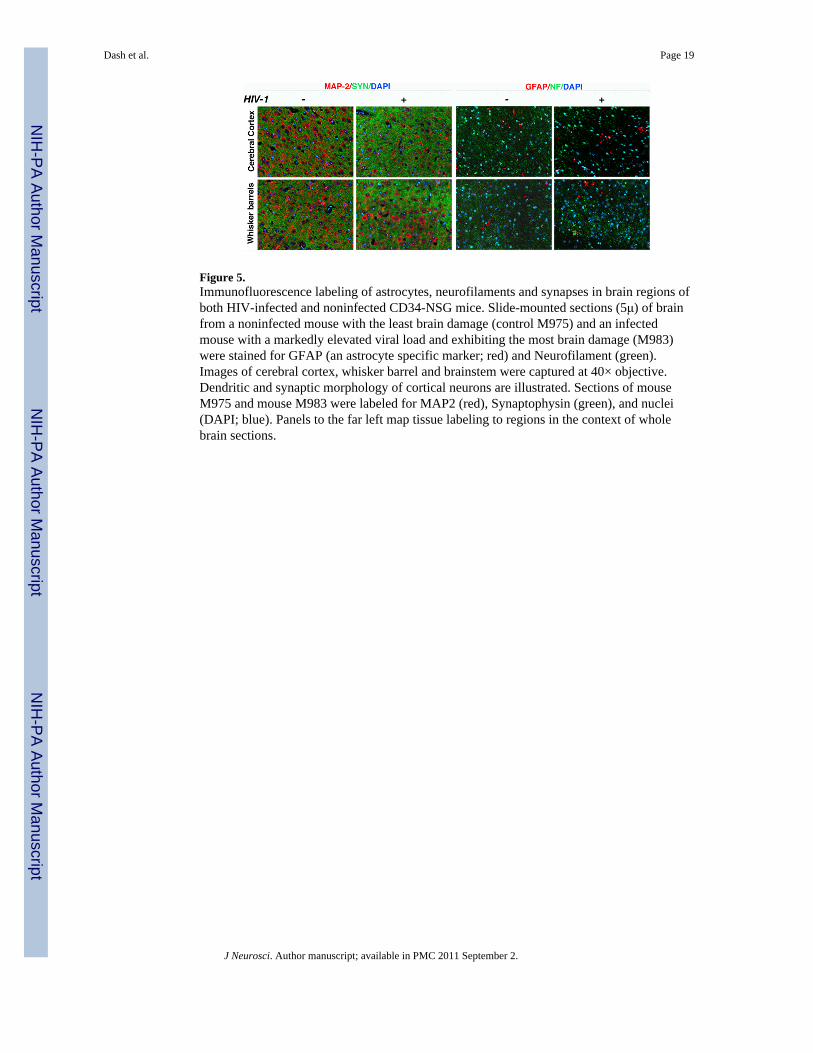
Figure 5.Immunofluorescence labeling of astrocytes, neurofilaments and synapses in brain regions ofboth HIV-infected and noninfected CD34-NSG mice. Slide-mounted sections (5μ) of brainfrom a noninfected mouse with the least brain damage (control M975) and an infectedmouse with a markedly elevated viral load and exhibiting the most brain damage (M983)were stained for GFAP (an astrocyte specific marker; red) and Neurofilament (green).Images of cerebral cortex, whisker barrel and brainstem were captured at 40× objective.Dendritic and synaptic morphology of cortical neurons are illustrated. Sections of mouseM975 and mouse M983 were labeled for MAP2 (red), Synaptophysin (green), and nuclei(DAPI; blue). Panels to the far left map tissue labeling to regions in the context of wholebrain sections.
Dash et al. Page 19
J Neurosci. Author manuscript; available in PMC 2011 September 2.
NIH
-PA Author Manuscript
NIH
-PA Author Manuscript
NIH
-PA Author Manuscript

Figure 6.Quantitative fluorescence microscopy of neuronal protein expressions in brains of CD34-NSG mice. A, Schematic representation of the strategy of analysis. Slide-mounted brainsections (5μ thick) that included the corresponding regions (mouse brain atlas) analyzed byDTI were analyzed by quantitative fluorescence microscopy with an automated fluorescencemicroscope (Leica), multispectral imaging system (Nuance EX) and ImagePro® Plus imageanalysis software. Image cubes consisting of a Z-stack of images over a wide range ofwavelengths were captured from each microscope field with a 20× objective. Cubes wereunmixed by spectra corresponding to each fluorescence label and to autofluorescence intoquantitative gray scale images for analysis of intensity and area of fluorescence emission. B,Individual mouse data represent expression of the neuronal proteins MAP2 and SYN(fluorescence intensity) and NF and GFAP (area of positive fluorescence labeling). Thereduction of MAP2 and SYN were detected in cortical regions, but not in pons/medulla. Thesignificant drop of NF was found in WB in all analyzed mice and in frontal cortex of twomice with significant immune pathology (m983, m985). It was not clearly observed in pons/medulla region. Variable changes in GFAP-labeled areas were noted for different regions.
Dash et al. Page 20
J Neurosci. Author manuscript; available in PMC 2011 September 2.
NIH
-PA Author Manuscript
NIH
-PA Author Manuscript
NIH
-PA Author Manuscript
View publication statsView publication stats