authentic engineering design assessment
TRANSCRIPT

Paper ID #34100
Authentic Engineering Design Assessment
Miss Joanna AmbrosioDr. M. David Burghardt, Hofstra University
Dr. M. David Burghardt, professor of Engineering, founder and co-director of the Center for STEMResearch, has been the principal or co-principle investigator on 13 NSF projects primarily dealing withengineering in STEM.
Dr. Deborah Hecht, Center for Advanced Studyin Education
As Director of the Center for Advanced Study in Education, at the CUNY Graduate Center I am involvedin a wide range of educational evaluations of funded and local projects. I also mentor graduate studentsinterested in careers in evaluation.
c©American Society for Engineering Education, 2021

Authentic Engineering Design Assessment Abstract Educators looking for authentic ways to assess learning might benefit from thinking about the work of informal educators. In informal learning environments, standard assessment measures, like exams and tests, may not be possible for many reasons. The Wise Guys and Gals project (WGG), an NSF funded Advancing Informal STEM Learning project (DRL 1422436), created an authentic assessment approach useful in informal learning environments when traditional assessments are not possible. This paper examines how engaging youth as activity designers can provide valuable assessment data. The WGG project created blended engineering design challenges that engage youth in problem solving and reflection. Through the WISEngineering online learning environment, youth are presented with a design challenge. They are guided through knowledge and skills builders (KSBS) that help them to learn the content knowledge needed to successfully complete the design challenge. Youth are later asked to evaluate their design solutions according to criteria that were presented along with the challenge. After completing the design challenge, the youth engage in guided reflection about the experience. This informal learning activity was delivered at Boys and Girls Clubs. The project team was very aware that if the assessment resembled a school “test” many youth would simply not respond and that the activity facilitators has little interest in formal assessment of youth. Questions embedded in the activity were designed to promote engagement by helping the youth be successful and did not assess or differentiate among youth. However, the project still needed some way to assess learning. The solution was the use of a non-disruptive assessment that engaged youth in creating their own design challenge. Inspiration came from an awareness that youth in the Boys and Girls Clubs where WGG was being tried enjoyed a television show called Shark Tank where entrepreneurs “pitch” their ideas. The authentic assessment was therefore called the Shark Tank design challenge. This activity reversed the roles for youth. Youth were challenged to create a new design challenge that could be completed by their peers. This design challenge had to include all the elements of a WGG activity—a challenge statement with embedded specifications and constraints, evaluation criteria, knowledge and skill builders, and material cost limitations. As part of Shark Tank, the youth created a Shark Tank video pitch that demonstrated their design’s worthiness. These videos became the basis for the assessment tool. The WGG project created a video assessment criterion (shared with the youth developing their activity), that allowed for assessment of learning. The analyses of videos using these criteria are the basis of this paper. While simple, this approach is highly informative and provides insights about youth or student learning as well as the environment in which learning occurs. To test its usability, we applied the scoring matrix to examine 39 video pitches. The results indicate an explicit understanding of an engineering design challenge and an implicit understanding of specifications and constraints.

Introduction WISE Guys and Gals (WGG) is an innovative blended STEM learning environment created to help middle school age youth develop competences in the day-to-day application of STEM knowledge and engineering design thinking. WGG was created through a collaboration between Hofstra University’s Center for STEM Research in conjunction with Brookhaven National Laboratory (BNL), The CUNY Graduate Center’s Center for Advanced Study in Education (CASE), and 16 Boys & Girls Clubs in three states. WGG’s engaging STEM based engineering challenges introduce STEM concepts through activities with both online and hands-on components. The blended learning experiences have been used with youth from groups underrepresented in STEM areas, giving them exposure to engineering design concepts and helping them to develop new STEM competencies, STEM career awareness, and an appreciation for the civic value of STEM knowledge. Boys & Girls Clubs provide out-of-school support for children, the clubs are not connected to schools, and the children are not students when they enter the club’s doors, but youth, learners, seeking engaging and stimulating experiences unlike those in formal education. The project team had no contact or information from the youth’s schools or teachers. The value of attracting under-represented middle school youth, particularly females, in STEM is well documented [1,2]. Benefits include not only enhanced mastery and application of STEM concepts in middle school and beyond, but also greater interest in pursuing advanced study, ultimately leading to a better STEM prepared workforce [3,4,5]. Wise Guys and Girls helps middle school age youth in informal settings develop crucial competencies in the application of STEM knowledge and design thinking. Early research shows this approach is highly transferrable to any informal setting interested in engaging groups in engineering design activities that are fun yet challenging. The WISEngineering platform, an open-source, online learning environment that connects virtual design and physical modeling underpins the Wise Guys and Gals activities. Each STEM concept is introduced in WISEngineering to youth through virtual mini-challenges (KSBs) that scaffold the learning needed to successfully complete the physical design challenges. Pictures, videos, and multimedia links express content, give context, and guide the youth through the design challenge, allowing for an appreciation and understanding of the design process and exposure to STEM related careers. When youth begin building their physical designs they can seamlessly follow and document the process in the virtual space, allowing for reflection and deeper retention of what is learned. An important attribute of the WISEngineering platform is the capability to provide instantaneous feedback. This allows for the study of the impact that a blended learning environment, created for informal STEM, can have on youth, particularly in an environment where the facilitator (Boys & Girls Club staff) turnover is high and youth have the option of “dropping in or out.” WGG created, implemented and studied informal STEM learning experiences at 16 Boys and Girls Clubs in three states. The activities were designed to be completed within a 75-minute period; use easy to obtain, inexpensive materials; and are facilitated by a Boys and Girls Club

staff member (Learning Facilitator) who may have a limited STEM background and no teacher training. A goal of WGG was to create engaging activities that would expose youth to five key engineering design concepts. ○ Specifications and Constraints
○ Knowledge Development ○ Ideate Solutions ○ Testing and Evaluations ○ Reflection and Redesign
Although a general framework guided the development of the activities and provided some consistency across activities, the WGG activities varied how and whether all the five key concepts were included. Some activities only included a few constructs others included all. The criteria were the relevance and the importance of the concept. However, when youth complete multiple activities, as was common at the Boys and Girls Clubs, they were exposed and worked with all five concepts. Figure 1 presents an example of the framework for one of the WGG activities.
Figure 1. Example of WGG Activity Framework

As Learning Facilitators began the delivery of an activity, they often described it as a balancing act to allow youth to find their own solutions without providing too much direction or sharing what the Learning Facilitator considered a “correct” answer. However, WGG focuses on process. The types of engineering design solutions that WGG introduces do not have a unique correct answer. Successful facilitation involved providing feedback and encouragement while allowing for some youth frustration. This process was critical for engaging youth and typically led to youth reporting they felt proud of their design. The need to provide support, yet allow for frustration, contrasts with what is often experienced during school when a teacher helps students find and then rewards a correct answer. In WGG, making multiple attempts and engaging in a redesign was rewarded. The figure in Appendix A presents an example of the design challenge and assessment criteria used by youth to evaluate their design. Youth are encouraged to use the assessment criteria as they planned for their redesign. Learning Facilitators stressed that they found a connection between youth engagement and ease of use. Youth did not mind and often enjoyed complex design challenges. However, they wanted their learning about the challenge, using the technology and answering any questions, to be easily done. During pilot work, it was found that the amount of reading required by WGG was often difficult for youth. Children and even some adults in the project associated the need to read a great deal with school, and they did not want to do it. While some reading was necessary to learn about the WGG activity and complete the design challenge, it could not be extensive. Facilitator feedback during the first years of WGG, indicated that if the amount of reading required was high, it could hinder success implementing the activities. Assessing Learning in WGG Within the Wise Guys & Gals program, it was essential to be able to assess youth learning. Since the WGG program was conducted at Boys and Girls Clubs, it would have been inappropriate to use a formal assessment of youth learning. Finding the most appropriate ways to assess youth learning, was an iterative process. Initially, the youth were asked to provide written responses to questions. Eventually, this was changed to a multiple-choice design that used with pre-written responses that youth could select (Burghardt and Hecht, 2020). Relatedly asking youth to describe their understanding and how they would improve their design was difficult. Embedding questions within each activity that asked youth how they might change their design was tried. While youth often enthusiastically responded when asked verbally, they were reluctant to provide written responses. Furthermore, youth typically needed guidance as they reflected, and the Learning Facilitators, who were rarely trained educators, required training and support to encourage such youth reflections. Therefore, using written self-reports to study learning was not possible. To find a non-obtrusive means to assess learning, Shark Tank was created based on a television series of the same name where people pitched an idea for entrepreneurial funding. Youth at the Boys and Girls Clubs where WGG were familiar with the show and liked the idea of doing an activity loosely modeled after the school. In our case youth create their own design challenge and then make a (video) pitch about it. The activity encouraged creativity, collaboration and teamwork, something fun to do. The assessment goal of this activity was to have youth
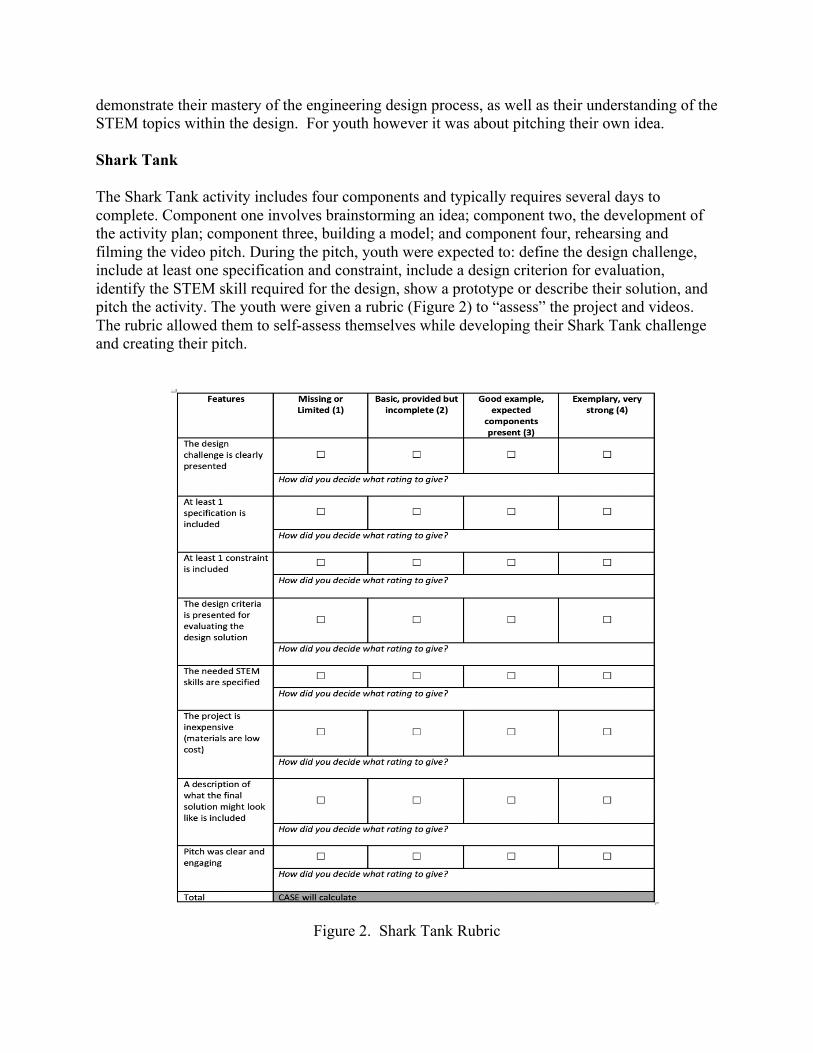
demonstrate their mastery of the engineering design process, as well as their understanding of the STEM topics within the design. For youth however it was about pitching their own idea. Shark Tank The Shark Tank activity includes four components and typically requires several days to complete. Component one involves brainstorming an idea; component two, the development of the activity plan; component three, building a model; and component four, rehearsing and filming the video pitch. During the pitch, youth were expected to: define the design challenge, include at least one specification and constraint, include a design criterion for evaluation, identify the STEM skill required for the design, show a prototype or describe their solution, and pitch the activity. The youth were given a rubric (Figure 2) to “assess” the project and videos. The rubric allowed them to self-assess themselves while developing their Shark Tank challenge and creating their pitch.
Figure 2. Shark Tank Rubric

Video Scoring Methodology Eight clubs participated in the Shark Tank activity. The clubs were located in urban, rural and suburban locations and had different levels of local financial support. A total of 39 videos were analyzed using the rubric in Figure 2. For the first row of the rubric, “the design challenge is clearly presented,” youth scored a 4 if they explicitly explained the problem and the various aspects of the challenge. Youth scored a 2 if they started to describe a problem, but they didn’t provide enough detail. They earned a 1 if they either left out the design challenge or if the design wasn’t really a challenge. For instance, the youth received a 1 if they stated that they built a bridge because they wanted to build a bridge, but there is no true challenge stated. This shows a clear misunderstanding of the concept of design challenges. Specifications and constraints were scored similarly. Youth earned a 4 for specifications and constraints if they properly identified each one. If the youth said they were going to explain their specifications, but listed constraints and vice versa, youth scored a 2 in each column. The rationale was that youth understood the concept of specification or constraint, and that they likely got mixed up because of nerves or a misunderstanding. In cases like these, there was a certain level of understanding present. In other cases where the youth said they were going to explain their specifications/constraints and then said something random, they were scored a 1 in the respective column. For the design criteria column, youth who clearly listed three design criteria and explained how they would rate their solution received a 4. Youth who skipped discussing the design criteria received a one. Few youth received a two or three. Scoring for the STEM skills and materials tend to be clear-cut. Youth either explain a STEM skill and receive a 4 or did not and receive a 1. Similarly, youth who described the use of inexpensive materials received a 4 while youth received a 1 for either not describing their materials or describing materials that are more expensive than $25. To receive a rating of 4 for their description of the final solution, youth would need to verbally describe their solution or show and explain their prototype or a drawing of the solution. If the youth just showed a solution or drawing without explaining it, a score of 3 was given. Finally, if the youth just stated a solution, with no explanation they received a 1. For the final row, if the pitch was clear and engaging, youth earned a 4. In order to be engaging, youth had to demonstrate excitement about the project and be able to explain their ideas. Ms. Joanna Ambrosio, the research assistant, watched all of the videos once and took notes on aspects that stood out. Elements that she frequently noted were the way that the youth framed their pitch (was it an advertisement? a conversation? just reading off of a script?) and how the youth interacted with each other in the video, and perhaps the most important, how engaged the youth were with their project. She reported that youth could show their engagement in many ways. For some, it was creating a prototype and demonstrating how it could be used, for others it could be their tones of voice and the way that they described their product.

After she reviewed several videos, the scoring was calibrated by the three authors. Each person viewed and scored the same videos. The scores were then discussed. Once a consistent baseline was established, Ms. Ambrosio scored the full set of videos. Appendix B shows the scores for each video, per the scoring rubric. Table 1 is the average of all the videos for a given BGC. Data Analysis Across all of the clubs, the criteria on which the youth scored the highest included, the project is inexpensive, a description of the final solution is included, and the design challenge is clearly stated. On the lower end of the spectrum were the specification of needed STEM skills (with the lowest score), followed closely by the pitch was clear and engaging, and at least one specification was provided. In most cases, 64% of the time (or 25 out of 39 videos), the pitches received a four for clearly presenting the design challenge. Table 1 provides the average rubric rating for all club videos for each criterion. For example, Club A had three videos, so the average for the challenge being clearly stated is 3.67 based on two videos with a score of 4 and one with a score of 3.

Table 1. Average Score of Boys and Girls Clubs Five of the eight clubs had an average overall rating above three. Only one club fell below 2. Overall, Club B had the highest overall rating of 3.875 out of 4, averages across all the criteria. Following closely behind is Club G (average overall rating of 3.69), Club A (average overall rating of 3.46), Club F (average overall rating of 3.36), and Club H (average overall rating of 3.25). The club with the lowest rating was Club C, though they only had one video to rate. Although Club E received an overall average rating of 2.68, they were somewhat different from the other clubs. This club submitted ten videos pitches and participated for two years, whereas most of the others only participated during a single year. An examination of differences by year revealed that youth had higher ratings for design criteria, specifications and constraints, and the
needed STEM skills during the first year the club participated, whereas the scores for engagement were overall higher during the second year. However, these youth did not construct a model during the first year when they participated, instead they relied upon pictures and verbal descriptions when sharing their pith. The higher scores during the second year might be related to youth being able to construct a model, something that anecdotally was found to be an important motivator for youth at several clubs. Club B posted two pitches, and both received high ratings. In both video pitches the youth were observed to be very animated when talking about their ideas. In one video, where the product was a “reverse purse,” the youth dressed up in professional shirts and ties and put on a skit that emphasized the need for the product. In both pitches, the youth very clearly explained each requirement of the pitch. While reviewing the video pitches, the research assistant noted that there often appeared to be an implicit understanding of the specifications and constraints. The youth did note explicitly say “a specification/constraint is…” Instead, they explained that the project must utilize certain materials or has to be completed a certain way. When videos demonstrated a clear and implicit understanding, they were scored as a 4. In contrast, if youth used the correct vocabulary, “constraint/specification,” but described something else that did not fall under the definition of a constraint or specification (respectively), they received a score of 1. Scoring for the inclusion of a STEM skill tended to be either a 4 or a 1, although no club had an average score of 4 (indicating all videos received a rating of 4.) Fewer videos scored a 4 for including the necessary STEM skill than scored a 1. This was the only criteria that did not have at least one club with every youth demonstrating knowledge. Discussion Evidence of learning about engineering design through Shark Tank Scores for each video pitch by criteria were examined. After aggregating across clubs, the data suggest that a majority of the youth demonstrated that they understood two key components of the engineering design process, being able to define a problem (in this case, clearly stating the design challenge) and develop a prototype solution (explaining and demonstrating final solutions). They were also able to create a challenge and explain how it would use inexpensive materials to complete. These three areas showed the greatest learning among the youth. Even though all the pitches did not demonstrate learning about specifications and constraints or being able to present a design criterion, at least half of the pitches showed learning and understanding by scoring at least 3 points on each of these criteria. Figure 4 highlights Club D and provides greater detail about how the average ratings. Club D submitted three pitches. The first two pitches show learning in all of these categories. However, when the final pitch is averaged in, it conceals the strength of the first two. A review of the video pitches suggest youth who created the pitch that has the lowest scores were not as serious

about the activity. As discussed below, this suggests that while the club Learning Facilitator is an important factor in learning and success, there is variability within clubs.
The design
challenge is clearly
stated
At least 1 specification is included
At least 1 constraint
is included
Design criteria is presented
The needed STEM skills
specified
The project is
inexpensive
A description of the final solution is included
Pitch was clear and
engaging
Pitch 1 4 3 1 2 1 4 4 4
Pitch 2 4 3 1 1 1 4 4 4
Pitch 3 4 1 1 1 1 1 1 2
Table 2. Detailed Analysis of Pitches from Club D Factors related to what and how much youth learned Since the project team had reported that they believed Facilitators made a difference in the learning at clubs, anecdotal data was collected about the Facilitators from the project team and then compared with the Shark Tank results. For example, the facilitator at Club A was reportedly loved by all of the youth According to one of the project team researchers, this Facilitator tried very hard to make things interesting for the youth. The high scores for pitches at this club may reflect the interest that the facilitator and youth have had for the project (as shown in the table above, Club A had an average score of at least three in all but one row – the inclusion of a STEM skill). At the other end of the spectrum was Club E, with an average score for the first year of 3.1 and the second year of 2.3. A project researcher explained that there was a new manager during the second year who was less involved and did not provide sufficient guidance, allowing the youth to do what they wanted which did not align with the activity’s goals. Further analysis explored whether there was evidence that the number of youths in a group that pitched a design challenge affected the average score of the video. Table 3 presents the average overall score by number of youths, aggregated across clubs.

Number of Youth
Average Score
Number of Videos
1 3.18 11 2 3.23 12 3 3.02 11 4 2.875 1
5 1.125 1 Table 3. Average Score vs. Number of Youth
The average score for the videos with two youth is highest, but it only .05 points higher than the average score for videos with one youth. These data suggest that pitches created by a group of one or two youth demonstrated the highest understanding and therefore received the highest scores. Videos with three, four or five youth received average scores of 3.02, 2.875, and 1.125, respectively. Conclusions A common experience for all youth engaging in any WGG activity is a design challenge assessment as illustrated in Appendix A. The design challenges varied, including activities such as design a prosthetic leg from newspaper, create a speaker, or make ice cream. However, all start with a challenge that includes specifications and constraints. As youth engage in the challenge, they evaluate their design in relation to the specifications and constraints. Although each activity has its own rating system, the focus remains on the specifications and constraints. The rating system illustrated for the prosthetic leg challenge in Appendix A is an example of this. While the STEM content varied among activities, the concept of challenge, specifications/constraints and their evaluation were reinforced many times. For this paper the team was our unit of study. We did not have data about individual youth experiences or background, although we had some information about the clubs. Analysis of the Shark Tank activity data indicates that youth participating in the Wise Guys and Gals project could create a design challenge, explain/demonstrate a design solution, and a design solution that was inexpensive (one of the activity criteria). There was strong indication that youth understood the concepts of specifications and constraints, though there were some confusions distinguishing constraints from specifications. The youth were engaged in creating and demonstrating their pitches. Although not directly investigated, the role of the facilitator may be critical not only for youth learning but also for how youth demonstrate learning through the pitch. The role of the facilitator in Shark Tank in guiding youth to create their challenges and pitches, required a balance of encouraging youth but not editing or directing. In most cases the facilitator was the person filming the video. This meant the facilitator needed to be familiar with WGG and the many activities the children had completed. Anecdotally they, also likely gained knowledge of engineering design.

Interestingly the size of the design team also appeared to matter, with smaller being better. The difference between one-person and two-person teams is negligible, and interestingly the largest number of videos come from teams of these sizes. The number of videos to assess for four and five-member teams is too small to generalize from, but the scores are not encouraging. It was also found that it was important that the person doing the video scoring have familiarity with the Shark Tank activity. In this case, the research assistant had done the Shark Tank activity as part of a course and had gained insights gained from this experience that were very important. Although there had been other attempts to score the videos, the depth of understanding needed was not part of their background. They struggled to score the videos and were highly inconsistent over time and across videos. Acknowledgements The authors would like to acknowledge the support provided by the National Science Foundation through Award # DRL 1422436. References
1. Women, Minorities, and Persons with Disabilities in Science and Engineering: 2019 SPECIAL REPORTS | NSF 19-304 | MARCH 8, 2019
2. Chapter 1. Elementary and secondary mathematics and science education. In Science and Engineering Indicators: 2016. NSB 2016-1. Arlington, VA, 2016. Available at https://www.nsf.gov/statistics/2016/nsb20161
3. Lyon, H.; Jafri, J; St. Louis, K (Fall 2012) Beyond the Pipeline: STEM Pathways for Youth Development. Afterschool Matters, n16 p48-57
4. Burghardt M.D. (2019) 2019 Annual report (WISE Guys and Gals). New York. New York: Center for STEM Research, Hofstra University.
5. Kennedy, M (January 2012). The Value of STEM Education. HELIX blog post

Appendix A
An Example of WGG Design Challenge and Assessment
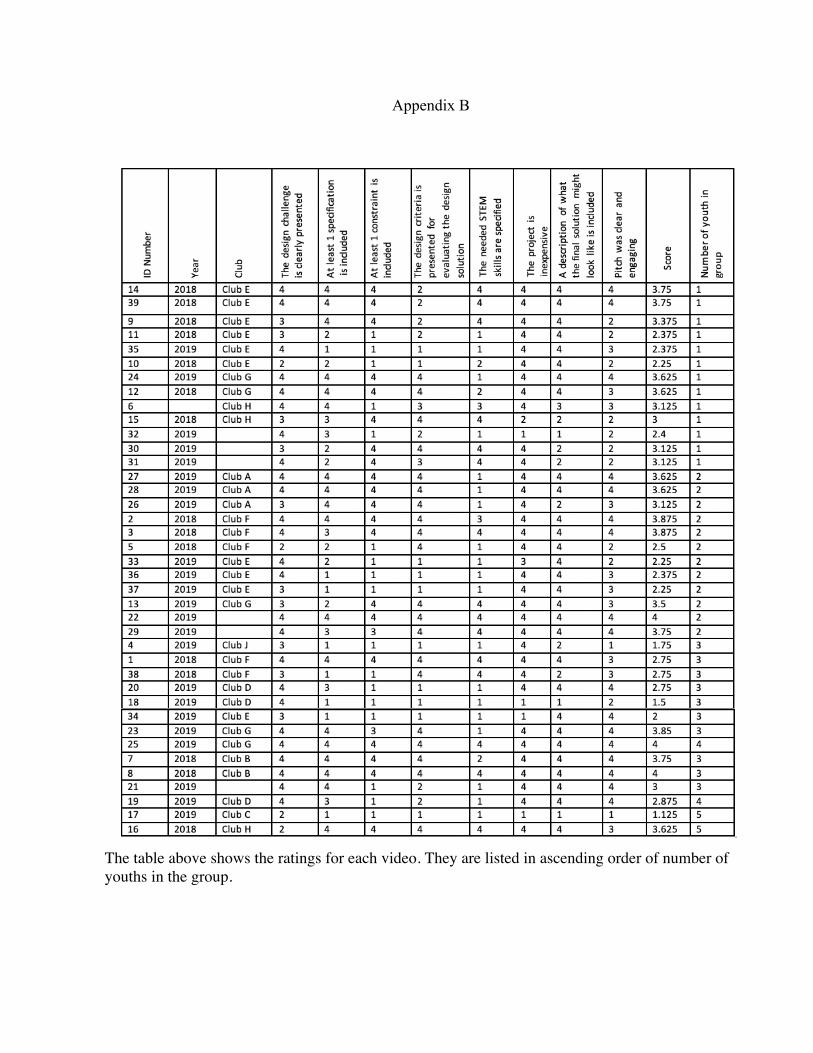
Appendix B
The table above shows the ratings for each video. They are listed in ascending order of number of youths in the group.

Appendix C
Club Total Number of
Videos
Average Number of Youth in a
Video
Number of Videos From
2018
Number of Videos From
2019
Number of Videos with no Year
Attached Club F 5 2.4 5 0 0 Club E 10 1.5 5 5 0 Club G 5 2 2 3 0 Club B 2 3 2 0 0 Club H 3 2 2 0 1 Club A 3 2 0 3 0 Club D 3 3.33 0 3 0 Club C 1 3 0 1 0 Club J 1 3 0 1 0
No Club Listed 6 1.67 0 6 0
The table above shows the number of videos from each club (per year) and the average number of youths in videos from each club.