authentic discovery learning projects in statistics nctm conference april 23, 2010 dianna spence...
TRANSCRIPT
Authentic Discovery Learning Projects in Statistics
NCTM ConferenceApril 23, 2010
Dianna SpenceRobb Sinn
Department of Mathematics & Computer ScienceNorth Georgia College & State University
Dahlonega, Georgia

Agenda• Overview of Project Scope and Tasks
– Dianna
• Sample Classroom Activities – Robb
• Findings: Student Outcomes (Phase I) – Dianna
• Curriculum Materials Developed– Robb
• Future Directions– Dianna
NSF Grant Project Overview• NSF CCLI Phase I Grant:
“Authentic, Career-Specific Discovery Learning Projects in Introductory Statistics”
• Goals: Increase students’... knowledge & comprehension of statistics
perceived usefulness of statistics
self-beliefs about ability to use and understand statistics
• Tasks: Develop Instructional Materials
Develop Instruments
Measure Effectiveness
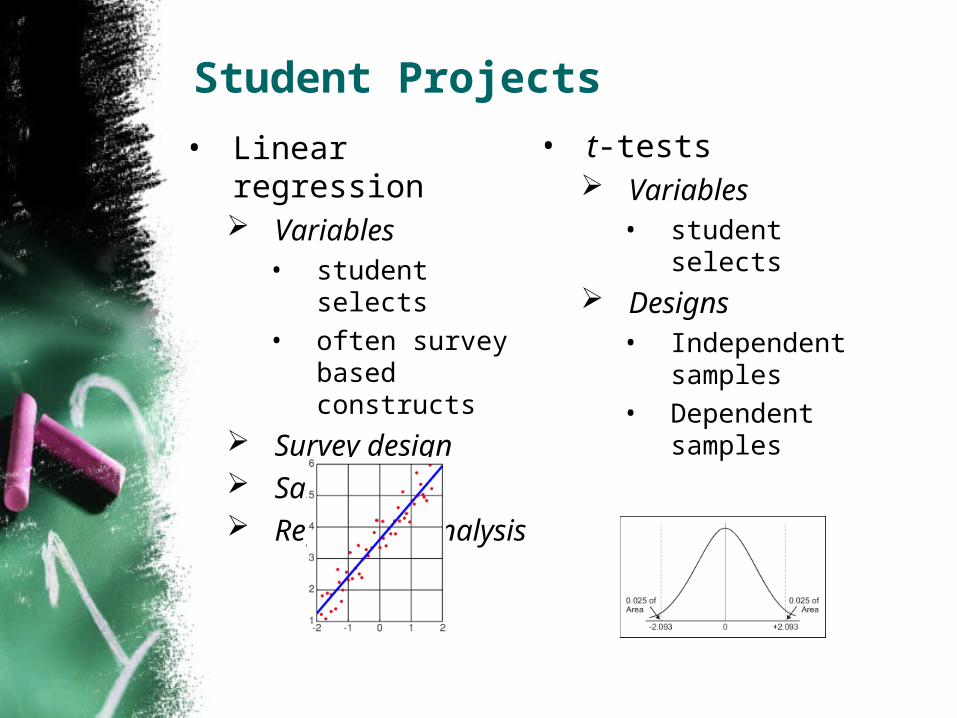
Student Projects
• Linear regression Variables
• student selects• often survey
based constructs Survey design Sampling Regression analysis
• t-tests Variables
• student selects Designs
• Independent samples
• Dependent samples

Make It Real
Sample Activities from
Our Workshop for
Teachers of AP Statistics
Workshop Goals:Mirroring Phases of the Project
• Participants create surveys: Develop quality research ideas Design their variables and constructs Practice writing good questions
• Surveys compiled, administered, and entered into Excel while participants are at lunch
• Participants return after lunch to analyze their research findings
• Participant teams present their findings and their own learning outcomes to the group
Points of Learning
• Scientific Method Where survey-based research fits Students become researchers
• Technology – Excel
• Statistics Regression analyses and analyzing relationships Presenting t-Test findings within context of
discovery learning
• Brainstorming sessions on: Collaborative groups Assignment sheets, timelines, grading rubrics
Activity 1
• Consider the following survey-study variable idea:1. How much did you study last week _____ ?
2. How many hours did you study last night?
0 1 – 2 3 – 4 5 – 6 7 – 8 10+
• What are some flaws?
• Design your own “study” variable. Write a terse, clear question Suggest answer format
• Closed vs. open
• If closed, give categories
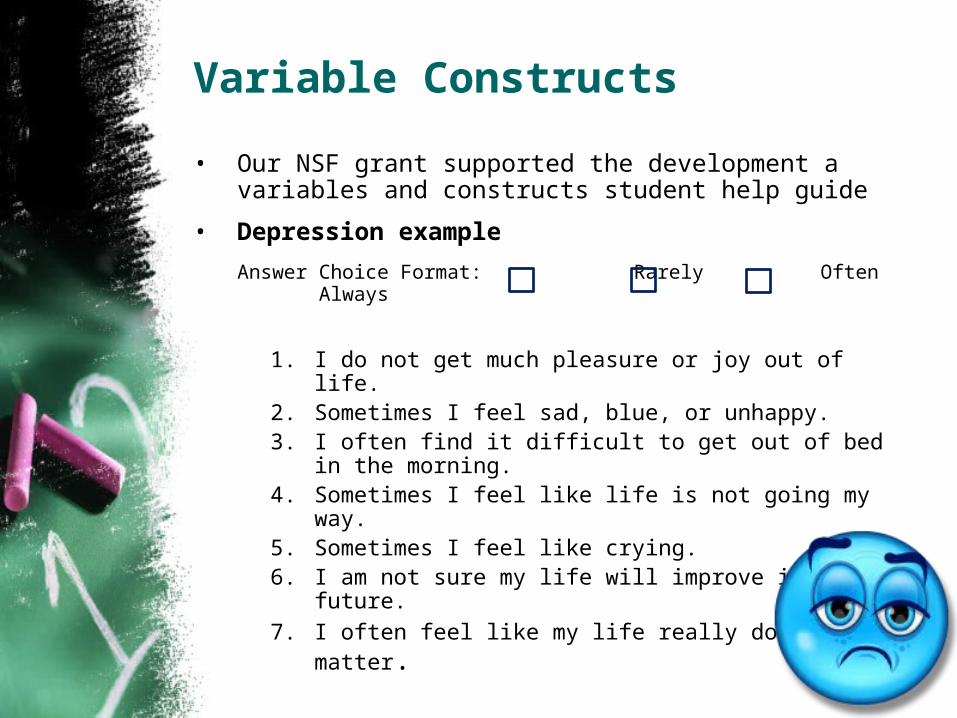
Variable Constructs
• Our NSF grant supported the development a variables and constructs student help guide
• Depression example
Answer Choice Format: Rarely Often Always
1. I do not get much pleasure or joy out of life.2. Sometimes I feel sad, blue, or unhappy.3. I often find it difficult to get out of bed in the morning.4. Sometimes I feel like life is not going my way.5. Sometimes I feel like crying.6. I am not sure my life will improve in the future.
7. I often feel like my life really doesn’t matter.
Interesting Variable Ideas
• Number of text messages sent during class
• Age when you had your first real kiss
• Number of songs on your I-Pod / MP3 player
• Minutes spent getting ready each morning
• Number of “years old” for the car you drive most often Appears to measure SES Used in “Rich Kids” study ideas
Activity 2
• Develop a t-test study idea Brainstorm a variable you think will be different
for two groups of students (at your school) Be ready to explain why you expect to find
differences
• We give our students (and the workshop participants) these “rules of brainstorming” Lots of talking must occur Throw out 5 or 6 ideas: “popcorn” Choose a couple of good ideas and revise
• You have about 3 minutes
Next Step
• Turning students’ research ideas into high quality surveys We have found that teaching others to facilitate
this portion of discovery is• The most difficult task• The most important task
We both are adept at operationalizing opinions, activities, obsessions, and preferences
• High quality surveys Multiple drafts Tested with a few peers Critiqued at least twice by an instructor
Activity 3
• For the chosen topic, try operationalizing the variable idea Talk with 2 – 3 folks nearby Be clear and terse Suggest an appropriate answer format
• You have about 3 minutes
Research and Findings• Design of the Study
• Student Outcomes
Phase I ResearchExploratory Study • Compared student groups, AY 2006-2007• Conducted prior to development of materials• Used to validate instruments
Main Pilot of Materials• 3 institutions
university (3 instructors) 2-year college (1 instructor) high school (1 instructor)
• Quasi-Experimental Design 2007-2008: Control groups by instructor 2008-2009: Treatment groups by instructor
Instruments Developed: Content Knowledge
• Instrument 21 multiple choice items KR-20 analysis: score = 0.63
• Exploratory Results treatment group significantly higher (p < .0001) effect size = 0.59
• Instrument shortened to 18 items for main pilot
Instruments Developed: Perceived Usefulness of Statistics
• Instrument 12-item Likert style survey; 6-point scale
Cronbach alpha = 0.93
• Exploratory Results treatment group significantly higher (p < .01)
effect size = 0.295
• Instrument unchanged for main pilot
Instruments Developed: Statistics Self-Efficacy• Beliefs in ability to use and understand statistics
• Instrument
15-item Likert style survey; 6-point scale
Cronbach alpha = 0.95
• Exploratory Results
gains realized, but not significant
(1-tailed p = .1045)
effect size = 0.15
• Instrument unchanged for main pilot
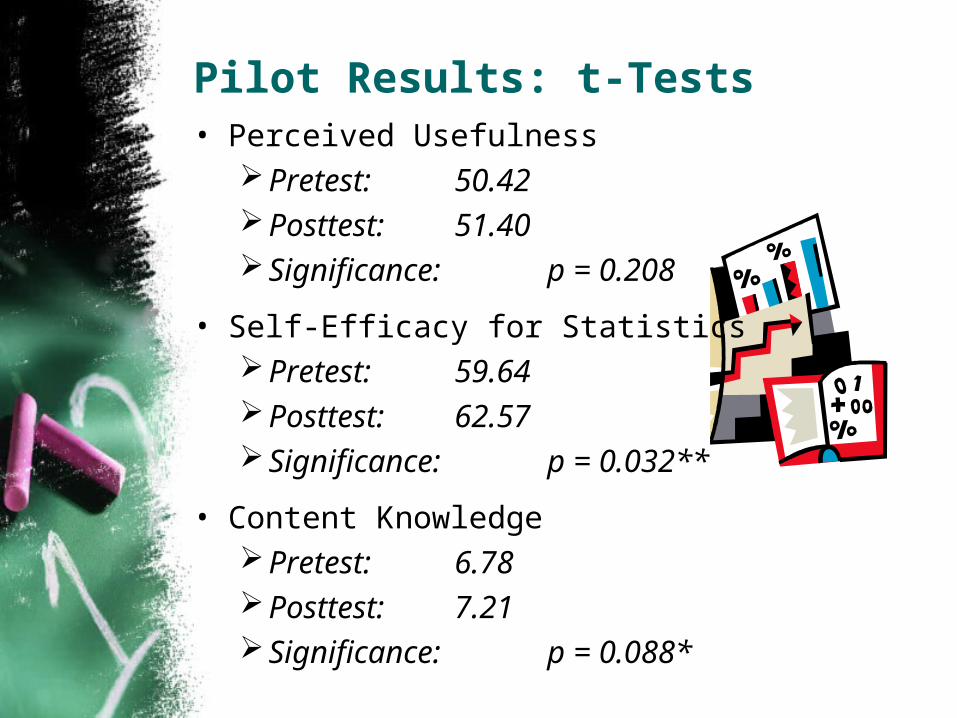
Pilot Results: t-Tests• Perceived Usefulness
Pretest: 50.42Posttest: 51.40Significance: p = 0.208
• Self-Efficacy for StatisticsPretest: 59.64Posttest: 62.57Significance: p = 0.032**
• Content KnowledgePretest: 6.78Posttest: 7.21Significance: p = 0.088*
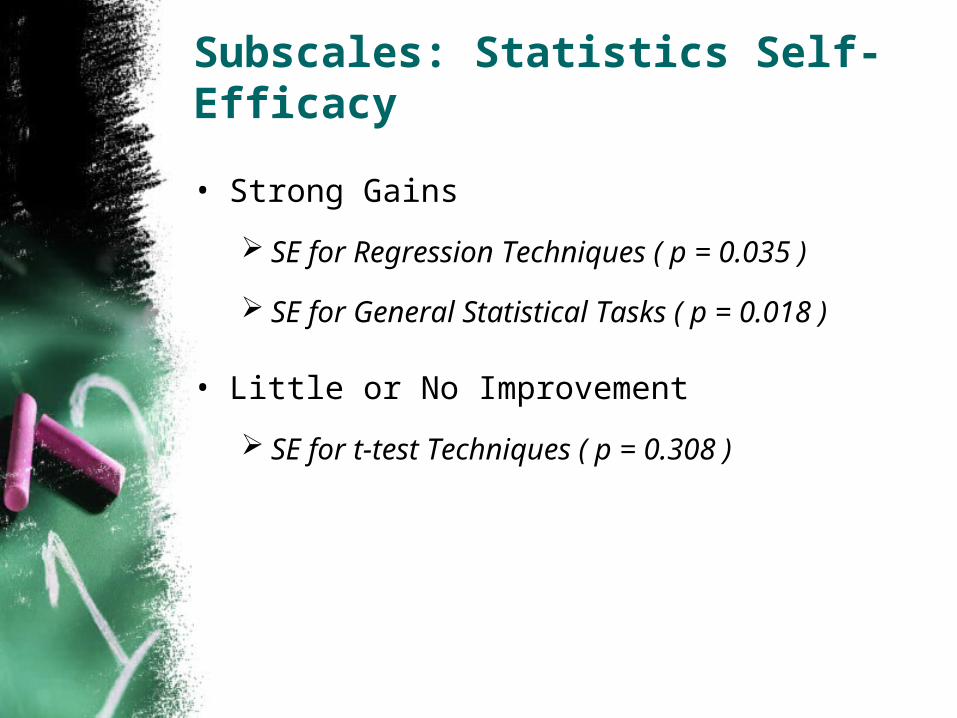
Subscales: Statistics Self-Efficacy
• Strong Gains
SE for Regression Techniques ( p = 0.035 )
SE for General Statistical Tasks ( p = 0.018 )
• Little or No Improvement
SE for t-test Techniques ( p = 0.308 )
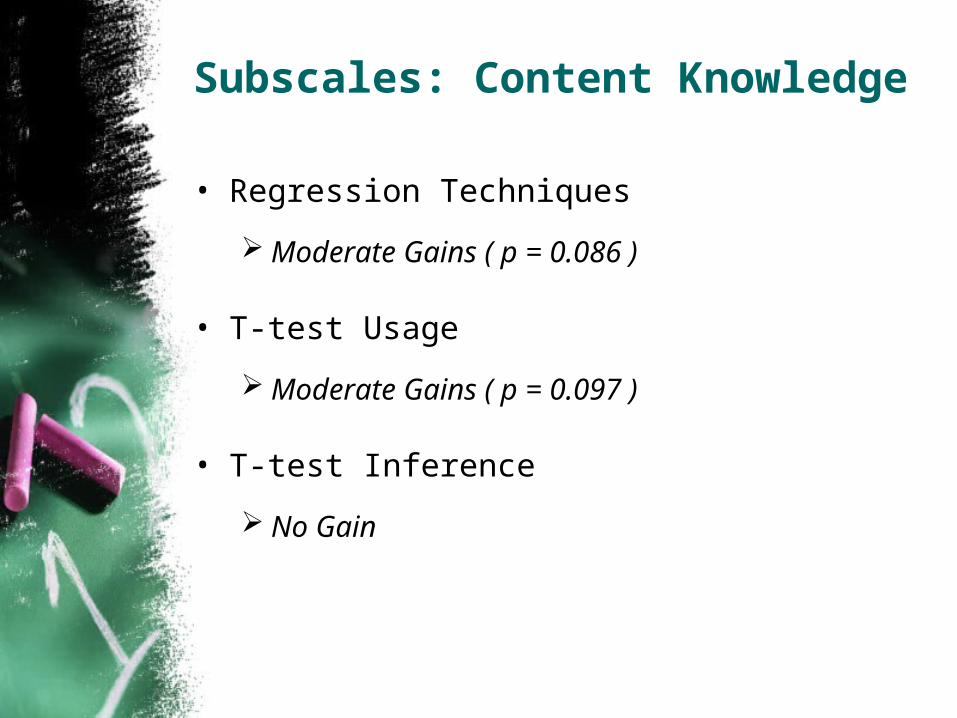
Subscales: Content Knowledge
• Regression Techniques
Moderate Gains ( p = 0.086 )
• T-test Usage
Moderate Gains ( p = 0.097 )
• T-test Inference
No Gain

Multivariate Analysis: Content Knowledge
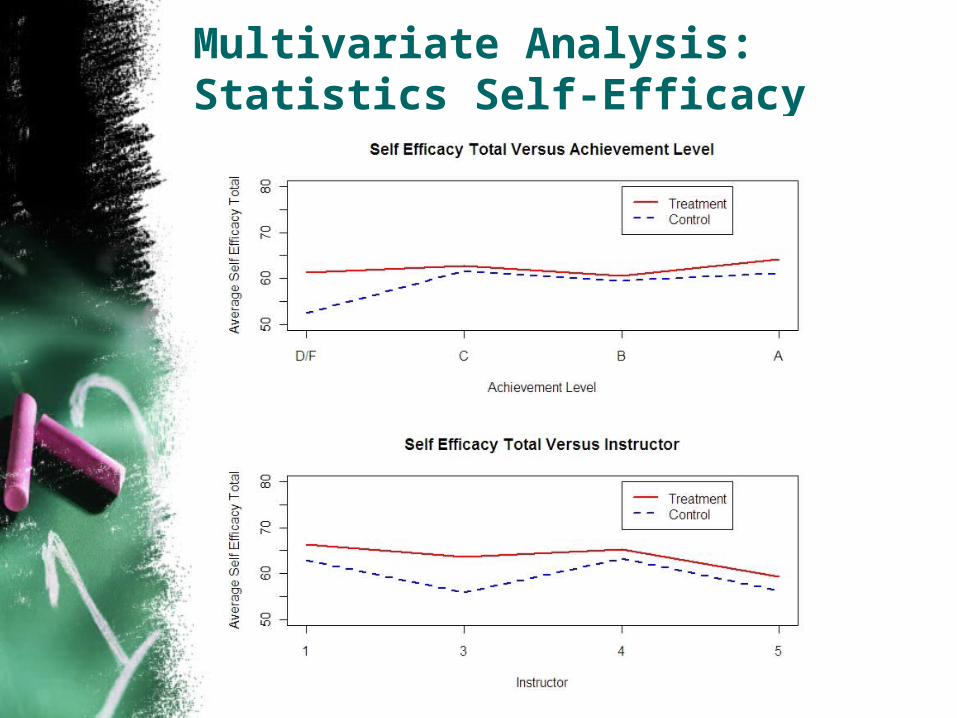
Multivariate Analysis: Statistics Self-Efficacy
Qualitative Findings:Participating Instructor Observations
• Students need guidance with research question
• Set Student Expectations Students underestimate time/effort required Students often unclear on exactly what to do once
they have collected the data Students should be prepared for results that may be
weak, non-significant, etc.• realistic view of statistics• avoid too much disappointment

Qualitative Findings:Student FeedbackStudent Quotes Shared by Instructors
“The main thing that we have learned is that statistics take time. They cannot be conjured up by a few formulas in a few minutes. The
time and effort that is put into a small research project such as this is significant.
On a large scale, one can quickly understand the kind of commitment of money and time that is required just to obtain reasonable
data.”
“While our results did not meet our initial expectations, this is not an utter disappointment. Before this project, statistics looked simple enough for anyone to sit down
and do, but now it is evident that it requires more creativity and critical thinking than initially expected. Overall, it was
an edifying experience.”
Materials Developed(Web-Based)
• Instructor GuideProject overview
• Timelines• Best practices
Student handoutsEvaluation rubrics
• Student GuideProject Guide
• Help for each project phase
Technology GuideVariables and
Constructs
http://radar.northgeorgia.edu/~rsinn/nsf/

Future Directions
NSF CCLI Type II Grant
• Proposal Submitted January 2010
• Goals Include: Nation wide pilot Vertical Integration to early secondary Revisions to Materials
• Increased flexibility• Accommodate early high school grades
Qualitative Component• More insight into instructor impact
Advisory Panel of Statisticians & Educators
For more information
• Project Website http://radar. northgeorgia.edu/~djspence/nsf/
• Instructional Materials Home http://radar.northgeorgia.edu/~rsinn/nsf/
• Contact Us Dianna: [email protected] Brad: [email protected] Robb: [email protected]