australia's foreign debt - aph
TRANSCRIPT

DEPARTMENT OF THE PARLIAMENTARY LIBRARY
Research
Service
Australia's Foreign Debt
Research Paper
No. 12 1995-96

ISS~ 1321-1579
Cop)Tight Commonwealth of Australia 1995
Except to the extent of the uses pennitted under the Copyright Act 1968, no part of this publication may be reproduced ortransmilled in any form or by any means including information storage and retrieval system, without the prior ....Tillen consent of theDepartment of the Parliamentary Library, other than by Members of the Australian Parliament in the course of their official duties.
Published by the Depal1ment of the Parliamentary Library, 1995

Parliamentary
Research
Service
Australia's Foreign DebtTony Kryger
Statisics Group
30 October 1995
Research Paper
No. 12 1995-96
Inquiries
Further copies of this publication may be purchased from the ,
Publications Distribution OfficerTelephone: (06) 277 2711
A full list of current Parliamentary Research Service publications is available on the ISR database
A quarter] y update of PRS publications may be obtained from the
PRS Publications OfficeTelephone: (06) 277 2760

Contents
Major Issues
Introduction
Level of Foreign Debt
Interest Liability
Historical Perspective
Composition of Foreign Debt by Institutional Sector
Composition of Foreign Debt by Currency
Composition of Foreign Debt by Country
Composition of Foreign Debt Domiciled Abroad by l\1aturity
Components of Increase in Gross Foreign Debt
Composition of Foreign Investment - Debt and Equities
Net Lending or BorrO\:ring by Sector
International Comparisons
Glossary
Data Sources
i
1
2
7
13
20
29
32
36
42
45
48
51
59
61


Australia's Foreign Debt
Major Issues
• Australia has almost always been a net recipient of overseas funds.
• The foreign debt/ GDP ratio rose rapidly and fairly consistently from 1981 to 1986. Theratio continued to rise steadily, but at a slower pace, from 1987 to 1993, before it fell in1994 and rose again in 1995.
• Australia's foreign debt relative to the size of its economy was consistently higher duringthe period up to 1941-42 than it has been for the period since. This is attributed to thehigh level of borrowings in the earlier period to finance infrastructure development
• The increase in foreign debt is largely attributed to the size and persistence of the currentaccount deficit, but other factors also affect it.
• Exchange rate movements have had a big impact on the level of foreign debt.
• The proportion of debt denominated in Australian dollars has risen substantially. Thiswill make future exchange rate movements less significant in terms of their influence onforeign debt.
• Turnover of foreign debt is rapid, and most loans from overseas are for very shortperiods. The proportion of short-term loans rose sharply during the first half of the1980s.
• Since 1949-50, foreign debt held by the official sector expressed as a proportion of GDPhas been at a considerably lower level than that which prevailed during all of the firsthalf of this century.
• The proportion of foreign debt held by the official sector has been rising steadily overthe past four years and is now at its highest level for 15 years. The majority of foreigndebt however, continues to be held by the non-official sector.
• Foreign investment in Australia is predominantly in the fonn of borrowed funds fromoverseas. The share of foreign investment attributed to borrowings (as opposed toequity) rose rapidly from 1981 to 1986, levelled off between 1987 and 1993 and thenfell in 1994.
• In 1993, Australia had the seventh highest ratio of net foreign debt to GDP in theindustrial world; in 1984 it was ranked tenth. In tenns of its ratio of net foreign liabilities(i.e. debt and equity) to GDP, Australia in 1993 was ranked third highest in theindustrial world.


Australia's Foreign Debt
Introduction
This paper on foreign debt is an update of a paper originally prepared by RobertDippelsman in September 1989.
The objectives of this paper are to provide explanation and detailed information on:
• The levels of gross and net foreign debt
• Comparisons over time and between countries.
• The interest liability on foreign debt
• Composition of foreign debt, by institutional sector, currency, country and repaymentperiod.
• The relationship between foreign borrowings and other capital inflows.
• The causes of foreign borrowings.

Australia's Foreign Debt
Level of Foreign Debt
Dollar Amount
Concepts
Foreign debt is defined as the amount borrowed from non-residents by residents ofAustralia. It is also called external debt or the level offoreign borrowing. Foreign debt isdistinguished from other kinds of foreign investment capital inflow such as foreignownership, because it carries with it the obligation to pay interest and repay the principal. Itshould be noted that foreign debt does not equal 'national debt'. The latter is the totalgovernment debt - which comprises government borrowing from overseas residents andgovernment borrowing from Australian residents - and thus excludes overseas borrowingsby the private sector.
Gross foreign debt is the total amount of borrowings from non-residents. It includessecurities issued such as bonds as well as loans, advances, deposits, debentures andoverdrafts.
Net foreign debt is the gross foreign debt, minus the value of foreign reserves held by theReserve Bank and minus lending by residents of Australia to non-residents. Official resenJeassets include gold, foreign exchange, special drawing rights and Australia's reserveposition in the International Monetary Fund. Reserve assets are held by the Reserve Bankof Australia.
Comments
The gross foreign debt at June 1995 was about $223 billion. After deducting Australia'sreserve assets and lending abroad of $42 billion, there was a net foreign debt of about $180billion. After being fairly low and stable through the 1970s, foreign debt has increasedsteadily since 1981. Between June 1981 and June 1995, gross foreign debt has risen to 15times and net foreign debt to almost 21 times its June 1981 figure.
Details: Table 1 and Figure 1.
2

Australia's Foreign Debt
As aPercentage of Gross Domestic Product
Concepts
Foreign debt is often expressed as a percentage of annual gross domestic product (GOP) inorder to show its relative significance. It allows more appropriate comparisons over time,as GOP grows with inflation and population, and reflects to a degree the economy'scapacity to repay. GOP is a measure of the total output of the economy. Although this ratiois a conventional measure, it should be realised that it does not mean that this proportion ofGOP must be applied to foreign debt. GOP is a flow of goods and services during a period,while foreign debt is a level at one point in time which will involve interest and repaymentsof principal over many periods into the future.
Two other measures of the relative size of foreign debt are presented in Table 1. One is theratio of foreign debt to the capital stock (i.e. the total value of dwellings, other buildings,engineering construction and equipment). The second is the ratio of foreign debt to thevalue of exports of goods and services.
Oata on average debt per person (or family) are sometimes used as a dramatic way ofpresenting foreign debt statistics. This may make large numbers easier to comprehend, butcan be misleading to the extent that it suggests that liability for the debt is evenly dividedthrough the whole population. In fact, liability lies largely with businesses (includingforeign-owned), which fmanced the purchase of assets, which in turn generate income toservice and repay the debt
Comments
Throughout the 1970s, gross foreign debt had been fairly steady at around 10 per cent ofGOP, but then accelerated in the 1980s, especially from 1981. In the fourteen years fromJune 1981 to June 1995, gross foreign debt more than quadrupled from 10.8 per cent to49.1 per cent of GDP. The most rapid growth occurred from 1981 to 1983 and from 1984to 1986. Gross foreign debt peaked at 51.7 per cent of GOP in June 1993. It fell thereafter,due mainly to a decline in the importance of borrowings relative to equity as a fOlID offoreign investment.
A similar pattern is evident for net foreign debt as a per cent of GDP which has increasedmore than six-fold since 1981. The more rapid growth of net foreign debt compared togross foreign debt reflects the fact that Australian lending abroad has not risen as fast asAustralian borrowings.
3

Australia's Foreign Debt
Gross foreign debt has risen from about two-thirds of annual exports of goods and servicesin June 1981, to well over double those exports for the entire period after June 1985. Grossforeign debt is currently 2.6 times exports.
Net foreign debt per capita has increased from around $600 in June 1981 to $10,000 inJune 1995.
Details: Table 1 and Figure 2.

TABLE 1. GROSS AND NET FOREIGN DEBT, 19GV TO 1995
$ million por cont ofGDP por cent $ per capita
Gross Net Gross Net Net foreign Gross foreign Gross Netforeign foreign foreign foreign debt/Net debt / Exports foreign foreign
30 June debt debt debt debt capital stock goods & services debt debt
1969 3385 1912 11.8 6.7 2.8 87.1 276 1561970 3655 2074 11.5 6.5 2.7 76.9 292 1661971 4589 2121 13.1 6.0 2.4 90.4 351 1621972 5524 1546 14.1 3.9 1.6 97.2 415 1161973 5347 738 11.9 1.6 0.6 76.2 396 551974 4995 1183 9.3 2.2 0.8 63.3 364 861975 5970 2099 9.2 3.2 1.2 59.1 430 1511976 5978 2399 7.8 3.1 1.1 53.3 426 1711977 7812 3888 8.9 4.4 1.6 58.3 550 2741978 10133 6155 10.6 6.5 2.2 71.2 706 4291979 12651 7930 11.7 7.3 2.6 74.9 872 5461980 13498 6863 10.9 5.6 1.9 61.4 919 4671981 15219 8553 10.8 6.1 2.1 67.5 1020 5731982 24350 16547 15.3 10.4 3.5 103.0 1604 10901983 35891 23384 20.8 13.6 4.5 140.5 2332 15191984 44101 29893 22.5 15.3 5.3 153.3 2831 19191985 67473 51208 31.1 23.6 8.1 189.7 4274 32431986 92550 75544 38.4 31.3 10.6 237.7 5778 47161987 107417 86138 40.5 32.5 11.0 243.7 6605 52961988 123122 96248 41.1 32.1 11.1 238.2 7447 58221989 146717 117298 43.2 34.5 12.0 264.6 8726 69761990 162770 131754 43.9 35.5 12.5 266.9 9538 77211991 179251 142782 47.4 37.8 13.1 270.5 10371 82611992 191268 153565 49.5 39.8 13.8 273.3 10936 8781 ~
1993 208420 167320 51.7 41.5 14.7 272.6 11804;::
9476 ~
1994 205927 163237 48.3 38.3 13.9 249.5 11541 9148 ~"-
1995 222576 180484 49.1 39.8 n.y.a. 256.2 12347 10012S·...,'
Not yet available ~n.y.a. ~o"Q.;:3
V1 ~~...

Australia's Foreign Debt
250000
Figure 1. Level of Foreign Debt· $ MillionAt 30 June 250000
200000Gross foreign debt
200000- Net foreign debt
II ..
150000 f' 150000c:: ~0 ~;.::
I
-6'* 100000 100000
50000 50000
.. .. ..0 0~ ~ C":l 1.0 r::-- ~ ~ C":l 1.0 r::-- O"l ~ C":l 1.0c.o r::-- r::-- r::-- r::-- r::-- 0:> 00 0:> 0:> 0:> ~ O"l ~O"l O"l ~ ~ ~ ~ O"l O"l ~ O"l O"l ~ ~ ~~ ~ ~ ~ ~ ~ ~ ~ ~ ~ ~ ~ ~ ~
60Figure 2. Level of Foreign Debt· % of GDP
60At 30 June
50 Gross foreign debt 50
- Net foreign debt
40,
40".. ", ,.~
~..0 .. ~
Co' 30 30'-0
~
20 20,,
10 10.... ~
f1I,- ..... tiP
.. .. f1I.... ..0 0~ ~ C":l 1.0 r::-- ~ ~ C":l 1.0 r::-- O"l ~ C":l l.~c.o r::-- r::-- r::-- r::-- r::-- 0:> 0:> 0:> 0:> 0:> O"l O"l ~
~ O"l O"l O"l O"l ~ O"l O"l O"l O"l O"l O"l O"l O"l~ ~ ~ ~ ~ ~ ~ ~ ~ ~ ~ ~ ~ ~
6

Australia's Foreign Debt
Interest Liability
Dollar Amount
Concepts
Interest payments on debt are an important aspect of the impact of foreign debt. \Vhile thelevel of debt reflects the amount of principal that needs to be repaid over a number of years,interest liabilities are incurred throughout the period of the loan.
The Australian Bureau of Statistics now publishes data on interest on foreign debt.Previously, total interest paid overseas was used. Interest paid overseas is only slightlylarger than interest on foreign debt due to inclusion in the former of interest on accountspayable and trade credit
Comments
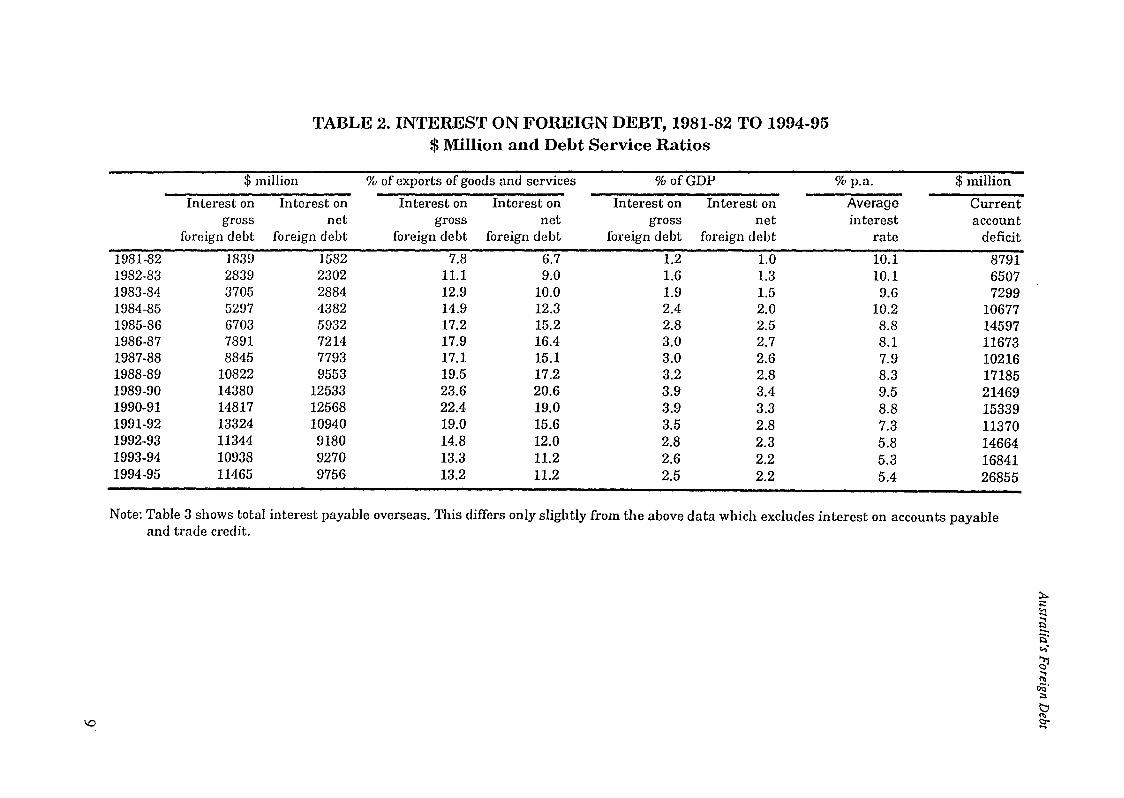
After peaking at $15 billion in 1990-91, total interest paid overseas fell, in response todeclining interest rates, to around $11 billion in 1993-94, rising to $11.5 billion in 199495. Interest received from overseas in 1994-95 was $2 billion, giving a net interest bill forthat year of about $10 billion. Gross interest paid overseas is now nine times as large as itwas in 1980-81.
The interest liability adds directly to the current account deficit. The $10 billion in netinterest paid was a significant component of the current account deficit of $27 billion in1994-95. In 1993-94 - prior to the blowout in the trade deficit - net interest paidaccounted for $9 billion out of a current account deficit of $17 billion.
Details: Table 2 (interest on foreign debt), Table 3 (total interest paid overseas) and Figure3.
As aPercentage of Gross Domestic Product
Concepts
As with the level of debt, it is useful to obtain a measure of the relative size of interest onforeign debt. The method most commonly used is interest as a percentage of exports ofgoods and services. This measure emphasises the intemational liquidity aspects of interestpayments. Another method (Figure 4) is interest as a percentage of GDP, which emphasisesthe burden on incomes.
7

Australia's Foreign Debt
Debt service ratios make possible more meaningful comparisons over time, because bothinterest and exports are affected by inflation. As well, exports of goods and servicesprovide a source of foreign exchange income that can be applied to meeting interestpayments. (Other sources of foreign exchange are property and labour income, transferpayments and further borrowing.)
The ratio of interest payments to the level of debt shows the average interest rate- paid. Theaverage debt level is calculated by a weighting of two-thirds the previous 30 June and onethird the 30 June the same year, using a method published by the Economic PlannmgAdvisory Council.
Comments
Gross interest paid overseas was around half of one per cent of GDP through the 1960sand most of the 1970s. The interest liability climbed to around 3 per cent in the latter halfof the 1980s, jumping to 4.0 per cent in 1989-90. It remained at this level in 1990-91, butfell thereafter to 2.5 per cent in 1994-95. In 1994-95 therefore, 2.5 per cent of the value ofall goods and services produced within Australia was required to pay the interest tooverseas.
Interest received from overseas is relatively small. In 1994-95 it amounted to 0.4 per centofGDP.
As a percentage of exports of goods and services, gross interest has risen from around 3 to5 per cent in the 1960s and 1970s to peak at 24.2 per cent in 1989-90. By 1994-95, grossinterest had fallen to 13.2 per cent and net interest to 11.2 per cent of the value of goodsand services exported.
The average interest rate for 1994-95 was 5.4 per cent per annum, considerably below itslevel of around 10 per cent in the early 1980s.
Details: Table 2 (interest on foreign debt), Table 3 (total interest paid overseas) and Figure4.
8
\0
1"'ABLE 2. INTEREST ON FOREIGN DEBT, 1981-82 TO 1994-95$ Million and Debt Service Ratios
$ million % of exports of goods and services % ofGDP %p.a. $ million
Interest on Interest on Interest on Interest on Interest on Interest on Average Currentgross net gross net gross net interest account
foreign debt foreign debt foreign debt foreign debt foreign debt foreign debt rate deficit
1981-82 1839 1582 7.8 6.7 1.2 1.0 10.1 87911982-83 2839 2302 11.1 9.0 1.6 1.3 10.1 65071983-84 3705 2884 12.9 10.0 1.9 1.5 9.6 72991984-85 5297 4382 14.9 12.3 2.4 2.0 10.2 106771985-86 6703 5932 17.2 15.2 2.8 2.5 8.8 145971986-87 7891 7214 17.9 16.4 3.0 2.7 8.1 116731987-88 8845 7793 17.1 15.1 3.0 2.6 7.9 102161988-89 10822 9553 19.5 17.2 3.2 2.8 8.3 171851989-90 14380 12533 23.6 20.6 3.9 3.4 9.5 214691990-91 14817 12568 22.4 19.0 3.9 3.3 8.8 153391991-92 13324 10940 19.0 15.6 3.5 2.8 7.3 113701992-93 11344 9180 14.8 12.0 2.8 2.3 5.8 146641993-94 10938 9270 13.3 11.2 2.6 2.2 5.3 168411994-95 11465 9756 13.2 11.2 2.5 2.2 5.4 26855
Note: Table 3 shows total interest payable overseas. This differs only slightly from the above data which excludes interest on accounts payableand trade credit.
:t>+::~
~-s·",-
61~
r)Q';::s
~~...

TABLE 3. TOTAL INTEREST PAID OVERSEAS, 1959-60 1'0 1994-95 ~0
$ Million and Debt Service Ratios;::
"'"....25~
$ million % of exports of goods and services % ofGDP "",-
6lGross Net Gross Net Gross Net ~interest interest interest interest interest interest oQ"
;:s
paid paid paid paid paid paid tl~
overseas overseas overseas overseas overseas overseas (:)-....1959-60 61 34 2.8 1.6 0.4 0.21960-61 68 35 3.1 1.6 0.4 0.21961-62 72 24 2.9 1.0 0.5 0.21962-63 75 39 3.0 1.6 0.4 0.21963-64 83 36 2.6 1.1 0.4 0.21964-65 88 27 2.9 0.9 0.4 0.11965-66 102 49 3.3 1.6 0.5 0.21966-67 112 49 3.2 1.4 0.5 0.21967-68 124 71 3.5 2.0 0.5 0.31968-69 154 79 4.0 2.0 0.5 0.31969-70 191 118 4.0 2.5 0.6 0.41970-71 237 143 4.7 2.8 0.7 0.41971-72 293 150 5.2 2.6 0.7 0.41972-73 297 78 4.2 1.1 0.7 0.21973-74 306 8 3.9 0.1 0.6 0.01974-75 404 123 4.0 1.2 0.6 0.21975-76 435 240 3.9 2.1 0.6 0.31976-77 477 314 3.6 2.3 0.5 0.41977-78 576 449 4.0 3.2 0.6 0.51978-79 838 677 5.0 4.0 0.8 0.61979-80 1108 908 5.0 4.1 0.9 0.71980-81 1216 938 5.4 4.2 0.9 0.71981-82 1874 1527 7.9 6.5 1.2 1.01982-83 2894 2264 11.3 8.9 1.7 1.31983-84 3787 2876 13.2 10.0 1.9 1.51984-85 5352 4343 15.0 12.2 2.5 2.01985-86 6720 5900 17.3 15.2 2.8 2.4

..........
TABLE 3. TOTAL INTEREST PAID OVERSEAS, 1959-GO TO 1994-95 (continued)$ Million and Debt Service Ratios
$ million % of exports of goods and services %ofGDP
Gross Net Gross Net Gross Netinterest interest interest interest interest interest
paid paid paid paid paid paidoverseas overseas overseas overseas overseas overseas
1986-87 8004 7151 18.2 16.2 3.0 2.71987-88 8880 7725 17.2 14.9 3.0 2.61988-89 11091 9720 20.0 17.5 3.3 2.91989-90 14752 12750 24.2 20.9 4.0 3.41990-91 14986 12612 22.6 19.0 4.0 3.31991-92 13416 10979 19.2 15.7 3.5 2.81992-93 11434 9250 15.0 12.1 2.8 2.31993-94 11035 9336 13.4 11.3 2.6 2.21994-95 11480 9725 13.2 11.2 2.5 2.1
Note: Table 2 shows interest on foreign debt. This differs only slightly froIn the above data which includesinterest on accounts payable and trade credit.
:t>;;;:~;::-E',-,>'
6"1~00';::s
~l::r'-

Australia's Foreign Debt
30000Figure 3. Interest Liability· $ Million
Year ended 30 June30000
- -
25000
20000
§ 15000;:3·s"* 10000
5000
-5000
"" , '" 'Current account deficit
---Gross interest paid overseas
- Net interest paid overseas
I 25000
20000
15000
.. ' 10000
5000
o
-5000
7 Figure 4. Interest Liability. % of GDPYear ended 30 June
7
2
3
1
4
6
5
--Current account deficit
o
-1
6
5
4 J\" -.,(\Ne;t./~terest paid overseas
0.. > \ /\l I,~0 3 ox i' $f
2 \~. ~ II "; 2 \ 1\. r ~
1 ,h .1 .......... ", .. \.l .,.#
~ V~.·-+~-+-t-t--t-1r-~+-+-t-t-+~-t-1H--t--i-~+-+-t-t-+:+~1
i-2 -2
12

Australia's Foreign Debt
Historical Perspective
Debt as aPercentage of Gross Domestic Product
Concepts
Long-term data can be used to give an historical perspective on Australia's current foreigndebt situation. Comprehensive estimates of foreign debt are only available from 1969onwards. However, data for public securities held overseas are available for the whole ofthis century. Although public securities now represent only a minority of foreign debt, thiswas not the case in the past. While estimates of private foreign debt are not available forearlier years, data on interest paid suggest that the level of debt was insignificant prior tothe mid-1960s. We therefore have a reasonable, although not comprehensive, measure offoreign debt since 1901.
Comments
In dollar terms, the level of official debt is now considerably higher than ever before. As aproportion of GDP however, official debt is now at a level which is considerably lower thanthat which prevailed during all of the first half of this century.
Total foreign debt as a proportion of GDP is now at its third highest level for over 50years; higher levels were recorded in 1991-92 and 1992-93 as well as all of the periodprior to 1942-43.
Details: Table 4 and Figure 5.
Interest as aPercentage of Gross Domestic Product
Concepts
Interest payments on public securities held overseas are also available for the whole of thetwentieth century. Payment of other interest overseas is available since official balance ofpayments statistics were first compiled (for 1936-37 to 1939-40 and from 1945-46onwards). However, the values are so small as to be virtually negligible before the mid1960s.
13

Australia's Foreign Debt
Comments
The interest liability on public securities rose as a percentage of GDP during the 1980s. Ithas remained fairly stable at around 1 per cent of GDP during the fIrst half of the 1990s, alevel that is lower than it was for the entire period prior to the mid 1940's.
The ratio of total interest payments to GDP has risen from less than one per cent during allof the 1950s, 1960s and 1970s to 3.9 per cent in 1990-91, falling each year thereafter to2.5 per cent in 1994-95.
Details: Table 4 and Figure 6.
14

TABLE 4. HISTORICAL DATA, 1900-01 '1'0 1994-95
Level of foreign debt Interest on gross foreign debt
Public securities / Ofljcial Public securities / Ollicial Other 'l'otal
% of exports % of exports % of exportsof goods ofgoods ofgoods
$ million % of GDP $ million and services % of GDP $ million and services % of GDP $ million and services % of GDP
1900-01 357 85.2 13 12.6 3.1 n.a. n.a. n.a. n.a. n.a. n.a.1901-02 364 82.0 13 13.4 2.9 n.a. n.a. n.a. n.a. n.a. n.a.1902-03 375 87.6 14 14.9 3.3 n.a. n.a. n.a. n.a. n.a. n.a.1903-04 377 84.2 14 13.2 3.1 n.a. n.a. n.a. n.a. n.a. n.a.1904-05 378 85.1 14 11.6 3.2 n.a. n.a. n.a. n.a. n.a. n.a.1905-06 384 80.2 14 10.5 2.9 n.a. n.a. n.a. n.a. n.a. n.a.1906-07 372 69.1 13 8.8 2.4 n.a. n.a. n.a. n.a. n.a. n.a.1907-08 367 68.5 13 9.0 2.4 n.a. n.a. n.a. n.a. n.a. n.a.1908-09 381 66.5 14 10.1 2.4 n.a. n.a. n.a. n.a. n.a. n.a.1909-10 383 61.5 14 8.9 2.2 n.a. n.a. n.a. n.a. n.a. n.a.1910-11 382 55.8 14 8.4 2.0 n.a. n.a. n.a. n.a. n.a. n.a.1911-12 388 52.9 14 8.5 1.9 n.a. n.a. n.a. n.a. n.a. n.a.1912-13 409 51.0 15 8.8 1.9 n.a. n.a. n.a. n.a. n.a. n.a.1913-14 455 52.7 16 9.4 1.9 n.a. n.a. n.a. n.a. n.a. n.a.1914-15 493 58.8 19 13.4 2.3 n.a. n.a. n.a. n.a. n.a. n.a.1915-16 542 55.9 21 12.7 2.2 n.a. n.a. n.a. n.a. n.a. n.a.1916-17 587 57.4 23 9.5 2.3 n.a. n.a. n.a. n.a. n.a. n.a.1917-18 701 66.0 29 13.9 2.7 n.a. n.a. n.a. n.a. n.a. n.a.1918-19 694 60.6 29 12.8 2.5 n.a. n.a. n.a. n.a. n.a. n.a.1919-20 716 57.1 31 10.3 2.5 n.a. n.a. n.a. n.a. n.a. . n.a.1920-21 743 53.8 33 12.3 2.4 n.a. n.a. n.a. n.a. n.a. n.a. ~
;::1921-22 823 59.7 38 14.2 2.8 n.a. n.a. n.a. n.a. n.a. n.a. ~
1922-23 839 55.6 38 14.5 2.5 t:ln.a. n.a. n.a. n.a. n.a. n.a. --.1923-24 922 58.8 43 16.2 2.7
l'ln.a. n.a. n.a. n.a. n.a. n.a. ",-
1924-25 928 53.9 44 12.9 2.6 n.a. n.a. n.a. n.a. n.a. n.a. ~1925-26 1004 60.5 48 15.9 2.9 n.a. n.a. n.a. n.a. n.a. n.a. ~
~.
1926-27 1032 59.7 49 17.1 2.8 n.a. n.a. n.a. n.a. n.a. n.a. ;::s
...... 1927-28 1142 65.7 55 18.8 3.2 tln.a. n.a. n.a. n.a. n.a. n.a. "'VI ~
1928-29 1144 66.8 55 17.9 3.2 -n.a. n.a. n.a. n.a. n.a. n.a.1929-30 1150 73.4 55 25.5 3.5 n.a. n.a. n.a. n.a. n.a. n.a.1930-31 1198 93.1 57 28.4 4.4 n.a. n.a. n.a. n.a. n.a. n.a.

;:x,..::::0- TABLE 4. HISTORICAL DATA, 1900-01 TO 1994-95 (continued) !::l~---.l:l
Level of foreign debt Interest on gross foreign debt ",-
61Public securities / Official Public securities / Official Other Total ;;;00'
% of exports % of exports % of exports ;::
ofgoods of goods ofgoods \:1<1>~$ million % of GDP $ million and services % of GDP $ million and services % of GDP $ million and services % of GDP ....
-1931-32 1310 108.3 49 22.4 4.0 n.a. n.a. n.a. n.a. n.a. n.a.1932-33 1299 102.8 47 20.9 3.7 n.a. n.a. n.a. n.a. n.a. n.a.1933-34 1289 95.1 44 17.0 3.2 n.a. n.a. n.a. n.a. n.a. n.a.1934-35 1286 89.8 43 17.6 3.0 n.a. n.a. n.a. n.a. n.a. n.a.1935-36 1281 81.4 42 14.6 2.7 n.a. n.a. n.a. n.a. n.a. n.a.1936-37 1278 74.4 41 11.5 2.4 0.6 0.2 .. 42 11.7 2.41937-38 1278 68.8 41 11.7 2.2 0.6 0.2 .. 42 11.9 2.21938-39 1288 70.8 41 13.1 2.3 0.6 0.2 " 42 13.2 2.31939-40 1306 66.0 41 10.9 2.1 0.6 0.2 .. 42 11.1 2.11940-41 1324 61.7 42 11.1 2.0 n.a. n.a. n.a. n.a. n.a. n.a.1941-42 1317 52.7 40 9.6 1.6 n.a. n.a. n.a. n.a. n.a. n.a.1942-43 1321 46.2 40 9.3 1.4 n.a. n.a. n.a. n.a. n.a. n.a.1943-44 1269 43.7 39 6.6 1.3 n.a. n.a. n.a. n.a. n.a. n.a.1944-45 1230 43.3 38 7.2 1.3 n.a. n.a. n.a. n.a. n.a. n.a.1945-46 1148 39.1 32 5.7 1.1 0.6 0.1 .. 33 5.9 1.11946-47 1111 35.6 31 4.7 1.0 0.6 0.1 .. 32 4.8 1.01947-48 1122 29.9 29 3.2 0.8 0.8 0.1 .. 30 3.3 0.81948-49 1093 24.4 28 2.5 0.6 1.6 0.1 .. 30 2.6 0.71949-50 1099 20.9 27 2.1 0.5 .L.a 0.1 .. 29 2.2 0.51950-51 1067 15.2 26 1.2 0.4 1 .. .. 27 1.3 0.41951-52 1113 14.8 27 1.8 0.4 1 0.1 .. 28 1.9 0.41952-53 1142 13.4 28 1.5 0.3 2 0.1 .. 30 1.6 0.41953-54 1165 12.5 28 1.6 0.3 1 0.1 .. 29 1.6 0.31954-55 1216 12.2 30 1.8 0.3 1 0.1 .. 31 1.8 0.31955-56 1269 11.8 45 2.6 0.4 1 0.1 .. 46 2.7 0.41956-57 1216 10.4 44 2.0 0.4 2 0.1 .. 46 2.1 0.41957-58 1248 10.4 47 2.6 0.4 2 0.1 .. 49 2.7 0.41958-59 1319 10.2 52 2.8 0.4 2 0.1 .. 54 2.9 0.41959-60 1389 9.7 56 2.6 0.4 5 0.2 .. 61 2.8 0.41960-61 1413 9.3 60 2.8 0.4 7 0.3 .. 67 3.1 0.4

'fABLE 4. HISTORICAL DATA, 1900-01 TO 1994-95 (continued)
Level of foreign debt Interest on gross foreign debt
Public securities / Official Public securities / Official Other Total
% of exports % of exports % of exportsof goods of goods of goods
$ million % of GDP $ million and services % of GDP $ million and services % of GDP $ million and services % of GDP
1961-62 1424 9.1 61 2.5 004 6 0.2 .. 67 2.7 0041962-63 1522 9.0 67 2.7 004 7 0.3 .. 74 3.0 0041963-64 1545 8.3 69 2.2 004 11 0.3 0.1 80 2.5 0041964-65 1539 7.5 69 2.3 0.3 16 0.5 0.1 85 2.8 0041965-66 1505 7.0 69 2.2 0.3 29 0.9 0.1 98 3.1 0.51966-67 1562 6.6 73 2.1 0.3 40 1.2 0.2 113 3.3 0.51967-68 1557 6.1 77 2.2 0.3 48 1.3 0.2 125 3.5 0.51968-69 1747 6.1 84 2.2 0.3 70 1.8 0.2 154 4.0 0.51969-70 1636 5.1 91 1.9 0.3 100 2.1 0.3 191 4.0 0.61970-71 1600 4.6 89 1.8 0.3 147 2.9 004 236 4.6 0.71971-72 1497 3.8 91 1.6 0.2 202 3.6 0.5 293 5.2 0.71972-73 1350 3.0 84 1.2 0.2 212 3.0 0.5 296 4.2 0.7197:3-74 1163 2.2 80 1.0 0.1 226 2.9 004 306 3.9 0.61974-75 1334 2.1 86 0.9 0.1 318 3.1 0.5 404 4.0 0.61975-76 1403 1.8 94 0.8 0.1 341 3.0 004 435 3.9 0.61976-77 2325 2.7 130 1.0 0.1 347 2.6 004 477 3.6 0.51977-78 4228 404 187 1.3 0.2 389 2.7 004 576 4.0 0.61978-79 5740 5.3 356 2.1 0.3 481 2.8 004 837 5.0 0.81979-80 5687 4.6 438 2.0 004 670 3.0 0.5 1108 5.0 0.91980-81 4816 304 416 1.8 0.3 800 3.5 0.6 1216 504 0.9 :J:,..
1981-82 5692 3.6 435 1.8 0.3 1404 5.9;::
0.9 1839 7.8 1.2 !::l.1982-83 7682 4.5 596 2.3 0.3 2243 8.8 1.3 2839 11.1 -1.6 ~
"--.1983-84 8874 4.5 711 2.5 004 2994 lOA 1.5 3705 12.9 1.9
I::l",'
1984-85 14883 6.9 964 2.7 004 4333 12.2 2.0 5297 14.9 204 ~1985-86 23452 9.7 1474 3.8 0.6 5228 1304 2.2 6702 17.2 2.8 ~.1986-87 30362 11.5 2288 5.2 0.9 5604 12.7 2.1 7892 17.9 3.0 ;:s
..... 1987-88 33128 11.1 2962 5.7 1.0 5883 11.4 2.0 8845 17.1 3.0 tl'"-..l 1988-89 36837 10.8 3157 5.7 0.9 7663 13.8e:::-
2.3 10820 19.5 3.2 -1989-90 39443 10.6 4077 6.7 1.1 10303 16.9 2.8 14380 23.6 3.91990-91 41864 11.1 3843 5.8 1.0 10975 16.6 2.9 ·14818 22.4 3.9

TABLE 4. HISTORICAL DATA, 1900-01 TO 1994-95 (continued)
Level of Loreign debt
Public securities I Official
$ million % of GDP
% of exportsof goods
$ million and services % of GDP
19.014.813.313.2
13325113421093811465
~
~...2:~...,-6J
Total ~00'
% of exports ;::l
of goods ~$ million and services % of GDP s:r
3.52.82.62.5
Other
Interest on gross foreign debt
% of exportsof goods
$ million and services % of GDP
9378 13.4 2.47762 10.2 1.96829 8.3 1.67500 8.6 1.7
1.00.91.00.9
5.64.75.04.6
Public securities I Official
39473G8041093965
11.714.814.616.8
45273594326247276402
1991-921992-931993-941994-95
00
n.a. Not availableLess than 0.05 per cent.Break in series.
Note: Where interest on foreign debt was not available, total interest paid overseas has been used.

120
100
80~00 60....0
~
40
20
0..-i0~..-i
5
4
~ 3§....o
~ 2
1
Australia's Foreign Debt
Figure 5. Historical Perspective:Foreign Debt - % GDP
Debt at 30 June; GDP for Year Ended 30 Juneo Other foreign debt
II Official foreign debt
Figure 6. Historical Perspective:Interest on Foreign Debt - % GDP
Year Ended 30 June
o Other foreign debt
mOfficial foreign debt
19

Australia's Foreign Debt
Composition of Foreign Debt by Institutional Sector
Concepts
Foreign debt may be classified by resident institutional sector of the borrower.
The official sector includes the Reserve Bank and general government. Generalgovernment consists of departments, offices and organisations which are the agencies of theCommonwealth, State or local public authorities; it excludes government businessenterprises. Commonwealth and State data are available separately. It has only been since1984 that State Governments have begun borrowing in their own right; local governmentforeign borrowing is negligible.
The non-official sector can be subdivided into the public and private sectors. Publicenterprises are included in the non-official sector. The non-official sector may also be subdivided into trading and financial enterprises. Trading enterprises are mainly engaged inthe production of goods and services for sale while [mancial enterprises are mainly engagedin incurring liabilities and acquiring [mancial assets. Data for banks are available separatelywithin financial enterprises.
To obtain net foreign debt for each sector, their lending abroad and reserve assets arededucted from gross debt. There is not as much detail published as for gross debt, butofficial, trading and financial enterprises are available.
Another useful classification shows debt separately for direct and portfolio investment.With direct investment there is a degree of control by the investor. Since 1 July 1985, thishas been defined as 10 per cent of ordinary shares or voting stock (previously 25 per cent).
Comments
Among the interesting trends in shares of gross foreign debt are:
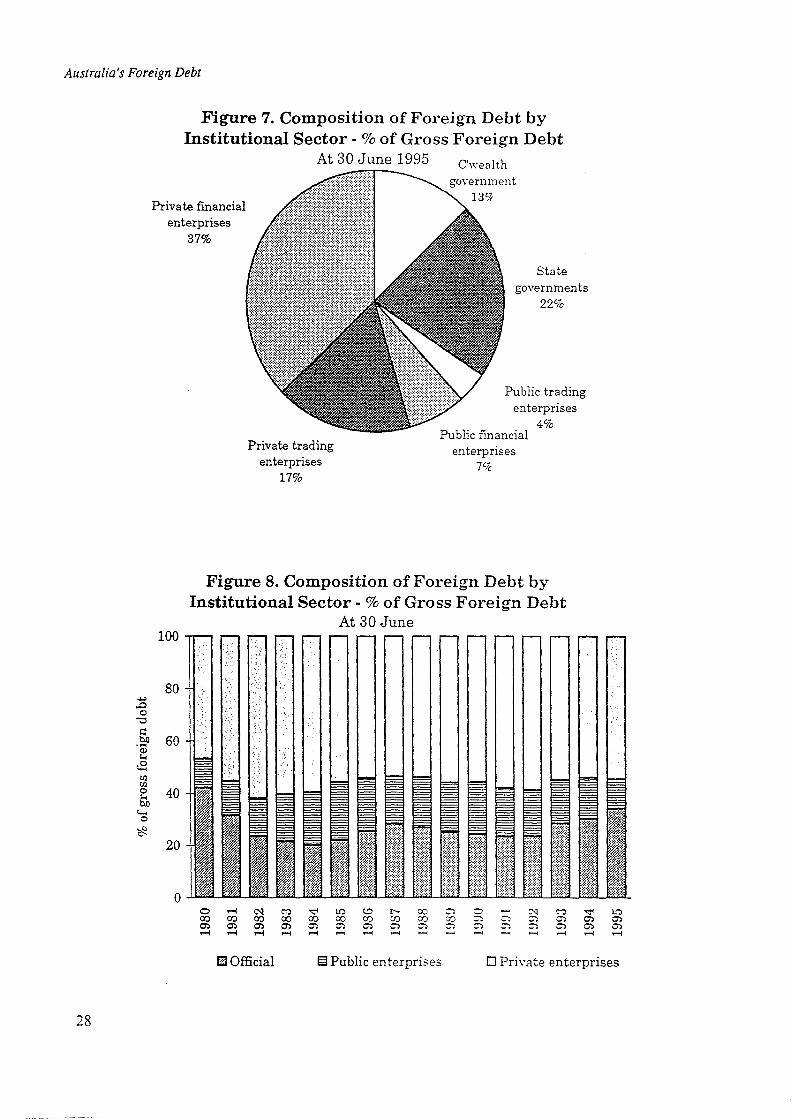
• Decline in the Commonwealth government's share from 45.4 per cent in 1979 to 8.8 percent in 1992, rising to 12.5 per cent in 1995.
• Growth in the State governments' share from nil in 1983 to 21.8 per cent in 1995.
• Rapid rise in public enterprises' share in the first half of the 1980s and its subsequent fallin the first half of the 1990s.
• Rapid growth of the financial sector's share since 1983 - it almost quadrupled in theperiod to 1992 but has remained fairly stable since then.
• Some growth in the private sector's share between 1988 and 1992, followed by a fall to54.5 per cent in 1995 - well below the peak of 62.0 per cent in 1982.
20

Australia's Foreign Debt
• A fall in direct investment during the mid 1980s, followed by an increase in the late1980s and a fall again in the first half of the 1990s.
Details: Tables 5a, 5b and 5c and Figures 7 and 8.
21

IV 1'ABLE 5a. COMPOSITION OF FOREIGN DEB'.r - INSTITUTIONAL SECTOR, 1969 1'0 1995 ~;;;;;IV~$ Million ~
~Non-official "'-Official 6J
C'wealth State Total Private Private Total ....'"0'<)'
govern- govern- official Public trading financial Direct private ;:s
30 June ment ments (1I) sector enterprises enterprises enterprises investment sector Banks (u) 0'"~...
1969 1747 0 1747 n.a. n.a. n.a. n.a. n.a. n.a.1970 1636 0 1636 n.a. n.a. n.a. n.a. n.a. n.a.1971 1600 0 1600 n.a. n.a. n.a. n.a. n.a. n.a.1972 1497 0 1497 n.a. n.a. n.a. n.a. n.a. n.a.1973 1350 0 1350 n.a. n.a. n.a. n.a. n.a. n.a.1974 1163 0 1163 n.a. n.a. n.a. n.a. n.a. n.a.1975 1334 0 1334 n.a. n.a. n.a. n.a. n.a. n.a.1976 1403 0 1403 n.a. n.a. n.a. 1824 n.a. n.a.1977 2325 0 2325 n.a. n.a. n.a. 1925 n.a. n.a.1978 4228 0 4228 n.a. 4960 n.a. 2002 n.a. n.a.1979 5740 0 5740 n.a. 5609 n.a. 2274 n.a. n.a.1980 5687 0 5687 1497 5094 1220 2265 6314 n.a.1981 4816 0 4816 2004 6841 1557 2699 8398 7711982 5692 0 5692 3568 12355 2735 3849 15090 10741983 7682 0 7682 6525 18284 3400 4418 21684 14751984 8534 339 8873 8907 21247 5073 5402 26320 18301985 12982 1901 14883 14981 28574 9034 7201 37608 41421986 19553 3898 23451 18966 35069 14977 8859 50046 108381987 23678 6684 30362 19589 37595 19870 10633 57465 157871988 22909 10219 33128 23736 40954 25303 13000 66257 200631989 18607 18230 36837 28010 46644 35226 16835 81870 286751990 19654 19788 39442 32525 47228 43574 19097 90802 352761991 17429 24435 41864 33536 47539 56311 19941 103850 444221992 16848 28425 45273 33529 49222 63244 22171 112466 510771993 21469 37963 59432 34630 50038 64321 22202 114359 554611994 22913 39560 62473 32438 43443 67573 21912 111016 611961995 27929 48473 76402 24875 38619 82681 20892 121300 57155

TABLE 5a. COMPOSITION OF FOREIGN DEBT - INSTITUTIONAL SECTOR, 1969 TO 1995 (continued)
$ Million
Non-oflicial (Cont'd) Net foreign debt
Financial Total Total Total gross Total Total netEnter- non- public foreign Financial Trading non- foreign
30 June prises (h) official sector (c) debt Official enterprises enterprises official debt
1969 n.a. 1638 n.a. 3385 327 n.a. n.a. 1585 19121970 n.n. 2019 n.a. 3655 98 n.a. n.a. 1976 20741971 n.a. 2989 n.a. 4589 -680 n.a. n.a. 2801 21211972 n.n. 4027 n.a. 5524 -2267 n.a. n.a. 3813 15461973 n.a. 3997 n.a. 5347 -2898 n.a. n.a. 3636 7381974 n.a. 3832 n.a. 4995 -2397 n.a. n.a. 3580 11831975 n.a. 4636 n.a. 5970 -2159 n.a. n.a. 4258 20991976 313 4575 n.a. 5978 -1717 83 4033 4116 23991977 366 5487 n.a. 7812 -1018 113 4793 4906 38881978 367 5905 n.a. 10133 974 92 5089 5181 61551979 427 6911 n.a. 12651 1828 175 5927 6102 79301980 1440 7811 7184 13498 -25 950 5939 6888 68631981 1854 10403 6820 15219 -911 1350 8114 9464 85531982 3266 18658 9260 24350 -835 2682 14699 17382 165471983 4097 28209 14207 35891 -3073 3412 23045 26457 233841984 6270 35228 17780 44101 -3546 5694 27746 33439 298931985 11564 52590 29864 67473 1260 10374 39575 49948 512081986 20481 69099 42417 92550 10170 18004 46737 65374 755441987 26943 77055 49951 107417 12404 23266 50467 73734 861381988 36300 89994 56864 123122 12499 31071 52679 83749 962481989 51797 109880 64847 146717 15750 43704 57845 101548 117298
~1990 63798 123328 71967 162770 16802 53341 61611 114952 131754 l:::
~1991 76517 137387 75400 179251 17366 66116 59301 125416 142782 2i1992 84349 145995 78802 191268 22858 70742 59965 130707 153565 ~1993 87368 148988 94062 208420 38469 71173 57678
",-
128851 167320 ~1994 90717 143454 94911 205927 41151 71878 50208 122086 163237 ...~
1995 98780 146174 101277 222576 56159 77908 46417 124325 180484 00';:3
tv t:::1~IJJ
Sce footnotes cnd Tablc 5c. ~-

I'J TABLE lib. COMPOSITION OF FOREIGN DEBT - INSTITUTIONAL SECTOR, 1969 TO 1995 ;J:.+>- ;;::
Per Cent of Total ~;:;~
Official Non-official ~-
61C'wealth State Total Private Private Total ~govern- govern- official Public trading financial Direct private 60'
;:s
30 June ment ments (a) sector enterprises enterprises enterprises investment sector Banks (b) ??~
1969 51.6 0.0 51.6 n.a. n.a. n.a. n.a. n.a. n.a. ...1970 44.8 0.0 44.8 n.a. n.a. n.a. n.a. n.a. n.a.1971 34.9 0.0 34.9 n.a. n.a. n.a. n.a. n.a. n.a.1972 27.1 0.0 27.1 n.a. n.a. n.a. n.a. n.a. n.a.1973 25.2 0.0 25.2 n.a. n.a. n.a. n.a. n.a. n.a.1974 23.3 0.0 23.3 n.a. n.a. n.a. n.a. n.a. n.a.1975 22.3 0.0 22.3 n.a. n.a. n.a. n.a. n.a. n.a.1976 23.5 0.0 23.5 n.a. n.a. n.a. 30.5 n.a. n.a.1977 29.8 0.0 29.8 n.a. n.a. n.a. 24.6 n.a. n.a.1978 41.7 0.0 41.7 n.a. 48.9 n.a. 19.8 n.a. n.a.1979 45.4 0.0 45.4 n.a. 44.3 n.a. 18.0 n.a. n.a.1980 42.1 0.0 42.1 11.1 37.7 9.0 16.8 46.8 n.a.1981 31.6 0.0 31.6 13.2 45.0 10.2 17.7 55.2 5.11982 23.4 0.0 23.4 14.7 50.7 11.2 15.8 62.0 4.41983 21.4 0.0 21.4 18.2 50.9 9.5 12.3 60.4 4.11984 19.4 0.8 20.1 20.2 48.2 11.5 12.2 59.7 4.11985 19.2 2.8 22.1 22.2 42.3 13.4 10.7 55.7 6.11986 21.1 4.2 25.3 20.5 37.9 16.2 9.6 54.1 11.71987 22.0 6.2 28.3 18.2 35.0 18.5 9.9 53.5 14.71988 18.6 8.3 26.9 19.3 33.3 20.6 10.6 53.8 16.31989 12.7 12.4 25.1 19.1 31.8 24.0 11.5 55.8 19.51990 12.1 12.2 24.2 20.0 29.0 26.8 11.7 55.8 21.71991 9.7 13.6 23.4 18.7 26.5 31.4 11.1 57.9 24.81992 8.8 14.9 23.7 17.5 25.7 33.1 11.6 58.8 26.71993 10.3 18.2 28.5 16.6 24.0 30.9 10.7 54.9 26.61994 11.1 19.2 30.3 15.8 21.1 32.8 10.6 53.9 29.71995 12.5 21.8 34.3 11.2 17.4 37.1 9.4 54.5 25.7

TABLE 5b. COMPOSITION OF FOREIGN DEBT - INSTITUTIONAL SECTOR, 1969 TO 1995 (continued)
Per Cent of Total
Non-oflicial (Cont'd) Net foreign debt
Financial Total Total 'rotal gross Total Total netEnter- non- public foreign Financial 'I'rading non- foreign
30 June prises (u) official sector (c) debt Official enterprises enterprises official debt
1969 n.a. 48.4 n.a. 100.0 17.1 n.a. n.a. 82.9 100.01970 n.a. 55.2 n.a. 100.0 4.7 n.a. n.a. 95.3 100.01971 n.a. 65.1 n.a. 100.0 -32.1 n.a. n.a. 132.1 100.01972 n.a. 72.9 n.a. 100.0 -146.6 n.a. n.a. 246.6 100.01973 n.a. 74.8 n.a. 100.0 -392.7 n.a. n.a. 492.7 100.01974 n.a. 76.7 n.a. 100.0 -202.6 n.a. n.a. 302.6 100.01975 n.a. 77.7 n.a. 100.0 -102.9 n.a. n.a. 202.9 100.01976 5.2 76.5 n.a. 100.0 -71.6 3.5 168.1 171.6 100.01977 4.7 70.2 n.a. 100.0 -26.2 2.9 123.3 126.2 100.01978 3.6 58.3 n.a. 100.0 15.8 1.5 82.7 84.2 100.01979 3.4 54.6 n.a. 100.0 23.1 2.2 74.7 76.9 100.01980 10.7 57.9 53.2 100.0 -0,4 13.8 86.5 100,4 100.01981 12.2 68,4 44.8 100.0 -10.7 15.8 94.9 110.7 100.01982 13,4 76.6 38.0 100.0 -5.0 16.2 88.8 105.0 100.01983 11,4 78.6 39.6 100.0 -13.1 14.6 98.6 113.1 100.01984 14.2 79.9 40.3 100.0 -11.9 19.0 92.8 111.9 100.01985 17.1 77.9 44.3 100.0 2.5 20.3 77.3 97.5 100.01986 22.1 74.7 45.8 100.0 13.5 23.8 61.9 86.5 100.01987 25.1 71.7 46.5 100.0 14,4 27.0 58.6 85.6 100.01988 29.5 73.1 46.2 100.0 13.0 32.3 54.7 87.0 100.01989 35.3 74.9 44.2 100.0 13.4 37.3 49.3 86.6 100.0 ~1990 39.2 75.8 44.2 100.0 12.8 40.5 46.8 87.2 100.0 ;;:
~
1991 42.7 76.6 42.1 100.0 12.2 46.3 41.5 87.8 100.0 ~"-
1992 44.1 76.3 41.2 100.0 14.9 46.1 39.0 85.1 100.0 is'...,-1993 41.9 71.5 45.1 100.0 23.0 42.5 34.5 77.0 100.0 ~1994 44.1 69.7 46.1 100.0 25.2 44.0 30.8 74.8 100.0 ....
t'l>
1995 41.4 65.7 45.5 100.0 31.1 43.2 25.7 68.9 100.0 QQ';:::s
tv \::lt'l>
VI ~....See footnotes end Table Gc.

1-.) TABLE 5c. COMPOSITION OF FOREIGN DEBT - INSTITUTIONAL SECTOR, 1969 TO 1995 ~0\
Per Cent of GDP S;::;
Non-official --Oflicial -.~",-
C'wealth State 'rotal Private Private Total ~official Public trading financial Direct private ....govern- govern- ~
00'30 June ment ments (a) sector enterprises enterprises enterprises investment sector Banks (l» ::::l
tJ1969 6.1 0.0 6.1 n.a. n.a. n.a. n.a. n.a. n.a. ~
c::::-1970 5.1 0.0 5.1 -n.a. n.a. n.a. n.a. n.a. n.a.1971 4.6 0.0 4.6 n.a. n.a. n.a. n.a. n.a. n.a.1972 3.8 0.0 3.8 n.a. n.a. n.a. n.a. n.a. n.a.1973 3.0 0.0 3.0 n.a. n.a. n.a. n.a. n.a. n.a.1974 2.2 0.0 2.2 n.a. n.a. n.a. n.a. n.a. n.a.1975 2.1 0.0 2.1 n.a. n.a. n.a. n.a. n.a. n.a.1976 1.8 0.0 1.8 n.a. n.a. n.a. 2.4 n.a. n.a.1977 2.7 0.0 2.7 n.a. n.a. n.a. 2.2 n.a. n.a.1978 4.4 0.0 4.4 n.a. 5.2 n.a. 2.1 n.a. n.a.1979 5.3 0.0 5.3 n.a. 5.2 n.a. 2.1 n.a. n.a.1980 4.6 0.0 4.6 1.2 4.1 1.0 1.8 5.1 n.a.1981 3.4 0.0 3.4 1.4 4.9 1.1 1.9 6.0 0.51982 3.6 0.0 3.6 2.2 7.8 1.7 2.4 9.5 0.71983 4.5 0.0 4.5 3.8 10.6 2.0 2.6 12.6 0.91984 4.4 0.2 4.5 4.5 10.8 2.6 2.8 13.4 0.91985 6.0 0.9 6.9 6.9 13.2 4.2 3.3 17.3 1.91986 8.1 1.6 9.7 7.9 14.5 6.2 3.7 20.8 4.51987 8.9 2.5 11.5 7.4 14.2 7.5 4.0 21.7 6.01988 7.6 3.4 11.1 7.9 13.7 8.4 4.3 22.1 6.71989 5.5 5.4 10.8 8.2 13.7 10.4 5.0 24.1 8.41990 5.3 5.3 10.6 8.8 12.7 11.7 5.1 24.5 9.51991 4.6 6.5 11.1 8.9 12.6 14.9 5.3 27.5 11.71992 4.4 7.4 11.7 8.7 12.7 16.4 5.7 29.1 13.21993 5.3 9.4 14.8 8.6 12.4 16.0 5.5 28.4 13.81994 5.4 9.3 14.6 7.6 10.2 15.8 5.1 26.0 14.41995 6.2 10.7 16.8 5.5 8.5 18.2 4.6 26.7 12.6

TABLE 5c. COMPOSITION OF FOREIGN DEBT - INSTITUTIONAL SECTOR, 1969 TO 1995 (continued)
Per Cent of GDPNon-official (Cont'd) Net foreign debt
Financial Total Total Total gross Total Total netEnter- non- public foreign Financial Trading non- foreign
30 June prises (IJ) official sector (c) debt Official enterprises enterprises official debt
1969 n.a. 5.7 n.a. 11.8 1.1 n.a. n.a. 5.5 6.71970 n.a. 6.3 n.a. 11.5 0.3 n.a. n.a. 6.2 6.51971 n.a. 8.5 n.a. 13.1 -1.9 n.a. n.a. 8.0 6.01972 n.a. 10.2 n.a. 14.1 -5.8 n.a. n.a. 9.7 3.91973 n.a. 8.9 n.a. 11.9 -6.5 n.a. n.a. 8.1 1.61974 n.a. 7.1 n.a. 9.3 -4.5 n.a. n.a. 6.7 2.21975 n.a. 7.2 n.a. 9.2 -3.3 n.a. n.a. 6.6 3.21976 0.4 6.0 n.a. 7.8 -2.2 0.1 5.3 5.4 3.11977 0.4 6.3 n.a. 8.9 -1.2 0.1 5.5 5.6 4.41978 0.4 6.2 n.a. 10.6 1.0 0.1 5.3 5.4 6.51979 0.4 6.4 n.a. 11.7 1.7 0.2 5.5 5.6 . 7.31980 1.2 6.3 5.8 10.9 0.0 0.8 4.8 5.6 5.61981 1.3 7.4 4.9 10.8 -0.6 1.0 5.8 6.7 6.11982 2.1 11.8 5.8 15.3 -0.5 1.7 9.3 11.0 10.41983 2.4 16.4 8.2 20.8 -1.8 2.0 13.4 15.3 13.61984 3.2 18.0 9.1 22.5 -1.8 2.9 14.2 17.1 15.31985 5.3 24.2 13.8 31.1 0.6 4.8 18.2 23.0 23.61986 8.5 28.7 17.6 38.4 4.2 7.5 19.4 27.1 31.31987 10.2 29.1 18.8 40.5 4.7 8.8 19.0 27.8 32.51988 12.1 30.0 19.0 41.1 4.2 10.4 17.6 28.0 32.11989 15.2 32.3 19.1 43.2 4.6 12.9 17.0 29.9 34.51990 17.2 33.2 19.4 43.9 4.5 14.4 16.6 3~.0 35.5 ~
l::1991 20.2 36.3 19.9 47.4 4.6 17.5 15.7 33.2 37.8 ~
1992 21.8 37.8 20.4 49.5 5.9 18.3 15.5 33.9 39.8 21~1993 21.7 37.0 23.3 51.7 9.5 17.7 14.3 32.0 41.5 ",,'
1994 21.3 33.6 22.3 48.3 9.6 16.9 11.8 28.6 38.3 ~1995 21.8 32.2 22.3 49.1 12.4 17.2 10.2 27.4 39.8 ~
00';:::
(a) Prior to 1983-84, State governments were not permitted to borrow from overseas. t:::ltv "'-J (b) Public and private.<:::--
(c) Official and non-official.
n.a. Not available
Australia's Foreign Debt
Stategovernments
22%
Public tradingenterprises
4%
C'wealth
enterprises79c
Public financialPrivate trading
enterprises17%
Figure 7. Composition of Foreign Debt byInstitutional Sector - % of Gross Foreign Debt
At 30 June 1995
Private flnancialenterprises
37%
Figure 8. Composition of Foreign Debt byInstitutional Sector - %of Gross Foreign Debt
At 30 June
00 ~ C'l ~ "<:!' In ~ t- o:J :;-, "'"' :"l C"? "<:!' L~
o:J o:J o:J 0::> 0::> o:J o:J o:J o:J o:J 3')~
:;) 0) C) 0)0') 0') 0') 0') 0') O'l O'l :;) 0) :;) :;) :;) :;:") O'l O'l~ ~ ~ ~ ~ ~ ~ ..... ..... ..... ..... ~ ~
100
80...,..Q
Q)
'"0
& 60....Q)~
<Btiltil0 406D.....0
~20
mOfficial 13 Public enterprises o Private enterprises
28

Australia's Foreign Debt
Composition of Foreign Debt by Currency
Concepts
Loans in foreign currencies are converted to Australian dollars at the mid-rate applying onthe last day of the period.
Comments
The proportion of Australia's foreign debt denominated in Australian dollars has increasedsubstantially over the past 14 years, and at June 1995 equalled 47.1 per cent. Of the rest,the largest, but declining share is expressed in United States dollars. The next largest isJapanese Yen. Small proportions of Swiss Francs, Pounds Sterling, Deutsche Marks andother currencies are also recorded.
The currency in which the debt is expressed is important in analysing the effects ofexchange rate movements on the level of foreign debt. A decline in the SA with respect toanother currency will increase the SA value of the debt denominated in that currency.Conversely, an increase in the SA with respect to another currency will reduce the SA valueof the debt denominated in that currency.
The higher the proportion of Australia's foreign debt that is denominated in Australiandollars therefore, the less significant will be the impact of exchange rate movements on thelevel of that debt
Details: Table 6 and Figure 9.
29

TABLE 6. COMPOSITION OF GROSS FOREIGN DEBT - CURRENCY, 1981 TO 1995v) :t>-o ;:;:
~
30 June 1981 1982 1983 1984 1985 1986 1987 1988 1989 1990 1991 1992 1993 1994 1995 2l--.~",'
$ Million (In Australian Dollar Terms) ~
Australian Dollars 2198 3127 5395 7278 12782 21543 26601 39934 56043 69476 74868 78528 82972 85617 104891 ~00';::I
U.S. Dollars 7874 13609 20220 26085 37192 45715 52451 44104 59416 58200 63410 78593 91927 84758 81353 0'"Pounds Sterling 497 748 1228 1435 1836 3032 3846 4630 4356 3197 2743 2899 2102 2173 2186 I:::-...
Swiss Francs 973 1869 2356 2570 4023 5380 5212 5267 4526 4816 4113 3511 2917 3047 2655Deutsche Marks 1384 1664 2017 1816 2187 3604 3932 2848 2852 3350 2523 1984 1485 1451 2379Japanese Yen 1066 1196 1726 1585 4924 9148 9997 12646 11596 13155 16603 15605 17902 19435 21036Other 1172 1965 2950 3332 4529 4128 5379 13692 8350 10943 14564 10148 9115 9446 8077
Foreign currency 12966 21051 30497 36823 54691 71007 80816 83187 91096 93661 103956 112739 125448 120310 117686
'rOTAL 15164 24178 35891 44101 67473 92550 107417 123122 147139 163137 178824 191268 208420 205927 222576
Per Cent of Total
Australian Dollars 14.5 12.9 15.0 16.5 18.9 23.3 24.8 32.4 38.1 42.6 41.9 41.1 39.8 41.6 47.1U.S. Dollars 51.9 56.3 56.3 59.1 55.1 49.4 48.8 35.8 40.4 35.7 35.5 41.1 44.1 41.2 36.6Pounds Sterling 3.3 3.1 3.4 3.3 2.7 3.3 3.6 3.8 3.0 2.0 1.5 1.5 1.0 1.1 1.0Swiss Francs 6.4 7.7 6.6 5.8 6.0 5.8 4.9 4.3 3.1 3.0 2.3 1.8 1.4 1.5 1.2Deutsche Marks 9.1 6.9 5.6 4.1 3.2 3.9 3.7 2.3 1.9 2.1 1.4 1.0 0.7 0.7 1.1Japanese Yen 7.0 4.9 4.8 3.6 7.3 9.9 9.3 10.3 7.9 8.1 9.3 8.2 8.6 9.4 9.5Other 7.7 8.1 8.2 7.6 6.7 4.5 5.0 11.1 5.7 6.7 8.1 5.3 4.4 4.6 3.6
Foreign currency 85.5 87.1 85.0 83.5 81.1 76.7 75.2 67.6 61.9 57.4 58.1 58.9 60.2 58.4 52.9TOTAL 100.0 100.0 100.0 100.0 100.0 100.0 100.0 100.0 100.0 100.0 100.0 100.0 100.0 100.0 100.0

Australia's Foreign Debt
Figure 9. Composition of Foreign Debt by Currency % of Gross Foreign Debt Denominated in $A
At 30 June50
45
40
-+-"35...::l
0-0
c:: 30b.o"8...<£ 25rfJrfJ0 205b....0
~ 15
10
5
0.-I C'l "" -.::l' 1.':> ~ t- o:> ~ 0 ,..; C'l M ~ L':>0:> 0:> 0:> 0:> 0:> 0:> 0:> 0:> 0:> 0') 0') ~ ~ 0') 0')~ ~ ~ ~ ~ ~ ~ 0') ~ 0') 0') ~ ~ 0') 0').-I .-I .-I .-I .-I .-I .-I .-l .-I .-I .-I ,..; .-l ,..; .-I
:i 1

Australia's Foreign Debt
Composition of Foreign Debt by Country
Concepts
COl/nn)' refers to the foreign creditor. International capital markets such as the Eurobondmarket cannot be sub-divided by country. Similarly, international institutions cannot beclassified to one country.
Domicile refers to the country of issue of the loan. For example, if foreigners buyAustralian bonds in Australia, the loan is part of Australia's foreign debt but domiciled inAustralia. Debt domiciled in Australia is typically denominated in $A. Debt domiciledabroad is actually raised overseas.
Comments
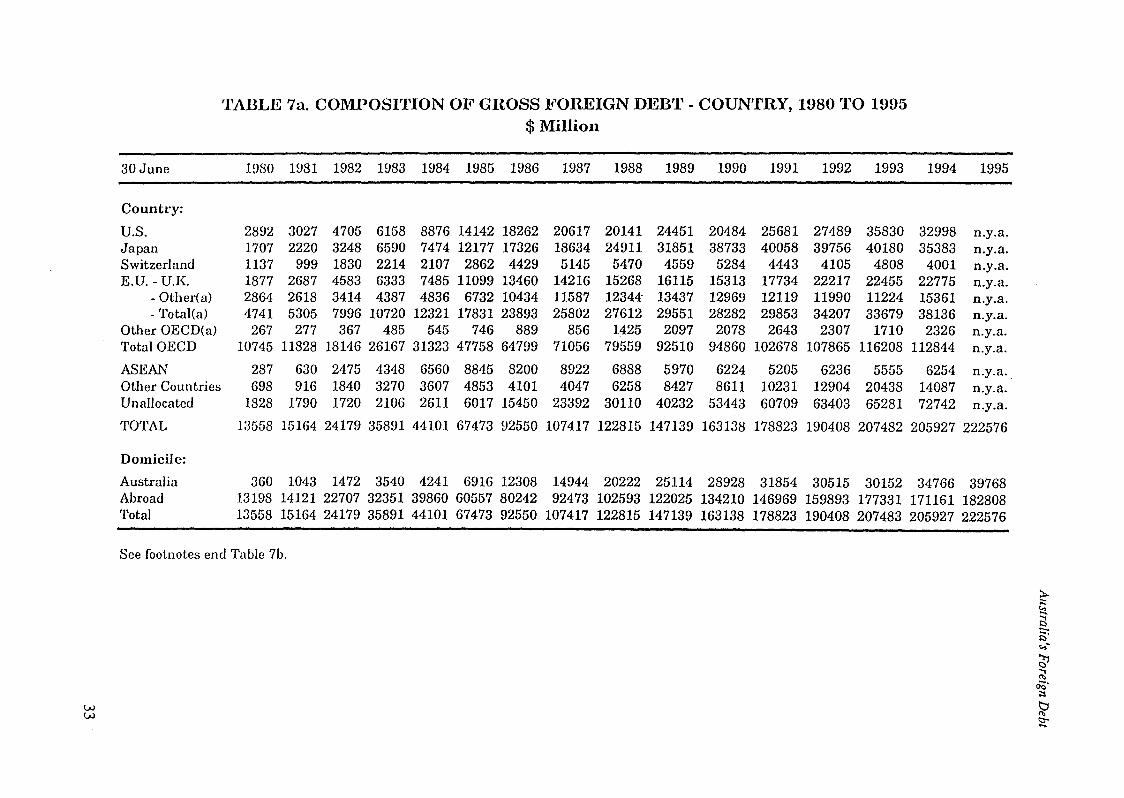
The most important creditor countries for Australia in terms of total debt are Japan, theUnited States and the United Kingdom, representing 17.2,16.0 and 11.1 per cent of grossforeign debt respectively at June 1994. 'Unallocated' (principally international capitalmarkets) has grown rapidly during the past decade and now accounts for over a third of alldebt. About 55 per cent of debt is owed to residents of OEeD countries.
The United States, United Kingdom and Japan have consistently been the most importantcreditor countries, but during the 1980s Japan increased its relative importance while theother two have declined. Japan's significance as a creditor nation however, has fallensteadily since 1990 with the result that Japan is now only marginally ahead of the UnitedStates.
The proportion of borrowing domiciled in Australia rose sharply during the 1980s,suggesting that foreigners entered the Australian domestic market, attracted by its opennessand high interest rates.
Details: Tables 7a and 7b and Figure 10.
32
ww
TABLE 7a. COMI>OSrrION OF GROSS FOREIGN DEBT - COUNTRY, 1980 TO 1995$ Million
30 June 1980 1981 1982 1983 1984 1985 1986 1987 1988 1989 1990 1991 1992 1993 1994 1995
Country:
U.S. 2892 3027 4705 6158 8876 14142 18262 20617 20141 24451 20484 25681 27489 35830 32998 n.y.a.Japan 1707 2220 3248 6590 7474 12177 17326 18634 24911 31851 38733 40058 39756 40180 35383 n.y.a.Switzerland 1137 999 1830 2214 2107 2862 4429 5145 5470 4559 5284 4443 4105 4808 4001 n.y.a.E.U. - D.E:. 1877 2687 4583 6333 7485 11099 13460 14216 15268 16115 15313 17734 22217 22455 22775 n.y.a.
- Other(a) 2864 2618 3414 4387 4836 6732 10434 11587 12344- 13437 12969 12119 11990 11224 15361 n.y.a.- Total(a) 4741 5305 7996 10720 12321 17831 23893 25802 27612 29551 28282 29853 34207 33679 38136 n.y.a.
Other OECD(a) 267 277 367 485 545 746 889 856 1425 2097 2078 2643 2307 1710 2326 n.y.a.TotalOECD 10745 11828 18146 26167 31323 47758 64799 71056 79559 92510 94860 102678 107865 116208 112844 n.y.a.
ASEAN 287 630 2475 4348 6560 8845 8200 8922 6888 5970 6224 5205 6236 5555 6254 n.y.a..Other Countries 698 916 1840 3270 3607 4853 4101 4047 6258 8427 8611 10231 12904 20438 14087 n.y.a.Unallocated 1828 1790 1720 2106 2611 6017 15450 23392 30110 40232 53443 60709 63403 65281 72742 n.y.a.TOTAL 13558 15164 24179 35891 44101 67473 92550 107417 122815 147139 163138 178823 190408 207482 205927 222576
Domicile:
Australia 360 1043 1472 3540 4241 6916 12308 14944 20222 25114 28928 31854 30515 30152 34766 39768Abroad 13198 14121 22707 32351 39860 60557 80242 92473 102593 122025 134210 146969 159893 177331 171161 182808Total 13558 15164 24179 35891 44101 67473 92550 107417 122815 147139 163138 178823 190408 207483 205927 222576
See footnotes end Table 7b.
:t>;;;~
i3~....~61;;:
QQ';:s
~

TABLE 71.>. COMPOSITION OF GROSS FOREIGN DEB'r - COUNTRY, 1980 '1'0 1995!->J Per Cent of Total ~
~ ~-.t:l~
1980 1981 1982 1983 1981 1985 1986 1987 1988 1989 1990 1991 1992 1993 1994 1995",,-
30 June~..,n.0;';:s
Country: i:Jn.1:7-.....
U.S. 21.3 20.0 19.5 17.2 20.1 21.0 19.7 19.2 16.4 16.6 12.6 14.4 14.4 17.3 16.0 n.y.a.Japan 12.6 14.6 13.4 18.4 16.9 18.0 18.7 17.3 20.3 21.6 23.7 22.4 20.9 19.4 17.2 n.y.a.Switzerland 8.4 6.6 7.6 6.2 4.8 4.2 4.8 4.8 4.5 3.1 3.2 2.5 2.2 2.3 1.9 n.y.a.E.U. - U.K 13.8 17.7 19.0 17.6 17.0 16.4 14.5 13.2 12.4 11.0 9.4 9.9 11.7 10.8 11.1 n.y.a.
- Other(a) 21.1 17.3 14.1 12.2 11.0 10.0 11.3 10.8 10.1 9.1 7.9 6.8 6.3 5.4 7.5 n.y.a.- Tota1(a) 35.0 35.0 33.1 29.9 27.9 26.4 25.8 24.0 22.5 20.1 17.3 16.7 18.0 16.2 18.5 n.y.a.
Other OECD(a) 2.0 1.8 1.5 1.4 1.2 1.1 1.0 0.8 1.2 1.4 1.3 1.5 1.2 0.8 1.1 n.y.a.TotalOECD 79.3 78.0 75.0 72.9 71.0 70.8 70.0 66.1 64.8 62.9 58.1 57.4 56.6 56.0 54.8 n.y.a.
ABEAN 2.1 4.2 10.2 12.1 14.9 13.1 8.9 8.3 5.6 4.1 3.8 2.9 3.3 2.7 3.0 n.y.a.Other Countries 5.1 6.0 7.6 9.1 8.2 7.2 4.4 3.8 5.1 5.7 5.3 5.7 6.8 9.9 6.8 n.y.a.Unallocated 13.5 11.8 7.1 5.9 5.9 8.9 16.7 21.8 24.5 27.3 32.8 33.9 33.3 31.5 35.3 n.y.a.
TOTAL 100.0 100.0 100.0 100.0 100.0 100.0 100.0 100.0 100.0 100.0 100.0 100.0 100.0 100.0 100.0 100.0
Domicile:
Australia 2.7 6.9 6.1 9.9 9.6 10.3 13.3 13.9 16.5 17.1 17.7 17.8 16.0 14.5 16.9 17.9Abroad 97.3 93.1 93.9 90.1 90.4 89.7 86.7 86.1 83.5 82.9 82.3 82.2 84.0 85.5 83.1 82.1Total 100.0 100.0 100.0 100.0 100.0 100.0 100.0 100.0 100.0 100.0 100.0 100.0 100.0 100.0 100.0 100.0
(a) Figures not consistent over time due to expanding membership of the European Union (E.U.)
n.y.a. Not yet available
Note: Unallocated includes international organisations and international capital markets.

Australia's Foreign Debt
Figure 10. Composition of Foreign Debt by Country·% of Gross Foreign Debt
At 30 June 1994
Unallocated36%
Other Countries7%
ABEAN3% l' Other EU
Other OECD 7%1%
United States16(l
Japan17%
Switzerland2%
United KingdomlICk
35

Australia's Foreign Debt
Composition of Foreign Debt Domiciled Abroad by Maturity
Concepts
The maturity profile of foreign debt shows the pattern of the periods for which money islent. The maturity period could be shown for the level of debt, repayments or drawings.Data on the level of debt show the period left to repayment, and thus point to liquidityaspects of foreign debt. Data for drawings (Figure 11) represent current decisions, whilerepayments reflect decisions made over a whole range of times when the loans were takenout. Data for drawings give a much greater emphasis to short term loans than data on debtoutstanding.
Some loans are 'at call', or have indefinite maturity.
Maturity of drawings in relation to GDP is shown in the tables to illustrate the increase inthe size of short-term loans in relation to the whole economy.
Comments
Most loans are for very short periods. In terms of drawings in 1994-95,65.0 per cent werefor less than three months and 89.2 per cent were for less than one year. Only half of oneper cent of total drawings were for greater than ten years.
The value of drawings of loans of less than three months has grown from $1b in 1980-81to $408b in 1993-94, falling dramatically to $209b in 1994-95. The value of drawings ofloans for two years or more has increased from $2.5b in 1980-81 to $28b in 1994-95, buthas fallen as a proportion of the total from 40.3 per cent to 8.9 per cent.
In terms of total debt outstanding at June 1995,44.7 per cent was due in less than one year;at June 1981 it was 10.8 per cent.
The level of debt outstanding has grown significantly larger in relation to GOP. Thisgrowth is especially marked for short-term loans, while the proportion of long-term loans inrelation to GOP has risen by much less.
Details: Tables 8 and 9 and Figure 11.
36

TABLE 8. COMPOSITION OJ? Ii'OREIGN DEBT DOMICILED ABROAD - MATURITY OF DRAWINGS1980-81 TO 199'1-95
1980-81 1981-82 1982-83 1983-84 1984-85 1985-86 1986-87 1987-88 1988-89 1989-90 1990-91 1991-92 1992-93 1993-94 1994-95
$ Million
Within 3 months 1067 2314 6206 18005 41130 60213 106992 95852 169042 149990 183015 215547 418013 407531 2085243 months to less than 6 lllonths 833 2756 4037 7252 7919 1107:3 20127 23370 27262 34227 26586 37206 47871 48401 399006 months to less than 1 year 1243 2351 1968 2743 2471 4264 7814 7770 12180 14873 18993 15618 16053 26487 35675At call, less than 1 year 219 429 1716 2327 1765 817 1045 2231 6629 2646 5412 7805 10223 2952 2137Total, less than 1 year 3362 7850 13927 30327 53285 76367 135978 129223 215113 201736 234006 276176 492160 485371 286236
1 year to less Ulan 2 years 165 433 G43 582 921 2837 1648 2907 3622 7402 3725 3892 3319 4514 47772 years to less than 5 years
}2151 {52~:0 11 791 4791 3994 7888 12147· 12809 9299 8400 10530 12784 16971
5 years to less than 10 years 6516 3311 3682 7376 5885 5659 7919 7325 6516 9669 8262 9807 985610 years or more 189 1079 2210 3448 6355 2307 3008 3065 2913 3640 4750 3402 1493At call, 1 year or more 566 820 1826 2528 756 974 3583 3283 2779 1415 2565 2204 5935 3238 1496Total, 1 year or more 2882 6555 9074 7511 8360 19426 21465 22044 29475 32016 25018 27805 32796 33745 34593
Unallocated 250 271 593 318 8684 19556 -10316 -12759 -23222 -4401 1351 -4124 -10173 -15406 -5871
TOTAL 6493 14676 23594 38156 70331 115349 147127 138506 221365 229351 260375 299857 514782 503711 314956
% of Total (excluding unallocated)
Within 3 months 17.1 16.1 27.0 47.6 66.7 62.9 68.0 63.4 69.1 64.2 70.7 70.9 79.6 78.5 65.03 months to less than 6 months 13.3 19.1 17.6 19.2 12.8 11.6 12.8 15.4 11.1 14.6 10.3 12.2 9.1 9.3 12.46 months to less than 1 year 19.9 16.3 8.6 7.2 4.0 4.5 5.0 5.1 5.0 6.4 7.3 5.1 3.1 5.1 11.1At call, less than 1 year 3.5 3.0 7.5 6.1 2.9 0.9 0.7 1.5 2.7 1.1 2.1 2.6 1.9 0.6 0.7Total, less than 1 year 53.9 54.5 60.5 80.1 86.4 79.7 86.4 85.4 87.9 86.3 90.3 90.9 93.8 93.5 89.2
1 year to less than 2 years 2.6 3.0 2.4 1.5 1.5 3.0 1.0 1.9 1.5 3.2 1.4 1.3 0.6 0.9 1.5 ;l:..l::
2 years to less than 5 years } {OO 0.0 0.0 1.3 5.0 2.5 5.2 5.0 5.5 3.6 2.8 2.0 2.5 5.3 ~
i35 years to less than 10 years 34.5 36.5 28.3 8.8 6.0 7.7 3.7 3.7 3.2 3.1 2.5 3.2 1.6 1.9 3.1 -..t:)'
10 years or more 0.3 0.8 2.9 3.6 3.6 4.0 1.5 1.2 1.3 1.1 1.2 0.9 0.7 0.5 ",-
At call, 1 year or more !U 5.7 7.9 6.7 1.2 1.0 2.3 2.2 1.1 0.6 1.0 0.7 1.1 0.6 0.5 61....Total, 1 year or more 46.2 45.5 39.5 19.9 13.6 20.3 13.6 14.6 12.1 13.7 9.7 9.1 6.2 6.5 10.8 "'~.
;:sTOTAL 100.0 100.0 100.0 100.0 100.0 100.0 100.0 100.0 100.0 100.0 100.0 100.0 100.0 100.0 100.0 t:Iw ""-...J s:r
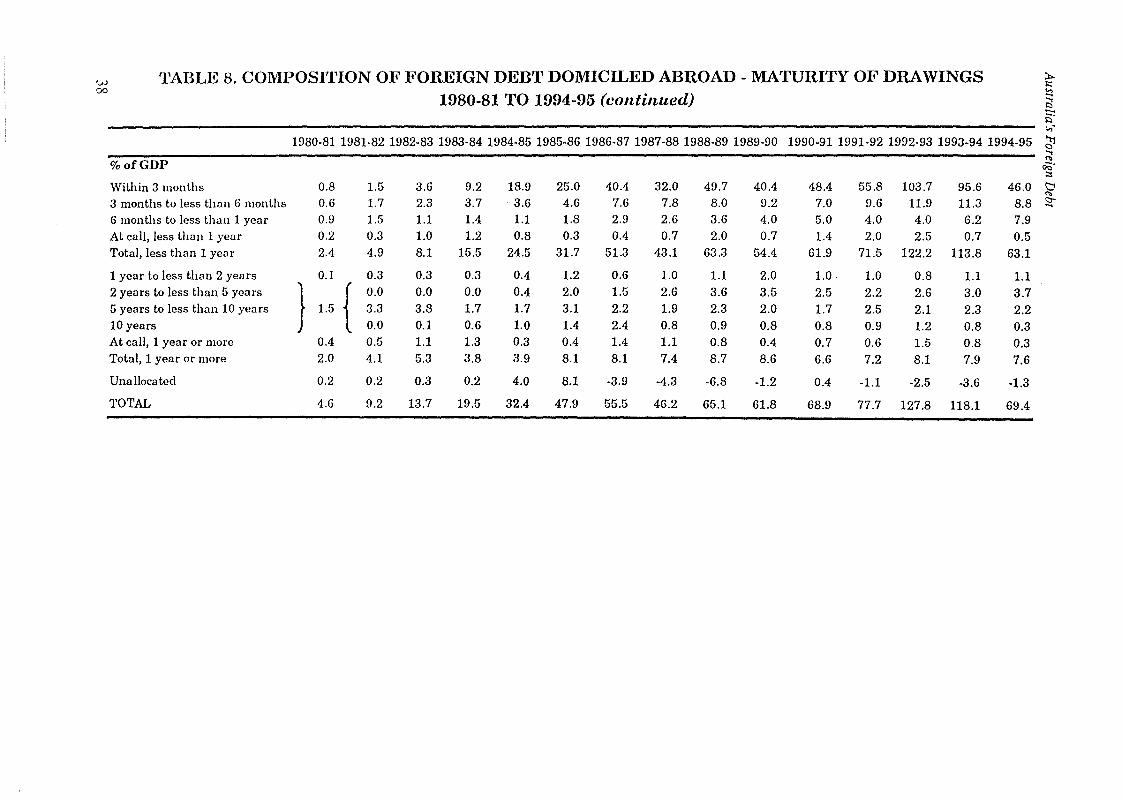
TABLE 8. COMPOSITION 011' FOREIGN DEBT DOMICILED ABROAD - MA'rURITY OF DRAWINGS ~'JJ l:::00 '"1980-81 TO 1994-95 (continued) -r::-i:;'
",-
1980-81 1981-82 1982-83 1983-84 1984-85 1985-86 1986-87 1987-88 1988-89 1989-90 1990-91 1991-92 1992-93 1993-94 1994-95 6J%ofGDP
~00';::
Within 3 months 0.8 1.5 3.6 9.2 18.9 25.0 40.4 32.0 49.7 40.4 48.4 55.8 103.7 95.6 46.0 t:I'"3 months to less than 6 months 0.6 1.7 2.3 3.7 3.6 4.6 7.6 7.8 8.0 9.2 7.0 9.6 11.9 11.3 8.8 ~
6 months to less than 1 year 0.9 1.5 1.1 1.4 1.1 1.8 2.9 2.6 3.6 4.0 5.0 4.0 4.0 6.2 7.9At call, less UWI1 1 year 0.2 0.3 1.0 1.2 0.8 0.3 0.4 0.7 2.0 0.7 1.4 2.0 2.5 0.7 0.5Total, less than 1 year 2.4 4.9 8.1 15.5 24.5 31.7 51.3 43.1 63.3 54.4 61.9 71.5 122.2 113.8 63.1
1 year to less than 2 years 0.1 0.3 0.3 0.3 0.4 1.2 0.6 1.0 1.1 2.0 1.0 1.0 0.8 1.1 1.12 years to less than 5 years }15 {
0.0 0.0 0.0 0.4 2.0 1.5 2.6 3.6 3.5 2.5 2.2 2.6 3.0 3.75 years to less than 10 years 3.3 3.8 1.7 1.7 3.1 2.2 1.9 2.3 2.0 1.7 2.5 2.1 2.3 2.210 years 0.0 0.1 0.6 1.0 1.4 2.4 0.8 0.9 0.8 0.8 0.9 1.2 0.8 0.3At call, 1 year or more 0.4 0.5 1.1 1.3 0.3 0.4 1.4 1.1 0.8 0.4 0.7 0.6 1.5 0.8 0.3Total, 1 year or more 2.0 4.1 5.3 3.8 3.9 8.1 8.1 7.4 8.7 8.6 6.6 7.2 8.1 7.9 7.6
Unallocated 0.2 0.2 0.3 0.2 4.0 8.1 -3.9 -4.3 -6.8 -1.2 0.4 -1.1 -2.5 -3.6 -1.3
TOTAL 4.6 9.2 13.7 19.5 32.4 47.9 55.5 46.2 65.1 61.8 68.9 77.7 127.8 118.1 69.4

TABLE 9. COMPOSITION OF Ii'OREIGN DEBT DOMICILED ABROAD - MATURITY OF DEBT OUTSTANDING,1980-81 TO 1994-95
30 June 1981 1982 1983 1984 1985 1986 1987 1988 1989 1990 1991 1992 1993 1994 1995
$ Million
Less than 1 year 1527 3792 4108 6336 10939 21150 25683 32637 40979 47972 62261 72588 85323 79380 816891 year to less than 2 years 992 1990 1976 2394 4154 3459 6255 5781 11210 10622 10840 12482 13031 12834 141112 years to less than 5 years } {10018 13856 20639 24809 27361 34534 28083 28833 32092 31809 384405 years to less than 10 years 10013 14948 23233 27130 16623 28118 22613 24454 24564 22005 20961 28240 27928 28848 3416310 years or more 11456 10036 10738 8861 9249 7125 6451 5074 5920 4400 5782At call, 1 year or more 1432 1579 2259 2934 4471 3066 6766 6859 5882 7576 11500 11950 11691 11976 9348Total, 1 year or more 12436 18517 27466 32459 46720 58535 67011 70764 78266 81862 77835 86579 90662 89867 101844Unallocated 158 398 777 1065 2898 557 -221 -808 2780 4376 6873 328 1121 1915 -726TOTAL 14121 22707 32351 39860 60557 80242 92473 102593 122025 134210 146970 159493 177105 171161 182808
% of Total (cxcluding unallocatcd)
Less than 1 year 10.8 16.7 12.7 15.9 18.1 26.4 27.8 31.8 33.6 35.7 42.4 45.5 48.2 46.4 44.71 year to less than 2 years 7.0 8.8 6.1 6.0 6.9 4.3 6.8 5.6 9.2 7.9 7.4 7.8 7.4 7.5 7.72 years to less than 5 years } { 16.5 17.3 22.3 24.2 22.4 25.7 19.1 18.1 18.1 18.6 21.05 years to less than 10 years 70.9 65.8 71.8 68.1 27.5 35.0 24.5 23.8 20.1 16.4 14.3 17.7 15.8 16.9 18.710 years or more 18.9 12.5 11.6 8.6 7.6 5.3 4.4 3.2 3.3 2.6 3.2At call, 1 year or more 10.1 7.0 7.0 7.4 7.4 3.8 7.3 6.7 4.8 5.6 7.8 7.5 6.6 7.0 5.1Total, 1 year or more 88.1 81.5 84.9 81.4 77.2 72.9 72.5 69.0 64.1 61.0 53.0 54.3 51.2 52.5 55.7Unallocated 1.1 1.8 2.4 2.7 4.8 0.7 -0.2 -0.8 2.3 3.3 4.7 0.2 0.6 1.1 -0.4TOTAL 100.0 100.0 100.0 100.0 100.0 100.0 100.0 100.0 100.0 100.0 100.0 100.0 100.0 100.0 100.0-
~::::!::l.i3""--.J::l",,'
~~
riQ'w ;:s1.0 tl
til~-

TABLE 9. COMPOSITION OF FOREIGN DEBT DOMICILED ABROAD - MATURITY OF DEBT OUTSTANDING,
:: 1980-81 TO 1994-95 (continued) ;p.
~
30 June 1981 1982 1983 1984 1985 1986 1987 1988 1989 1990 1991 1992 1993 1994 1995 ~-.I::>
%ofGDP",'
6JLess than 1 year 1.1 2.4 2.4 3.2 5.0 8.8 9.7 10.9 12.1 12.9 16.5 18.8 21.2 18.6 18.0 ~.
1 year to less than 2 years 0.7 1.3 1.1 1.2 1.9 1.4 2.4 1.9 3.3 2.9 2.9 3.2 3.2 3.0 3.1;::
02 years to less U,an 5 years }
13.9 {4.6 5.7 7.8 8.3 8.0 9.3 7.4 7.5 8.0 7.5 8.5 ~
5 years to less than 10 years 7.1 9.4 13.5 7.7 11.7 8.5 8.2 7.2 5.9 5.5 7.3 6.9....
6.8 7.510 years or more 5.3 4.2 4.1 3.0 2.7 1.9 1.7 1.3 1.5 1.0 1.3At call, 1 year or more 1.0 1.0 1.3 1.5 2.1 1.3 2.6 2.3 1.7 2.0 3.0 3.1 2.9 2.8 2.1Total, 1 year or more 8.8 11.7 15.9 16.6 21.5 24.3 25.3 23.6 23.0 22.1 20.6 22.4 22.5 21.1 22.5Unallocated 0.1 0.3 0.5 0.5 1.3 0.2 -0.1 -0.3 0.8 1.2 1.8 0.1 0.3 0.4 -0.2TOTAL 10.0 14.3 18.8 20.4 27.9 33.3 34.9 34.2 35.9 36.2 38.9 41.3 44.0 40.1 40.3

:::b.O'0'"'<.9CIlCIlo'"'b.O......o
100
80
60
40
20
o
Australia's Foreign Deht
Figure 11. Composition of Foreign Debt DomiciledAbroad by Maturity, Drawings· %of Gross Foreign Debt
Year ended 30 June
13 Within 3 months 1:33 months to less than 1 year 01 year or more
41

Australia's Foreign Debt
Components of Increase in Gross Foreign Debt
Concepts
There are three components of increase in gross foreign debt identified in the ABS data:
• Net borrowing
• Exchange rate movements
• Other.
Net new borrowing is the difference between drawings and repayments.
Foreign debt data are expressed in Australian dollars, although they are mostlydenominated in foreign currencies. Debt estimates are converted to Australian dollars at theexchange rate applying on the last day of the period. The very substantial movements in theexchange rate of the Australian dollar have had a significant impact on the level of foreigndebt expressed in Australian currency.
Comments
Details: Table 10 and Figure 12.
42

+>.w
TABLE 10. COMPONENTS OF INCREASE IN GROSS FOREIGN DEBT, 1979-80 TO 1994-95$ Million
Net Exchange Total increasenew rate in gross
borrowings variations Other foreign debt
1979-80 1186 -39 -10 11371980-81 2698 -802 -175 17211981-82 8259 845 -44 90601982-83 8954 2613 -170 113971983-84 8072 -6 74 81401984-85 12696 10212 360 232681985-86 16459 6005 2113 245771986-87 14585 -1672 740 136531987-88 20126 -4767 28 153871988-89 20883 1112 1309 233041989-90 18325 -1285 -1544 154961990-91 12131 2387 1169 156871991-92 9389 4821 -2193 120171992-93 7641 9399 113 171531993-94 7508 -6239 -3762 -24931994-95 10139 5624 886 16649
)..l:::~
~
i5=",,-
~~oQ.;::s
~~

Australia's Foreign Debt
Figure 12. Components of Increase in Gross ForeignDebt· $ Million
Year ended 30 June25000 25000
20000 20000
15000 15000
:::: 10000 100000........................:::....
5000 5000w
0 0
-5000 -5000
-10000 -100000 ...-l C'l ~ 'd' 1.." ~ 1:'- 00 0') 0 ...-l C'l ~ 'd' 1.000 ex> 00 00 00 00 00 00 00 00 0') 0') 0') 0') 0') 0')0') 0') 0') 0') 0') 0') 0') 0') 0') 0') 0') 0') 0') 0') 0') 0')...-l ...-l ...-l ...-l ...-t ...-t ...-l ...-l ...-l ...-l ...-l ...-l ...-l ...-l ...-l ...-l
c:::J Net new borrowings IwqwZl Exchange rate variations
_Other -Total increase

Australia's Foreign Debt
Composition of Foreign Investment - Debt and Equities
Concepts
Borrowing is only one kind of capital inflow. Another is investment in ownership ofAustralian assets including shares, property and retained eamings of foreign ownedcompanies. Trade credit (e.g. money owed by importers) is another category of capitalinflow but is relatively small.
The current account deficit is often regarded as directly causing our foreign debt. Thecomplexity of the relationship however, should be noted:
• Exchange rate movements have caused large variations in our foreign debt. As currentaccount deficits influence exchange rates, there is also an indirect influence of currentaccount deficits on tlle level of debt
• The capital account in the Balance of Payments statistics shows capital inflows andoutflows, including lending, borrowing and other investment Conceptually, any deficiton the current account is met by a surplus on the capital account.
• As noted above, borrowing is not the only kind of capital inflow. Some of the currentaccount deficit is funded by other forms of capital inflow.
Comments
For most of the years to 1983, foreign investment in Australia was mainly in the form ofequities. From 1983 however, that situation reversed and for the years that followed grossforeign debt accounted for more than half, often more than 60 per cent, of total foreigninvestment. The share of foreign investment that is attributed to debt has fallen somewhat inthe last couple of years and at June 1995 it was 56.3 per cent.
Details: Table 11 and Figure 13.
45

'fABLE 11. FOREIGN INVESTMENrr IN AUSTRALIA - LEVELS, 1969 TO 1995+.>.
~0\ $ million % of foreign investment % ofGDP ;;:::~
Gross Total Gross Gross Total i2lforeign Equity and foreign foreign Equity and foreign Equity and foreign ~..,-
30 June debt other investment debt other debt other investment 6J27.3
.....1969 3385 4468 7853 43.1 56.9 1l.8 15.6 '"0<;'1970 3655 4821 8476 4:3.1 56.9 11.5 15.2 26.6 ~
1971 4589 5035 9624 47.7 52.3 13.1 14.3 27.4 t::J'"~1972 5521 5261 10788 51.2 48.8 14.1 13.4 27.5 .....
1973 5347 5242 10589 50.5 49.5 11.9 11.7 23.61974 4995 5455 10450 47.8 52.2 9.3 10.2 19.51975 5970 5747 11717 51.0 49.0 9.2 8.9 18.11976 5978 6969 12947 46.2 53.8 7.8 9.1 16.91977 7812 7632 15444 50.6 49.4 8.9 8.7 17.61978 10133 8689 18822 53.8 46.2 10.6 9.1 19.71979 12651 9935 22586 56.0 44.0 11.7 9.2 20.81980 13498 26383 39881 33.8 66.2 10.9 21.4 32.31981 15219 31567 46786 32.5 67.5 10.8 22.4 33.31982 24350 30745 55095 44.2 55.8 15.3 19.4 34.71983 35891 35044 70935 50.6 49.4 20.8 20.3 41.11984 44101 37772 81873 53.9 46.1 22.5 19.3 41.81985 67473 44145 111618 60.4 39.6 31.1 20.3 51.41986 92550 48037 140587 65.8 34.2 38.4 19.9 58.31987 107417 72727 180144 59.6 40.4 40.5 27.4 68.01988 123122 77670 200792 61.3 38.7 41.1 25.9 67.01989 146717 94815 241532 60.7 39.3 43.2 27.9 71.11990 162770 103771 266541 61.1 38.9 43.9 28.0 71.81991 179251 111794 291045 61.6 38.4 47.4 29.6 77.01992 191268 117707 308975 61.9 38.1 49.5 30.5 80.01993 208420 128966 337386 61.8 38.2 51.7 32.0 83.71994 205927 164335 370262 55.6 44.4 48.3 38.5 86.81995 222576 172742 395318 56.3 43.7 49.1 38.1 87.2
Note: Before 1980 corporate equities measured at paid-up value. 1980 and after corporate equities measured at market value.'Other' includes shares, interest in branches and reinvested earnings.

AUSTralia's Foreign Deb!
Figure 13. Composition of Foreign Investment Debt and Equity - Per Cent of GDP
At 30 June90
80
70
60
~ 50~Ci'-0 40~
30
20
10
0C)~0).-I
o Equity mDebt
.+7

Australia's Foreign Debt
Net Lending or Borrowing by Sector
Concepts
A current account deficit can be seen as an imbalance between international transactions.More fundamentally, it can be seen as an outcome of the imbalance between incomes andexpenditure by the total of all households, businesses and governments in the economy -.lre spend too much and save too little. Obviously, when the aggregate of all decisions is tospend more than is available, the gap in supply can only be met from overseas goods andservices and the gap in funding can only be met from overseas savings.
This perspective is useful for understanding the causes and solutions of Australia's currentaccount deficit and foreign debt. Consider the following situations:
• Governments increase their spending or reduce their taxation. There are no offsettingincreases in output or reductions in spending by other sectors. The government borrowsmore funds from the domestic market. Business borrowers are forced offshore. In thisscenario, to blame business for the foreign debt is to confuse causes and symptoms.(This case resembles Australia in the mid 1980s.)
• Household spending rises more than income, so savings decline as a proportion ofincome. Australian fmancial institutions have less money to lend to business. Somebusinesses raise money overseas. Financial institutions also borrow offshore to re-lend tobusinesses and households. In this scenario, households are the cause, businessborrowings abroad are the symptom. (This case resembles Australia in the late 1980s.)
This section examines the net lending or borrowing of different sectors of the economy.These are shown in the Australian National Accounts, in the capital accounts for eachsector. Adding together the net lending or borrowing for each domestic sector gives the netrequirement for lending or borrowing by the whole economy. Net lending from overseas isalmost the same as the current account deficit. (There is a small divergence due to differenttreatments of retained profits of foreign-owned businesses, which is small in relation to thetotal current account deficit.)
Conceptually, borrowing and lending should be equal, but they differ in practice because ofthe variety of data sources used and data collection problems.
Comments
In Australia, the economy as a whole, State and Commonwealth Governments andbusinesses have generally been net borrowers, while households and overseas havegenerally been net lenders. The Commonwealth Government became a net lender in 198788 after many years as a borrower, but became a borrower again in 1991-92. Businesseshave always been net borrowers, except in 1993-94, when they became net lenders.
48

Australia's Foreign Debt
Through the 1970s, in net terms Australia typically borrowed funds from overseas with avalue of around one or two per cent of GDP. In the 1980s this rose to around five per cent,peaking at 6.0 per cent in 1985-86; in 1993-94 net borrowing from overseas equalled 3.5per cent of GDP.
The first surge in foreign borrowing occurred in 1980-81 and 1981-82. The increase wascaused by the business sector, and was the result of large increases in investment associatedwith the 'resources boom'. This coincided with relatively low levels of lending by thehousehold sector and increased borrowing by the State and local government sector,especially their trading enterprises.
The business sector's demand for funds fell substantially after 1981-82, but this was offsetby increased borrowing by the Commonwealth Government, especially generalgovernment
In the second half of the 1980s, despite significant reductions in demand from governments,high current account deficits continued and in 1988-89 foreign borrowing rose again. Thiswas due to an increase in demand by business (to fUl)d investment), and lower levels ofsaving by households.
Foreign borrowing fell in 1990-91 and 1991-92 as a result of the slowdown in economicactivity and associated fall in the current account deficit From 1992-93 foreign borrowingrose again as the economy improved and the current account once more came underpressure.
Details: Table 12.
49

'J' TABLE 12. NET LENDING OR BORROWING BY SECTOR, 1976-77 TO 1993-94 ;:,..:::;)
~Per Cent of GDP t:i~r-,•
Privute C'weaIth State and 'l'otal State Households Total Net ~corporate public local public corporate Private Public C'weaIth and local and domestic lending ~
00'trading trading trading trading financial financial general general unincorp. borrowing from Statistical ;:s
0enterprises enterprises enterprises enterprises enterprises enterprises gOy't gOy't enterprises requirement overseas discrepancy l't>~-1976-77 -1.6 -0.5 -1.5 -3.6 0.1 0.0 -1.3 -0.6 2.2 -3.2 -2.2 -1.0
1977-78 -1.3 -0.3 -1. 7 -3.2 -0.2 -0.1 -2.0 -0.6 3.2 -2.9 -2.5 -0.41978-79 -1.0 -1.1 -1.9 -3.9 0.1 -0.1 -2.3 -0.6 3.2 -3.6 -2.7 -0.91979-80 -0.7 -0.2 -1.8 -2.7 0.0 -0.1 -0.9 -0.5 2.0 -2.2 -1.0 -1.21980-81 -2.0 -0.1 -2.0 -4.0 -0.2 -0.1 -0.2 -0.7 1.3 -4.0 -3.4 -0.51981-82 -4.0 -0.7 -2.6 -7.4 -0.4 -0.3 0.2 -0.7 1.5 -6.9 -5.4 -1.51982-83 -2.3 -0.2 -2.9 -5.3 -0.4 -0.2 -1.9 -0.4 3.3 -4.9 -4.2 -0.61983-84 0.1 -0.7 -2.4 -2.9 0.1 -0.4 -3.3 -0.2 3.3 -3.6 -3.6 0.01984-85 -0.4 -0.3 -1.6 -2.3 -0.4 -0.7 -2.7 -0.4 2.0 -4.4 -4.8 0.41985-86 -1.6 -0.4 -1.5 -3.5 -0.4 -1.1 -2.1 -0.6 1.6 -6.1 -6.0 -0.11986-87 -1.9 -0.3 -1.4 -3.6 0.0 -1.0 -0.8 -0.8 1.8 -4.4 -4.4 0.01987-88 -3.2 0.5 -0.9 -3.6 0.0 -0.7 0.6 -0.4 0.8 -3.2 -3.3 0.11988-89 -4.1 0.1 -0.2 -4.3 -0.5 0.0 1.7 -0.1 -0.5 -3.7 -5.1 1.41989-90 -4.5 -1.4 -0.3 -6.2 -1.0 0.2 1.7 -0.7 1.1 -4.7 -5.9 1.11990-91 -4.4 -0.6 -0.2 -5.1 -0.3 0.9 0.2 -0.8 2.0 -3.1 -4.0 0.81991-92 -1.6 0.0 0.0 -1.6 -0.3 0.4 -3.0 -1.0 1.8 -3.7 -2.9 -0.81992-93 -1.5 0.1 0.4 -1.0 0.1 0.5 -4.3 -0.7 1.1 -4.3 -3.5 -0.71993-94 -0.8 0.3 0.6 0.1 0.3 0.2 -4.0 -0.2 0.5 -3.1 -3.5 0.4
Notes: Domestic borrowing requirement is the sum of all domestic sectors' lending (positive sign) or borrowing (negative sign). It differsslightly from the sum of the components in this table because the last three columns have been revised, while the detailed componentshave not. Lending from overseas equals current account deficit minus undistributed income payable overseas.

Australia's Foreign Debt
International Comparisons
Concepts
The following factors should be kept in mind for international comparisons of foreign debt:
• Data sources differ widely between countries and are not always directly comparable.
• Gross foreign debt figures can be highly misleading because countries with differingdegrees of openness in their fmancial systems will differ substantially in their foreignlending. For example, Denmark's gross foreign debt / GDP ratio is more than doubleAustralia's, while its net foreign debt / GDP ratio is less than ours.
• It is important to consider the composition of foreign debt in tenus of how much isowed by the official and non-official sectors. Australia differs from most developingcountries in that the official portion of foreign debt is relatively small.
Comments
A paper by the Reserve Bank of Australia entitled Extemal Debt and Liabilities ojIndustrial Countries provides a comprehensive comparison of \Vestern debt. The papershows that Australia's gross foreign debt to GDP ratio (at 52.8 per cent in 1993) is ranked16th highest in the industrial world; five countries have a ratio of over 100 per cent, thehighest ratio being 267 per cent in Belgium-Luxembourg. Several countries with high levelsof gross foreign debt, however, also have considerable holdings of external non-equityassets. Australia by comparison has a very low level of external non-equity assets. Theresult is that while Australia's gross foreign debt is relatively low by international standards,its net foreign debt is relatively high. In 1993 Australia had the 7th highest ratio of netforeign debt to GDP; in 1984 it was ranked 11th.
It is interesting that of the 18 industrial countries for which data are available, 9 (includingAustralia) have experienced increases in their net foreign debt to GDP ratio between 1984and 1993. The remaining countries which comprise Ireland, Mexico, Greece, Denmark,Portugal, Norway, Spain, Genuany and Belgium-Luxembourg have all experiencedmoderate to large decreases in their foreign debt to GDP ratio over this period.
In tenus of net foreign debt per capita, Australia has the 7th highest figure in the industrialworld. Iceland has the highest per capita debt figure, followed by Sweden, Finland,Denmark, Canada and New Zealand.
A characteristic of Australia's foreign debt is that much of it is owed by the non-officialsector. Some commentators have argued that since only official debt is a direct burden ontaxpayers, Australia's debt position is not as bad as the total debt figures would indicate.Others question this however, arguing that the whole of the economy is responsible for
51

Australia's Foreign Debt
generating resources to service the debt, regardless of who the borrowers are. Over thepast decade Australia has consistently been ranked in the middle of industrial countries interms of net official foreign debt. In 1993, Australia's net official debt was 8.4 per cent ofGDP, up from a net asset position of 2.6 per cent of GDP in 1984. The net foreign debt ofthe Australian non-official sector has risen from 18.5 per cent to 33.1 per cent of GDPbetween 1984 and 1993. In developing countries, net foreign debt tends to be concentratedin the official sector, though recently there have been shifts towards the non-official sector
Net foreign debt represents only one part of Australia's net obligations overseas. The otherpart is net equity or the difference between foreign ownership of Australian assets andAustralian ownership of foreign assets. Relative to GDP, Australians own fewer assetsabroad than any other industrial country. In 1993, Australia's net liabilities to the rest of theworld, at 54.5 per cent of GDP, were the third highest of the 18 industrial countries forwhich data was available. Only New Zealand (70.4 per cent) and Finland (58.7 per cent)had figures higher than Australia (Table 17).
It is interesting to note that over the past decade there has been a substantial increase in thenet foreign liabilities of industrial countries. Of the 18 industrial countries for which dataare available, only six were net creditors in 1993 (compared with nine in 1984), and of theremainder five had net liabilities exceeding 40 per cent of GDP.
Details: Tables 13, 14, 15, 16 and 17 and Figures 14 and 15.

TABLE 13. GROSS Ii'OREIGN DEBT AND NON-EQUITY ASSETS lU93
Per Cent of GDP
Hank Debt Non-Equity Assets
1 Belgium-Luxembourg 266.8 Belgium-Luxembourg 342.22 Denmark 113.2 Switzerland 199.33 Ireland 108.7 Netherlands 101.31. Sweden 101.8 Denmark 78.65 Finland 104.0 Ireland 64.66 Switzerland 92.0 Germany 63.07 Netherlands 88.0 Austria 60.28 Iceland 72.9 France 58.49 Greece 70.7 Portugal 49.3
10 Canada 69.8 Norway 46.811 New Zealand 68.4 Sweden 45.912 Austria 63.4 Finland 44.613 France 58.3 Italy 34.614 Germany 55.6 Greece 30.615 Norway 53.9 Spain 26.616 Australia 52.8 Canada 25.417 Italy 43.7 United States 18.218 Portugal 41.4 Iceland 12.219 United States 34.4 Mexico 12.020 Mexico 34.0 Australia 11.321 Japan 33.8 New Zealand 6.822 Spain 31.9
Note: 1. No data are available for the UK on foreign debt or non-equity assets.2. For Austria, Belguim-Luxembourg, Greece, Italy, Mexico, the
Netherlands, Portugal, Spain and Switzerland the latest data ~
available are for end 1992. For Australia and New Zealand the data;:;:~
refer to the financial year ending in June and March 1993, respectively. i:l--j2;'",,-
6'~
QQ'Vl ;:sW 0
"'t:r-

TABLE 14. NET FOREIGN DEBT(Jl Per Cent of GDP+-- :t>.
::::~
Hank 1984 1993i:l~
1 Ireland 63.0 New Zealand 61.6 "';
~2 Iceland 60.5 Iceland 60.6 ..,
~
3 Mexico 47.9 Finland 59.4 00';:s
4 Greece 45.1 Sweden 58.9 tl37.8 Canada 44.4
~
5 Denmark I::;-...6 Portugal 29.1 Ireland 44.17 Canada 24.8 Australia 41.58 Sweden 23.1 Greece 40.19 Finland 20.5 Denmark 34.510 Norway 16.7 Mexico 22.011 Australia 15.9 United States 16.312 Spain 8.1 Italy 9.113 United States 2.8 Norway 7.114 Germany -6.8 Spain 5.315 France -7.5 Austria 3.216 Belgium-Luxembourg -16.3 France -0.117 Netherlands -24.4 Germany -7.418 Switzerland -137.4 Portugal -7.919 Netherlands -13.320 Belgium-Luxembourg -75.421 Switzerland -107.4
Note: 1. No data are available for Japan and the UK on net foreign debt.2. For Austria, Belguim-Luxembourg, Greece, Italy, Mexico, the
Netherlands, Portugal, Spain and Switzerland the latest dataavailable are for end 1992. For Australia and New Zealand the datarefer to the financial year ending in June and March, respectively.
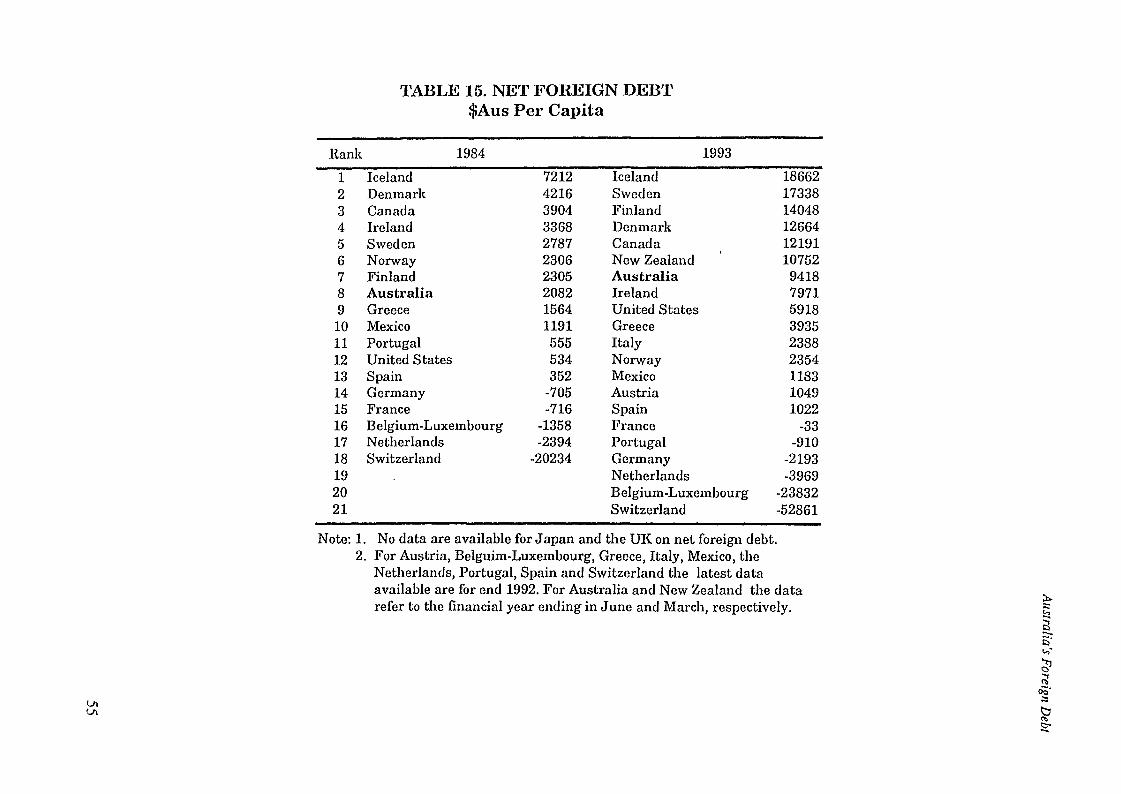
Hank
TABLE 15. NET FOREIGN DEBT$Aus Per Capita
1984 1993
1 Iceland2 Denmark3 Canada4 Ireland5 Sweden6 Norway7 Finland8 Australia9 Greece10 Mexico11 Portugal12 United States13 Spain14 Germany15 France16 Belgium-Luxembourg17 Netherlands18 Switzerland192021
7212421639043368278723062305208215641191555534352
-705-716
-1358-2394
-20234
IcelandSwedenFinlandDenmarkCanadaNew ZealandAustraliaIrelandUnited StatesGreeceItalyNorwayMexicoAustriaSpainFrancePortugalGermanyNetherlandsBelgium-LuxembourgSwitzerland
186621733814048126641219110752941879715918393523882354118310491022
-33-910
-2193-3969
-23832-52861
VlVl
Note: 1. No data are available for Japan and the UK on netforeign debt.2. For Austria, Belguim-Luxembourg, Greece, Italy, Mexico, the
Netherlands, IJortugal, Spain and Switzerland the latest dataavailable are for end 1992. For Australia and New Zealand the datarefer to the financial year ending in June and March, respectively.
::t..;;:~
~
~",'
61;:;;
00';:::
~go

TABLE 16. COMPOSITION OF NErr FOREIGN DEBT, 1993fJl Per Cent GDP0\
~~2;
Rank Non-Official Official --is-",-
I Iceland 40.3 Denmark 43.6 ~2 New Zealand 39.1 Ireland 38.8 ~
3 Sweden 36.3 Finland 29.2 0<;'::1
4 Australia 33.1 Canada 23.4 b('\)
5 Finland 30.2 Sweden 22.7 t::;-....6 Greece 25.8 New Zealand 22.57 Canada 21.0 Iceland 20.38 Norway 17.2 Mexico 15.09 Italy 12.1 Greece 14.3
10 Spain 12.0 Germany 10.311 United States 9.7 Australia 8.412 Mexico 7.0 United States 6.613 Ireland 5.4 France 3.714 Austria 3.2 Austria 0.015 Portugal 2.1 Netherlands -0.616 France -3.9 Belgium-Luxembourg -1.517 Denmark -9.0 Italy -3.118 Netlwrlands -12.7 Spain -6.619 Germany -17.7 Portugal -10.020 Belgium-Luxembourg -73.8 Norway -10.121 Switzerland -89.5 Switzerland -17.8
Note: 1. No data are available for Japan and the UK on net foreign debt.2. For Austria, Belguim-Luxembourg, Greece, Italy, Mexico, the
Netherlands, Portugal, Spain and Switzerland the latest dataavailable are for end 1992. For Australia and New Zealand the datarefer to the financial year ending in June and March 1993, respectively.
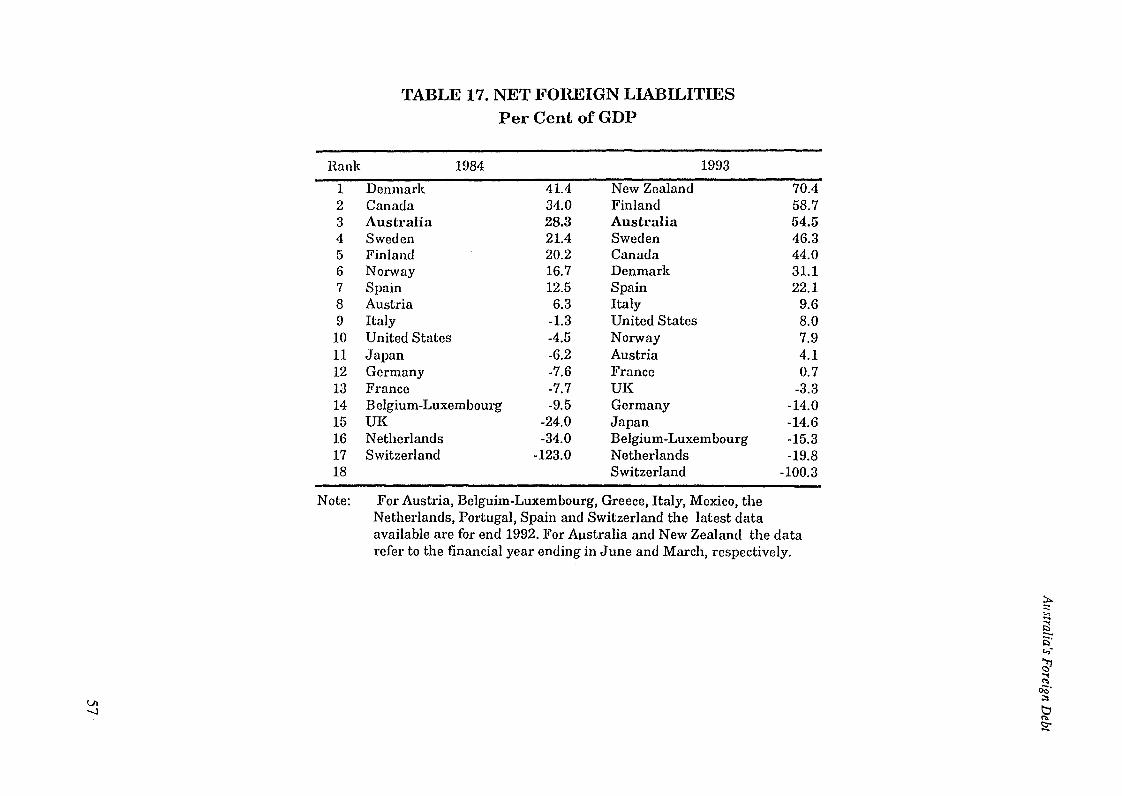
Vl-...J
TABLE 17. NET FOREIGN LIABILITIESPer Cent of GDP
Rank 1984 1993
1 Denmark 41.4 New Zealand 70.42 Canada 34.0 Finland 58.73 Australia 28.3 Australia 54.54 Sweden 21.4 Sweden 46.35 Finland 20.2 Canada 44.06 Norway 16.7 Denmark 31.17 Spain 12.5 Spain 22.18 Austria 6.3 Italy 9.69 Italy -1.3 United States 8.010 United States -4.5 Norway 7.911 Japan -6.2 Austria 4.112 Germany -7.6 France 0.713 France -7.7 UK -3.314 Belgium-Luxembourg -9.5 Germany -14.015 UK -24.0 Japan -14.616 Netherlands -34.0 Belgium-Luxembourg -15.317 Switzerland -123.0 Netherlands -19.818 Switzerland -100.3
Note: For Austria, Belguim-Luxembourg, Greece, Italy, Mexico, theNetherlands, Portugal, Spain and Switzerland the latest dataavailable are for end 1992. }i'or Australia and New Zealand the datarefer to the financial year ending in June and March, respectively.
:t>.::::",.,
~§"=...,'6'~
00·;::s
~Sot

Australia's Foreign Debt
Figure 14. Net Foreign Debt as %of GDP1993
New Zealand .. IIceland I
Finland ... ISweden ,.. ICanada .' IIreland i.:...:/",.,... I
:~=~~Mexlro~United States E:J
Italy 0Norway 0
Spain 0Austria
r---- ]g~~~~~~~#~~~Belgium-Luxembourg... :. :H. . i: H. ; SwitzerljDd
-120 -100 -80 -60 -40 -20 0 20 40
%ofGDP
60 80
Figure 15. Net Foreign Liabilities as % of GDP1993
New Zealand IFinland 1=·=======i..J
Australia !~~ljjjlirSweden I,·· ICanada I. I
Denmark '===--'Spain c:=JItaly 0
United States 0Norway 0Austria 0France
UKGermany
Japan
Belgiurn-Lux{·rn bourg
Netherlands
Switzerland
58
-150 -100 -50 o%ofGDP
50 100

Australia's Foreign Debt
Glossary
current account deficit. A situation in which outgoing money (debits) as the result oftransactions between Australia and the rest of the world exceeds incoming money (credits).
direct investment. Capital invested in an enterprise by an investor having a significantinfluence over the enterprise. Until June 1985, ownership of 25 per cent or more of theordinary shares or voting stock is generally used as the measure of sigilificant influence byan investor. From July 1985, this threshold is 10 per cent or more.
domicile ofborr01'v'ings. Borrowings domiciled in Australia comprise those securities issuedin Australia wlllch are taken up by non-residents. It includes deposits held by non-residentswith the Reserve Bank and commercial banks in Australia. Borrowings domiciled abroadrefers to all other borrowings from non residents.
drawings of borrov..'ing domiciled abroad. Those transactions that increase liabilities inrespect of borrowing domiciled abroad.
financial enterprises. Enterprises mainly engaged in incurring liabilities and acquiringfmancial assets.
foreign investment in Australia. Refers to the stock of fmancial assets in Australia ownedby non-residents and capital transactions which increase or decrease tllis stock.
gross foreign debt. The amount borrowed from non-residents by residents of Australia.Also known as external debt or the level of foreign borrowing.
institutional sector. Refers to the classification of statistical units into groups with similarfmancial roles and behaviour. In international investment statistics, resident institutionalsectors are grouped under the headings official and non-official.
maturity of borrowings domiciled abroad. For the level of drawings or borrowingsdomiciled abroad, maturity refers to the time to contractual maturity. For repayments ofborrowing domiciled abroad, maturity refers to the time since drawdown of the borrowing.
net foreign debt. Gross foreign debt less the sum of official reserve assets and Australianlending abroad.
non-official sector. Comprises banks (apart from the Reserve Bank), non-bank fmancialenterprises and trading enterprises and households.
official sector. Comprises general government institutions and the Reserve Bank.
portfolio and other investment. All international investment activity not classified as directinvestment or reserve assets.
prirate sector enterprises. Trading and financial enterprises \""hich are not public sectorenterprises.
public sector entel1Jrises. Trading and financial enterprises wlllch are publicly ownedand/or controlled.
59

Australia's Foreign Debt
repayments of borrowing domiciled abroad. Those transactions that reduce liabilities inrespect of borrowing domiciled abroad.
resen!e assets. Foreign fmancial assets that are effectively controlled and available for useby the central authorities for meeting balance of payments needs. Official reserve assetsinclude gold, special drawing rights and Australia's reserve position in the InternationalMonetary Fund and foreign exchange.
trading enterprises. Enterprises mainly engaged in the production of goods and services forsale in the market.
60

Australia's Foreign Debt
Data SourcesAustralian Bureau of Statistics, Australian National Accounts: Capital Stock, Cat. No.5363.0, ABS, Canberra.
Australian Bureau of Statistics, Australian National Accounts: National Income,Erpenditure and Product, Cat. Nos. 5204.0 and 5206.0, ABS, Canberra
Australian Bureau of Statistics, Balance of Payments, Australia, Cat. Nos. 5302.0 and5303.0, ABS, Canberra.
Australian Bureau of Statistics, Balance of Payments and International InvestmentPosition, Australia, Cat. No. 5363.0, ABS, Canberra.
Australian Bureau of Statistics, International Investment Position, Australia, Cat. Nos.5305.0 and 5306.0, ABS, Canberra.
Butlin, N.G. 1985, Australian National Accounts, 1788-1983, Australian NationalUniversity, Canberra.
(
Reserve Bank of Australia, Bulletin (various issues), Reserve Bank, Sydney.
Rider, Mark 1994, E>:temal Debt and Liabilities of Industrial Countries (ResearchDiscussion Paper 9405), Reserve Bank of Australia, Sydney
61


