australian household food waste
TRANSCRIPT

Australian household food waste
A summary of behaviours, attitudes, perceived and actual food waste
In-home research
This research was commissioned by the Project Steering Group for the Designing effective interventions to reduce household food waste project. It is part of a four-year research project delivered through the Fight Food Waste Cooperative Research Centre.
Project Steering Group members are:
Authors
Dr Gamithri Gayana Karunasena (Central Queensland University)
Professor David Pearson (Central Queensland University)
Published June 2021
The Fight Food Waste Cooperative Research Centre (CRC) gratefully acknowledges the Australian Government’s financial contribution through the Cooperative Research Centres program as well as the participants of this project.
We thank Instinct and Reason for collecting and analysing the data in this report. Their team successfully navigated a complex methodology, interruptions due to COVID-19 and the need for complete transparency with respondents about the research purpose and requirements. In particular, we would like to thank Danica Jobson for her dedication and commitment.
This document should be cited as: Karunasena, G.G, Pearson, D, and Fight Food Waste CRC (2021) Australian household food waste: A summary of behaviours, attitudes, perceived and actual food waste, Fight Food Waste Cooperative Research Centre, Adelaide. Australia.
© Fight Food Waste Limited 2021
Level 1, Wine Innovation Central Building, Cnr Hartley Grove and Paratoo Road, URRBRAE SA 5064
[email protected] +61 8 8313 3564
All information, data and advice contained within the report is provided by the Fight Food Waste CRC in good faith and is believed to be accurate and reliable as at the time of publication. However, the appropriateness of the information, data and advice in the report is not guaranteed and is supplied by Fight Food Waste CRC ‘as is’ with no representation or warranty.
Behaviour, attitudes, perceived and actual food waste
Report background:
“Designing effective interventions to reduce household food waste” is a Fight Food Waste CRC’s research project. The project reports will provide evidence-based insights covering food waste behaviours and attitudes of Australian households, quantification of perceived and actual household food waste, advice regarding priority segments, identification of global best practise interventions, household food waste reduction interventions for priority segments, messages for selected intervention and cost-effective methodologies for evaluating the impact of selected interventions.
How to read the reports in this series:
This report is one of six reports published in the series “Australian household food waste”. A summary of the implications and evidence to support these is provided in “A summary of behaviours, attitudes, perceived and actual food waste” whilst the other five reports provide detailed results. These being: “Survey findings of behaviours and perceived food waste”, “Electronic-diary findings of recorded food waste and disposal methods”, “Kerbside bin audit findings of actual food waste”, “Focus group findings of attitudes to food waste”, and “Choice model findings of food waste reduction interventions”.
Behaviour, attitudes, perceived and actual food waste
i
Contents
Table of Figures .......................................................................................................................................... ii
List of Tables .............................................................................................................................................. iii
1. Executive Summary ............................................................................................................................ 1
1.1. Recommendations ............................................................................................................................... 1 1.2. Change needs a number of ingredients .............................................................................................. 2 1.3. Behaviours needing to change to reduce food waste......................................................................... 2 1.4. The causes of food waste are complex ............................................................................................... 4 1.5. Key food wasters ................................................................................................................................. 4 1.6. Few Australians realise they have an issue ......................................................................................... 4 1.7. Estimates of amount of food waste .................................................................................................... 4
2. Methodology ...................................................................................................................................... 5
2.1 Research project inclusions ................................................................................................................. 5 2.2 Sample Limitations .............................................................................................................................. 7 2.3 Sample Profile ...................................................................................................................................... 7
3. Overall findings from the qualitative research ..................................................................................... 9
3.1. The question of what causes food waste is highly complex ............................................................... 9 3.2. Need recognition is missing............................................................................................................... 10 3.3. Food waste situation analysis............................................................................................................ 10 3.4. Model of change ................................................................................................................................ 12
4. Overall findings from the quantitative studies ................................................................................... 14
4.1. Food waste volume and cost outcomes ............................................................................................ 14 4.2. Conversion factor electronic-diary to bin audit results for only red bin data .................................. 18
5. Food waste volumetric outcomes – benchmark survey ...................................................................... 18
6. Food waste outcomes from the electronic-diary ................................................................................ 21
6.1. Most wasted food products (by value) ............................................................................................. 23
7. Food waste outcomes from the physical bin audit ............................................................................. 26
7.1. Food waste result between recorded and physical bin audit (only food disposed of in red bin) .... 27
8. What behaviours are linked to food waste? ....................................................................................... 30
9. What interventions might reduce food waste? .................................................................................. 34
10. Future research considerations ......................................................................................................... 40
Appendix A – methodological notes .......................................................................................................... 41
In-home food waste social research survey sample recruitment ................................................................ 41 Screening questions ...................................................................................................................................... 42 Electronic diary ............................................................................................................................................. 42 Bin audit ........................................................................................................................................................ 42 Analysis ......................................................................................................................................................... 43 Technical data collection and analysis.......................................................................................................... 44 Per Capital Food Waste Calculation Methodology ....................................................................................... 47
Appendix B – Survey Forms ....................................................................................................................... 48
Appendix C – Electronic diary .................................................................................................................... 66
ii
Table of Figures
Figure 1: Research phases ....................................................................................................................................... 6
Figure 2: Method ..................................................................................................................................................... 6
Figure 3: Model of change ..................................................................................................................................... 13
Figure 4: Quantity of food disposed ...................................................................................................................... 15
Figure 5: Calculation assumptions ......................................................................................................................... 15
Figure 6: Value of food disposed ........................................................................................................................... 16
Figure 7: Food waste measures ............................................................................................................................. 17
Figure 8: Comparisons of food waste across the three food waste measures ..................................................... 17
Figure 9: Electronic diary conversion factor .......................................................................................................... 18
Figure 10: Food disposal methods ........................................................................................................................ 21
Figure 11: Food waste and value (includes all food disposed of) - by total sample ............................................. 22
Figure 12: Food waste and value (only food disposed of in red bin) - by total sample ........................................ 22
Figure 13: Top recorded food products wasted (includes food disposed in-house)- by value............................. 23
Figure 14: Food waste from the bin audit and estimate for total food waste...................................................... 27
Figure 15: Food waste result between recorded in electronic-diary and physical bin audit (only food disposed
of in red bin) .......................................................................................................................................................... 27
Figure 16: Classification of very low to high food wasters .................................................................................... 31
Figure 17: Food planning relationships with level of food waste ......................................................................... 31
Figure 18: Food purchasing and its relationships with level of food waste .......................................................... 32
Figure 19: Food storage and its relationships with level of food waste ............................................................... 32
Figure 20: Food preparation and its relationships with level of food waste ........................................................ 33
Figure 21: Food disposal and its relationships with level of food waste .............................................................. 34
Figure 22: Experiments testing interventions ....................................................................................................... 35
Figure 23: Planning and shopping choice model design ....................................................................................... 35
Figure 24: Planning and shopping interventions and relative impact on reducing food waste ........................... 36
Figure 25: Scenario showing likely impact on food waste with optimal intervention strategies employed ........ 36
Figure 26: Storing interventions choice model design .......................................................................................... 37
Figure 27: Storing interventions and relative impact on reducing food waste .................................................... 37
Figure 28: Scenario showing likely impact on food waste with optimal intervention strategies employed ........ 38
Figure 29: Preparing and disposing interventions choice model design .............................................................. 38
Figure 30: Interventions and relative impact on reducing food waste ................................................................. 39
Figure 31: Scenario showing likely impact on food waste with optimal intervention strategies employed ........ 39

iii
List of Tables
Table 1: Qualitative method .................................................................................................................................... 7
Table 2: Sample profile Household structure.......................................................................................................... 8
Table 3: Sample profile Household income ............................................................................................................ 8
Table 4: Sample profile Age and Gender ................................................................................................................. 9
Table 5: Estimated food waste (in kg) - by state ................................................................................................... 19
Table 6: Estimated food waste (in kg) - by household structure .......................................................................... 20
Table 7: Estimated food waste (in kg) - by age ..................................................................................................... 20
Table 8: Estimated food waste (in kg) - by income ............................................................................................... 21
Table 11: Recorded food waste (includes all food disposed of) - by state ........................................................... 23
Table 12: Recorded food waste (includes all food disposed of) - by age and gender .......................................... 24
Table 13: Recorded food waste (includes all food disposed of) – by household structure .................................. 25
Table 14: Recorded food waste (in kg) - by weekly household income................................................................ 26
Table 15: Recorded food waste via bin audit (in kg) - by state ............................................................................. 28
Table 16: Recorded food waste via bin audit (in kg) - by age and gender ............................................................ 29
Table 17: Recorded food waste via bin audit (in kg) - by household structure .................................................... 29
Table 18: Recorded food waste via bin audit (in kg) - by weekly household income ........................................... 30

1
1. Executive Summary
Following the Fight Food Waste Cooperative Research Centre (FFW CRC) 2019 benchmark study into
Australians and food waste, it was apparent that householders underestimate the amount of food waste they
produce, and it was deemed necessary to undertake further research to capture a better household measure
of the amount of food waste produced and why it was happening.
This 2020/21 study achieves three measures of food waste as assessed by main and joint household food
managers. The study starts with a self-report survey that asks householders to estimate food waste, then uses
an electronic-diary that records food waste over a seven-day period, and finally, includes a physical bin audit
to measure the food waste found in the bin (matched to the same period as the electronic-diary). The study
compares the three food waste records and then, using focus group discussions, explores the causes and
remedies for food waste.
1.1. Recommendations
The research suggests that consideration should be given to the following initiatives:
• A broad strategy should be considered that generates ‘need recognition’ for changed food
management amongst the heavy food wasters of the wealthy, families with children and those under
35-years old.
• Facilitation: Social norms dictate that food waste avoidance is desirable so people will use tools,
guidance on making structural changes to lifestyle, food management that facilitate positive change
are needed.
• Reinforcement: Food management is an everyday activity that lends itself to the formation of habits
as mental shortcuts reduce demand on the mind’s limited thinking power. Once behaviour change is
triggered, reinforcement strategies using multiple channels are needed to make sure positive
behaviours become established.
• Education: After establishing the value of food waste, then build awareness of the environmental
impact of food waste, focusing on the carbon emissions spent to grow, distribute and market the food.
• Tools as habit changers: There was extensive support in the focus groups and the choice modelling for
tools that help. Household food managers want tools that help them achieve their goals (see need
states) AND reduce food waste. Where these two align then food waste is likely to be lowered.
• Change strategies need to recognise the emotional needs at work and develop solutions that gratify
these need states yet deliver better food waste outcomes. Four spaces were identified:
• Food is planned, prepared, and provided my way (individualism)
• Food is for us to nurture other and to bond around (belonging)
2
• Food needs to make everyone happy (freedom)
• Food is to be efficiently managed (control)
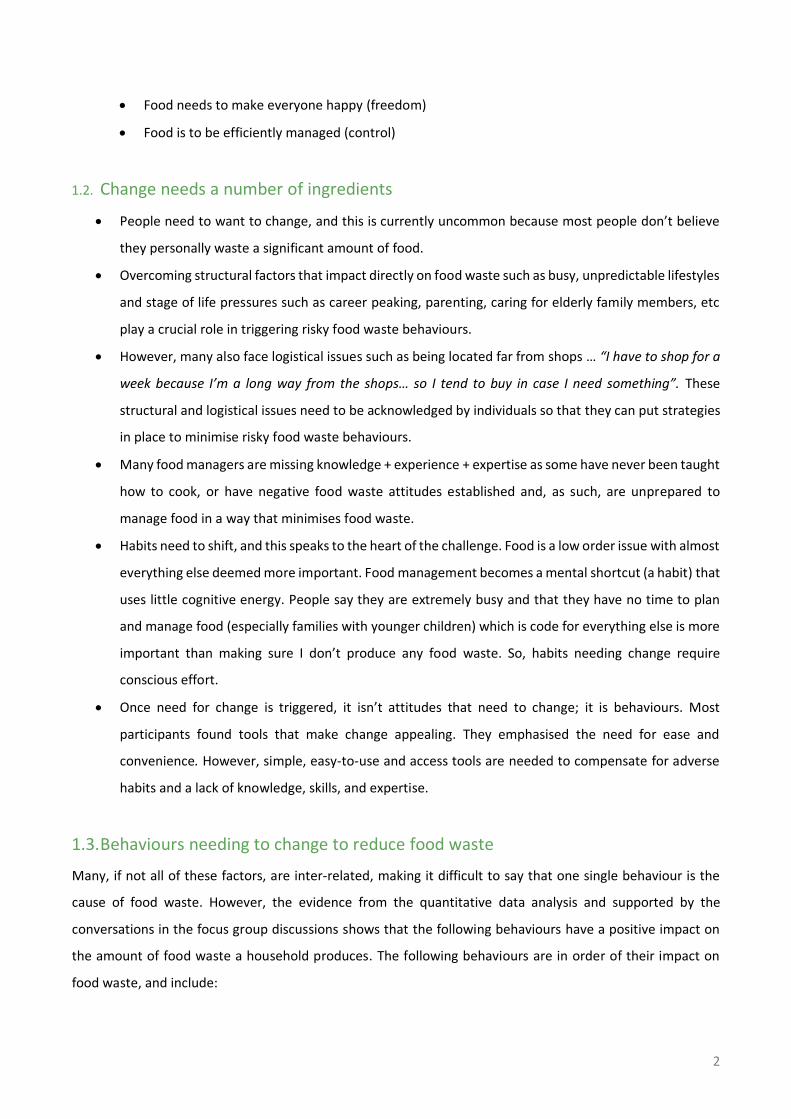
1.2. Change needs a number of ingredients
• People need to want to change, and this is currently uncommon because most people don’t believe
they personally waste a significant amount of food.
• Overcoming structural factors that impact directly on food waste such as busy, unpredictable lifestyles
and stage of life pressures such as career peaking, parenting, caring for elderly family members, etc
play a crucial role in triggering risky food waste behaviours.
• However, many also face logistical issues such as being located far from shops … “I have to shop for a
week because I’m a long way from the shops… so I tend to buy in case I need something”. These
structural and logistical issues need to be acknowledged by individuals so that they can put strategies
in place to minimise risky food waste behaviours.
• Many food managers are missing knowledge + experience + expertise as some have never been taught
how to cook, or have negative food waste attitudes established and, as such, are unprepared to
manage food in a way that minimises food waste.
• Habits need to shift, and this speaks to the heart of the challenge. Food is a low order issue with almost
everything else deemed more important. Food management becomes a mental shortcut (a habit) that
uses little cognitive energy. People say they are extremely busy and that they have no time to plan
and manage food (especially families with younger children) which is code for everything else is more
important than making sure I don’t produce any food waste. So, habits needing change require
conscious effort.
• Once need for change is triggered, it isn’t attitudes that need to change; it is behaviours. Most
participants found tools that make change appealing. They emphasised the need for ease and
convenience. However, simple, easy-to-use and access tools are needed to compensate for adverse
habits and a lack of knowledge, skills, and expertise.
1.3. Behaviours needing to change to reduce food waste
Many, if not all of these factors, are inter-related, making it difficult to say that one single behaviour is the
cause of food waste. However, the evidence from the quantitative data analysis and supported by the
conversations in the focus group discussions shows that the following behaviours have a positive impact on
the amount of food waste a household produces. The following behaviours are in order of their impact on
food waste, and include:
3
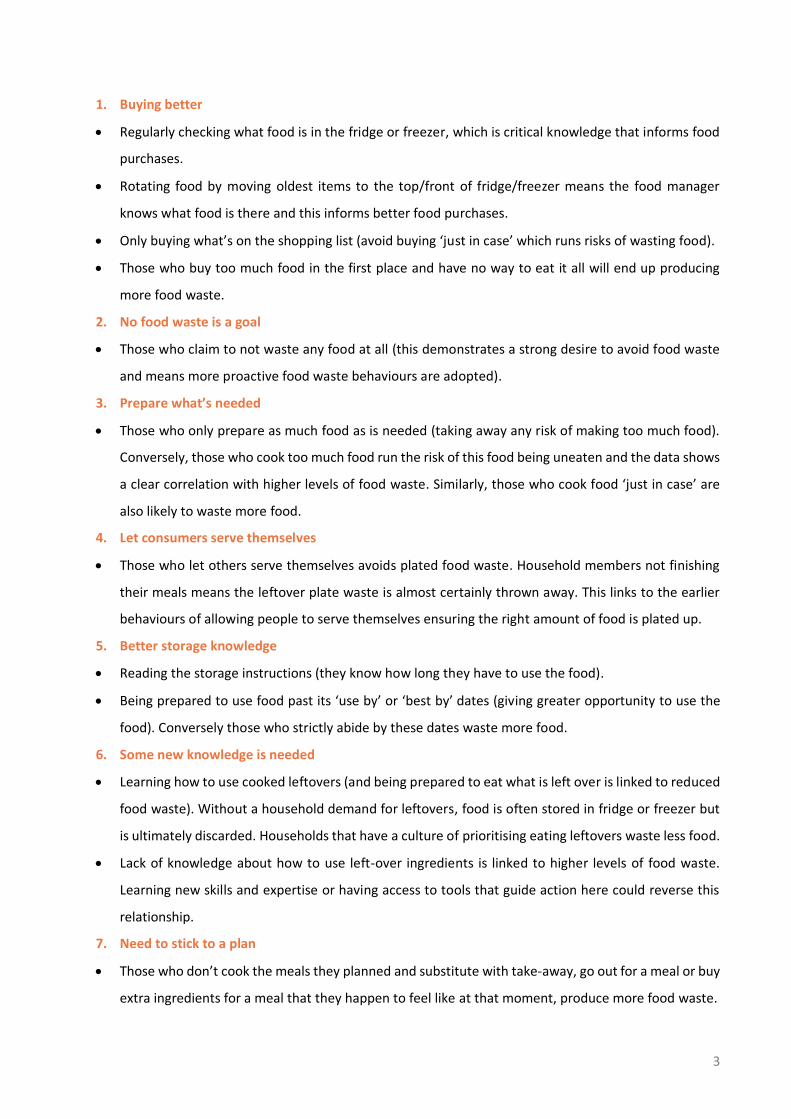
1. Buying better
• Regularly checking what food is in the fridge or freezer, which is critical knowledge that informs food
purchases.
• Rotating food by moving oldest items to the top/front of fridge/freezer means the food manager
knows what food is there and this informs better food purchases.
• Only buying what’s on the shopping list (avoid buying ‘just in case’ which runs risks of wasting food).
• Those who buy too much food in the first place and have no way to eat it all will end up producing
more food waste.
2. No food waste is a goal
• Those who claim to not waste any food at all (this demonstrates a strong desire to avoid food waste
and means more proactive food waste behaviours are adopted).
3. Prepare what’s needed
• Those who only prepare as much food as is needed (taking away any risk of making too much food).
Conversely, those who cook too much food run the risk of this food being uneaten and the data shows
a clear correlation with higher levels of food waste. Similarly, those who cook food ‘just in case’ are
also likely to waste more food.
4. Let consumers serve themselves
• Those who let others serve themselves avoids plated food waste. Household members not finishing
their meals means the leftover plate waste is almost certainly thrown away. This links to the earlier
behaviours of allowing people to serve themselves ensuring the right amount of food is plated up.
5. Better storage knowledge
• Reading the storage instructions (they know how long they have to use the food).
• Being prepared to use food past its ‘use by’ or ‘best by’ dates (giving greater opportunity to use the
food). Conversely those who strictly abide by these dates waste more food.
6. Some new knowledge is needed
• Learning how to use cooked leftovers (and being prepared to eat what is left over is linked to reduced
food waste). Without a household demand for leftovers, food is often stored in fridge or freezer but
is ultimately discarded. Households that have a culture of prioritising eating leftovers waste less food.
• Lack of knowledge about how to use left-over ingredients is linked to higher levels of food waste.
Learning new skills and expertise or having access to tools that guide action here could reverse this
relationship.
7. Need to stick to a plan
• Those who don’t cook the meals they planned and substitute with take-away, go out for a meal or buy
extra ingredients for a meal that they happen to feel like at that moment, produce more food waste.

4
1.4. The causes of food waste are complex
Many factors contribute to food not being eaten. Starting with a widespread attitude that there isn’t a
personal food waste problem, structural realities of life that make food management challenging (such as
affordability and competing priorities that make food management a low order issue), lack of knowledge about
food and how to repurpose and use ingredients, lack of cooperation between household members to minimise
food waste, lack of food management expertise, entrenched attitudes that undermine food waste prevention
(e.g. it is always better to have too much than too little in the fridge and on the table), behaviours that increase
the risk of food being wasted (both conscious and unconscious [habits]), and finally, values that discount the
environment and prioritise individual rights and preferences over all else.
1.5. Key food wasters
The groups wasting more food than the average, and thus are key target audiences for change strategies are:
• busy families (especially young families with children under 17 years)
• wealthy (those with household incomes over $3,000 per week, over $156,000 per year)
• those under 35 years of age
1.6. Few Australians realise they have an issue
Householders underestimate their food waste significantly. This was evident with self-reported results from
the survey and electronic-diary being significantly below the actual amount measured in the bin audit.
Another important contributing factor to food waste and to the lack of awareness of the food waste issue is
the widely held belief that the only issue is when food waste is sent to landfill. This has led to the strong
position that composting is virtuous and hence there is little awareness of all the effort embedded in the food
being lost. If unaddressed this could lead to adverse outcomes for the FOGO (food organics garden organics)
bin introductions. People feel they are doing the right thing by disposing of food (either composting at home
or in a FOGO bin) rather than addressing the root issue of eating all the food they buy and hence not wasting
any of it.
1.7. Estimates of amount of food waste
The survey estimate was 2.03 kg of food waste per household per week and the electronic-diary found 2.89kg.
The bin audit shows 1.78kg per household per week. However, this bin audit data does not include food
disposed of by other methods such as being fed to pets, put in home compost bin, and down the sink. Using
the bin audit result and adding these additional disposal amounts it is estimated that 4.22 kg of food is wasted

5
per household per week. The cost of this food waste is $41.02 per household per week. When adjusted for
the number of people in the household, the estimated amount is 1.88 kg ($18.55) of food is wasted per person
per week. According to the electronic-diary, fresh vegetables, meat and sea food, bread and bakery, meals,
fresh fruits and drinks are the top 6 products wasted in Australia.
2. Methodology
The following section summarises the overall research design of the project. Please refer the individual reports
for more details on the methodology for each data source (“Survey findings of behaviours and perceived food
waste”, “Electronic-diary findings of recorded food waste and disposal methods”, “Kerbside bin audit findings
of actual food waste”, “Focus group findings of attitudes to food waste” and “Choice model findings of food
waste reduction interventions”).
2.1 Research project inclusions
1. A national self-report benchmark survey with 2885 main and joint household food managers (a
shortened version of the 2019 survey)
2. A 7-day detailed electronic-diary record of food disposed of by 1462 respondents (a sub-set of the
benchmark sample of 2885). These respondents completed an electronic-diary that recorded all the
food waste the respondent was aware of and how it was disposed (i.e., in the red bin, down the sink,
supplied to animals, placed in the compost or worm farm, etc)
3. Testing of potential interventions: all 1462 respondents who completed the electronic-diary also
completed one or two discrete choice experiments where possible interventions designed to support
better household food management behaviours were tested based on the respondent’s weakest food
management behaviour identified in the benchmark survey. There were three different models
produced based on responses from 2597 respondents (some took part in two choice experiments
because their household food management behaviours were equally weak in two areas).
4. The final element of the quantitative phase was a sub-set of 495 of the 1462 electronic-diary
respondents who were selected for a physical food waste audit of their bin, carefully aligned to their
7-day electronic-diary record.
The four quantitative data sets (ie. Survey, electronic-diary, testing potential interventions, and bin
audit) are linked with an anonymous respondent ID and FFW CRC are able to make comparisons
between each, with the physical bin audit capturing the most reliable evidence about the quantity of
food waste. The accuracy of self-reported food waste has long been questioned, with self-reported
food waste suspected of being highly inaccurate. The daily record kept by the electronic-diary has
many advantages as it also captures food waste that is disposed of in ways that the physical bin audit

6
cannot measure (e.g., fluids disposed down the sink, composting and food fed to animals). The
physical bin audit is highly accurate apart from where food waste is disposed of by other means.
5. Finally, qualitative research using 10 focus group discussions explored how the behaviours identified
in the quantitative research actually led to food being wasted.
Figure 1: Research phases
The quantitative methodology is outlined in 2 below.
Figure 2: Method
The qualitative stage involved 10 virtual focus group discussions where participants were recruited directly
from the survey sample based on demographics and whether they came from a household with above or
below average food waste.

7
The details are outlined in Table 1 below.
Table 1: Qualitative method
2.2 Sample Limitations
FFW CRC required participant permission for the physical bin audit from every respondent, irrespective of
whether they were audited or not. This, and other sample requirements, led to a substantial proportion of the
sample drawn for the study being terminated before having the opportunity to complete the survey. This
potentially affected both the sample quality and the actual food waste behaviour of households by bringing a
bias to the sample by only including those prepared to have their bin physically audited.
About 40% of the original sample was terminated for a variety of reasons, including:
1. The need for a weekly waste pick-up (many places in Australia have a 14-day one).
2. The sample could NOT include those people living in a FOGO bin collection area. This would have
required two bins to be audited which was outside the scope of the contract, and food waste may
have been hard to discern in the FOGO bin. The proportion of Australian households with a FOGO bin
is rapidly rising and means the chance to replicate this study will be much harder/more costly in the
future
3. Respondents needed a secure bin to ensure only one household’s food waste was present.
4. The respondent needed to be present in the house for most of the week and not away from home.
2.3 Sample Profile
• 4921 Australian households cleared all the screener questions from the original 8289 who were invited
to take part in the study.

8
• 71% agreed to do an electronic-diary and have the physical bin audit conducted (3568).
• 2885 (or 81%) completed the benchmark survey and 1462 completed the electronic-diary.
• 495 had physical bin audits conducted.
Despite the potential sample biases introduced by the requirements outlined above, the sample acquired
across the three research phases closely resembled the Australian population in many respects. There was a
slight skew away from people living alone (23% in the Australian population and slightly less in all phases), and
there were similar but minor variations in other demographic categories.
Table 2: Sample profile Household structure
The sample acquired across the three research phases for income also closely resembled the Australian
population. There was a skew in the benchmark survey to lower income (22% in the Australian population and
30% in the benchmark survey). There were only minor variations in other categories.
Table 3: Sample profile Household income
The sample acquired across the three research phases for age varied from the Australian population. There
was a skew in the benchmark survey away from those aged 18–34 years. This was to be expected with

9
considerable numbers of Australian youth still living at home and unlikely to play a significant role in household
food management (a requirement of study participation).
As a result of the natural skews caused by the survey screener requirements, the data was only weighted by
state/territory to make it representative of the Australian population mainly and jointly responsible for
household food management.
Table 4: Sample profile Age and Gender
3. Overall findings from the qualitative research
The research involves 10 focus group discussions to better understand causes of food waste, establish
differences in behaviours between household types that lead to greater or less food waste, determine how
levels of knowledge, skills and experience in managing food in the household impact food waste, and finally,
explore lifestyles (the interactive effects of others in the households on food waste).
3.1. The question of what causes food waste is highly complex
The focus group discussions reveal that many factors contribute to food not being eaten. Starting with a lack
of awareness that food waste is an issue, it is then the structural and logistical realities of life that make food
management challenging (such as affordability and competing priorities that make food management a low
order issue), lack of knowledge about food and how to repurpose and use ingredients, lack of cooperation
between household members to minimise food waste, lack of food management expertise, entrenched
attitudes that undermine food waste prevention (e.g. it is always better to have too much than too little in the
fridge and on the table), behaviours that increase the risk of food being wasted (both conscious and
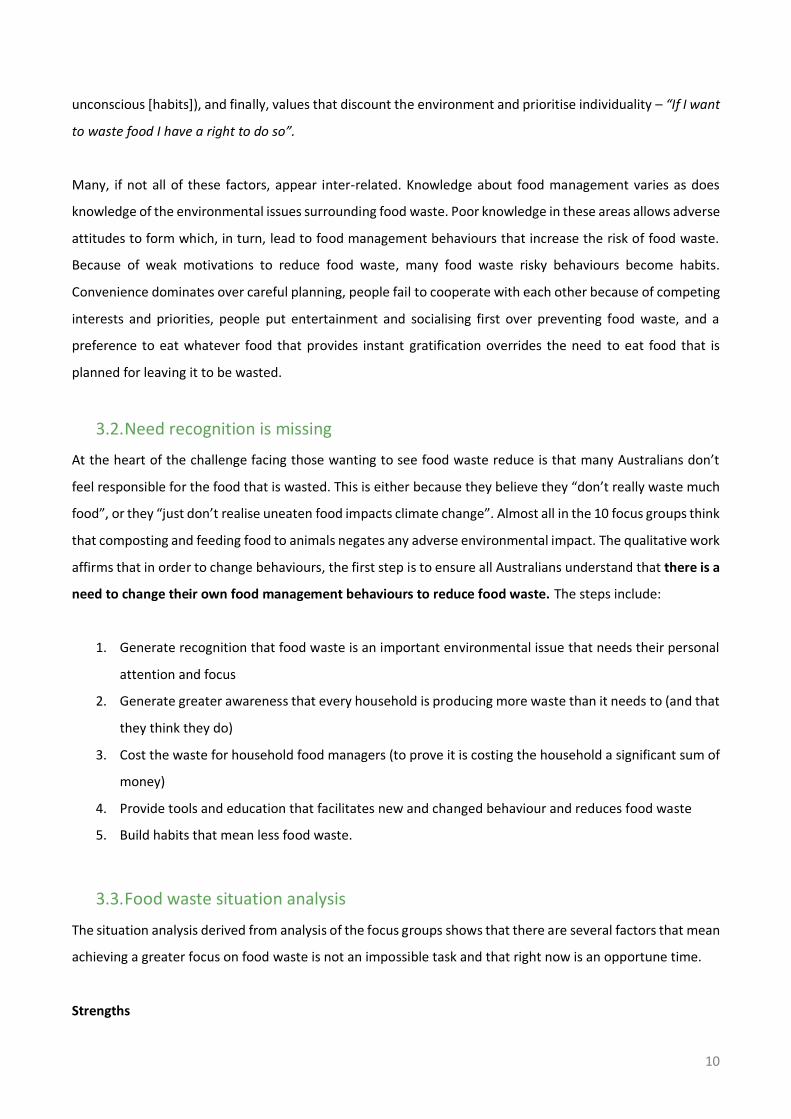
10
unconscious [habits]), and finally, values that discount the environment and prioritise individuality – “If I want
to waste food I have a right to do so”.
Many, if not all of these factors, appear inter-related. Knowledge about food management varies as does
knowledge of the environmental issues surrounding food waste. Poor knowledge in these areas allows adverse
attitudes to form which, in turn, lead to food management behaviours that increase the risk of food waste.
Because of weak motivations to reduce food waste, many food waste risky behaviours become habits.
Convenience dominates over careful planning, people fail to cooperate with each other because of competing
interests and priorities, people put entertainment and socialising first over preventing food waste, and a
preference to eat whatever food that provides instant gratification overrides the need to eat food that is
planned for leaving it to be wasted.
3.2. Need recognition is missing
At the heart of the challenge facing those wanting to see food waste reduce is that many Australians don’t
feel responsible for the food that is wasted. This is either because they believe they “don’t really waste much
food”, or they “just don’t realise uneaten food impacts climate change”. Almost all in the 10 focus groups think
that composting and feeding food to animals negates any adverse environmental impact. The qualitative work
affirms that in order to change behaviours, the first step is to ensure all Australians understand that there is a
need to change their own food management behaviours to reduce food waste. The steps include:
1. Generate recognition that food waste is an important environmental issue that needs their personal
attention and focus
2. Generate greater awareness that every household is producing more waste than it needs to (and that
they think they do)
3. Cost the waste for household food managers (to prove it is costing the household a significant sum of
money)
4. Provide tools and education that facilitates new and changed behaviour and reduces food waste
5. Build habits that mean less food waste.
3.3. Food waste situation analysis
The situation analysis derived from analysis of the focus groups shows that there are several factors that mean
achieving a greater focus on food waste is not an impossible task and that right now is an opportune time.
Strengths

11
• Few Australians want to be seen as food wasters. It is not generally acceptable to be seen by others
as wasting food. Many people would intervene if they saw food being wasted and would object to it
in front of others even if the food were being wasted in someone else’s home. There is not a
fundamental opposition to wasting less food and this is a very positive starting point.
• Furthermore, in a COVID-19 world, many Australians have had time to focus on food and to think more
about their knowledge, skill set, what food is better for them etc. Where food is often a chore in a
busy world, over the last year, food has been more pleasurable for many.
• There was also greater interest in “what really matters” and this has come to include their
relationships with family and friends, a rising concern for the environment and how food waste
contributes to climate change.
• Moreover, stagnant wages growth for 80% of Australians over the last two or more decades means
food affordability matters more and this links to a need to reduce the food that is wasted.
While there are some situational factors working in favour of a greater focus on food waste, there are also
some very significant barriers to success. These will require energy and effort to challenge the entrenched
views of people’s perceived reality.
Weaknesses
• Most people underestimate their food waste with almost all believing that their own personal
household food waste is relatively minimal. Most believe they personally don’t have a problem!
• People define food waste differently (many don’t know exactly what it is and what are the elements
of food waste).
• Therefore, the need for them to change their personal food waste behaviours is almost non-existent.
In behavioural change terms the need recognition for any change is low and, without it, few will look
for help to change their behaviour.
• Knowledge of the link between food waste and environmental damage is confused and focuses on
reducing landfill and not on minimising CO2 emissions generated through the food supply chain.
Many in the focus groups did not want to waste money and clearly there is an opportunity to calculate the
average value of food waste and promote it to the Australian community. This will help get some attention on
the problem, but for many, this message will bypass them. For many wealthy Australians (and a key food waste
target), the cost of the wasted food is less important than the cost of their time to address the problem.
Similarly, busy families (another key food waste target) are simply overwhelmed by the scope of their
responsibilities and cannot find time to address the problem. The key to encouraging changed behaviours in
12
both audiences are simple tools, information, storage, education on ‘use by’ and ‘best by’ dates and other
initiatives that facilitate changed behaviours.
Opportunities
• To stimulate need recognition by emphasising the dollar value of food wasted
• To stimulate action by promoting knowledge of food waste and its impact on climate change
• Provide tools that assist change in food waste generation.
It was apparent in the focus group discussions that people presently have some time and energy to focus on
important issues like the environment and on food waste. However, this is unlikely to last as people revert to
more normal lives post COVID-19. Instead, food waste practitioners will be faced with a world overloaded with
information and even greater competition for the attention of food managers.
Threats
• COVID-19 was a short term opportunity and soon people will return to a frenetic lifestyle where food
waste matters less
• In an attention-declining world, food waste will struggle to get its messages to the wealthy and busy
families that need to reduce wasted food
3.4. Model of change
The qualitative research revealed that change will need a number of elements and that these elements will
need to be staged.
The following figure illustrates the challenges facing food waste practitioners:
13
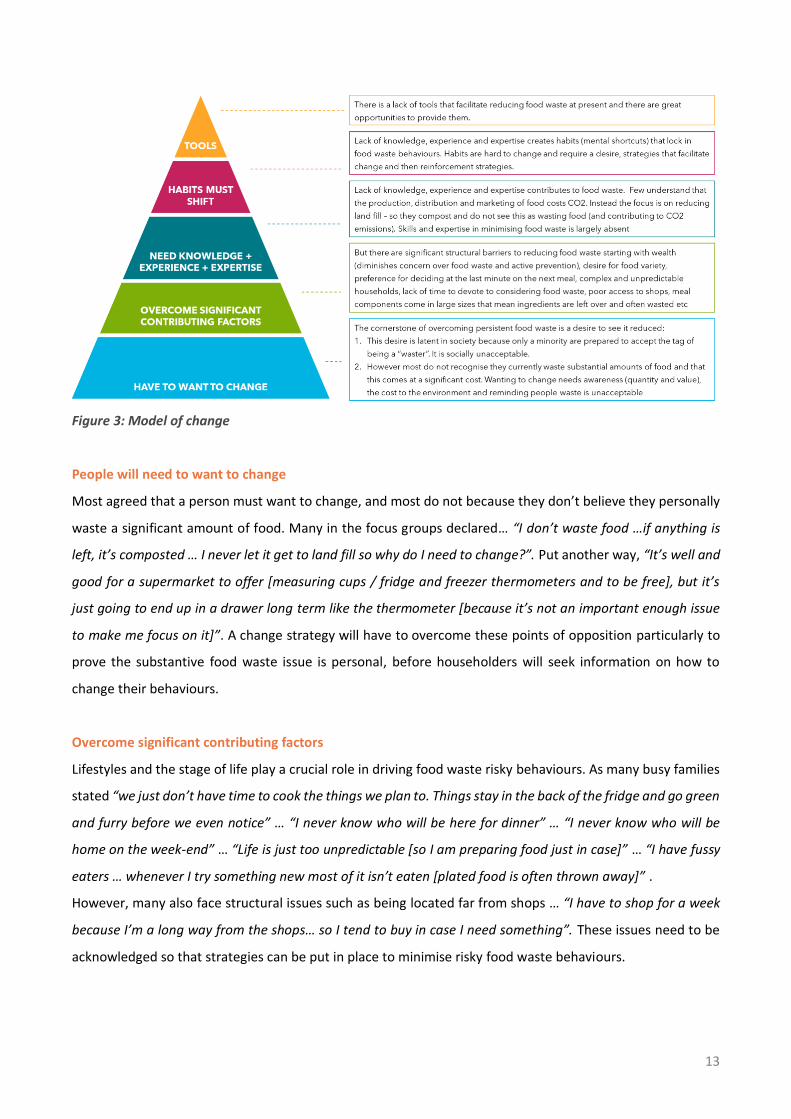
Figure 3: Model of change
People will need to want to change
Most agreed that a person must want to change, and most do not because they don’t believe they personally
waste a significant amount of food. Many in the focus groups declared… “I don’t waste food …if anything is
left, it’s composted … I never let it get to land fill so why do I need to change?”. Put another way, “It’s well and
good for a supermarket to offer [measuring cups / fridge and freezer thermometers and to be free], but it’s
just going to end up in a drawer long term like the thermometer [because it’s not an important enough issue
to make me focus on it]”. A change strategy will have to overcome these points of opposition particularly to
prove the substantive food waste issue is personal, before householders will seek information on how to
change their behaviours.
Overcome significant contributing factors
Lifestyles and the stage of life play a crucial role in driving food waste risky behaviours. As many busy families
stated “we just don’t have time to cook the things we plan to. Things stay in the back of the fridge and go green
and furry before we even notice” … “I never know who will be here for dinner” … “I never know who will be
home on the week-end” … “Life is just too unpredictable [so I am preparing food just in case]” … “I have fussy
eaters … whenever I try something new most of it isn’t eaten [plated food is often thrown away]” .
However, many also face structural issues such as being located far from shops … “I have to shop for a week
because I’m a long way from the shops… so I tend to buy in case I need something”. These issues need to be
acknowledged so that strategies can be put in place to minimise risky food waste behaviours.

14
Need knowledge + experience + expertise
Some people report having never been taught how to cook, or their parents didn’t drill into them the need to
finish everything on their plate when they were young. As some outlined … “My mother did everything for me
when it came to food … I am totally unprepared to deal with preparing meals” … and they often recognised
their lack of knowledge and ability by saying that “other people [in the group] seem to know so much about
how to substitute and use ingredients in different ways … I have no idea at all”. Hearing how others manage
food and are able to avoid waste triggered an interest in many. Simple practical tips that are easy to remember
are a way of stimulating better behaviours.
Habits must shift
At the heart of the challenge is that food is a low order issue for many. Many report being extremely busy
(especially families with younger children) and that “we would never think what we were going to do for a
meal next Monday … we need to get into the habit of thinking ahead … and planning ahead.” However, they
also acknowledge the difficulties of changing entrenched food planning, purchasing, and preparing habits.
“this kind of change will take some effort because we are just not used to thinking about meals … we are in
auto pilot most of the time.”
Tools
Once need for change is triggered it isn’t attitudes that need to change; it is behaviours. Most focus group
participants found tools that make change easier to be appealing. “I’d love [an app that suggests meals you
can make with ingredients, tells you what’s in the fridge and when things are going to go off]. It would definitely
assist me”. They emphasised the need for ease and convenience … “It needs to be easy though … it wouldn’t
work if I have to spend more time entering all the food in my fridge and their expiry dates into the app”.
4. Overall findings from the quantitative studies
4.1. Food waste volume and cost outcomes
When compensating for food disposed of in the home, the data showed that 4.22 kg of food was wasted per
household per week. The conversion figure from the electronic-diary to the physical bin audit was a factor of
1.46 (i.e., the electronic-diary accounted for 68% of the food waste found in the bin. See Assumptions for in-
home food disposal compensation in Figure 4). When adjusted for the number of people in the household, the
data showed that 1.88 kg of food was wasted per person per week.
15
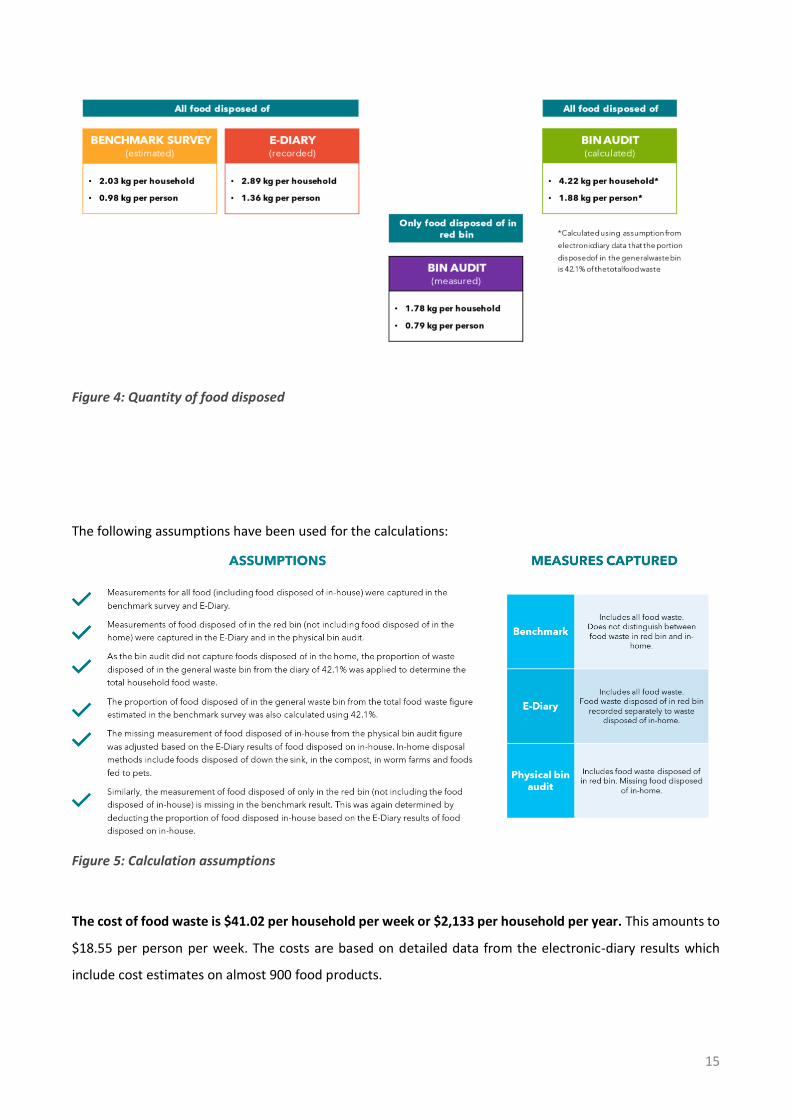
Figure 4: Quantity of food disposed
The following assumptions have been used for the calculations:
Figure 5: Calculation assumptions
The cost of food waste is $41.02 per household per week or $2,133 per household per year. This amounts to
$18.55 per person per week. The costs are based on detailed data from the electronic-diary results which
include cost estimates on almost 900 food products.

16
Figure 6: Value of food disposed
The sample comprised 53.9% of respondents who were the main household food manager planning for food
shopping; doing the food shopping; unpacking and storing the food; doing the food preparation including
cooking and disposing of food not eaten. The remaining 46.1% were only partly responsible for some of these
roles in the household.
The two groups were quite different in the roles they played in food management, their knowledge of what
occurred across many of the household food management roles including knowing about all the food waste
that may be generated. Nevertheless, they were actively engaged, albeit to a lesser extent in the production
of food waste, and their views matter.
The following chart highlights significant differences in the food waste estimates, electronic-diary records and
the physical bin audits of their household bins.
While the physical bin audits showed little difference between the main household food manager and the
joint household food managers (2.26 and 2.67 respectively), the electronic-diary records told a different story.
In these, the main food managers recorded 1.06 kg per household per week in the electronic-diary, and the
joint food manager recorded 2.22 kg of food waste per household per week. This high quantity of food waste
was not reflected in the physical bin audit suggesting that the joint food mangers food volume estimates were
higher than the amount of food waste produced and therefore more inaccurate. However, the results for food
waste put directly into the red bin by the main household food manager did not align well with the bin audit
and revealed a large discrepancy (2.26 kg per and not the 1.06kg recorded in the electronic-diary. In contrast
the results from the joint household food managers were much closer (2.67 kg in the audit and 2.22 kg in the
electronic-diary).

17
Figure 7: Food waste measures
When comparing the three studies, the quantity of food waste increased from 2.02 kg per household in the
benchmark (0.98 kg per person) relying on an individual’s estimate, to 2.89 kg as recorded in the electronic-
diary over a 7-day period (1.36 kg per person), to 4.22 kg per household (1.88 kg per person) as weighed in
the physical bin audit (and weighted by the proportion of food disposed of outside the red bin as recorded in
the electronic-diary).
Figure 8: Comparisons of food waste across the three food waste measures
According to the physical bin audits, the largest proportion of food waste was inedible food waste that is
possibly avoidable and unavoidable (1.83 kg per household or 0.81 kg per household per person). This includes

18
anything inedible such as peels, skins, bones, shells, cores, and stems. The four other main forms of food waste
are: fresh vegetables (0.50 kg per household or 0.23kg per person); food prepared at home (0.50 kg per
household or 0.21kg per person); bread and bakery (0.39 kg per household or 0.16 kg per person); and then
fresh fruit (0.36 kg per household or 0.17 kg per person).
4.2. Conversion factor electronic-diary to bin audit results for only red bin data
Given that physical bin audits will be rarely undertaken given the high costs involved, a key outcome of this
study was to calculate the conversion factor from electronic-diary to physical bin audit. These costs are likely
to be magnified as more green and FOGO bins are given to households and a measurement of food waste will
require checking red as well as green and FOGO bins.
Figure 9: Electronic diary conversion factor
The conversion factor for foods recorded as being disposed of in the red bin on the electronic-diary compared
with the physical red bin audit overall is 1.38.
5. Food waste volumetric outcomes – benchmark survey
The food waste study started with a regular online survey called the benchmark study. In this initial online
survey respondents estimated the food they wasted. Essentially this was a guess and the results show food
managers estimating their food waste at 2.03 kg per household on average across Australia. This is significantly
lower than the quantities measured in the electronic-diary (2.89 kg per household) and estimated total (4.22
kg per household. This being bin audit and adding additional amounts from fed to pets, put in home compost
bin, and down the sink). As has long been suspected, individuals significantly underestimate the quantity of
food waste. The food waste estimate is highest in the ACT at 2.88 kg per household and lowest in Tasmania at
1.43 kg per household.
The breakdown in food waste while being much lower than other measures, has a similar pattern regarding
the types of food waste that is most prominent. According to the estimate of individual food managers, the
largest proportion of food waste is inedible food waste that is possibly both avoidable and unavoidable (0.66
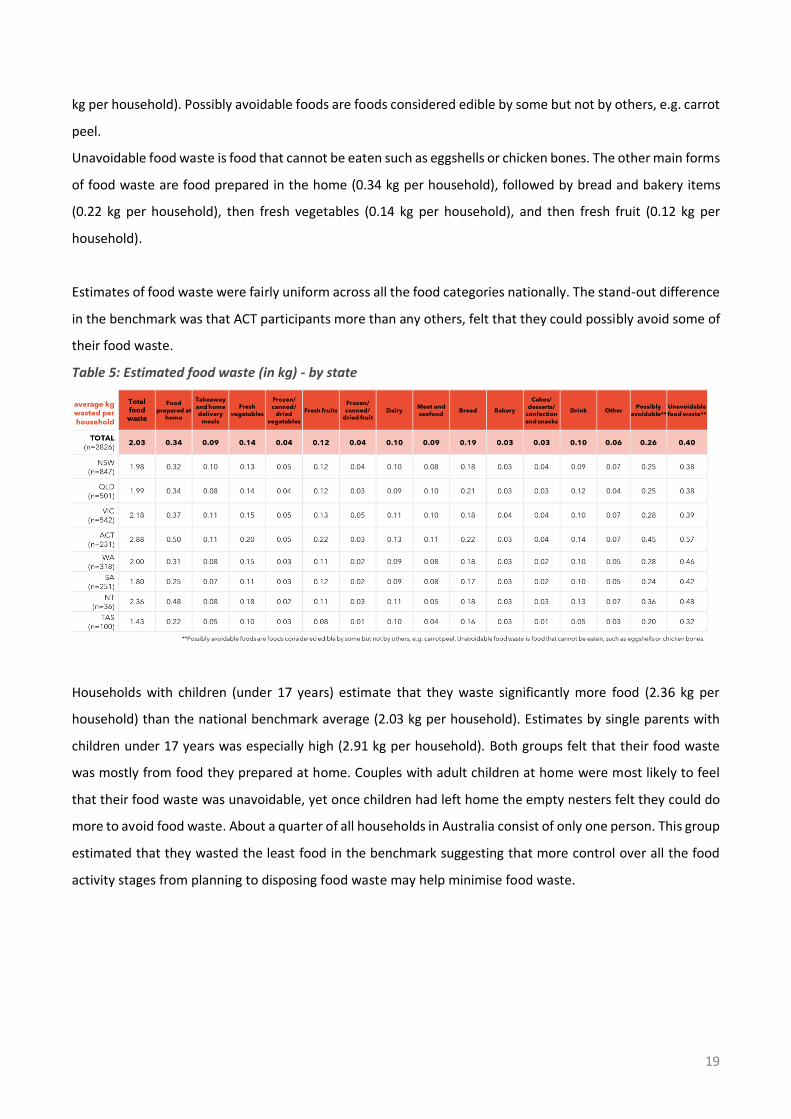
19
kg per household). Possibly avoidable foods are foods considered edible by some but not by others, e.g. carrot
peel.
Unavoidable food waste is food that cannot be eaten such as eggshells or chicken bones. The other main forms
of food waste are food prepared in the home (0.34 kg per household), followed by bread and bakery items
(0.22 kg per household), then fresh vegetables (0.14 kg per household), and then fresh fruit (0.12 kg per
household).
Estimates of food waste were fairly uniform across all the food categories nationally. The stand-out difference
in the benchmark was that ACT participants more than any others, felt that they could possibly avoid some of
their food waste.
Table 5: Estimated food waste (in kg) - by state
Households with children (under 17 years) estimate that they waste significantly more food (2.36 kg per
household) than the national benchmark average (2.03 kg per household). Estimates by single parents with
children under 17 years was especially high (2.91 kg per household). Both groups felt that their food waste
was mostly from food they prepared at home. Couples with adult children at home were most likely to feel
that their food waste was unavoidable, yet once children had left home the empty nesters felt they could do
more to avoid food waste. About a quarter of all households in Australia consist of only one person. This group
estimated that they wasted the least food in the benchmark suggesting that more control over all the food
activity stages from planning to disposing food waste may help minimise food waste.

20
Table 6: Estimated food waste (in kg) - by household structure
Those aged 35–54 years thought that they wasted the most food (2.29 kg per household compared to national
average 2.03). Households with children under 17 years were mainly in this age group so this aligned with the
higher food waste reported earlier. Older participants (55–74 years) thought they wasted less food (1.75 kg
per household) and were more likely to think waste could be avoided. The same pattern appeared in many
food categories with takeaway/home delivery food waste showing the most difference between younger and
older age groups. Those aged 18–34 years reported 0.15 kg of waste while those aged 75 and older report
0.03 kg per household.
Table 7: Estimated food waste (in kg) - by age
According to estimates of food waste, it is those on average household incomes who reported most food
waste (2.28 kg per household compared to the national average of 2.03 kg per household). The lowest food
waste volume was reported by those with no income (1.64 kg per household and 1.81 kg per person by those
earning $1-$999 household income per year. The physical bin auditing and electronic-diary results shows those
with the higher household income are least accurate in their estimated food waste.

21
Table 8: Estimated food waste (in kg) - by income
Food waste is disposed of in many ways other than the red bin, with 47% of households tipping some food
waste down the sink (sometimes to almost every time); 37% placing waste in the green waste bin; 36% feeding
some food to animals; 30% composting waste and 12% putting food waste in their worm farm.
Figure 10: Food disposal methods
6. Food waste outcomes from the electronic-diary

22
The electronic-diary data which includes food disposed of through all means shows that 2.89 kg of food is
wasted per household per week, or 1.36 kg wasted per person per week.
Figure 11: Food waste and value (includes all food disposed of) - by total sample
The electronic-diary data shows 1.28 kg of food is disposed on in the red bin per household per week. This
amount does not include food disposed of via other means such as fed to pets, put in home compost bin/worm
farm, or tipped down the sink.
Figure 12: Food waste and value (only food disposed of in red bin) - by total sample
23
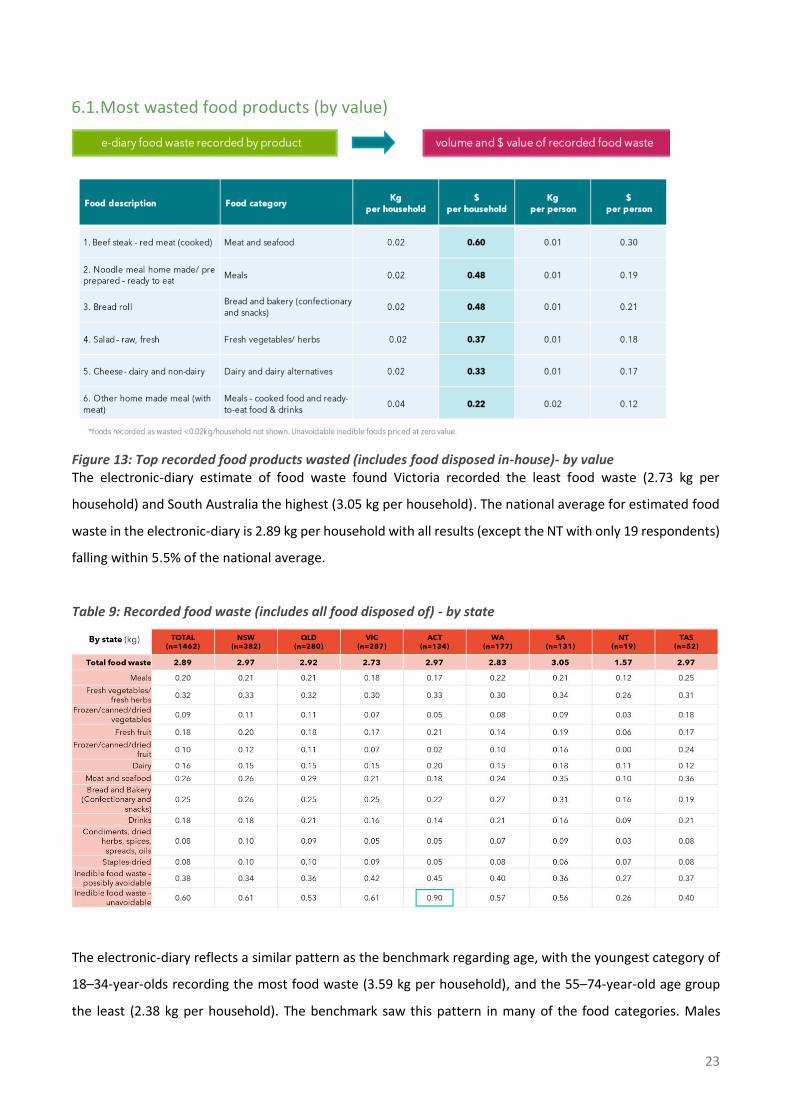
6.1. Most wasted food products (by value)
Figure 13: Top recorded food products wasted (includes food disposed in-house)- by value The electronic-diary estimate of food waste found Victoria recorded the least food waste (2.73 kg per
household) and South Australia the highest (3.05 kg per household). The national average for estimated food
waste in the electronic-diary is 2.89 kg per household with all results (except the NT with only 19 respondents)
falling within 5.5% of the national average.
Table 9: Recorded food waste (includes all food disposed of) - by state
The electronic-diary reflects a similar pattern as the benchmark regarding age, with the youngest category of
18–34-year-olds recording the most food waste (3.59 kg per household), and the 55–74-year-old age group
the least (2.38 kg per household). The benchmark saw this pattern in many of the food categories. Males
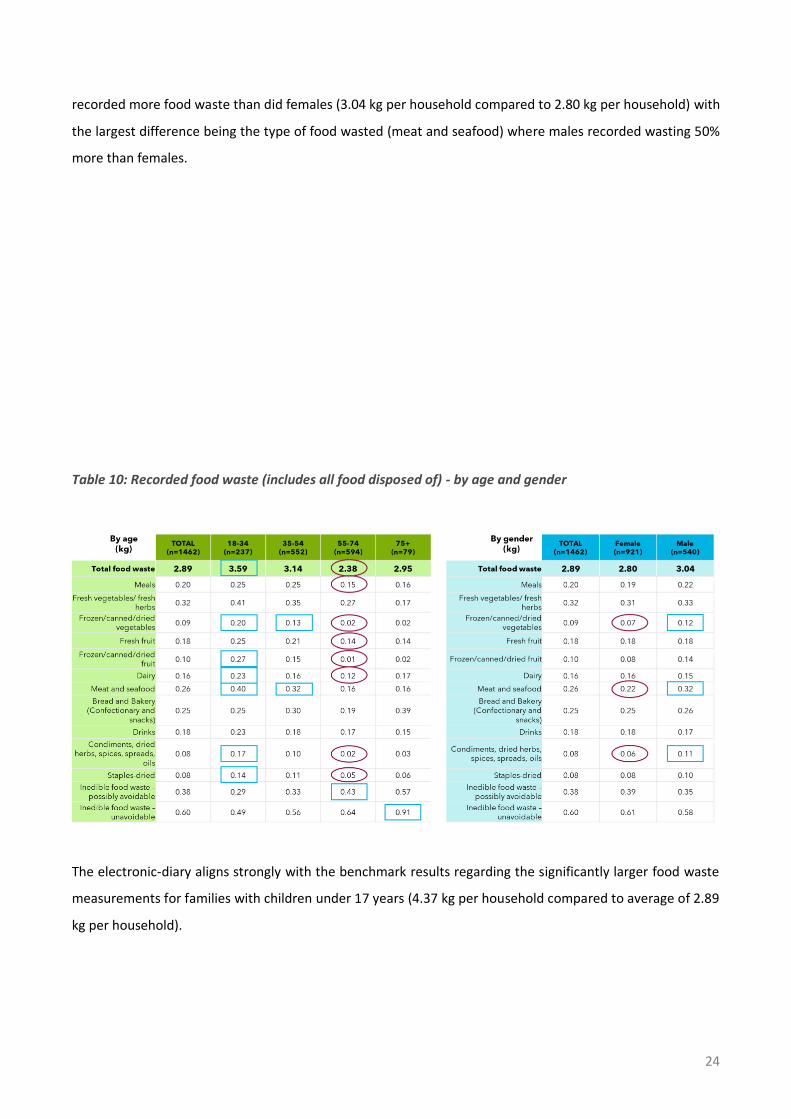
24
recorded more food waste than did females (3.04 kg per household compared to 2.80 kg per household) with
the largest difference being the type of food wasted (meat and seafood) where males recorded wasting 50%
more than females.
Table 10: Recorded food waste (includes all food disposed of) - by age and gender
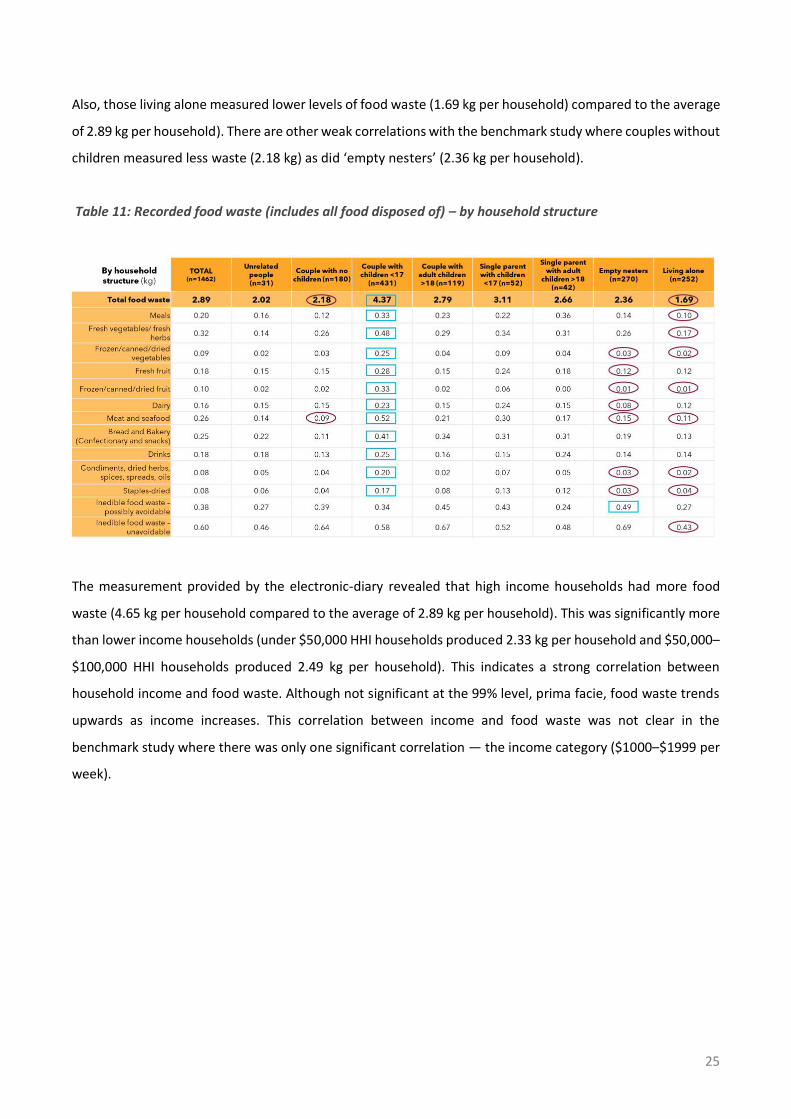
The electronic-diary aligns strongly with the benchmark results regarding the significantly larger food waste
measurements for families with children under 17 years (4.37 kg per household compared to average of 2.89
kg per household).
25
Also, those living alone measured lower levels of food waste (1.69 kg per household) compared to the average
of 2.89 kg per household). There are other weak correlations with the benchmark study where couples without
children measured less waste (2.18 kg) as did ‘empty nesters’ (2.36 kg per household).
Table 11: Recorded food waste (includes all food disposed of) – by household structure
The measurement provided by the electronic-diary revealed that high income households had more food
waste (4.65 kg per household compared to the average of 2.89 kg per household). This was significantly more
than lower income households (under $50,000 HHI households produced 2.33 kg per household and $50,000–
$100,000 HHI households produced 2.49 kg per household). This indicates a strong correlation between
household income and food waste. Although not significant at the 99% level, prima facie, food waste trends
upwards as income increases. This correlation between income and food waste was not clear in the
benchmark study where there was only one significant correlation — the income category ($1000–$1999 per
week).
26
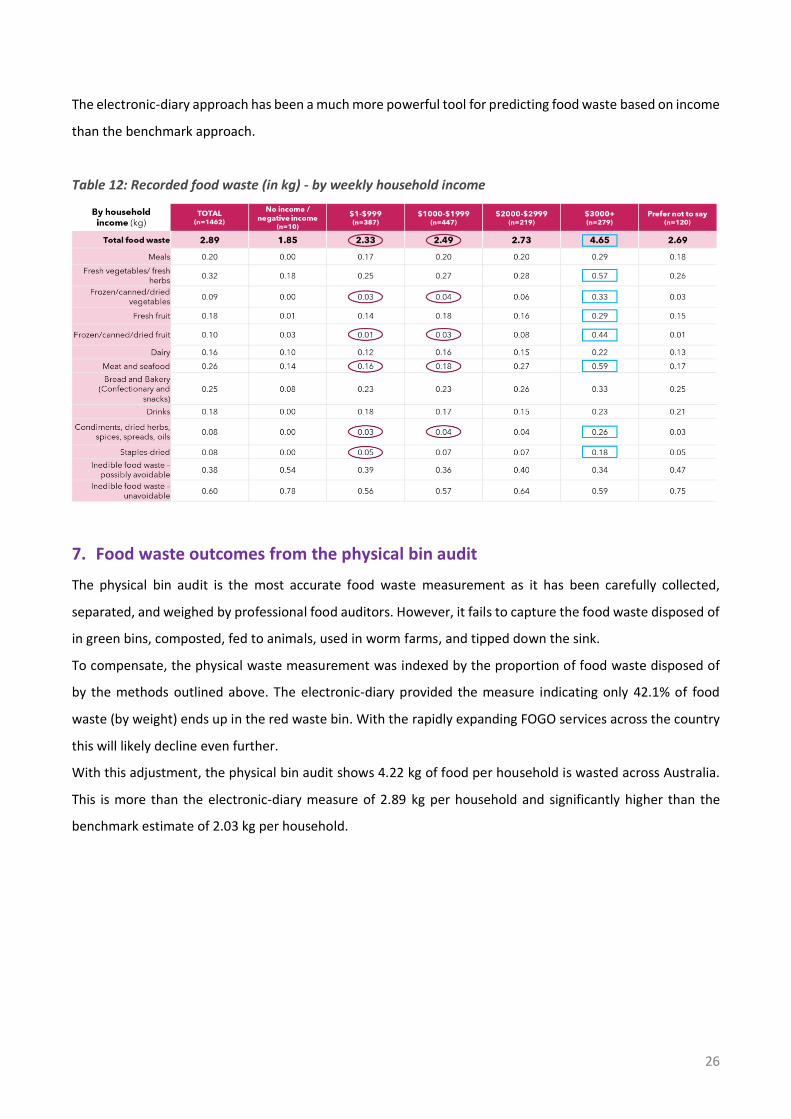
The electronic-diary approach has been a much more powerful tool for predicting food waste based on income
than the benchmark approach.
Table 12: Recorded food waste (in kg) - by weekly household income
7. Food waste outcomes from the physical bin audit
The physical bin audit is the most accurate food waste measurement as it has been carefully collected,
separated, and weighed by professional food auditors. However, it fails to capture the food waste disposed of
in green bins, composted, fed to animals, used in worm farms, and tipped down the sink.
To compensate, the physical waste measurement was indexed by the proportion of food waste disposed of
by the methods outlined above. The electronic-diary provided the measure indicating only 42.1% of food
waste (by weight) ends up in the red waste bin. With the rapidly expanding FOGO services across the country
this will likely decline even further.
With this adjustment, the physical bin audit shows 4.22 kg of food per household is wasted across Australia.
This is more than the electronic-diary measure of 2.89 kg per household and significantly higher than the
benchmark estimate of 2.03 kg per household.

27
Figure 14: Food waste from the bin audit and estimate for total food waste
7.1. Food waste result between recorded and physical bin audit (only food
disposed of in red bin)
*For those who did the physical bin audit. Base: Total n=495 Note: Food given to animals, tipped down the drain, put into compost/ worm farm or put in green waste/organics bin were not included in this food waste calculation for comparison.
Figure 15: Food waste result between recorded in electronic-diary and physical bin audit (only food disposed of in red bin)

28
The physical bin auditing process did not highlight any significant differences in food waste appearing in the
red bins between the states/territories in any of the key food categories (at the 99% confidence level). The
highest measure of food waste was in New South Wales at 1.88 kg per household and the lowest was in
Western Australia with 1.70 kg per household, closely followed by Victoria with 1.71 kg per household.
However, the variation across the states and territories is low with 5.6% more waste than the average in the
case of NSW and 5.6% less than the average in the case of Western Australia.
Table 13: Recorded food waste via bin audit (in kg) - by state
The bin auditing process did reveal differences by age in the amount of food waste appearing in the red bin
with the 35–54-year-old category having more food waste than the average (2.16 kg per household) and the
55–74-year-old category producing less food waste than the average (1.42 kg per household).
The bin auditing process did not highlight any significant differences (99% confidence level) in food waste
quantity between gender, nor in any of the key food categories. The only exception was in inedible food waste
where females were more likely to report lower waste levels than males (0.67 kg per household compared to
0.96 kg per person for males).
29
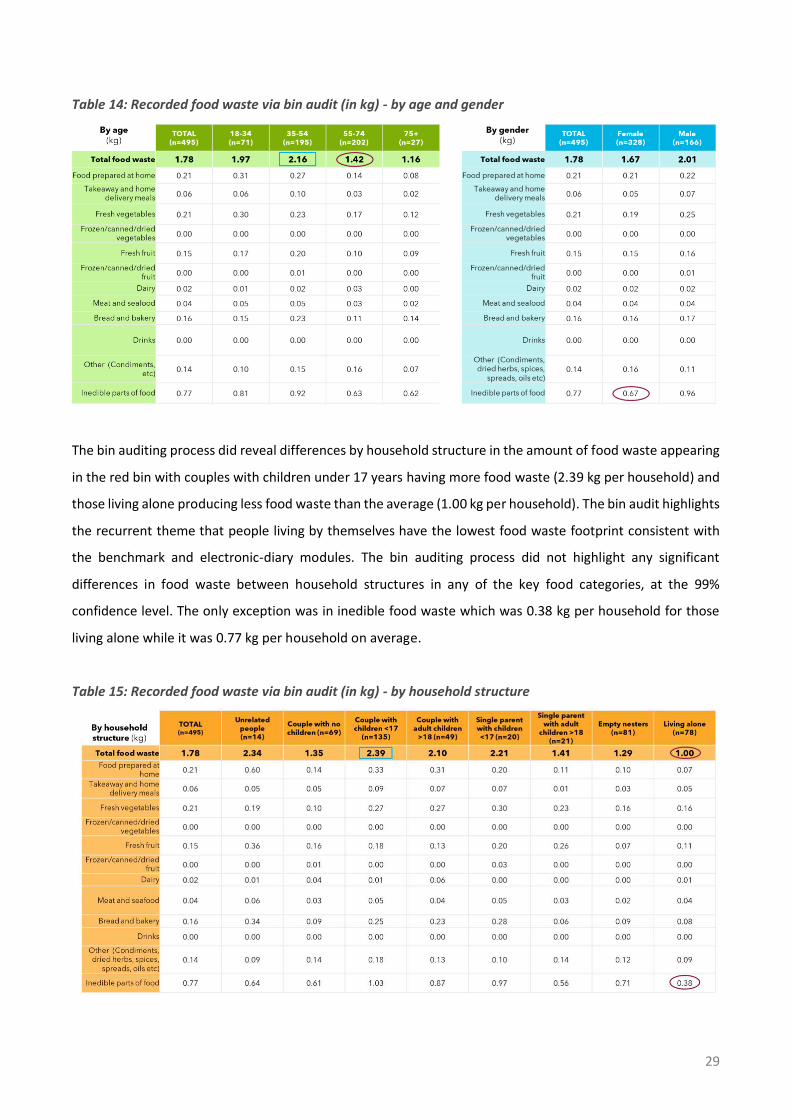
Table 14: Recorded food waste via bin audit (in kg) - by age and gender
The bin auditing process did reveal differences by household structure in the amount of food waste appearing
in the red bin with couples with children under 17 years having more food waste (2.39 kg per household) and
those living alone producing less food waste than the average (1.00 kg per household). The bin audit highlights
the recurrent theme that people living by themselves have the lowest food waste footprint consistent with
the benchmark and electronic-diary modules. The bin auditing process did not highlight any significant
differences in food waste between household structures in any of the key food categories, at the 99%
confidence level. The only exception was in inedible food waste which was 0.38 kg per household for those
living alone while it was 0.77 kg per household on average.
Table 15: Recorded food waste via bin audit (in kg) - by household structure

30
The correlation between household income and food waste is evident in the bin audit as can be seen in the
upward trending food waste numbers with income. They rise from 1.33 kg of food waste per household with
those earning under $50,000 HHI per annum through to 2.27 kg per household for those earning $100,000 -
$150,000 HHI per annum.
Table 16: Recorded food waste via bin audit (in kg) - by weekly household income
8. What behaviours are linked to food waste?
Regression analysis (using a one-way ANOVA model) was undertaken on the electronic-diary data to establish
if there were any relationships between the behaviours measured in the benchmark data and the food waste
recorded in the electronic-diary.
The dependent variable was the amount of food waste classified as very low (less than 1kg per household),
low (1.99–1.99 kg per household), medium (2.00–3.99 kg per household) and high (anything over 4.00 kg per
household).

31
Figure 16: Classification of very low to high food wasters
In the food planning behaviours, there was a relationship with “checking what food is already in the
fridge/freezer” and lower food waste. As people reported doing this less, they produced more food waste.
Getting people to review what they already have in the fridge and freezer before shopping is the first step in
reducing food waste.
Figure 17: Food planning relationships with level of food waste
When it came to buying food, there were two behaviours that were measured in the benchmark study that
linked to high food waste. Buying food ‘just in case’ had a positive relationship with high food waste, whereas
only buying what was on the shopping list was linked to lower food waste. Getting people to only buy what
they need and avoid buying what is deemed ‘just in case’ will likely lower food waste.

32
Figure 18: Food purchasing and its relationships with level of food waste
Storing food matters to the amount of food waste generated. Those who find it “hard to fit food into the fridge
and/or freezer because it’s already full” have high levels of food waste. Similarly, those who “put food in the
refrigerator/freezer” (rather than the freezer) are more likely to have high levels of food waste. Overall, those
who “read the storage information on packaging” produce less food waste, although there is a group who
perhaps view the storage instructions too strictly and throw away anything risky who also produce extremely
high levels of food waste. Finally, those who practice food rotation produce less food waste.
Figure 19: Food storage and its relationships with level of food waste
The way people prepare food can impact the amount of food waste markedly. There is a group who “prepare
extra food to be eaten later on” who are high food wasters. Those who have no plan to store or eat later on
are also likely to be high food wasters. Those who let others serve themselves are high food wasters. Those
who try to use up the oldest food first are low food wasters, as are those who only prepare as much as needed.

33
Figure 20: Food preparation and its relationships with level of food waste
However, the strongest relationships are found between food waste and household food management
behaviours. Where food management skills, knowledge and expertise are lacking, food waste increases
markedly.
This includes not knowing:
• how to use cooked leftovers
• how to use leftover uncooked ingredients
• how much food to buy
• whether the food is safe to eat and how to use ‘use by’ or ‘best before’ dates.
The analysis shows that the amount of food waste is also compounded by the complexities of modern life such
as:
• last minute changes in plans
• not preparing the food that was planned, often because of last minute changes to the number of
people eating, dietary preferences etc.

34
Figure 21: Food disposal and its relationships with level of food waste
9. What interventions might reduce food waste?
Three discrete choice modelling experiments were conducted testing sets of interventions, tailored to each
individual’s core behavioural weaknesses in the areas of:
• planning and shopping for food
• storing food
• preparing and disposing of food.
Respondents were asked to choose whether this group or bundle of activities, if they were available, would
help them when planning and shopping and reduce the need to dispose of food. In all cases, the base case was
where there were no interventions. Interestingly, some respondents believed they were helped to reduce
food waste just by having the issue brought to their attention.
Respondents were asked, “If this group of activities were available, do you think they would assist you when
planning and shopping to dispose of less food?”
35
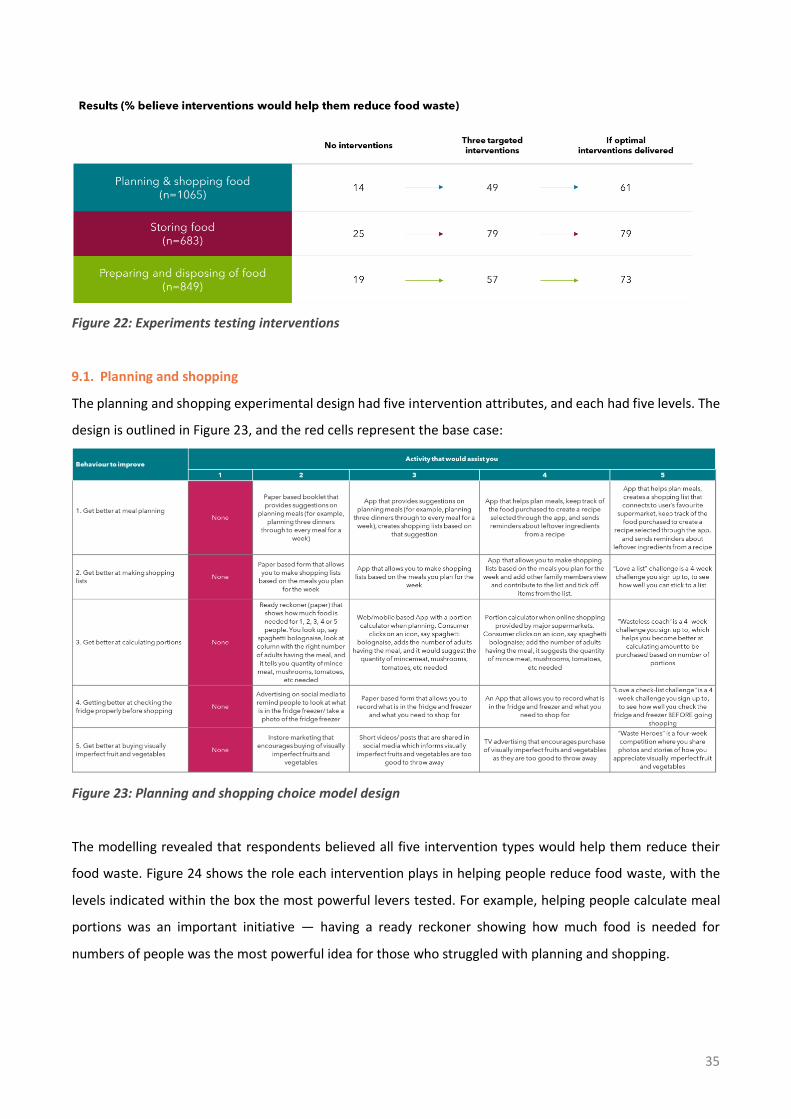
Figure 22: Experiments testing interventions
9.1. Planning and shopping
The planning and shopping experimental design had five intervention attributes, and each had five levels. The
design is outlined in Figure 23, and the red cells represent the base case:
Figure 23: Planning and shopping choice model design
The modelling revealed that respondents believed all five intervention types would help them reduce their
food waste. Figure 24 shows the role each intervention plays in helping people reduce food waste, with the
levels indicated within the box the most powerful levers tested. For example, helping people calculate meal
portions was an important initiative — having a ready reckoner showing how much food is needed for
numbers of people was the most powerful idea for those who struggled with planning and shopping.
36
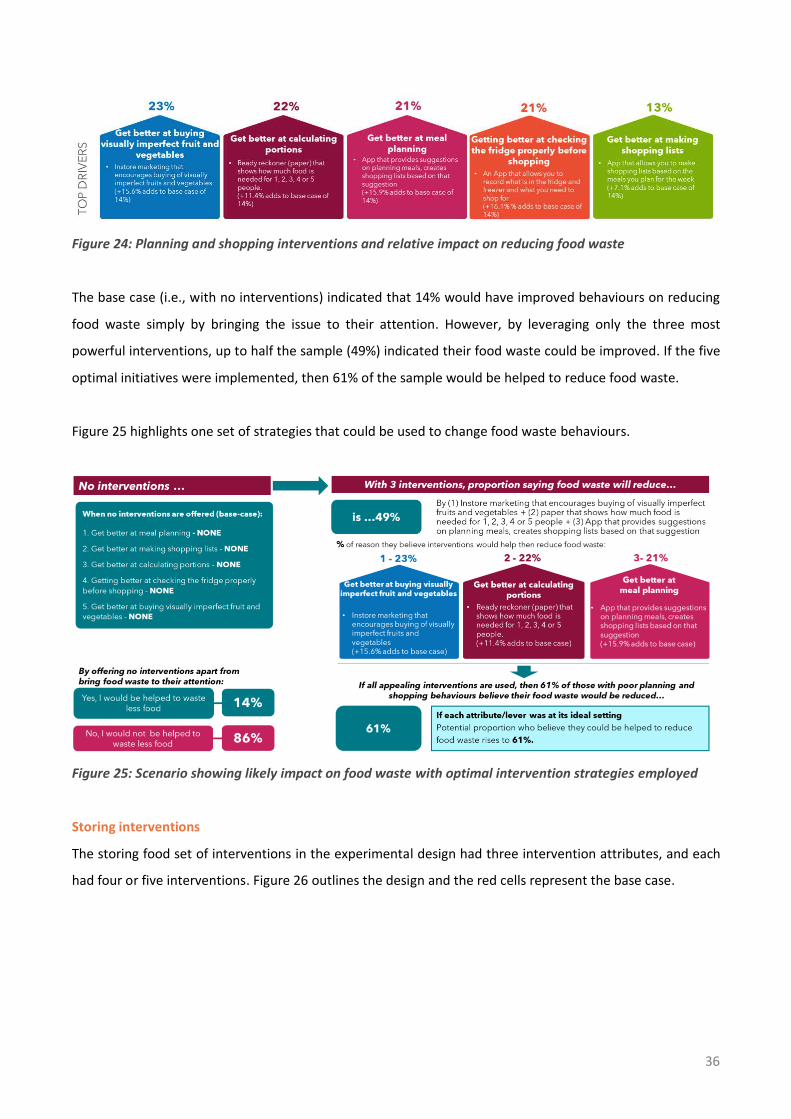
Figure 24: Planning and shopping interventions and relative impact on reducing food waste
The base case (i.e., with no interventions) indicated that 14% would have improved behaviours on reducing
food waste simply by bringing the issue to their attention. However, by leveraging only the three most
powerful interventions, up to half the sample (49%) indicated their food waste could be improved. If the five
optimal initiatives were implemented, then 61% of the sample would be helped to reduce food waste.
Figure 25 highlights one set of strategies that could be used to change food waste behaviours.
Figure 25: Scenario showing likely impact on food waste with optimal intervention strategies employed
Storing interventions
The storing food set of interventions in the experimental design had three intervention attributes, and each
had four or five interventions. Figure 26 outlines the design and the red cells represent the base case.
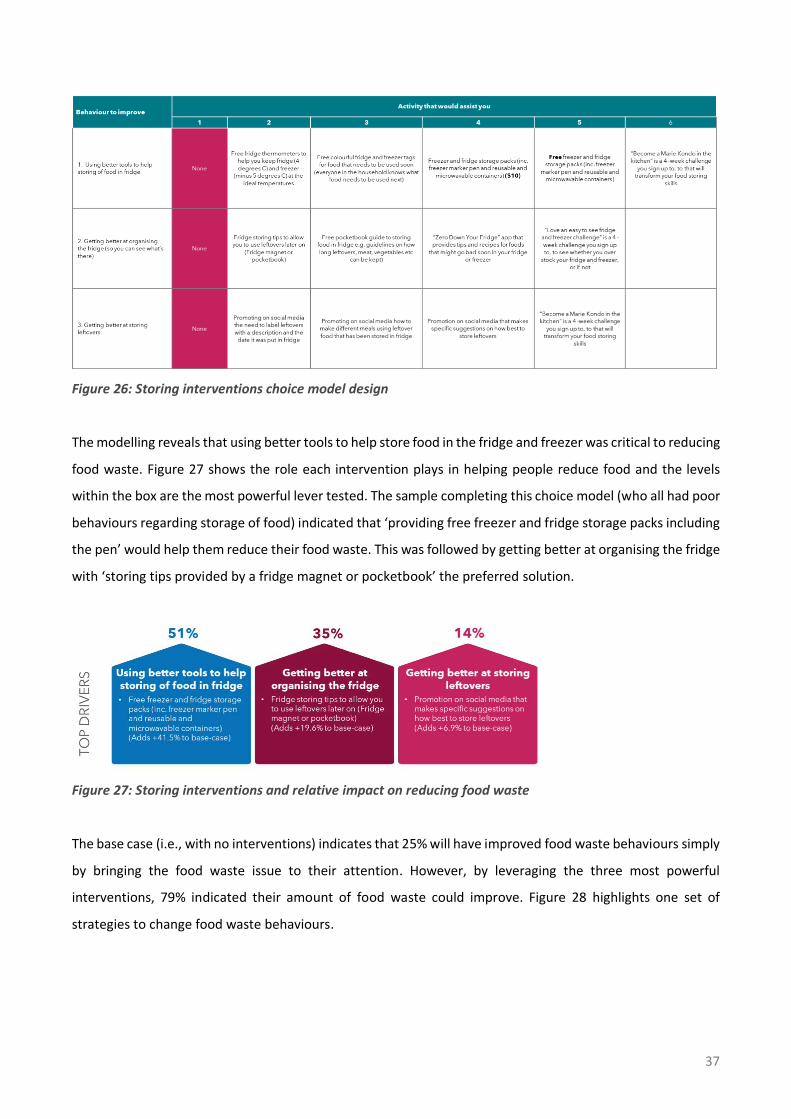
37
Figure 26: Storing interventions choice model design
The modelling reveals that using better tools to help store food in the fridge and freezer was critical to reducing
food waste. Figure 27 shows the role each intervention plays in helping people reduce food and the levels
within the box are the most powerful lever tested. The sample completing this choice model (who all had poor
behaviours regarding storage of food) indicated that ‘providing free freezer and fridge storage packs including
the pen’ would help them reduce their food waste. This was followed by getting better at organising the fridge
with ‘storing tips provided by a fridge magnet or pocketbook’ the preferred solution.
Figure 27: Storing interventions and relative impact on reducing food waste
The base case (i.e., with no interventions) indicates that 25% will have improved food waste behaviours simply
by bringing the food waste issue to their attention. However, by leveraging the three most powerful
interventions, 79% indicated their amount of food waste could improve. Figure 28 highlights one set of
strategies to change food waste behaviours.

38
Figure 28: Scenario showing likely impact on food waste with optimal intervention strategies employed
Preparing and disposing
The preparing food and disposing of food set of interventions experimental design had five intervention
attributes and each had five levels. Figure 29 outlines the design and the red cells represent the base case.
Figure 29: Preparing and disposing interventions choice model design
The modelling reveals ‘learning how to use leftover food better’ is important for reducing food waste. Figure
30 shows the role each intervention plays in helping people prepare and dispose of food and the levels within
the box are the most powerful lever tested. The sample completing this choice model (who all had poor
behaviours regarding preparing food and disposing of food) indicated that ‘an app that suggests planning

39
meals with ingredients that can be used in more than one meal’ would help reduce their food waste. This is
followed by getting better at calculating portions when preparing a meal using a ‘paper poster that shows how
much food to cook for certain number of people’ as the preferred solution.
Figure 30: Interventions and relative impact on reducing food waste
While a small number (19%) claimed just bringing the issue to their attention would help them reduce food
waste, by leveraging the three most powerful interventions, 57% say their food waste will be improved. If all
five optimal levers are used, then 73% of those who did the experiment indicate a positive outcome on their
food waste quantity. Figure 31 highlights one set of strategies to change food waste behaviours.
Figure 31: Scenario showing likely impact on food waste with optimal intervention strategies employed
40
10.Future research considerations
There are a number of critical considerations for future research. These include, in order of importance:
• Providing electronic kitchen scales in conjunction with the electronic-diary will markedly improve the
accuracy of food waste records (estimating weight by using eight by cups is particularly problematic
for food with awkward shapes). Standard Cup Measures (SCMs) were not available for most inedibles
(stems, stalks, bones, fat trimming etc).
• Valuing inedibles needs to be handled in a more systematic way. In this report possibly-avoidable
inedibles have been costed at the same cost as the fresh food and unavoidable food waste has been
valued as zero. A logic for this needs to be developed for future electronic-diary studies as it was out
of scope for this study.
• The electronic-diary could be enhanced with further listings. Especially of complete meals (e.g.
Spaghetti Bolognese, Moussaka). It needs a list of 100–200 commonly prepared meals. Close
substitute products were accepted where information about specific items could not be found. There
is scope to increase the number of items in the electronic-diary even more to make the electronic-
diary costing more accurate.
• It would be better to get an annual average price to better reflect the value of food waste. A better
method for pricing would be beneficial that gathers prices over the year and is able to control for
seasonal variations and specials. (Prices were sourced where possible from the Woolworths price list
or Woolworths online. Online prices were quoted for the Sydney suburb of Pagewood 2035 during
November and December 2020. Coles online and other price sources were referenced when
information was not available on Woolworths online. Woolworths brands were used to indicate price
and weight in preference to non-Woolworths brands where possible. An analysis of average prices for
item categories was beyond the scope of this study.

41
Appendix A – methodological notes
In-home food waste social research survey sample recruitment
Respondents were recruited to complete the benchmark survey initially and were asked to consent to being
recontacted for an electronic-diary, and bin audit, if applicable. They were informed of the additional phases
of the research before commencing the survey, then in greater detail after completing it in order to collect
information to recontact them. All respondents recruited gave informed consent to participate in the project
and were entitled to discontinue the research project at any point, should they wish to.
This information included:
• First and last name
• Email address
• Postcode
• Suburb
• State
• Residential address (if applicable for the bin audit. SA, Tas and NT excluded.)
The respondents were recruited from the following:
Instinct and Reason:
Instinct and Reason send out invitations to participate in research via email to this panel. Interested
respondents clicked through a link on the email to complete the survey on the Lime platform. Instinct and
Reason is ISO 20252:2019 accredited. This certifies that Instinct and Reason meet the internationally
recognised best practice in market, opinion and social research. Instinct and Reason adheres to strict privacy
and confidentiality guidelines, and is independently audited for continued commitment to these guidelines.
The Instinct and Reason Privacy Policy can be found: https://www.instinctandreason.com/privacy-policy/
Social media:
Paid Facebook advertisements were posted with a generic royalty-free image of food to grab attention and a
brief description of the project, targeting people by region. Interested Facebook users then clicked through
the advertisement and were taken to the survey on the Lime platform.
Family & friends referral:
Through word of mouth, we invited friends and family to check their eligibility to participate in the research.
Friends and family of Instinct and Reason staff were required to meet the same eligibility criteria as
respondents recruited by other means, and were not given any additional information or insights into the
research that would bias their participation. If interested, they were sent a link to complete the survey on
the Lime platform.
Lucid Marketplace:
Respondents in the Lucid database were invited to participate in the study. The survey was hosted by
Instinct and Reason on the Lime platform and monitored by Instinct and Reason staff. The Lucid Marketplace
is an independent, third-party company, operating under their Lucid Quality Program, with data-checking
procedures. The Lucid Marketplace is used solely for market research purposes. No personally identifiable
information is stored in the marketplace, and Lucid adheres to ESOMAR guidelines.
42
TEG Insights: Respondents in the TEG Insights database were invited to participate in the study. The survey was hosted by Instinct and Reason on the Lime platform and monitored by Instinct and Reason staff. TEG Insights provides access to over 1 million consumers for market research, and is part of the wider TEG Propriety Limited group of companies. TEG Insights is ISO accredited under ISO 20252:2019. Department of Environment and Science, Queensland The survey link was shared by the DES to the Queensland mailing list to invite interested members of the community to participate, though this was not a successful strategy in recruiting participants for the study.
Screening questions
The screening questions, as shown in the appendix under the Benchmark survey, screened out those living in
apartments in the bin audit states, and those away from home for more than 3 days in the previous week.
Additionally, respondents were informed of the physical bin audit phase of the research. Due to having specific
criteria to participate, the data could be skewed towards low food wasters willing to have their bins observed.
Electronic diary
• The respondents were asked to complete the diary for 7 consecutive days, and were given additional
time the day after the bin collection to fill in any missed final meals
• The invitation was sent after completing the survey. They were given suggestions to:
o Complete the diary after each meal
o Complete the diary at the end of the day or start of the next day
• The day of the week respondents were invited to the diary varied based on timing for their bin audits,
either based on their set council collection date (provided to us in their benchmark survey), or when
we were sending out a bin auditor to their area. The invitations were usually sent within the week of
finishing the survey.
• The link will work on a computer, tablet or smartphone, though we encouraged the respondents to
fill it out on a computer for optimal viewing
• A link to view visual, downloadable instructions was provided at the start of the diary alongside the
written instructions. The PDF could be accessed again via a pop out window on the first meal of every
day
• The diary date was pre-set to the date it was filled in on to minimise errors and effort required by
respondents
• Some ACT respondents were invited to start on the same day due to bin strikes, and were asked to
start a new bag for the 7-day period, keeping any food disposed of that would usually go in their
general waste bin in this separate bag
Bin audit
The audit process was modified for the ACT for audits commencing from the week of 23rd November 2020
due to truck driver strikes in the territory. The following letter was sent to the Department of Water and
Environmental Regulation in response to a query of concern over the bin strikes affecting the methodology:
43
As a result of the ongoing bin audits after this date, we modified our methodology to ensure any truck
driver strikes did not affect the contents of the bins; we requested that the participants keep any food
they disposed of in a separate bag for the period of the 7 days when they filled out the diary, to be
picked up by the auditors at the end of the week. As such, the contents of the bin bags were not put
out with the general waste bin during regular or modified council collections during the diary week,
and the full contents of the bags were able to be picked up at the end of the week.
instinct and reason will run data checking and data cleaning to remove any participants’ data where
the food waste audited varies significantly differently from the electronic diaries filled out. Additionally,
the bin auditors’ will be consulted to confirm, based on their experience and expertise, that the
contents of the audits were of an expected volume.
We propose to conduct further bin audits in late January or February 2021 to make up any lost sample
that may have been caused by the truck driver strikes.
Analysis
Assumptions
As the food waste recorded in the questionnaire did not ask for specifics on what types of bread were disposed
of, the weight of the bread was converted from slices by calculating the average bread weight from the
electronic-diary bread categories, and converting this into a $ value. The average weight to allocate to a bread
slice for the questionnaire was 0.077 kg per slice.
For the bin audits, the auditors could not visually distinguish between foods in 47 categories, for example
between bread and other baked goods. As such, the 13 categories were used.
Additionally, the bin auditors had an element of discretion; some foods auditors deem as unavoidable food
waste, others may classify as potentially avoidable. This may have led to differences in categorisation.
Considerations for replication of the study:
• Respondents could be informed that some respondents will have their bins audited, or blindly bin
audited to avoid data skew. This could involve explaining the nature of bin audits and the regularity
by which they are undertaken by local councils without residents’ permission or knowledge, and that
a similar thing will be involved in the research. There was a concern amongst those that did not
participate in the research that their bins were being looked through, and the knowledge was lacking
that this was a regular process.
• One diary link – multiple diary links were sent as the diary could not ‘fit’ onto one. If only one is sent,
it would streamline the process, though increase the risk that participants would not click the final link
and complete the choice model
• Automatic email reminders – rather than mail merge, but still appear to be sent “personally” (ensure
it does not get flagged as spam)
• Disclose the name of the commissioning organisation to encourage participation
• Offer a higher incentive that people feel rewards them for their time

44
• Ethics Committee paragraph at end of reminders removed or edited – technical enquiries mistakenly
sent to committee instead of replying to Instinct and Reason
• Consider making a smaller measurement than 1 tablespoon in the quantity dropdown on the diary
Technical data collection and analysis
Significance testing
Significance testing (z-test, t-test and Chi squared test) was used to determine if there is a significant
difference between different variables. It was used to determine if a particular group of respondents have
different attitudes or behaviours of the total population. Using a 99% confidence level is like saying if we
completed this study 100 times, 99 of those studies would result in the same outcome. For scale questions,
nett results like ‘strongly agree and agree’ and ‘strongly disagree and disagree’ were netted in our report for
significance testing. This helps to identify the significant difference at high confidence level (99%) by
summing the separate proportion.
Discrete choice models
The survey also includes an important component using discrete choice modelling to examine responses to a
series of possible set of food waste programs and activities.
Three experiments tested interventions aimed at helping people reduce food waste.
• Planning & shopping
• Storing food
• Preparing and disposing of food
The modelling assists in understanding the key factors which underpin peoples’ decision-making and the likely
outcome.
A traditional survey generally relies on the ‘direct question’ method – asking people to make conscious
decisions and individually assess the importance of certain factors in attracting them to stay or in influencing
them to go. However, in the real-world, people make decisions based on a bundle or combination of certain
things existing and some aspects of the choice can operate at an unconscious level. The traditional survey
would tell us that people (at a conscious level) would prefer their community with all the benefits without
considering the possible trade-offs and relative tipping points that would be made at both a conscious and
unconscious level (e.g., in having certain things less than optimal providing some other things exist). It is
actually hard for people to disentangle consciously and accurately what motivates them to choose one thing
over another (i.e., what actually drives choice).
A choice experiment overcomes these problems. It requires that individuals be forced to make a trade-off
between two or more options (sometimes also allowing 'none or neither' as a valid response) based on one
scenario involving a bundle or combination of things, and then to choose again for another scenario involving
another specific combination, and then again, for up to between 4 and 5 scenarios.
Choice Modelling is typically used when the need is to understand the dynamics of consumer choice in a
category. It relies on an integrated behavioural theory of decision-making, incorporating Lancastrian consumer
thinking (from the field of psychology) and random utility theory (from economics).
45
ANOVA
Analysis of Variance (ANOVA) were used to examine the relationship between food waste volume (in weight)
and different food management behaviours. ANOVA is a statistical test that compares the means of groups to
determine if there is a difference between them, comparing the relationship between factors that cause a rise
in food waste. The F test produces a p-value to determine whether the relationship is significant or not.
ANOVA has validating the relationship between food waste volume and 5 different food management stages.
• Food planning
• Food purchasing
• Food storing
• Food preparing and
• Food disposal
Based on the results of the cross-tabulations, those variables indicative of being strong outcome measures of
the food waste volume were tested for significance using ANOVA. Nevertheless, it is clear from the descriptive
results, and the significance of the ANOVA models, that there is a strong relationship between the food waste
volume and food management behaviours.
Survey platform – Limesurvey
LimeSurvey was used as the online platform to conduct the survey, store and deliver the results. LimeSurvey
is a proven platform and has been widely adopted by the world’s leading Market Research agencies and IT
departments in over 1000 companies.
LimeSurvey is an online survey application written in PHP based on a MySQL, sqlite, PostgreSQL or MSSQL
database, distributed under the GNU General Public License. As a web server-based software it enables users
using a web interface to develop and publish on-line surveys, collect responses, create statistics, and export
the resulting data to other applications.
• Features:
• Unlimited number of surveys at the same time
• Unlimited number of questions in a survey
• Unlimited number of participants to a survey
• Multi-lingual surveys
• User-management
• 28 different question types with more to come
• WYSIWYG HTML editor
• Quotas management
• Integration of pictures and movies into a survey
• Creation of a printable survey version
• Conditions for questions depending on earlier answers (Skip Logic / Branching)
• Piping and Micro-tailoring using a powerful expression engine
• Re-usable editable answer sets
• Ready-made importable questions
• Assessment surveys
• Anonymous and Not-Anonymous survey

46
• Open and closed group of participant surveys
• Optional public registration for surveys
• Sending of invitations, reminders and tokens by email
• Option for participants to buffer answers to continue survey at a later time
• Cookie or session-based surveys
• Template editor for creating your own page layout
• Extended and user-friendly administration interface
• Back-office data entry possibility
• Survey expiry dates for automation
• Enhanced import and export functions to text, CSV, PDF, SPSS, R, queXML and MS Excel format
• Basic statistical and graphical analysis with export facility
• Screen Reader Accessibility
• W3C compliance
• Supporting more than 50 different languages in frontend and backend
• A detailed manual is available in several languages in the official LimeSurvey Online Manual
Treatment of outliers
Outliers are observations that are numerically distant from the rest of the data. In large samples of data,
some data points will be further away from the sample mean than what is deemed reasonable. Outliers are
expected for large sample sizes and should not automatically be discarded if that is the case. Outlier points
can therefore indicate faulty data, erroneous procedures, or areas where a certain theory might not be valid.
However, a small number of outliers not due to any anomalous condition are to be expected in large
samples.
Outliers were removed if:
• any household with more than 15 people in Z3 (n=9) – removed for Z3 but not the rest of the survey
• food waste volume in benchmark survey greater than or equal to 14000 grams (n=50)
• food waste volume in electronic-diary greater than or equal to 16000 grams.
Data weighting
Sometimes because of unexpected sampling results, a weighting strategy will be applied to adjust for any
disproportionate sampling according to the demographic profiles of the population. Weighting is used to
manipulate sample data to better represent a population. What this means is that each case or respondent
is assigned a weight factor to reflect it’s important relative to other cases or respondents. The weight factor
is then applied to increase or decrease the total number of cases in the sample that possess certain
characteristics.
‘Proportionally Weighting’ is the most common method of weighting that used. Sample is weighted
proportionately with the weight factor is applied to alter the distribution of characteristics of the sample to
better represent the population.

47
Per Capital Food Waste Calculation Methodology
Conversion of children to adults
To arrive at a per capita food waste figure for children in surveyed households, the study had to derive a
conversion rate to identify the food waste that could be attributed to any children in the household. This
calculation is based on the Australian dietary guidelines 2013. According to this guideline (pages 30 and 33),
the recommended daily number of serves of different food groups varies as per the age group and gender.
The following table shows the average for both men and women.
Table 1: Average of recommended daily average serves for males and females
Age Veg Fruit Grains Lean Meat
Milk, Yogurt
Additional serves
Total Serves Average serves
0_1yrs 2 0.5 1.5 1 1.5 0 6.5
12.55 1-2yr 3 0.5 4 1 1.5 0 10
2_3yr 2.5 1 4 1 1.5 1 11
4-8yrs 4.5 1.5 4 1.5 2 2 15.5
9-11yrs 5 2 4.5 2.5 2.75 3 19.75
12-18yrs 5.25 2 6.25 2.5 3.5 3.25 22.75
20.88 19-50yrs 5.5 2 6 2.75 2.5 2.75 21.5
51-70yrs 5.25 2 5 2.25 3.25 2.5 20.25
70+ 5 2 3.75 2.25 3.75 2.25 19
Based on the Australian dietary guideline (2013), a child (0- 11 years), is recommended to consume a daily
average serve of 12.55 whereas an adult, a daily average serve of 20.88. Accordingly, a child is recommended
to consume 0.60 of the amount of an adult (12.55/20.88).
Therefore, the study have assumed a child’s food consumption, and hence their contribution to food waste,
is 0.60 of that of an adult. Furthermore, the benchmark? survey used different age categories than those in
the table above. Consequently, anyone aged 14 and below is considered as a child and, therefore, having a
contribution of 0.60 of that of an adult in the “Australian household food waste” report series.
Reference: NHMRC 2013. https://www.nhmrc.gov.au/about-us/publications/australian-dietary-
guidelines#block-views-block-file-attachments-content-block-1
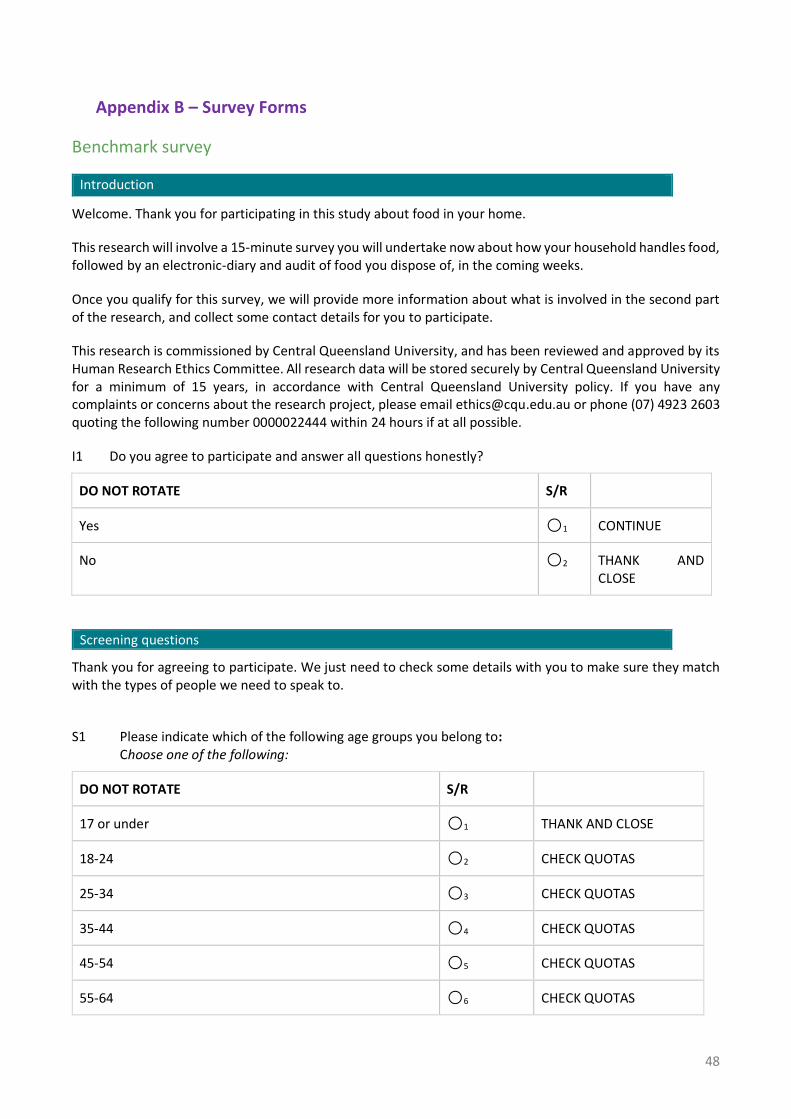
48
Appendix B – Survey Forms
Benchmark survey
Introduction
Welcome. Thank you for participating in this study about food in your home.
This research will involve a 15-minute survey you will undertake now about how your household handles food, followed by an electronic-diary and audit of food you dispose of, in the coming weeks.
Once you qualify for this survey, we will provide more information about what is involved in the second part of the research, and collect some contact details for you to participate.
This research is commissioned by Central Queensland University, and has been reviewed and approved by its Human Research Ethics Committee. All research data will be stored securely by Central Queensland University for a minimum of 15 years, in accordance with Central Queensland University policy. If you have any complaints or concerns about the research project, please email [email protected] or phone (07) 4923 2603 quoting the following number 0000022444 within 24 hours if at all possible.
I1 Do you agree to participate and answer all questions honestly?
DO NOT ROTATE S/R
Yes ⚪1 CONTINUE
No ⚪2 THANK AND CLOSE
Screening questions
Thank you for agreeing to participate. We just need to check some details with you to make sure they match with the types of people we need to speak to.
S1 Please indicate which of the following age groups you belong to: Choose one of the following:
DO NOT ROTATE S/R
17 or under ⚪1 THANK AND CLOSE
18-24 ⚪2 CHECK QUOTAS
25-34 ⚪3 CHECK QUOTAS
35-44 ⚪4 CHECK QUOTAS
45-54 ⚪5 CHECK QUOTAS
55-64 ⚪6 CHECK QUOTAS

49
65-74 ⚪7 CHECK QUOTAS
75+ ⚪8 CHECK QUOTAS
S2 Please enter your Postcode: Only numbers may be entered in this field.
S3 Just thinking about the last 7 days, were you personally away from home for three nights or more?
Please choose one answer
DO NOT ROTATE S/R
No- I was not away from home for three nights or more
⚪1 CONTINUE
Yes- I was away from home for three nights or more ⚪2 THANK AND CLOSE
Don’t know / prefer not to say ⚪99 THANK AND CLOSE
S4 Which of the following does your household have?
Please choose all that apply
DO NOT ROTATE M/R
Shared General Waste bin (Dark Green or Black body with Red lid) – other households in the building/apartment complex use the same rubbish bin as you
1 THANK AND CLOSE
Own General Waste bin (Dark Green or Black body with Red lid) – You have your own rubbish bin just for use by your household
2 CONTINUE
[ALL MUST CODE 2 TO CONTINUE]
Food scraps/waste bin – (trialled in select suburbs) Usually a Dark Green or Black body with Burgundy lid
3 THANK AND CLOSE
Green Waste/Organics bin – Dark Green or Black body with Green lid
4 CONTINUE
Compost bin (a place for food scraps and garden waste) 5 CONTINUE

50
Worm farm 6 CONTINUE
Dog 7 CONTINUE
Cat 8 CONTINUE
Chickens/poultry 9 CONTINUE
Other animals 10 CONTINUE
[ONLY ASK THOSE WHO QUALIFY FOR BIN AUDIT IE CODE 1 AT S3 AND ONLY CODE 2 AT S4]
S5a How frequently do you put out your general waste bin on the curb/street to get emptied?
I/my household put out our waste bin on the curb/street once a week to be emptied
⚪1 CONTINUE
I/my household put out our waste bin on the curb/street once a fortnight to be emptied
⚪2 CONTINUE
I/my household put out our waste bin on the curb/street once a month to be emptied
⚪3 CONTINUE
I/my household don’t put out our waste bin on the curb/street, we empty our rubbish into a communal bin
⚪4 THANK AND CLOSE
[ONLY ASK THOSE WHO QUALIFY FOR BIN AUDIT IE CODE 1 AT S3 AND ONLY CODE 2 AT S4]
S5b On which morning of the week does your general waste bin get collected?
Monday mornings ⚪1 CONTINUE
Tuesday mornings ⚪2 CONTINUE
Wednesday mornings ⚪3 CONTINUE
Thursday mornings ⚪4 CONTINUE
Friday mornings ⚪5 CONTINUE
Saturday mornings ⚪6 CONTINUE
Sunday mornings ⚪7 CONTINUE
I don’t know 98 THANK AND CLOSE
N/A - my household does not have its own bin 99 THANK AND CLOSE

51
[ONLY ASK THOSE WHO QUALIFY FOR BIN AUDIT IE CODE 1 AT S2 AND ONLY CODE 2 AT S2]
S6 Thinking of your general waste bin, how easy is it to empty?
Our bin is easily accessible from the street, and the truck driver does not need to get out of his truck to access it
⚪1 CONTINUE
Our bin is generally accessible but the waste management workers sometimes need to get off the truck to move it somewhere they can empty it
⚪2 CONTINUE
The garbage truck cannot reach our bin from the street, the waste management workers need to search for the bin to empty it
⚪3 THANK AND CLOSE
Our bin remains inside the property and is emptied separately to the regular garbage collection times
⚪4 THANK AND CLOSE
[ASK ALL]
S7 To what extent do you contribute to the following in your household:
Please do not include alcohol when answering any of the following questions.
Please choose one answer that fits best for each stage of the food handling process
S6.1 S6.2 S6.3 S6.4 S6.5
DO NOT ROTATE
Planning for food shopping
Doing the food shopping
Unpacking and storing the food
Doing the food preparation including cooking
Disposing of food not eaten
S/R S/R S/R S/R S/R
[MUST CODE 1 OR 2 FOR S6.1 or S6.2 or S6.3 or s6.4 or S6.5 for AT LEAST 3 ACTIVITIES]
[RECRUIT A SPREAD OF CODES, FROM ONLY MAINLY RESPONSIBLE
I’m mainly responsible
⚪1 ⚪1 ⚪1 ⚪1 ⚪1
I’m equally responsible
⚪2 ⚪2 ⚪2 ⚪2 ⚪2

52
FOR ONE ACTIVITY, TO MANY]
I’m partly responsible
⚪3 ⚪3 ⚪3 ⚪3 ⚪3
I’m not responsible/ I’m rarely responsible.
⚪4 ⚪4 ⚪4 ⚪4 ⚪4
[ASK ALL]
Thank you for answering those questions.
Before we start the survey, we would like to invite you to participate in the other very important part of this research. It involves filling out an electronic-diary for one week to record food that is disposed of in your household. Upon completion of this, you will receive a $10 gift card for your time, and also go in the draw to win 1 of 5 movie vouchers.
For a portion of this survey’s participants, the food in their general waste bins will be counted and compared with this diary to help us to more accurately define what food gets disposed of. This will be done during the regular weekly Council bin collection by our partner Waste Audit & Consultancy Services. No action will be required by you in this process.
The data will be aggregated and if your bin is included, you will not be identified in any way. Only food contents will be recorded, and this will be strictly confidential and only for the purposes of this research.
S8 Do you agree to participate in this part of the research?
Please choose all that apply
[ROTATE CODES 1-2]
Yes, I would like to complete an electronic-diary for 7 days, recording all food disposed of in my household.
I consent to the food waste in my bin being counted and compared with my electronic-diary. I understand that I will not be identifiable in any way and that the bin audit is strictly for research purposes
⚪1
CONTINUE
No, I do not wish to participate in this research
⚪2
THANK AND CLOSE
[ONCE CODES 1 AND 2 SELECTED, SHOW I3]
Thank you. Please provide your contact details below to register your interest.
Please be assured all your personal information is treated in the strictest of confidence and we adhere to the Market and Social Research Privacy Principles. You can read Instinct and Reason’s privacy policy here.

53
We will contact you again in the near future once the research starts.
[ALL FIELDS ARE MANDATORY]
First Name
Surname
Phone number
Email address
Residential address
Note: we require your residential address to ensure we include a good spread of people across Australia for the bin audit.
Unit number (leave blank if not applicable)
Street number
Street name
Suburb
State
Postcode
MAIN SURVEY
SECTION A: CONTEXTUAL, KNOWLEDGE, CONSUMPTION BEHAVIOURS
[ASK ALL]
A1 Which statement best describes your household? Please choose only one of the following:
DO NOT ROTATE S/R
I/we do a main food shop and then do ‘top up’ shopping as we need things ⚪1
I/we do a main food shop only. We don’t do ‘top up’ shopping ⚪2
I/we don’t do main food shopping. We only shop as we need things ⚪3
[ASK ALL]

54
A2 How many times in the last 7 days did you, or other members of your household, shop at a retail outlet (not online) for food items? Please insert number of times for each shop/ store
Supermarket
DO NOT ROTATE
Number of times shopped at in last 7 days
Insert number
Woolworths
Coles
Aldi
Other supermarket (please specify)
I don’t know ⚪98
I didn’t shop at an instore retail outlet in the last 7 days
Not applicable
⚪99
[ASK ALL]
A3 How many times in the last 7 days did you, or other members of your household, order take-away or home delivery? That is, food or meals that were prepared outside your home and brought/sent to your home to be eaten. Please exclude any meals that you had if you were away from home for the night.
[ASK ALL]
A4 How many times in the last 7 days did you, or other members of your household, ‘eat out’ for a meal - including at cafes, restaurants or someone else’s home (include dinner, lunch or breakfast)? Please exclude any meals that you had if you were away from home for the night. Please type in the number
A3 A4
DO NOT ROTATE Ordered takeaway/ home delivery– how many times?
Eating out – how many times?
S/R S/R
Only numbers may be entered in this field.
SECTION B: FOOD PLANNING, PURCHASING, STORAGE, PREPARATION, and DISPOSAL
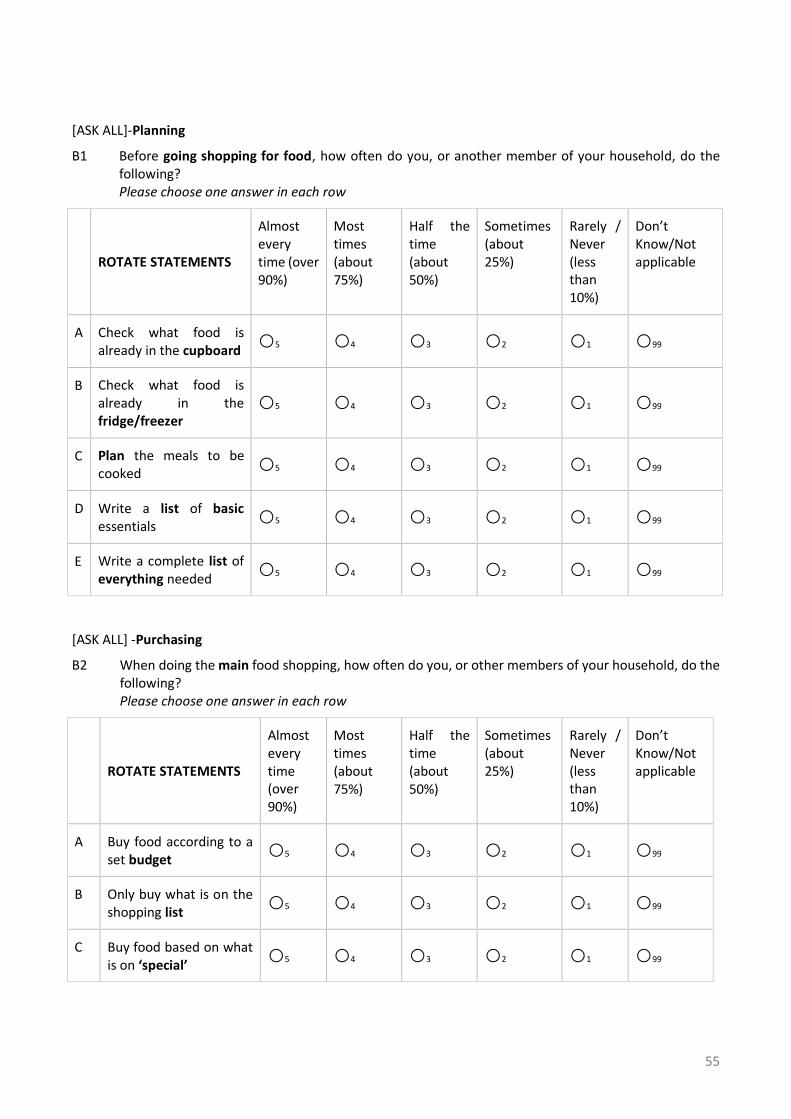
55
[ASK ALL]-Planning
B1 Before going shopping for food, how often do you, or another member of your household, do the following? Please choose one answer in each row
ROTATE STATEMENTS
Almost every time (over 90%)
Most times (about 75%)
Half the time (about 50%)
Sometimes (about 25%)
Rarely / Never (less than 10%)
Don’t Know/Not applicable
A Check what food is already in the cupboard
⚪5 ⚪4 ⚪3 ⚪2 ⚪1 ⚪99
B Check what food is already in the fridge/freezer
⚪5 ⚪4 ⚪3 ⚪2 ⚪1 ⚪99
C Plan the meals to be cooked
⚪5 ⚪4 ⚪3 ⚪2 ⚪1 ⚪99
D Write a list of basic essentials
⚪5 ⚪4 ⚪3 ⚪2 ⚪1 ⚪99
E Write a complete list of everything needed
⚪5 ⚪4 ⚪3 ⚪2 ⚪1 ⚪99
[ASK ALL] -Purchasing
B2 When doing the main food shopping, how often do you, or other members of your household, do the following? Please choose one answer in each row
ROTATE STATEMENTS
Almost every time (over 90%)
Most times (about 75%)
Half the time (about 50%)
Sometimes (about 25%)
Rarely / Never (less than 10%)
Don’t Know/Not applicable
A Buy food according to a set budget
⚪5 ⚪4 ⚪3 ⚪2 ⚪1 ⚪99
B Only buy what is on the shopping list
⚪5 ⚪4 ⚪3 ⚪2 ⚪1 ⚪99
C Buy food based on what is on ‘special’
⚪5 ⚪4 ⚪3 ⚪2 ⚪1 ⚪99
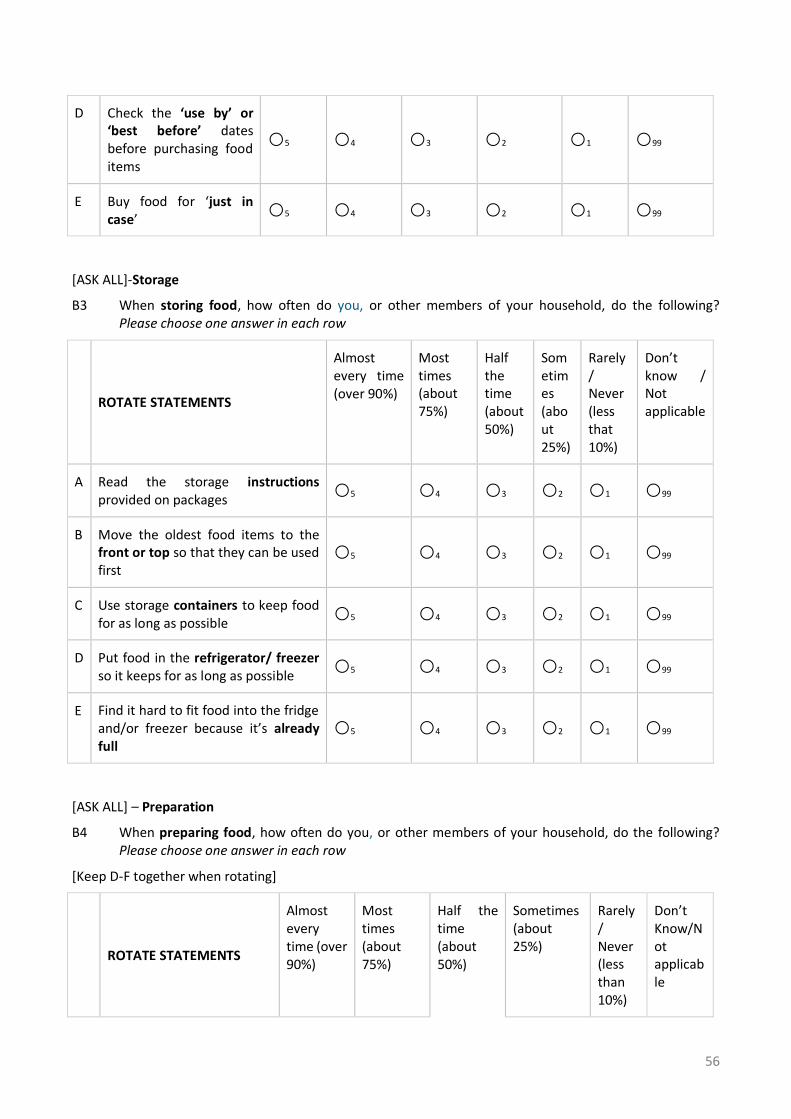
56
D Check the ‘use by’ or ‘best before’ dates before purchasing food items
⚪5 ⚪4 ⚪3 ⚪2 ⚪1 ⚪99
E Buy food for ‘just in case’
⚪5 ⚪4 ⚪3 ⚪2 ⚪1 ⚪99
[ASK ALL]-Storage
B3 When storing food, how often do you, or other members of your household, do the following? Please choose one answer in each row
ROTATE STATEMENTS
Almost every time (over 90%)
Most times (about 75%)
Half the time (about 50%)
Sometimes (about 25%)
Rarely / Never (less that 10%)
Don’t know / Not applicable
A Read the storage instructions provided on packages
⚪5 ⚪4 ⚪3 ⚪2 ⚪1 ⚪99
B Move the oldest food items to the front or top so that they can be used first
⚪5 ⚪4 ⚪3 ⚪2 ⚪1 ⚪99
C Use storage containers to keep food for as long as possible
⚪5 ⚪4 ⚪3 ⚪2 ⚪1 ⚪99
D Put food in the refrigerator/ freezer so it keeps for as long as possible
⚪5 ⚪4 ⚪3 ⚪2 ⚪1 ⚪99
E Find it hard to fit food into the fridge and/or freezer because it’s already full
⚪5 ⚪4 ⚪3 ⚪2 ⚪1 ⚪99
[ASK ALL] – Preparation
B4 When preparing food, how often do you, or other members of your household, do the following? Please choose one answer in each row
[Keep D-F together when rotating]
ROTATE STATEMENTS
Almost every time (over 90%)
Most times (about 75%)
Half the time (about 50%)
Sometimes (about 25%)
Rarely / Never (less than 10%)
Don’t Know/Not applicable

57
A Try to use up the oldest food first
⚪5 ⚪4 ⚪3 ⚪2 ⚪1 ⚪99
B Stick to ingredients in a recipe
⚪5 ⚪4 ⚪3 ⚪2 ⚪1 ⚪99
C Only prepare as much as is needed
⚪5 ⚪4 ⚪3 ⚪2 ⚪1 ⚪99
D Prepare too much food which is not all eaten, and dispose of the extra food straight away
⚪5 ⚪4 ⚪3 ⚪2 ⚪1 ⚪99
E Prepare extra food, store these leftovers to be eaten later on, and end up eating them
⚪5 ⚪4 ⚪3 ⚪2 ⚪1 ⚪99
F Prepare extra food, store these leftovers to be eaten later on, but end up disposing of them
⚪5 ⚪4 ⚪3 ⚪2 ⚪1 ⚪99
G Let others serve themselves
⚪5 ⚪4 ⚪3 ⚪2 ⚪1 ⚪99
[ASK ALL]-Disposal
B5a In relation to the reasons why food is not eaten in your household, and hence needs to be disposed of, how much do you agree with the following?
Please choose one answer per row
DO NOT ROTATE Strongly Agree
Agree Neutral Disagree Strongly Disagree
Don’t Know
Not applicable
We do not dispose of any food in our household
⚪5 ⚪4 ⚪3 ⚪2 ⚪1 ⚪98 ⚪99
We buy too much food ⚪5 ⚪4 ⚪3 ⚪2 ⚪1 ⚪98 ⚪99
We like to eat the freshest food possible
⚪5 ⚪4 ⚪3 ⚪2 ⚪1 ⚪98
⚪99

58
We do not keep food past its ‘use by’ or ‘best before’ date
⚪5 ⚪4 ⚪3 ⚪2 ⚪1 ⚪98 ⚪99
We are not sure if food is still safe to eat
⚪5 ⚪4 ⚪3 ⚪2 ⚪1 ⚪98 ⚪99
We don’t cook the meals we planned
⚪5 ⚪4 ⚪3 ⚪2 ⚪1 ⚪98 ⚪99
Last minute change of plans (family members don’t turn up for meal etc)
⚪5 ⚪4 ⚪3 ⚪2 ⚪1 ⚪98 ⚪99
Household members don’t finish their meal
⚪5 ⚪4 ⚪3 ⚪2 ⚪1 ⚪98 ⚪99
We don’t know how to use cooked leftovers
⚪5 ⚪4 ⚪3 ⚪2 ⚪1 ⚪98 ⚪99
We don’t know how to use leftover uncooked ingredients
⚪5 ⚪4 ⚪3 ⚪2 ⚪1 ⚪98 ⚪99
Other, please specify: _____________
SECTION C: MOTIVATION
[ASK ALL]
C1 How motivated are you to reduce the amount of food that is not eaten and hence disposed, of in your household?
Please choose only one of the following:
REVERSE LIST FOR HALF OF RESPONDENTS 1-5. DO NOT RANDOMISE ORDER
S/R
I’m already doing this most of the time ⚪1
I do this, but just some of the time ⚪2
I don’t do this, but have decided to start doing it ⚪3
I don’t do this, but I am thinking about it ⚪4
I don’t do this and at the moment I have no plans to start doing so ⚪5
[ASK ALL]
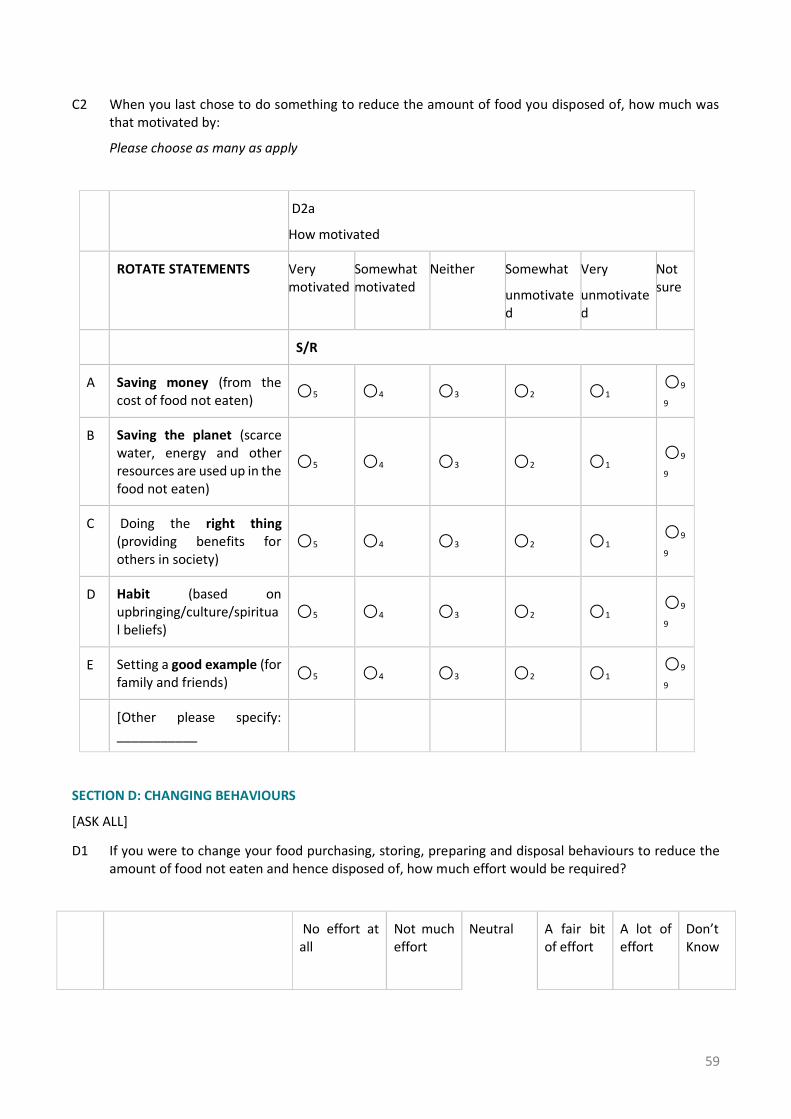
59
C2 When you last chose to do something to reduce the amount of food you disposed of, how much was that motivated by:
Please choose as many as apply
D2a
How motivated
ROTATE STATEMENTS Very motivated
Somewhat motivated
Neither Somewhat
unmotivated
Very
unmotivated
Not sure
S/R
A Saving money (from the cost of food not eaten)
⚪5 ⚪4 ⚪3 ⚪2 ⚪1 ⚪9
9
B Saving the planet (scarce water, energy and other resources are used up in the food not eaten)
⚪5 ⚪4 ⚪3 ⚪2 ⚪1 ⚪9
9
C Doing the right thing (providing benefits for others in society)
⚪5 ⚪4 ⚪3 ⚪2 ⚪1 ⚪9
9
D Habit (based on upbringing/culture/spiritual beliefs)
⚪5 ⚪4 ⚪3 ⚪2 ⚪1 ⚪9
9
E Setting a good example (for family and friends)
⚪5 ⚪4 ⚪3 ⚪2 ⚪1 ⚪9
9
[Other please specify: ___________
SECTION D: CHANGING BEHAVIOURS
[ASK ALL]
D1 If you were to change your food purchasing, storing, preparing and disposal behaviours to reduce the amount of food not eaten and hence disposed of, how much effort would be required?
No effort at all
Not much effort
Neutral A fair bit of effort
A lot of effort
Don’t Know

60
A Changing your food planning behaviours
⚪5 ⚪4 ⚪3 ⚪2 ⚪1 ⚪99
B Changing your food shopping behaviours
⚪5 ⚪4 ⚪3 ⚪2 ⚪1 ⚪99
C Changing food storing behaviours
⚪5 ⚪4 ⚪3 ⚪2 ⚪1 ⚪99
D Changing your food preparation behaviours
⚪5 ⚪4 ⚪3 ⚪2 ⚪1 ⚪99
E Changing your food disposal behaviours
⚪5 ⚪4 ⚪3 ⚪2 ⚪1 ⚪99
D2 In your opinion? Please select one answer
[Show below D1]
Almost every time (over 90%)
Most times (about 75%)
Half the time (about 50%)
Sometimes (about 25%)
Rarely / Never (less than 10%)
Don’t Know
A It is possible to avoid having uneaten food that needs to be disposed of
⚪5 ⚪4 ⚪3 ⚪2 ⚪1 ⚪98
SECTION E: FOOD DISPOSED OF
[ASK ALL]
E1 In the past 7 days, how much of the following food types do you estimate was disposed of in your household?
Include all food and liquids:
• put in the bin
• put into the compost
• put in the worm farm
• tipped down the sink
• fed to pets
• disposed of by any other household members
Please choose one answer in each row

61
Food Category Some examples of this category Unit of measurement
1 cup= 250ml or 250g
Type in number of cups that disposed of in the last 7 days
1 Food prepared at home Includes dishes prepared at home as well as ingredients such as cooked pasta, rice etc.
one cup
2 Takeaway and home delivery meals
Includes takeaway meals consumed at home and home deliveries eaten at home.
one cup
3 Fresh vegetables
Includes salads, fresh herbs and some items that are seeded but considered as vegetables such as avocado and tomato
one cup
4 Frozen/canned/dried vegetables
Includes frozen potatoes, canned beetroots, dried mushrooms etc.
one cup
5 Fresh fruits Includes fresh bananas, oranges, berries, apples etc.
one cup
6 Frozen/canned/dried fruit
Includes frozen blue berries, tinned peaches, dried sultanas etc.
one cup
7 Dairy Includes milk, yogurt, cheese, butter etc. one cup
8 Meat and seafood Includes chicken, beef, pork, fish, prawns, sausages, processed meats etc.
one cup
9 Bread Includes whole loaves and sliced bread, bread rolls etc.
one slice
10 Bakery Includes biscuits, pastries, pies, muffins, donuts etc.
one cup
11 Cakes/desserts/confectionaries and snacks
Includes cakes, desserts, chips, nuts etc. one cup
12 Drink Includes tea, coffee, juices, soft drinks etc.
one cup
13 Other Includes dairy alternatives, meat alternatives, flour, rice, noodles, cereal, pasta, beans, lentils etc.
One cup
14 Possibly avoidable Includes peels, stems, outer leaves etc. one cup
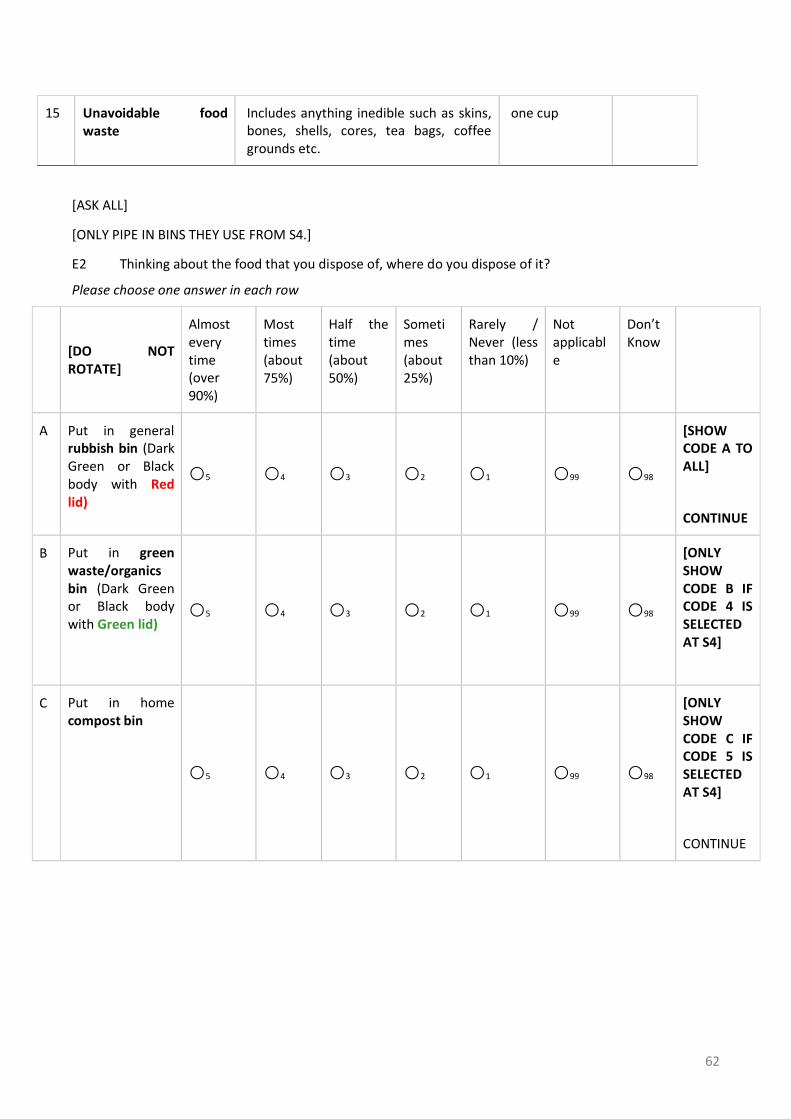
62
[ASK ALL]
[ONLY PIPE IN BINS THEY USE FROM S4.]
E2 Thinking about the food that you dispose of, where do you dispose of it?
Please choose one answer in each row
[DO NOT ROTATE]
Almost every time (over 90%)
Most times (about 75%)
Half the time (about 50%)
Sometimes (about 25%)
Rarely / Never (less than 10%)
Not applicable
Don’t Know
A Put in general rubbish bin (Dark Green or Black body with Red lid)
⚪5 ⚪4 ⚪3 ⚪2 ⚪1 ⚪99 ⚪98
[SHOW CODE A TO ALL]
CONTINUE
B Put in green waste/organics bin (Dark Green or Black body with Green lid)
⚪5 ⚪4 ⚪3 ⚪2 ⚪1 ⚪99 ⚪98
[ONLY SHOW CODE B IF CODE 4 IS SELECTED AT S4]
C Put in home compost bin
⚪5 ⚪4 ⚪3 ⚪2 ⚪1 ⚪99 ⚪98
[ONLY SHOW CODE C IF CODE 5 IS SELECTED AT S4]
CONTINUE
15 Unavoidable food waste
Includes anything inedible such as skins, bones, shells, cores, tea bags, coffee grounds etc.
one cup

63
D Put in worm farm
⚪5 ⚪4 ⚪3 ⚪2 ⚪1 ⚪99 ⚪98
[ONLY SHOW CODE D IF CODE 6 IS SELECTED AT S4]
CONTINUE
E Give to animals (dog, chickens etc)
⚪5 ⚪4 ⚪3 ⚪2 ⚪1 ⚪99 ⚪98
[ONLY SHOW CODE E IF CODES 7, 8, 9 OR 10 SELECTED AT S4]
CONTINUE
F Tip down the sink (this includes liquid, for example milk)
⚪5 ⚪4 ⚪3 ⚪2 ⚪1 ⚪99 ⚪98
[SHOW CODE F TO ALL]
CONTINUE
G Other, please specify: ______________
Demographics
Z1 Please indicate your gender: Please choose one of the following:
DO NOT ROTATE S/R
Male ⚪1 CHECK QUOTAS
Female ⚪2 CHECK QUOTAS
I identify as [OPEN ENDED BOX IF CODE 3] ⚪3 CONTINUE
Z2 Which of the following best describes your residence?
Please choose only one of the following:
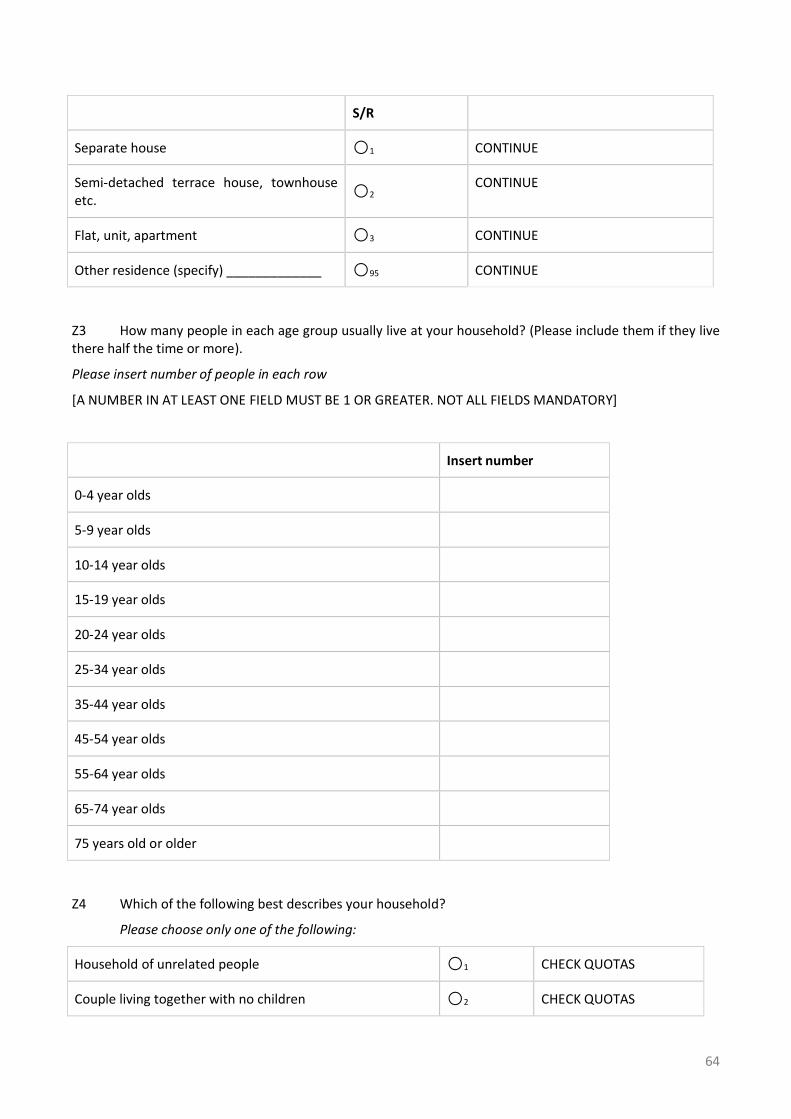
64
S/R
Separate house ⚪1 CONTINUE
Semi-detached terrace house, townhouse etc.
⚪2 CONTINUE
Flat, unit, apartment ⚪3 CONTINUE
Other residence (specify) _____________ ⚪95 CONTINUE
Z3 How many people in each age group usually live at your household? (Please include them if they live there half the time or more).
Please insert number of people in each row
[A NUMBER IN AT LEAST ONE FIELD MUST BE 1 OR GREATER. NOT ALL FIELDS MANDATORY]
Insert number
0-4 year olds
5-9 year olds
10-14 year olds
15-19 year olds
20-24 year olds
25-34 year olds
35-44 year olds
45-54 year olds
55-64 year olds
65-74 year olds
75 years old or older
Z4 Which of the following best describes your household?
Please choose only one of the following:
Household of unrelated people ⚪1 CHECK QUOTAS
Couple living together with no children ⚪2 CHECK QUOTAS

65
Couple with children (<17 years old) ⚪3 CHECK QUOTAS
Couple with adult children (>18 years old) ⚪4 CHECK QUOTAS
Single parent with children (<17 years old) ⚪5 CHECK QUOTAS
Single parent with adult children (>18 years old) ⚪6 CHECK QUOTAS
Couple living without children (child/children no longer reside in same household)
⚪7 CHECK QUOTAS
Living alone ⚪8 CHECK QUOTAS
Other (specify) _____________ ⚪95 CHECK QUOTAS
Prefer not to say ⚪99 CONTINUE
Z5 How many income earners are there in your household?
DO NOT ROTATE S/R
1 ⚪1 CHECK QUOTAS
2 ⚪2 CHECK QUOTAS
3 or more ⚪3 CHECK QUOTAS
There are no income earners in my household ⚪99 CONTINUE
Z6 Which of the following best describes your household income? (before tax per week)
(This refers to the total income from all household occupants, and includes income from wages and
salaries, government benefits, pensions, allowances and any other income you usually receive. It is
before deductions for tax and superannuation contributions)
Please choose only one of the following:
Negative income ⚪1
No income ⚪2
$1-$149 per week ($1-$7,799 per year) ⚪3
$150-$299 per week ($7,800-$15,599 per year) ⚪4
$300-$399 per week ($15,600-$20,799 per year) ⚪5
$400-$499 per week ($20,800-$25,999 per year) ⚪6
$500-$649 per week ($26,000-$33,799 per year) ⚪7
$650-$799 per week ($33,800-$41,599 per year) ⚪8
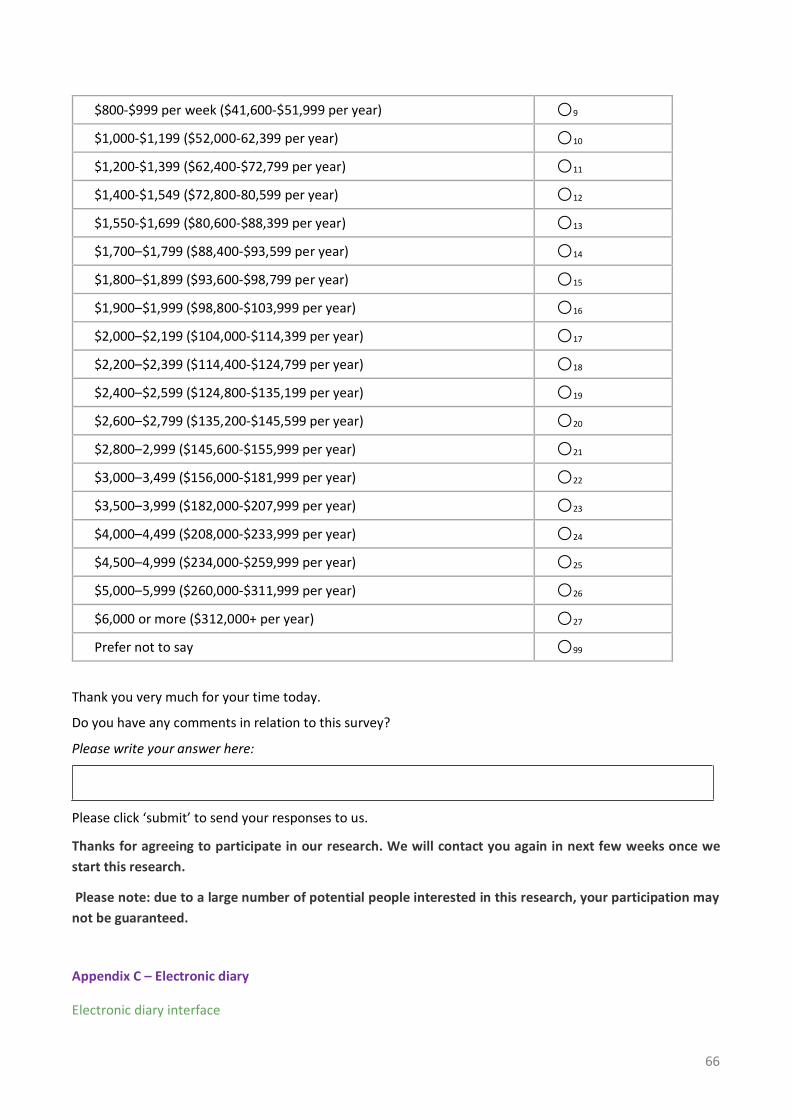
66
$800-$999 per week ($41,600-$51,999 per year) ⚪9
$1,000-$1,199 ($52,000-62,399 per year) ⚪10
$1,200-$1,399 ($62,400-$72,799 per year) ⚪11
$1,400-$1,549 ($72,800-80,599 per year) ⚪12
$1,550-$1,699 ($80,600-$88,399 per year) ⚪13
$1,700–$1,799 ($88,400-$93,599 per year) ⚪14
$1,800–$1,899 ($93,600-$98,799 per year) ⚪15
$1,900–$1,999 ($98,800-$103,999 per year) ⚪16
$2,000–$2,199 ($104,000-$114,399 per year) ⚪17
$2,200–$2,399 ($114,400-$124,799 per year) ⚪18
$2,400–$2,599 ($124,800-$135,199 per year) ⚪19
$2,600–$2,799 ($135,200-$145,599 per year) ⚪20
$2,800–2,999 ($145,600-$155,999 per year) ⚪21
$3,000–3,499 ($156,000-$181,999 per year) ⚪22
$3,500–3,999 ($182,000-$207,999 per year) ⚪23
$4,000–4,499 ($208,000-$233,999 per year) ⚪24
$4,500–4,999 ($234,000-$259,999 per year) ⚪25
$5,000–5,999 ($260,000-$311,999 per year) ⚪26
$6,000 or more ($312,000+ per year) ⚪27
Prefer not to say ⚪99
Thank you very much for your time today.
Do you have any comments in relation to this survey?
Please write your answer here:
Please click ‘submit’ to send your responses to us.
Thanks for agreeing to participate in our research. We will contact you again in next few weeks once we
start this research.
Please note: due to a large number of potential people interested in this research, your participation may
not be guaranteed.
Appendix C – Electronic diary
Electronic diary interface

67
A dropdown list of food appeared when letters were typed into the ‘description of food and drink item’ field.
The list narrowed down in alphabetical order to match the letters typed in as a ‘smart form’. After 5 rows of
foods were added, an additional 5 blank rows would appear, up to 15 rows.
The categories were automatically set based on the food description chosen, and are shown in the appendix
below. The unit of measurement was also set to ‘cups’, except where slices of bread and bread rolls were
concerned.
The other fields had dropdown lists including quantities of cups and where the foods were disposed of.
Finally, the ‘Other – please describe’ field allowed free text typing.
A button appeared below the diary rows to submit the meal and move on to the next meal. The order of meals
each day was as follows:
• Breakfast
• Lunch
• Dinner
• Between meals (including any foods disposed of at any other time, such as when clearing out the
fridge)
Electronic diary food categories
Food Category Some examples of this category Unit of
measuremen
t
1 cup= 250ml
or 250g
2.0 Fresh vegetables/herbs Includes any fresh vegetables/ herbs not listed
2.1 Fresh vegetables Unprocessed fresh vegetables considered
perishable and not preserved by canning,
one cup
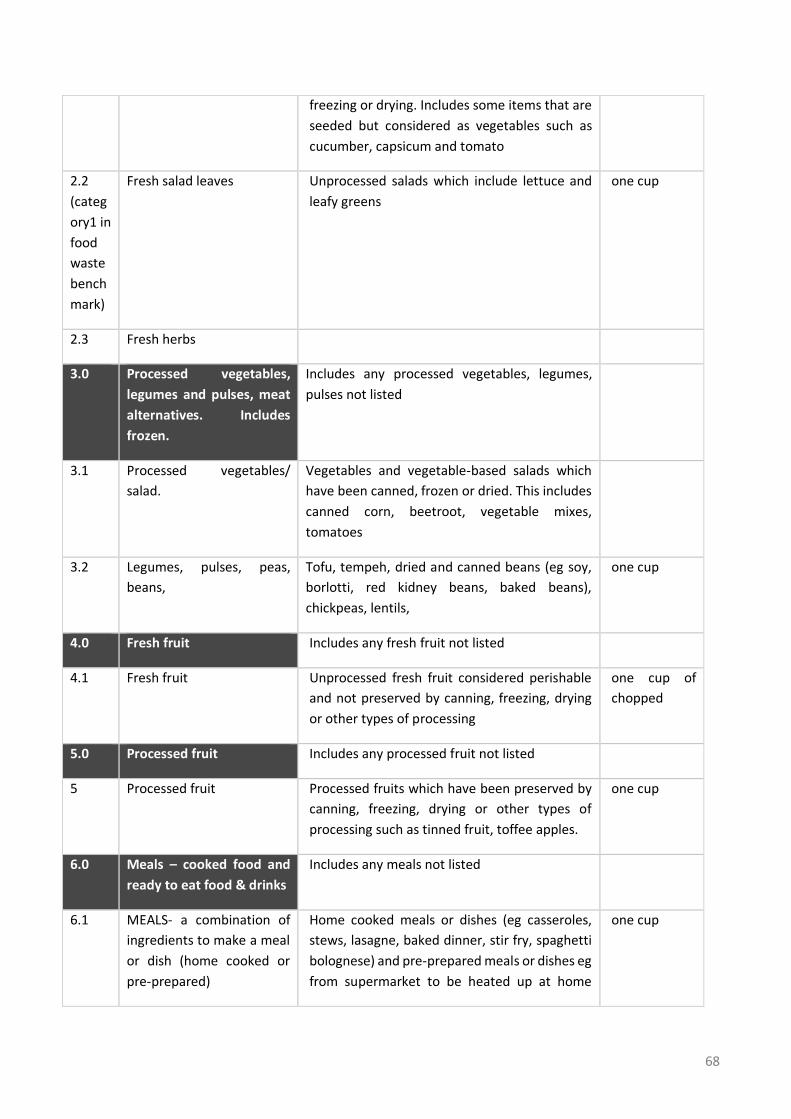
68
freezing or drying. Includes some items that are
seeded but considered as vegetables such as
cucumber, capsicum and tomato
2.2
(categ
ory1 in
food
waste
bench
mark)
Fresh salad leaves Unprocessed salads which include lettuce and
leafy greens
one cup
2.3 Fresh herbs
3.0 Processed vegetables,
legumes and pulses, meat
alternatives. Includes
frozen.
Includes any processed vegetables, legumes,
pulses not listed
3.1 Processed vegetables/
salad.
Vegetables and vegetable-based salads which
have been canned, frozen or dried. This includes
canned corn, beetroot, vegetable mixes,
tomatoes
3.2 Legumes, pulses, peas,
beans,
Tofu, tempeh, dried and canned beans (eg soy,
borlotti, red kidney beans, baked beans),
chickpeas, lentils,
one cup
4.0 Fresh fruit Includes any fresh fruit not listed
4.1 Fresh fruit Unprocessed fresh fruit considered perishable
and not preserved by canning, freezing, drying
or other types of processing
one cup of
chopped
5.0 Processed fruit Includes any processed fruit not listed
5 Processed fruit Processed fruits which have been preserved by
canning, freezing, drying or other types of
processing such as tinned fruit, toffee apples.
one cup
6.0 Meals – cooked food and
ready to eat food & drinks
Includes any meals not listed
6.1 MEALS- a combination of
ingredients to make a meal
or dish (home cooked or
pre-prepared)
Home cooked meals or dishes (eg casseroles,
stews, lasagne, baked dinner, stir fry, spaghetti
bolognese) and pre-prepared meals or dishes eg
from supermarket to be heated up at home
one cup

69
either from fresh or frozen (calorie-controlled
meals, whole pizzas with topping)
6.7
(categ
ory7 in
food
waste
bench
mark)
Any meal or dish, snack or
beverage bought as a
takeaway intended to be
consumed at home.
Uneaten take-away and
home deliveries eaten at
home
Example:
-Thai, Chinese, Indian
-pizza, hamburgers, hot dogs, kebabs, takeaway
chicken
-takeaway tea/coffee/drinks
one cup
8.0 MEAT -as a basic
ingredient, not combined
with other ingredients to
make a meal
Includes any meat /fish/meat alternatives, not
listed
8.1 Meat, poultry -
raw/uncooked
Raw or uncooked meat such as poultry (chicken/
turkey/ duck), beef, lamb, pork. Skin/fat
trimmings included. Doesn’t include seafood.
one cup of
chopped
8.2 Meat, poultry -cooked or
processed (ie preserved,
cured, salted, smoked,
pickled, frozen)
Stand-alone cooked meat . Meat and poultry
that isn’t combined with other ingredients to
make a dish. This includes poultry (chicken/
turkey/ duck), beef, lamb, pork. Skin/fat
trimmings included. Eg BBQ Pork chops (rather
than part of a baked dish) , steamed chicken
breast (rather than strips as part of a stir fry)
Incudes meat and poultry that has been
preserved or cured. eg ham, bacon, devon,
prosciutto, spam, frankfurt, cabanossi, salami,
salted fish, beef jerky, chicken roll.
one cup of
chopped
9.0 SEAFOOD -as a basic
ingredient, not combined
with other ingredients to
make a meal
9.2 Seafood- raw, uncooked Any type of seafood that hasn’t been cooked or
processed in any way but remains in its natural
form.
one cup of
chopped
9.3 Seafood – cooked or
processed (ie preserved,
cured, salted, smoked,
pickled, frozen)
Any type of seafood that has been cooked (eg
by frying steaming, baking) or has been
preserved or cured in some way (through eg
one cup of
chopped

70
smoking, salting, freezing) eg salted fish, frozen
fish fingers, tinned tuna
12.0 Condiments, dried herbs
and spices, spreads, oils
Includes any condiments, dried herbs and
spices, spreads, oils not listed
12.1 Condiments Salt, pepper, stock- cubes, liquid, powdered.
Other similar items not listed in the rest of
section 12
one
tablespoon
12.3 Dried Herbs and powdered
Spices
Includes any dried, ground or powdered herbs
and spices
one
tablespoon
12.4 Spreads Eg Vegemite, jam, peanut butter, honey, nut
spreads eg Nutella
one
tablespoon
12.5 Sauces, dips, gravy,
marinades, dressings, oils,
vinegars
Eg soy, taco, tomato, ketchup, BBQ, salsa,
chutney, mayonnaise hummus, pesto, tzatziki.
Any cooking oil and vinegar
one
tablespoon
11.0 Dairy and dairy
alternatives
Includes any dairy and dairy alternatives not
listed
one cup
11.1 Dairy and dairy alternatives Milk, cheese, dairy buttermilk, cream, yogurt,
butter, dripping, eggs (excluding eggshells).
one cup
11.2 Dairy alternatives Dairy alternatives eg margarine, almond or soy
milk, non-dairy buttermilk, vegan cheese,
coconut yogurt, non-dairy spreads eg Nutelex
Meat alternatives, soy meat alternatives (eg soy
sausages, soy mince)
10.0 Bakery- bread, cakes,
desserts
Includes any bakery items not listed one cup
10.1 Bread Bread and bread rolls, bread sticks one slice of
sandwich
bread –
standard size,
not thick
sliced
10.2 Bakery Muffins (English and high top), crumpets,
scones, donuts, sweet buns
one cup
10.3 Cakes/ desserts Any cake including (cheesecake, cupcakes,
pavlova, friands) ice-cream, custard tarts,
one cup

71
pudding (sweet eg Xmas pudding), other
desserts
10.4 Biscuits (sweet) Eg Monte Carlos, Anzac, Tim Tams one cup
10.5 Pastries and pies-anything
with a pastry (sweet)
Apple pie, strudel, choux pastry snails, fruit pies one cup
10.6 Pastries and pies -anything
with a pastry (savoury)
Meat pie, cheese and spinach roll, sausage roll,
pastry quiche
one cup
13.0 Staples – dried Includes any dairy and dairy alternatives not
listed
one cup
13.1 Staple foods Includes pasta, couscous, breakfast cereal,
noodles, pastry bases (eg shortcrust, filo, pizza
base)
one cup
13.2 Grains and flour Grains (eg wheat, oats, barley, cornmeal,
polenta, rice) and flour (eg wheat, semolina,
coconut, gluten free, almond meal)
one cup
13.3 Other baking ingredients Cake mix, baking powder, dry yeast,
breadcrumbs, gelatine, jelly, sugar and sugar
substitutes, vanilla
one cup
13.4 Nuts and seeds Nuts ( eg almond, pistachio, hazelnut, peanut)
and seeds (eg sesame, pepitas, chia), not herb
seeds
one cup
15.0 Confectionery and snacks Includes any confectionary and snacks not listed one cup
15.1 Confectionary Chocolates, lollies, licorice, chewing gum one cup
15.2 Sweet snacks Fruit bars, muesli bars one cup
15.5 Savoury snacks Chips, popcorn, rice cakes, crackers (rice, wheat
cracker, gluten free)
one cup
17.0 Inedibles Includes any inedibles not listed one cup/one
cup chopped
17.1 Peelings/ stems/ outer
leaves
Peelings from vegetables including potato and
carrot peel, broccoli stems, cabbage leaves,
spring onion/shallot tops and bean and sprout
ends
one cup
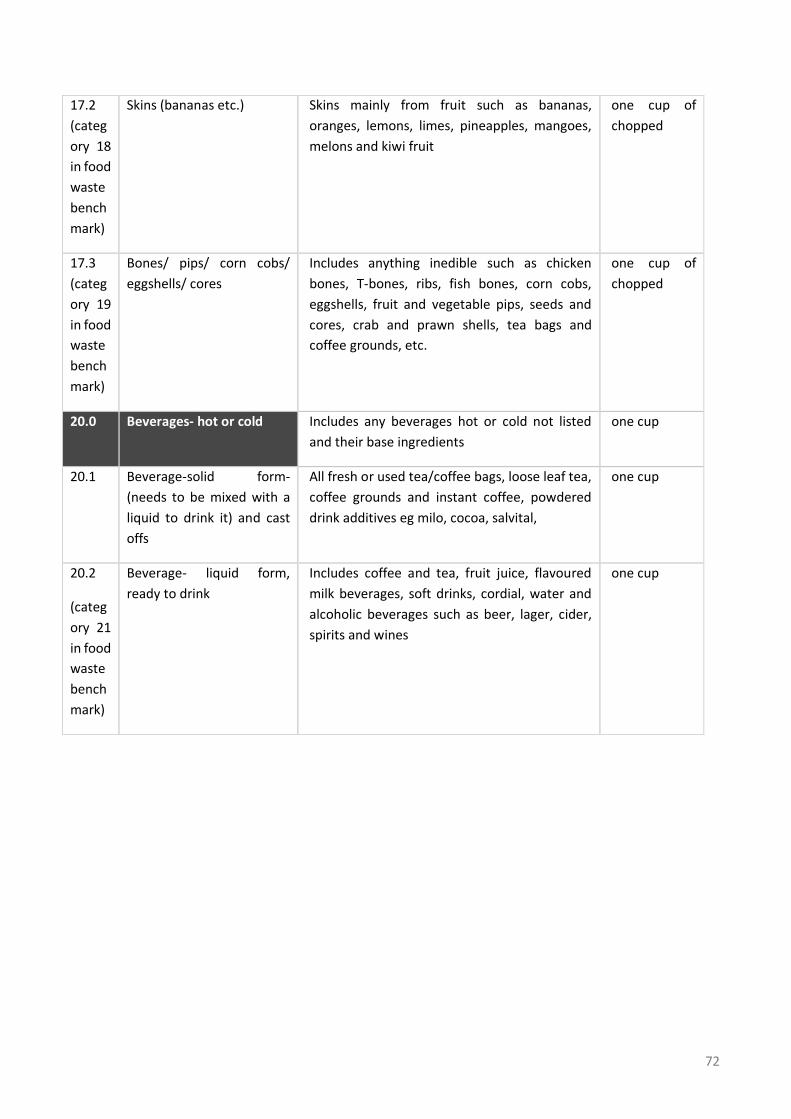
72
17.2
(categ
ory 18
in food
waste
bench
mark)
Skins (bananas etc.) Skins mainly from fruit such as bananas,
oranges, lemons, limes, pineapples, mangoes,
melons and kiwi fruit
one cup of
chopped
17.3
(categ
ory 19
in food
waste
bench
mark)
Bones/ pips/ corn cobs/
eggshells/ cores
Includes anything inedible such as chicken
bones, T-bones, ribs, fish bones, corn cobs,
eggshells, fruit and vegetable pips, seeds and
cores, crab and prawn shells, tea bags and
coffee grounds, etc.
one cup of
chopped
20.0 Beverages- hot or cold Includes any beverages hot or cold not listed
and their base ingredients
one cup
20.1 Beverage-solid form-
(needs to be mixed with a
liquid to drink it) and cast
offs
All fresh or used tea/coffee bags, loose leaf tea,
coffee grounds and instant coffee, powdered
drink additives eg milo, cocoa, salvital,
one cup
20.2
(categ
ory 21
in food
waste
bench
mark)
Beverage- liquid form,
ready to drink
Includes coffee and tea, fruit juice, flavoured
milk beverages, soft drinks, cordial, water and
alcoholic beverages such as beer, lager, cider,
spirits and wines
one cup

fightfoodwastecrc.com.au