australian government department of health … · australian government department of health and...
TRANSCRIPT

AUSTRALIAN GOVERNMENT DEPARTMENT
OF HEALTH AND AGEING
EVALUATION OF THE DIABETES PILOT PROGRAM FINAL REPORT
MARCH 2010
JIM HALES, ANDREW ALDERDICE, TIM STANIFORD & JANE MANSER
Health Outcomes International Suites 1 & 4, 51 Stephen Terrace, St Peters SA 5069
Phone: 08 8363 3699 Facsimile: 08 8363 9011
Email: [email protected] ABN 80 081 950 692
Australian Government Department of Health and Ageing Evaluation of the Diabetes Pilot Program
Final Report January 2010 i
C CONTENTS
EXECUTIVE SUMMARY ... . . . . . . . . . . . . . . . . . . . . . . . . . . . . . . . . . . . . . . . . . . . . . . . . . . . . . . . . . . . . . . . . . . . . . . . . . 1
E.1 Background...................................................................................................................................................1
E.2 Evaluation of DMAS ..................................................................................................................................2
E.3 Summary of Findings ..................................................................................................................................2
E.4 Options for the Future ...............................................................................................................................8
INTRODUCTION .... . . . . . . . . . . . . . . . . . . . . . . . . . . . . . . . . . . . . . . . . . . . . . . . . . . . . . . . . . . . . . . . . . . . . . . . . . . . . . . . . . 9
1.1 Type-2 Diabetes...........................................................................................................................................9
1.2 The Role and Contribution of Community Pharmacy to Diabetes Management ..........................10
1.3 Evaluation of DMAS ................................................................................................................................12
IMPACT ON PHARMACIES .... . . . . . . . . . . . . . . . . . . . . . . . . . . . . . . . . . . . . . . . . . . . . . . . . . . . . . . . . . . . . . . . . . . . 15
2.1 Registration and Training of Pharmacists..............................................................................................15
2.2 Participation by Pharmacists....................................................................................................................16
2.3 Participation by Patients ...........................................................................................................................18
2.4 Factors Contributing to Patients not Participating ..............................................................................19
2.5 Patient Participation Outside the Diabetes Pilot Program .................................................................19
2.6 Obtaining Clinical Data from GPs .........................................................................................................19
2.7 Investment in the Program ......................................................................................................................19
2.8 Operational Aspects of DMAS ...............................................................................................................19
2.9 Conclusion ..................................................................................................................................................19
IMPACT ON PATIENTS ... . . . . . . . . . . . . . . . . . . . . . . . . . . . . . . . . . . . . . . . . . . . . . . . . . . . . . . . . . . . . . . . . . . . . . . . . 19
3.1 Patient Consultations ................................................................................................................................19
3.2 Patient Survey Data ...................................................................................................................................19
3.3 Conclusion ..................................................................................................................................................19
ECONOMIC IMPACTS ... . . . . . . . . . . . . . . . . . . . . . . . . . . . . . . . . . . . . . . . . . . . . . . . . . . . . . . . . . . . . . . . . . . . . . . . . . . 19
4.1 Impact on Patients.....................................................................................................................................19
4.2 Impact on Pharmacies ..............................................................................................................................19
4.3 Impact on the Health System ..................................................................................................................19
APPENDIX A – PHARMACY DATA ..............................................................................................................................XIX APPENDIX B – PATIENT DATA ..................................................................................................................................XIX

Australian Government Department of Health and Ageing Evaluation of the Diabetes Pilot Program
Final Report January 2010 ii
T TABLES
Table 2.1: ‘Active’ DMAS Pharmacists and Patients.............................................................................................17
Table 2.2: Patients Approached, Referred and Interested in DMAS..................................................................19
Table 2.3: Eligible Patients.........................................................................................................................................19
Table 2.4: Eligible Patients.........................................................................................................................................19
Table 2.5: Reasons for Patients Declining to Participate......................................................................................19
Table 2.6: Provision of Services outside of DMAS ...............................................................................................19
Table 2.7: Patient Charges for DMAS .....................................................................................................................19
Table 3.1: Distribution of Consultations .................................................................................................................19
Table 3.2: BMI at Consultation 1 and 5...................................................................................................................19
Table 3.3: Number of Times Exercising per Week, Consultations 1 and 5 ......................................................19
Table 3.4: Change in Number of Drinks, Consultations 1 and 5 ........................................................................19
Table 3.5: Number of Prescribed Medications Taken at Consultation 1 ...........................................................19
Table 3.6: Changes in Medication Management, Consultations 1 and 5............................................................19
Table 3.7: Use of Health Services, Consultations 1 and 5 ....................................................................................19
Table 3.8: Other Reasons for Participation in DMAS ..........................................................................................19
Table 3.9: Patients’ Willingness to Pay for DMAS ................................................................................................19
Table 3.10: Patients’ Willingness to Pay for DMAS ..............................................................................................19
Table 3.11: Patients’ Payment Summary at Conclusion of DMAS .....................................................................19
Table 4.1: Government Expenditure on Stage 2 of DMAS.................................................................................19

Australian Government Department of Health and Ageing Evaluation of the Diabetes Pilot Program
Final Report January 2010 iii
F FIGURES
Figure 2.1: Age Distribution of Participants ...........................................................................................................19
Figure 2.2: Number of Clinical Data Follow-ups per Patient ..............................................................................19
Figure 2.3: Total Pharmacy DMAS Start-up Costs................................................................................................19
Figure 2.4: Start-up Investment by Pharmacy in Infrastructure ..........................................................................19
Figure 2.5: Pharmacy Start-up Labour Costs ..........................................................................................................19
Figure 2.6: Average Weekly Hours Spent on DMAS............................................................................................19
Figure 2.7: Ongoing Costs – Labour........................................................................................................................19
Figure 2.8: Ongoing Costs – Consumables.............................................................................................................19
Figure 2.9: Ongoing Costs – Total ...........................................................................................................................19
Figure 3.1: Change in Systolic BP between Consultations 1 and 5 .....................................................................19
Figure 3.2: Change in Diastolic BP between Consultations 1 and 5...................................................................19
Figure 3.3: Variance in Blood Glucose Levels between Consultations 1 and 5................................................19
Figure 3.4: Mean Blood Glucose Levels, Consultations 1 and 5 .........................................................................19
Figure 3.5: Number of Alcohol-Free Days per Week, Consultations 1 and 5 ..................................................19
Figure 3.6: Patients Recording their Goal Attainment ..........................................................................................19
Figure 3.7: Patients’ Reasons for Participating in DMAS.....................................................................................19
Figure 3.8: Patients’ Perceived Quality of Life .......................................................................................................19
Figure 3.9: Patients’ Perceived Current Health State.............................................................................................19
Figure 3.10: Patients’ Perceptions of their Ability to Follow Instructions for their Diabetes Medication ..................................................................................................................................................19
Figure 3.11: Patients’ Perceptions of their Dietary Habits ...................................................................................19
Figure 3.12: Patients’ Perceptions of their Exercise Habits .................................................................................19
Figure 3.13: Patients’ Perceptions of their Ability to Manage their Diabetes....................................................19
Figure 3.14: Expected Benefits for Patients Taking Part in DMAS....................................................................19
Figure 3.15: Patients’ Perceived Quality of Life .....................................................................................................19
Figure 3.16: Patients’ Perceived Current Health State...........................................................................................19
Figure 3.17: Patients’ Satisfaction with DMAS ......................................................................................................19
Figure 3.18: Patients’ Confidence in Dealing with Diabetes ................................................................................19
Figure 3.19: Patients’ Perceptions of their Improved Ability to Follow Instructions......................................19
Figure 3.20: Patients’ Perceptions of their Improved Lifestyle (Diet and Exercise Habits) ...........................19
Figure 3.21: Patients’ Perceptions of their Ability to Stay in Control of their Diabetes..................................19

Australian Government Department of Health and Ageing Evaluation of the Diabetes Pilot Program
Final Report January 2010 iv
Figure 3.22: Patients’ Perceptions of Receiving the DMAS in the Pharmacy...................................................19
Figure 3.23: Patients’ Perceptions of their Overall Health Improvement .........................................................19
Figure 3.24: Patients’ Perceptions of their Ability to Better Manage their Diabetes........................................19
Figure 3.25: Patients’ Perceptions of the Usefulness of DMAS..........................................................................19
Figure 3.26: Key Benefits from Patients Taking Part in DMAS..........................................................................19
Figure 3.27: Patients’ Access to Glucometers.........................................................................................................19
Figure 3.28: Comparison of Quality of Life from Beginning to End of Participation in DMAS..................19
Figure 3.29: Comparison of Current Health State from Beginning to End of Participation in DMAS..........................................................................................................................................................19
Figure 3.30: Comparison of Key Benefits from Beginning to End of Participation in DMAS .....................19

Australian Government Department of Health and Ageing Evaluation of the Diabetes Pilot Program
Final Report January 2010 1
E EXECUTIVE SUMMARY
This report presents the final findings from the evaluation of Stage 2 of the Diabetes Medication Assistance Service (DMAS), based on data collected to the end of February 2010.
E.1 BACKGROUND
Diabetes is one of a number of chronic conditions commonly seen in Australia.1 It is a common condition that contributes significantly to premature mortality, morbidity, disability and loss of potential years of life. The incidence and prevalence of diabetes are on the rise worldwide, and type-2 diabetes is increasingly occurring at a younger age, including in adolescence and childhood2. Community pharmacists are regarded as being ideally placed to assist in the detection, education and referral of individuals at risk of diabetes. Because they are accessible, available, and in frequent contact with the public, community pharmacists represent an important channel for delivery of education and support in medication management.
Recent Pharmacy Agreements have included projects intended to support and build on the capacity of community pharmacy to contribute to improved medication management and education of the community generally in Quality Use of Medicines (QUM). For chronic disease sufferers (such as those with type-2 diabetes) who often rely on medication for adequate control of their condition, advice and support at the time of collecting those medicines can be an important contributor to the management of their condition.
E.1.1 THE PHARMACY DIABETES CARE PROGRAM
The Pharmacy Diabetes Care Program (PDCP) was designed under the Third Pharmacy Agreement to investigate a Disease State Management (DSM) Model for people with type-2 diabetes. The aims of the Pharmacy Diabetes Care Program3 were to:
• Improve the health of people with diabetes; • Identify and refer as appropriate people with undiagnosed diabetes; and • Support the continuity of care for people with diabetes.
The model consisted of two components, a Screening Service, and, a Diabetes Medication Assistance Service (DMAS). The critical elements of the DMAS included patient education, support and monitoring to facilitate self-management in those with established disease. For those at risk, the focus was on education and referral.
E.1.2 THE DIABETES MEDICATION ASSISTANCE SERVICE (DMAS)
Following the operational and clinical success of the DMAS under the PDCP, the further roll-out of DMAS has occurred in two stages under the Fourth Community Pharmacy Agreement. The program is funded by the Australian Government Department of Health and Ageing and managed by the Pharmacy Guild of Australia. The program reviewed and refined the DMAS over two stages, the first being an
1 Parsons, J., Wilson, D., & Scardigno, A., (2000) The impact of diabetes in South Australia, The Diabetes Health Priority Area Advisory Group. 2 Krass, B., (2005) Pharmacy Diabetes care program; final report, University of Sydney; Faculty of Pharmacy. 3 Krass B (2005) op cit

Australian Government Department of Health and Ageing Evaluation of the Diabetes Pilot Program
Final Report January 2010 2
implementation across 80 pharmacies and the second across 800 pharmacies Australia-wide. The second of these stages is the subject of this evaluation report.
DMAS is an ongoing cycle of assessment, management and review of patients with type-2 diabetes, provided by the community pharmacist at regular intervals in the pharmacy, in collaboration with GPs and members of the diabetes care team. DMAS aims to assist patient self-management and improve the Quality Use of Medicines for people with diabetes through community pharmacy intervention.
E.2 EVALUATION OF DMAS
The evaluation of Stage 2 of DMAS has been undertaken by Health Outcomes International (HOI), under contract to the Department of Health and Ageing. This report presents the findings of the evaluation.
E.2.1 EVALUATION OBJECTIVES
The over-arching objective of the evaluation is to assess the cost and affordability of the DMAS, including the financial impact on the health system.
The evaluation also assesses whether the clinical outcomes achieved through the PDCP under the Third Agreement’s Research and Development Program can be replicated when implementing the DMAS in a broader community pharmacy setting.
There are three perspectives from which the project is evaluated:
• Participating pharmacies and other health professionals; • People with type-2 diabetes participating in the program; and • The broader health system.
E.3 SUMMARY OF FINDINGS
E.3.1 IMPACT ON PHARMACY
RE AS ON S FO R PH A R M A C Y PA RT I CIP A T I ON
Case study pharmacists were asked about their reasons for participating in the DMAS. Overwhelmingly, they responded that the program provided them with the opportunity to extend the professional services of their pharmacy, and to expand their activities beyond the traditional dispensing function. As such, they considered that it added further value to the services they offer their patients. No pharmacist reported participating in the program for financial reasons – they did not see it as a profit-making service.
PH A R M A C I ST PA R TI C I PA TI O N RA T E S
At the completion of the evaluation period (end February 2010):
• 819 applications had been received and 760 pharmacists were offered a place as per the proposed PhARIA distribution. The remaining 40 vacancies were filled from the excess applications.
• 785 pharmacists were trained and credentialed, however, 108 (14% of those trained) subsequently withdrew from the program at various points for various reasons.
• All participating pharmacists were required to submit evaluation data, including patient data for 50% of their patients. 493 pharmacists (63% of those trained and credentialed) provided some form of data; Pharmacy data, Administrative data or Patient data. Conversely, 292 pharmacists (37%) have not provided any data. Of the 493 pharmacists who provided some form of data, 251 (51%) provided some level of patient data for 611 patients.
• Should the definition of an ‘active’ pharmacist be considered as those who have at least one patient enrolled and receiving services in the DMAS, the number of active pharmacists in the program is 251. This represents 32% of the 785 pharmacists trained and credentialed.
Australian Government Department of Health and Ageing Evaluation of the Diabetes Pilot Program
Final Report January 2010 3
PA TI E N T PART I CI P A T I ON RA TE S
The actual number of patients participating in the program is considered to be very low, given that Stage 2 provides for up to 11,200 patients (800 pharmacies with 14 patients) and over 10,000 potential patients were initially approached to participate. At the end of February 2010, patient data had been entered for a total of 611 patients in the evaluation sample (designed to be 50% of total participants), of whom 569 (93%) had consultation data recorded. Of those pharmacists who had recruited patients, 68% had only managed to recruit one or two patients to the evaluation sample. In the context of the program, the actual number of patients (n=611) enrolled in the evaluation sample represents:
• Only 11% of the potential pool of 5,495 participants (785 pharmacists with 7 patients in the evaluation sample).
• 0.78 patients for every pharmacist trained (n=785); • An average of 2.4 patients for every active pharmacist (n=251) in the program. • Even allowing for the fact that the evaluation sample may represent only 50% of total
participants, these participation rates are extremely low relative to the original targets and expectations, and indicate that a total of approximately 1,000-1,250 patients participated in the DMAS nationally.
It is apparent that the low rate of participation by patients was predominantly related to a lack of interest from patients, together with limited time and capacity by the pharmacist. These two factors were, to some degree, inter-related, however, in combination, they placed considerable pressure on pharmacists to limit the amount of time they could continue to spend on recruitment activities at the expense of other revenue-generating activities within the pharmacy.
The reasons for patients choosing not to participate in the program appear to be related directly to their perceived need or interest. Only 34% of those approached were interested in participating. Many considered their health status to be sufficient to not require the service, while many were also involved in other diabetic program/services negating their need for DMAS.
The eligibility criterion of HbA1c >7% was also a factor in participation, with nearly half (47%) of those interested in participating having an HbA1c level below the threshold level, thereby excluding them from participating.
Other pharmacy-related factors (i.e. State/Territory, PhARIA, pharmacy size, location of pharmacy, type of ownership and the number of pharmacists employed) and patient-related factors (e.g. ethnicity, age) were analysed and do not appear to have had a significant influence on a patients decision to participate or not. From the analysis, there was however slightly higher patient participation rates in PhARIA 3, 4 and 5 and our case studies confirmed that where other diabetes management services do not exist greater interest was shown by patients. Likewise, while the fees charged to patients may have had some influence on patient participation, this factor appears to have had a minimal effect on their participation.
Hence, the original potential pool of 10,759 participants was reduced by approximately 67% as a result of patient lack of interest and, of those interested, 47% were excluded due to non-eligibility. The final number of patients participating represents approximately 15% of those originally approached/referred.
At the end of the data collection period (end February 2010), 59 pharmacists reported providing services to patients outside the funding umbrella of the DMAS. Among respondents to this question, 13% were offering a service to one patient; 7% to two patients; 6% to three patients, 4% to four patients, while 6% were servicing five or more patients.
IN VE S TME N T I N TH E PR OG R A M
Three hundred and forty-two (342) pharmacists reported start-up costs to a standard suitable for analysis. The mean total start-up cost across these pharmacists was $1,006. This was comprised of $486 in infrastructure investment, and $520 in labour costs. Approximately 25% of pharmacists reported spending nothing, 37% spent up to $1,000 and 24% spent between $1,000 and $2,000. The remaining 15% spent more than $2,000.

Australian Government Department of Health and Ageing Evaluation of the Diabetes Pilot Program
Final Report January 2010 4
Between 150 and 200 pharmacists provided data on their ongoing costs in providing DMAS over the five quarters of data collection. These costs were divided between labour costs and consumables costs. Ongoing labour costs increased progressively over the five reporting quarters, from an initial mean of $314 in Quarter 1 to $551 in Quarter 5, presumably reflecting the increasing time spent on patient consultations. Over the five quarters the mean labour cost was $436. Consumables also showed an increase from Quarter 1 to Quarter 5, but not to the same extent as labour costs. Over the five periods, the mean consumables cost was $40.
Total ongoing costs rose from a mean of $353 in Quarter 1 to $599 in Quarter 5. The mean total cost across all periods was $477. Labour accounted for 91% of total costs, and consumables for 9% of total costs.
Forty-six percent (46%) of pharmacists reported charging a fee up to the recommended $2.75 per consultation, while 90% charged $5.00 or less per consultation. The case studies revealed that many pharmacists considered that the fee charged was not commensurate with the professional nature of the service, and considered that it undermined the value of the service to patients
OPE RA T I O NA L AS P E CT S O F T H E PR O G RA M
The case studies undertaken in late 2009 provided some insights to the operational aspects of the program from a pharmacy perspective, and are summarised below.
• A key success factor in recruiting patients to the program was the relationship between the pharmacist and their patients. This was complemented by the interest and enthusiasm of the trained pharmacist for the program.
• Pharmacists reported little interaction or relationship with other health professionals. • Pharmacists generally reported having under-estimated the time and effort required to recruit
patients to the program, and found this to be the most time-consuming and generally frustrating aspect of the program.
• High retention rates were observed among DMAS patients, with very few withdrawing from the program. Where patients did withdraw, it generally resulted from a lack of motivation, or difficulties associated with other medical conditions/complications.
• A significant number of patients failed to keep their appointments. This was attributed to the fact that this process was alien to their normal interaction with the pharmacist which tended to be more opportunistic or casual rather than scheduled.
SU M M AR Y
The DMAS provided the opportunity for 785 pharmacists to be trained in the provision of pharmacy-based diabetes services to patients who met the defined eligibility criteria. Pharmacists enrolled in the program because they considered that the program provided them with the opportunity to extend the professional services of their pharmacy, and to expand their activities beyond the traditional dispensing function, however, for most this has been limited by low patient participation.
Only 32% of the trained and credentialed pharmacists reported having been successful in recruiting patients to the service, with an estimated 1,000-1,250 patients having participated in the program across the country. This represents approximately 10% of the original target nationally. Among those pharmacies that reported recruiting any patients, the overwhelming majority reported recruiting less than five patients to the program, compared to an upper limit of fourteen patients.
This outcome is largely attributable to apathy or lack of interest in the program among their patients, rather than a deficiency in the program itself. This appears to be related directly to their perception of need and whether the program would be of benefit to them. Many considered their health status to be sufficient to not require the service, while others were already involved in other diabetes programs/services negating their need for DMAS. It appears that where the program has been more successful in patient recruitment is in those areas where no other or very infrequent diabetes management services exist.

Australian Government Department of Health and Ageing Evaluation of the Diabetes Pilot Program
Final Report January 2010 5
E.3.2 IMPACT ON PATIENTS
At the end of February 2010, 569 patients had consultation data entered for Consultation 1. Of these, 263 had proceeded to their final consultation (Consultation 5).
CLI N I CAL OU T C OM E S
The clinical outcomes discussed below are based on the 263 clients who have completed Consultation 5. • The mean blood glucose level across all patients decreased from 9.48 mmol/L to 8.64mmol/L,
a reduction of 0.84mmol/L, or 8.8%. At baseline, approximately 70% of patients recorded a blood glucose level below 10, and by Consultation 5, this had increased to 80%. The proportion of patients with blood glucose levels below 7mmol/L increased from 7% to 15%.
• The change in BMI has been minimal, with the mean BMI decreasing from 33.1 to 32.9 (-0.2%) between baseline and Consultation 5.
• Between Consultations 1 and 5 overall the mean Systolic BP pressure reading dropped by 6.0mmHg and Diastolic by 4.3mmHg. Sixty-three percent (63%) of patients recorded a decrease in Systolic BP while the remaining 37% of patients recorded an increase in Systolic BP. Sixty-three percent (63%) of patients had a decrease in Diastolic BP while the remaining 37% experienced an increase in diastolic BP.
LI FES T Y LE A N D DAI LY LI VIN G
The following changes were observed between Consultation 1 and Consultation 5
• Approximately 45% of patients made no change to their exercise habits. However, 41% of patients improved their exercise habits, while 16% decreased their exercise.
• Approximately 63% of patients made no change to their number of alcohol-free days, while 13% of patients reduced the number of alcohol-free days, compared to 23% who increased their alcohol-free days per week. Fourteen per cent (14%) of patients reported reducing the average number of drinks they consumed, 5% reported an increase and 82% reported no change.
• There was a consistent decrease across all forms of medication management problems identified between Consultations 1 and 5, particularly adherence issues, with the proportion of patients identified with problems in this area halving from 35% to 18%.
• A small increase in the use of all health services was observed among patients. This should not necessarily be seen as being negative, as participation in DMAS may have served to increase awareness of their diabetes and encouraged them to seek professional assistance.
• Patients were also asked to review the goals they set at commencement of the program. 38% of participants considered the goals they set were fully met; 49% said they were partially met and 13% considered they were not met.
• From a patient perspective, pharmacists saw some patients demonstrating improved management of their medications, improved diet, adoption of a better exercise regime, and improved motivation. For others, the results were less convincing, often related to their personal motivation, and the occurrence of complications or other medical conditions. However, this does need to be considered in the context of the time required by people to implement long term lifestyle/behavioural change.
E.3.3 PATIENT-REPORTED OUTCOMES
Participating patients were asked to complete a survey at Consultation 1 (Survey #1) and Consultation 5 (Survey #2). At the end of February 2010, 480 Survey #1 had been received from 198 pharmacies , and 233 surveys (Survey #2) completed at the end of their participation in DMAS (at Consultation 5) had been received from 114 pharmacies. The outcomes from these surveys include:
• The large majority of patients indicated that across a range of health statements, their quality of life had not changed significantly during their participation in DMAS.
Australian Government Department of Health and Ageing Evaluation of the Diabetes Pilot Program
Final Report January 2010 6
• Patients were asked to rate their perception of their health state at the time they completed the surveys. The majority (54%) of patients ranked their health state higher at the completion of their participation than at the beginning; 24% rated their health lower; and 22% recorded no change in their health state score.
• In respect to the key benefits patients expected from participation in the DMAS, these were realised at the following levels: – Extra Support: 69% of patients had their expectations met, and a further 13% realised this
unexpectedly. – Medication Management: 23% of patients had their expectations met, and a further 31%
realised this unexpectedly. – Improved Lifestyle: 34% of patients had their expectations met, and a further 27% realised
this unexpectedly. • Almost half (43%) of patients did not change the amount they stated were willing to pay for
consultations for the DMAS; 38% were willing to pay more; and 19% indicated that they would pay less.
SU M M AR Y
Overall the changes observed in the patients who have completed the DMAS consultations have been variable. In regard to clinical measures and lifestyle factors very marginal improvements have been observed, however, it is possible that greater improvements may be observed over a longer time frame.
The findings in the self-reported data collected from the patient survey also illustrate variable responses. The large majority of patients reported being very satisfied with the DMAS, particularly the general support it provided, and their ability to monitor their blood glucose levels. As a consequence, they considered that it had assisted them in raising their confidence in managing their diabetes, improved their medication management, and improved their dietary and exercise habits. They also considered that their overall health state had improved, although this was not reflected in the individual quality of life measures. Some patients indicated at the completion of their participation that they were willing to pay more for the service than they had at the beginning of their participation, reinforcing the value they placed on the service.
These findings are consistent with the views expressed by pharmacists participating in the case studies. They reported that patients who were motivated to follow the advice offered regarding managing their diabetes made noticeable changes to their lifestyles, such as their exercise routine, diet and drinking patterns. This did not always reveal itself in the clinical measures, with only modest changes often observed, although there were some notable exceptions. Improvements in their medication management were also widely reported, as illustrated in the data. Patients who were less motivated did not demonstrate the same changes, and their results reflected this.
Overall, the DMAS appears to have had a positive impact on the majority of patients, mainly in their self-confidence and capacity to better manage their diabetes, and to adopt a healthier lifestyle. At this stage, however, these effects do not appear to have translated into a significant change in their clinical indicators, although this could occur later if they sustain the changes they have made.
E.3.4 ECONOMIC IMPACTS
IM P A C T O N PA T I E N T S
At this stage the DMAS appears to have had more of a psycho-social impact than a physical impact although this could occur later if they sustain the changes they have made.
The cost to patients of participating in the DMAS has been limited to the fee charged by the pharmacist for consultations with 90% being charged $5.00 or less. At the end of their participation in the program, 44% of patients did not change the amount they were willing to pay for the DMAS. However, 37% of patients were willing to pay more, while 20% indicated that they would want to pay less. This overall increase in willingness to pay for the service is indicative of the value patients placed on the DMAS.
Australian Government Department of Health and Ageing Evaluation of the Diabetes Pilot Program
Final Report January 2010 7
Given the positive feedback that patients have provided on the DMAS, their willingness to continue paying for the service (and in some instances to pay more), and the relatively low cost of their participation, we conclude that most patients would consider their participation in the DMAS to be cost-effective, and to represent value for money.
IM P A C T O N PH AR M A CY
The large majority of pharmacists did not regard it as a profit-making exercise in its own right, although increased patient loyalty resulting from their participation in the program might contribute to that outcome.
Whilst pharmacy staff may have benefitted from the training received and the expansion of their skill set, their capacity to apply these skills and knowledge has been limited by the number of patients recruited to the program. This has also limited the extent to which pharmacies have been able to expand their professional services across a large number of patients, with only 10% of the original target number of patients having participated in the program. Consequently, and notwithstanding the positive benefits that participating patients may have realised, the overall benefits to pharmacy are likely to be considerably lower than originally expected.
Conversely, the costs incurred by pharmacy are considerable, estimated on average at between $5,000 and $8,000 per annum over and above the payments received under the DMAS and patient fees. The large majority of these costs relate to the time spent in seeking to recruit patients to the program, which was not funded.
Despite the positive impact that pharmacists saw on patients participating in the program, and the professional development opportunities offered by the program for pharmacists, the benefits to the pharmacy itself have been significantly diminished by the low participation rates. With identified out-of-pocket costs plus opportunity costs, we conclude that many pharmacies would question whether their participation in the DMAS was cost-effective.
IM P A C T O N T H E HE ALT H SY S T E M
An economic evaluation of health care initiatives such as the DMAS seeks to identify the benefits that accrue to clients, service providers and the broader health system as a result of the initiative, and to compare those benefits to the costs incurred. Governments and other stakeholders may then form a judgement as to whether the benefits achieved warrant the costs incurred.
The investment by Government in the DMAS sought to increase community pharmacy capacity to provide services to patients with type-2 diabetes, thereby increasing access to such services by patients not engaged in existing services. The evidence gathered to date indicates that DMAS has succeeded in increasing professional service capacity in community pharmacies. However, translation of this increased capacity to service delivery has been very limited, due primarily to low patient participation rates. Consequently, the “reach” of the program has been much lower than originally expected. These low participation rates have also caused the cost per patient to increase nearly six-fold over the cost that would have been realised had patient participation expectations been met.
At the same time, the evidence from the pilot indicates that whilst some patients have improved their lifestyle factors and have reported valuing the service provided, there is limited evidence of any significant improvement in their clinical indicators to date. Consequently, the impact to date of the DMAS on patient well-being has largely been psycho-social rather than physical. Whilst further patient benefits may become evident in the longer term, there is no evidence to indicate that the DMAS has contributed to reduced health care costs to date.
Ultimately, the Department of Health and Ageing will determine whether or not the investment to date in the DMAS represents value for money, and whether ongoing investment is warranted. Clearly, however, the cost-effectiveness of the service would improve significantly from greater patient participation.

Australian Government Department of Health and Ageing Evaluation of the Diabetes Pilot Program
Final Report January 2010 8
E.4 OPTIONS FOR THE FUTURE
The DMAS provided the opportunity for 785 pharmacists to gain additional knowledge and skills in respect to Diabetes management and this will continue to be of benefit to the health system as another resource available to community members in managing their diabetes. Indeed having a larger number of Pharmacists around Australia trained and credentialed in providing Diabetes management advice as another resource in the broader health care system may be seen as being beneficial and worthy of further investment to enlarge the pool of trained Pharmacists. This is supported by the fact that patients who did enrol in DMAS reported benefits from the program such as increased confidence in managing their diabetes, enhanced ability to monitor their blood glucose levels and improvements in medication management. Whilst no significant improvements were observed in clinical outcome or behavioural change these may in fact be observed over a longer time frame.
Overall, patient recruitment was very low driven largely by a lack of perceived need by patients and/or patients being in receipt of other diabetes management services. Given this, continuation of the DMAS in its current form is not considered to be warranted nor does it appear to be economical. However, the data and case studies support that the service was more successful in those areas where other Diabetes management services do not exist or are infrequent. More specifically this was observed in rural areas. On this basis, the provision of DMAS in specific locations where services are non-existent or infrequent, as part of a broader diabetes management team (GP, visiting diabetic nurse educator, podiatrist etc.) should be considered.
Should the program be continued in some form, greater emphasis should also be placed on promoting the program amongst the general public and other service providers.
The evaluators would like to acknowledge and express our sincere appreciation for the contribution of all persons and organisations who have contributed to the evaluation, and especially the pharmacists and patients participating in the DMAS.

Australian Government Department of Health and Ageing Evaluation of the Diabetes Pilot Program
Final Report January 2010 9
1
INTRODUCTION
This chapter presents an overview of the background to the Diabetes Medication Assistance Service (DMAS) and its evaluation.
1.1 TYPE-2 DIABETES
At a global level, diabetes is predicted to increase dramatically in the next decade or two (McCarty et al, 1996)4. With an ageing and increasingly overweight and physically inactive population, and a cultural mix encompassing several groups known to be at high risk of type-2 diabetes, Australia is a prime candidate for realising the projected increases.
In Australia, according to current evidence based guidelines5, diabetes is the:
• Most common cause of blindness in people under the age of 60 years; • Second most common reason for a person to commence renal dialysis; and • Most common cause of non-traumatic amputation. Due to sheer numbers, most of this burden is attributable to type-2 diabetes which is the most common form, accounting for approximately 85% of all diabetes in Australia. Type-2 diabetes occurs predominantly from middle age onwards, although, in high risk populations such as Aboriginal and Torres Strait Islander people, it may manifest much earlier. The Australian Diabetes costing study suggests there is one person with undiagnosed diabetes for every person with diagnosed type-2 diabetes6.
Type-2 diabetes represents a complex interaction of patho-physiological factors and its successful management requires clinicians to maintain a thorough understanding of these interactions especially since there is now good evidence that adherence to certain processes and clinical practices reduces long term diabetes complications (UKPDS 33, 1998)7.
Successful clinical management of diabetes is closely linked to the self care knowledge, ability and capacity of the person with diabetes, who must adapt their lifestyle if they are to optimise their physical and psychological well being. Clinicians have to be aware of these principles of chronic disease management, and use them in developing effective strategies for positive behaviour change and maintenance8.
4 McCarty DJ, Zimmet P, Dalton A, Segal L, Welborn TA. (1996),The rise & rise of diabetes in Australia,1996. A review of statistics, trends and costs.
Diabetes Australia National Action Plan;Canberra:1996. 5 NHMRC (2007), National Evidence Based Guidelines for the Management of Type 2 Diabetes Mellitus: Introduction and overview of the Guidelines
development process, prepared by the Australian Centre for Diabetes Strategies, Prince of Wales Hospital, Sydney for the Diabetes Australia Guidelines Development Consortium
6 Colagiuri S, Colagiuri R, Conway B, Grainger D, Davey P. (2003) DiabCo$t Australia: Assessing the burden of Type 2 Diabetes in Australia, Diabetes Australia, Canberra, December, 2003.
7 KPDS. (1998) The UK Prospective Diabetes Study 33: Intensive blood glucose control with sulphonylureas or insulin compared with conventional treatment and risk of complications in patients with type 2 diabetes. Lancet Vol;352 pp 837-853.
8 NHMRC (2007) op cit page 2

Australian Government Department of Health and Ageing Evaluation of the Diabetes Pilot Program
Final Report January 2010 10
Type-2 diabetes is typically managed by the patient’s GP, who ‘shares care’ with other health professionals such as diabetes educators and/or endocrinologists. In remote Australia, and where the population base is insufficient to support such specialist services, GPs may not have local access to specialist referral and support services. Regardless of geographical factors, standards of diabetes clinical care in Australia are known to be variable9.
1.2 THE ROLE AND CONTRIBUTION OF COMMUNITY PHARMACY TO
DIABETES MANAGEMENT
Community pharmacies are an integral part of the Australian healthcare system with about 5,000 shop-front centres across the county where the community can access affordable medicines and free healthcare and medicine management advice and information. Community pharmacists and their staff often act as a first point of contact for many health issues. They provide clients with direct advice, information or treatment as well as refer them to other appropriate health professionals or community services as required. Most community pharmacies are committed to monitoring the quality of their healthcare service delivery.
Being accessible, available, and in frequent contact with the public in respect to their health care needs, community pharmacists are ideally placed to assist in the detection, education and referral of individuals with or at risk of chronic disease including diabetes. In particular they represent an important channel for delivery of education and support in medication management. The following represents some of the key ‘programs’ where community pharmacists have a role and contribute to the management of Diabetes.
1.2.1 THE PHARMACY DIABETES CARE PROGRAM
The Pharmacy Diabetes Care Program (PDCP) was designed under the Third Community Pharmacy Agreement to investigate a Disease State Management (DSM) Model for people with type-2 diabetes. The aims of the Pharmacy Diabetes Care Program10 were to:
• Improve the health of people with diabetes; • Identify and refer as appropriate people with undiagnosed diabetes; and • Support the continuity of care for people with diabetes.
The model consisted of two components, a Screening Service, and, a Diabetes Medication Assistance Service (DMAS). The critical elements of the DMAS included patient education, support and monitoring to facilitate self-management in those with established disease. For those at risk, the focus was on education and referral.
The findings of the evaluation of the initial DMAS were that it was effective at improving diabetes control as measured by blood glucose levels and glycated haemoglobin (HbA1C). The evaluation reported that the service also increased patients’ understanding of long-term management of their diabetes and improved their adherence to medications. Pharmacists utilised a range of interventions to improve the care and well-being of their patients. Monitoring of the progress of the disease appeared to be an essential element of the disease state management process. Both pharmacists and patients identified several benefits of the service and expressed great satisfaction with the service. The DMAS pilot was reported to be cost-effective when compared to other programs. As a result the program continued to be funded under the Fourth Pharmacy Agreement, focusing on wider implementation and ongoing evaluation.
9 NHMRC (2007) op cit loc cit 10 Krass B (2005) op cit

Australian Government Department of Health and Ageing Evaluation of the Diabetes Pilot Program
Final Report January 2010 11
1.2.2 THE FOURTH COMMUNITY PHARMACY AGREEMENT
The Fourth Community Pharmacy Agreement between the Australian Government and the Pharmacy Guild of Australia was signed in November 2005, and covers the period 1 December 2005 to 30 June 2010. The Fourth Agreement aims to ensure that Australians can continue to access the PBS medicines that they need, at prices they can afford, regardless of where they live.
The Fourth Agreement provides the ability for community pharmacies to take a greater role in helping consumers as well as assisting GP’s in the monitoring and management of chronic illnesses such as diabetes. In such cases, pharmacists are able to provide clients with ongoing medication advice, support and assistance in self-management of chronic illnesses.
Under the Better Community Health program of the Fourth Agreement, a number of priority programs have been funded that aim to enhance medication management by patients in the community. Whilst the DMAS is more specifically a disease state management program, these medication management programs are considered complimentary to the DMAS and their level of utilisation in conjunction with DMAS was measured in the evaluation. These programs include:
Dose Administration Aids (DAAs)
The Dose Administration Aids program aims to reduce medication related hospitalisation and adverse events through improving medication compliance for people in the community, including those on multiple medications or who are confused.
Medication Profiling
Medication profiling aims to reduce the risk of medication related adverse events through educating and involving people with respect to their medications by providing them with a clear and concise summary of their current medications.
Medication Management Review was also a priority program under the Fourth Community Pharmacy Agreement and included a Home Medicines Review (HMR) service.
Home Medicine Review (HMR) Service
The goal of the HMR is to maximise an individual patient's benefit from their medication regimen. The review involves a team approach including the patient’s GP, their preferred community pharmacy and an accredited pharmacist, with the patient as the central focus. An HMR may also involve other relevant members of the health care team, such as nurses in community practice or carers.11
The pharmacist who visits the patient’s home, looks at all of the patient’s medicines, including both prescription medicines and any that have been bought without a prescription, for example at a supermarket or a health food store. The pharmacist will then talk to the patient about how they should take the medications and any difficulties or uncertainties that the patient may have. The pharmacist then talks with the GP about the results of the home visit and the GP will then talk directly to the patient about any changes that might be needed.
1.2.3 THE DIABETES MEDICATION ASSISTANCE SERVICE (DMAS)
As discussed above a DMAS first operated under the PDCP. Following the operational and clinical success of the DMAS under the PDCP, the further roll-out of DMAS has occurred in two stages under the Fourth Agreement. The program reviewed and refined the DMAS over two stages, the first being an implementation across four states involving 90 pharmacies and the second involving 800 pharmacies Australia-wide. The second of these stages is the subject of this evaluation report.
DMAS is an ongoing cycle of assessment, management and review of patients with type-2 diabetes, provided by the community pharmacist at regular intervals in the pharmacy, in collaboration with GPs and members of the diabetes care team.
11 HMR – Home medicine review, http://www.awdgp.org.au/site/index.cfm?display=5471#links, viewed July 2007.
Australian Government Department of Health and Ageing Evaluation of the Diabetes Pilot Program
Final Report January 2010 12
DMAS aims to assist patient self-management and improve the quality use of medicines for people with diabetes through regular consultation with the patient, monitoring of Blood Glucose Levels (BGLSs)and providing lifestyle advice.
1.3 EVALUATION OF DMAS
The evaluation of Stage 2 of DMAS has been undertaken by Health Outcomes International (HOI), under contract to the Department of Health and Ageing. This report presents the findings of the evaluation.
1.3.1 EVALUATION OBJECTIVES
The over-arching objective of the evaluation is to assess the cost and affordability of the DMAS, including the financial impact on the health system.
The evaluation also assesses whether the clinical outcomes achieved through the PDCP under the Third Agreement’s Research and Development Program can be replicated when implementing the DMAS in a broader community pharmacy setting. There are three perspectives from which the project is evaluated:
• Participating pharmacies and other health professionals; • People with type-2 diabetes participating in the program; and • The broader health system.
1.3.2 EVALUATION APPROACH
To address the objectives of the evaluation, process, impact and economic evaluation approaches have used.
PR OC E S S EV A L U A T I O N
Process evaluation12 involves assessing the processes involved in program operation and delivery and whether they are contributing to the achievement of outcomes. It describes and assesses both program materials and activities. It is aimed at fully understanding how the program works to achieve the intended outcomes.
A process evaluation measures such things as management, design, planning, resourcing, communication, training, monitoring, measurement, reporting, review and improvement13. For Stage 2 DMAS, the process evaluation investigates methods to improve and facilitate the implementation of the DMAS within community pharmacies and by people with type-2 diabetes.
IM P A C T EVALUATI O N
An impact evaluation assesses the overall effects of the program (short-term, medium-term and long-term) and whether it has made a difference to the participants14. In addition, the evaluation is aimed at establishing whether or not the program was the cause of the outcomes.15.
An impact evaluation measures such things as changes in practice, changes in health status and changes in behaviour, but also identifies any problems or difficulties experienced during implementation, any gaps in the program or its outcomes and suggests recommended improvements16.
For the purposes of this evaluation, the measurement of clinical outcomes assists in determining the possible effects of the program when rolled out on a wider basis.
12 World Health Organisation. Process Evaluation. 2000. http://whqlibdoc.who.int/hq/2000/WHO_MSD_MSB_00.2e.pdf 13 New Zealand Ministry of Health. Evaluation of the home Based Support Services Training Initiative 2006: an Evaluation Framework. p12 14 ibid 15 Alberta Consultative Health research Network. Impact Evaluation. http://www.achrn.org/impact_evaluation.htm 16 Alberta Consultative Health research Network. Impact Evaluation. http://www.achrn.org/impact_evaluation.htm
Australian Government Department of Health and Ageing Evaluation of the Diabetes Pilot Program
Final Report January 2010 13
EC O N O MI C EVALUATI O N
An economic evaluation17 is the systematic appraisal of costs and benefits of projects. There are a number of economic evaluation approaches depending on the purpose of the evaluation. In this evaluation the focus is on cost-effectiveness of the program in terms of the cost of the program versus the outcomes achieved and costs saved elsewhere (i.e. in the health system).
Outcomes used in the cost-effectiveness analysis include both clinical outcomes (using the agreed clinical outcomes measures) and qualitative outcomes reported by patients.
1.3.3 DATA SOURCES
The data sources used in the evaluation include:
• An on-line database on which all participating pharmacists were required to report a range of pharmacy, administrative and patient data on a quarterly basis;
• Patient surveys conducted at the commencement and completion of their participation in the program;
• Case studies among a sample of participating pharmacies; and • Additional information, data and reports provided by the Department of Health and Ageing and
the Pharmacy Guild of Australia, together with telephone discussions with a range of other stakeholder representatives.
HOI ON-LINE DA T A B A S E
HOI developed a web-based database for the on-line reporting of information by pharmacists on a quarterly basis. This data includes implementation processes, (limited to throughput and activity levels), program costs and impacts. To avoid an excessive reporting impost on pharmacies, some information was requested only once (at 6 months) or twice (at 6 months and program completion) with the remainder submitted on a quarterly basis.
Clinical data was provided for a sample of 50% of patients in each participating pharmacy. The patient dataset was de-identified and patients were required to consent for the provision of this data. Ethics approval was sought and obtained from the Department of Health and Ageing’ Ethics Committee for this process.
PA TI E N T SURVE YS
A patient survey was developed for administration at the sampled patients’ first and last visits to the pharmacist in the DMAS. The survey sought patients’ perspectives on their participation in the program (including their willingness to pay for the service) and the extent to which they (a) reported an improvement in health and (b) attributed it to their participation in the DMAS.
The EuroQol (EQ-5D) five dimensional quality of life tool was included in the survey for self-completion by respondents providing continuity with the approach used in DMAS Stage 1.
This survey was distributed to the same patients for whom clinical data was provided on the on-line system and from whom informed consent had been obtained. The Department of Health and Ageing Ethics Committee provided approval for this component of the data collection.
CA S E STU D IE S
Case studies were conducted among a sample of 20 participating pharmacies. They provide largely qualitative information about the implementation of the initiative and the impacts arising from the
17 National Information Center on Health Services Research and Health Care Technology (NICHSR). United States Of America National
Library. Glossary of Frequently Encountered Terms in Health Economics- Economic Evaluation. http://www.nlm.nih.gov/nichsr/edu/healthecon/glossary.html

Australian Government Department of Health and Ageing Evaluation of the Diabetes Pilot Program
Final Report January 2010 14
intervention, enabling systematic examination of what happened, how, in what context, and the future implications for the initiative and the health service environment18 19.
Case studies were used in the evaluation to further investigate particular trends in the data associated with issues such as:
• The geographic location of the pharmacy; • Patient recruitment and withdrawal patterns; • Patient clinical impact (or lack thereof); • Program costs; and • Other trends identified through the analysis of evaluation data.
1.3.4 OTHER INFORMATION SOURCES
Further relevant data and information was provided by the Pharmacy Programs Section, Community Pharmacy Branch of the Department of Health and Ageing, and by the Pharmacy Guild of Australia. Consultations were also held with representatives from:
• The Australian Association of Consultant Pharmacy; • The Australian Diabetes Educators Association; • The Australian General Practice Network; and • Diabetes Australia.
The evaluators would like to acknowledge and express our sincere appreciation for the contribution of all persons and organisations who have contributed to the evaluation, and especially the pharmacists and patients participating in the DMAS.
18 Education and debate. Correspondence to Authors Keen, J & Packwood, T (1995). Qualitative Research: Case study evaluation. British
Medical Journal;311:444-446. http://www.bmj.com/cgi/content/full/311/7002/444 19 Davey, L. (1991). The Application of Case Study Evaluations. ERIC Clearinghouse on Assessment and Evaluation.
http://pareonline.net/getvn.asp?v=2&n=9

Australian Government Department of Health and Ageing Evaluation of the Diabetes Pilot Program
Final Report January 2010 15
2
IMPACT ON PHARMACIES
This chapter provides a description of the impact of the DMAS on participating pharmacies. It includes a description of the registration and training processes, a profile of participating pharmacies, levels of participation by pharmacists and patients, promotion of the program, time and money spent on the program by pharmacies, relationship with other diabetes programs and professionals and the impact of these factors in respect to the outcome of the program.
2.1 REGISTRATION AND TRAINING OF PHARMACISTS
2.1.1 REGISTRATION AND RETENTION OF PHARMACISTS
Registration of pharmacists for the DMAS was completed in the first quarter of the program with 819 applications received. Of the 819 applications, 760 were offered a place as per the proposed PhARIA distribution. The remaining 40 vacancies were filled from the excess applications.
By the end of the September 2009 quarter, all pharmacists registered for the program had been trained. By the end of 2009, a total of 785 trained and credentialed pharmacists had been entered onto the evaluation data base and provided with the required information to enter evaluation data into the on-line system. This represents 98% of the target of 800 pharmacists to be trained. The distribution of credentialed pharmacists by PhARIA is closely aligned with the planned distribution at commencement of the program.
Subsequent to the training and credentialing process, 108 pharmacists (14% of those trained) have formally withdrawn from the program at various points for a variety of reasons. From discussions with the Guild and HOI’s consultations with pharmacists, withdrawal from the program generally occurred as a result of two main factors: (1) Low patient recruitment numbers and (2) Limited capacity to deliver the DMAS due to competing priorities in the pharmacy.
2.1.2 TRAINING
The effectiveness of the training provided by the Pharmaceutical Society of Australia (PSA) was discussed with case study participants. All of those consulted reported that the training provided by the PSA was both appropriate and useful in developing their knowledge of diabetes, and practical in assisting them to apply this knowledge to providing patient services under the DMAS.
Additional comments made about the training and associated support materials within this overall finding included:
• The amount of pre-reading required before participating in training surprised most of the case study pharmacists, and was considered excessive, to the point where most did not complete it.
• Several pharmacists considered the training to be more theoretical than practical, although they considered the clinical elements of the training to be particularly useful.
• More emphasis during training on role-playing and the practical elements of service delivery would have been useful.
• The information provided in the Pharmacy Readiness Kit (PRK) was useful, but considered to be too detailed. More concise/abridged information would have been useful.

Australian Government Department of Health and Ageing Evaluation of the Diabetes Pilot Program
Final Report January 2010 16
• Being able to access the support materials on-line was considered to be very useful. • Translating the training into practice was generally considered to be successful, although this
was adversely affected in some instances by (1) low numbers of patients participating, and (2) the lag between training and the recruitment of patients.
• Overall, participants felt that there was too much paperwork involved, both in the training and the program generally. This should be balanced, however, with the fact that this was a pilot program, and the requirements for data collection and reporting may be expected to be greater under these circumstances.
2.2 PARTICIPATION BY PHARMACISTS
2.2.1 REASONS FOR PARTICIPATING IN DMAS
Case study pharmacists were asked about their reasons for participating in the DMAS. Overwhelmingly, they responded that the program provided them with the opportunity to extend the professional services of their pharmacy, and to expand their activities beyond the traditional dispensing function. As such, they considered that it added further value to the services they offer their patients. No pharmacist reported participating in the program for financial reasons – they did not see it as a profit-making service.
Other positive comments received about DMAS included:
• Its links to other pharmacy-based programs such as QUM, HMR and DAA. • Obvious synergies to their participation in the NDSS. • DMAS provided the opportunity for further training and professional development of
pharmacists. • A number of pharmacists reported having a long interest in diabetes and other chronic illnesses
and DMAS provided the opportunity to pursue those interests further.
2.2.2 PARTICIPATION RATES BY PHARMACISTS
At the end of February 2010 (the final cut-off date for this report), 493 pharmacists (63% of 785 credentialed pharmacists) had entered some form of data (Pharmacy data; Administrative data or Patient data) into the on-line system. Conversely, 292 credentialed pharmacists (37%) have not entered any data in to the on-line system. Of the 493 pharmacists who have entered any data, 251 (51%) have entered some level of patient data for 611 patients.
Through our direct consultations with pharmacists either through telephone interviews with a sample of pharmacists conducted in mid-2009 or through day-to-day contact when responding to evaluation queries, it is apparent that many pharmacists have not entered data until they have recruited a patient. Through these consultations we have also been able to confirm that the on-line system itself has not been a barrier to pharmacists entering data. Consequently, we have concluded that the 292 credentialed pharmacists who did not enter any data onto the system had not recruited any patients to the program.
Given that a key success factor for the program is the recruitment of patients, it is reasonable to suggest that the definition of an ‘active’ pharmacist should be those pharmacists who have enrolled at least one patient and provided them services under the DMAS, as reflected by the patient data entered in the on-line system. This should not be seen as detracting from the efforts of the remaining 534 credentialed pharmacists who may have sought to recruit patients without success, and who may or may not have entered data onto the system.
On this basis, the number of ‘active’ DMAS pharmacists is 251. This represents 32% of the original 785 pharmacists trained and credentialed. As illustrated in
Australian Government Department of Health and Ageing Evaluation of the Diabetes Pilot Program
Final Report January 2010 17
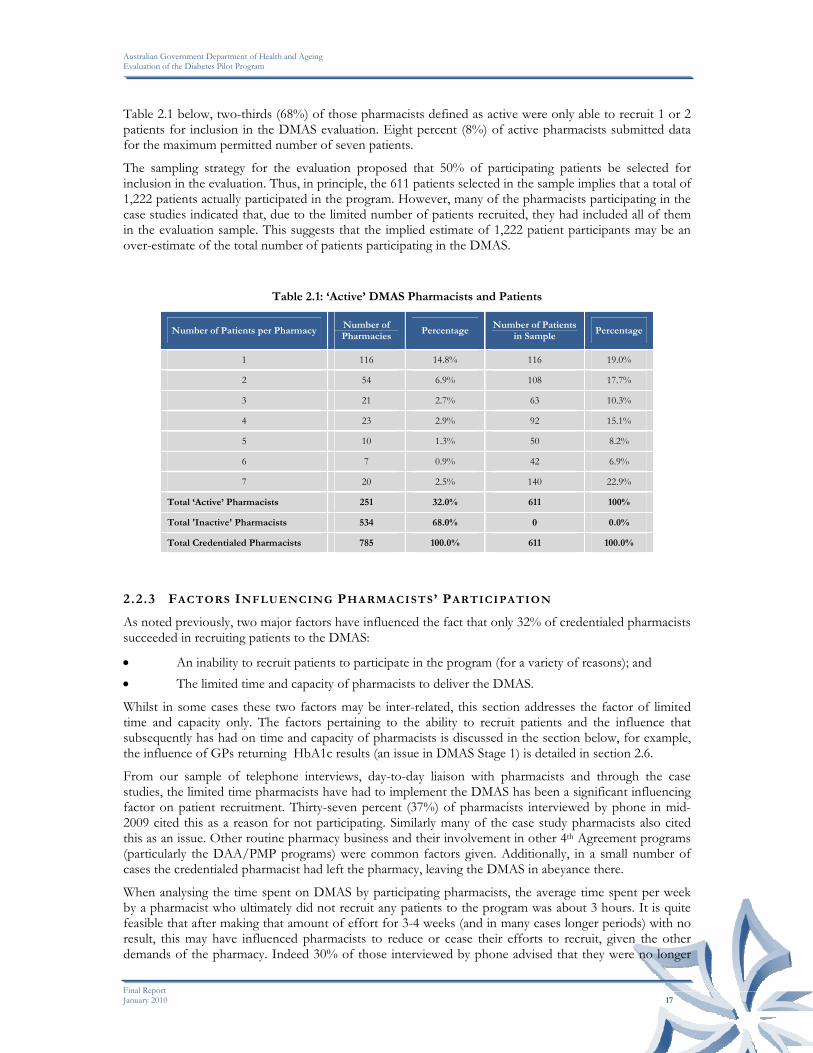
Table 2.1 below, two-thirds (68%) of those pharmacists defined as active were only able to recruit 1 or 2 patients for inclusion in the DMAS evaluation. Eight percent (8%) of active pharmacists submitted data for the maximum permitted number of seven patients.
The sampling strategy for the evaluation proposed that 50% of participating patients be selected for inclusion in the evaluation. Thus, in principle, the 611 patients selected in the sample implies that a total of 1,222 patients actually participated in the program. However, many of the pharmacists participating in the case studies indicated that, due to the limited number of patients recruited, they had included all of them in the evaluation sample. This suggests that the implied estimate of 1,222 patient participants may be an over-estimate of the total number of patients participating in the DMAS.
Table 2.1: ‘Active’ DMAS Pharmacists and Patients
Number of Patients per Pharmacy Number of Pharmacies
Percentage Number of Patients
in Sample Percentage
1 116 14.8% 116 19.0%
2 54 6.9% 108 17.7%
3 21 2.7% 63 10.3%
4 23 2.9% 92 15.1%
5 10 1.3% 50 8.2%
6 7 0.9% 42 6.9%
7 20 2.5% 140 22.9%
Total ‘Active’ Pharmacists 251 32.0% 611 100%
Total 'Inactive' Pharmacists 534 68.0% 0 0.0%
Total Credentialed Pharmacists 785 100.0% 611 100.0%
2.2.3 FACTORS INFLUENCING PHARMACISTS’ PARTICIPATION
As noted previously, two major factors have influenced the fact that only 32% of credentialed pharmacists succeeded in recruiting patients to the DMAS:
• An inability to recruit patients to participate in the program (for a variety of reasons); and • The limited time and capacity of pharmacists to deliver the DMAS.
Whilst in some cases these two factors may be inter-related, this section addresses the factor of limited time and capacity only. The factors pertaining to the ability to recruit patients and the influence that subsequently has had on time and capacity of pharmacists is discussed in the section below, for example, the influence of GPs returning HbA1c results (an issue in DMAS Stage 1) is detailed in section 2.6.
From our sample of telephone interviews, day-to-day liaison with pharmacists and through the case studies, the limited time pharmacists have had to implement the DMAS has been a significant influencing factor on patient recruitment. Thirty-seven percent (37%) of pharmacists interviewed by phone in mid-2009 cited this as a reason for not participating. Similarly many of the case study pharmacists also cited this as an issue. Other routine pharmacy business and their involvement in other 4th Agreement programs (particularly the DAA/PMP programs) were common factors given. Additionally, in a small number of cases the credentialed pharmacist had left the pharmacy, leaving the DMAS in abeyance there.
When analysing the time spent on DMAS by participating pharmacists, the average time spent per week by a pharmacist who ultimately did not recruit any patients to the program was about 3 hours. It is quite feasible that after making that amount of effort for 3-4 weeks (and in many cases longer periods) with no result, this may have influenced pharmacists to reduce or cease their efforts to recruit, given the other demands of the pharmacy. Indeed 30% of those interviewed by phone advised that they were no longer
Australian Government Department of Health and Ageing Evaluation of the Diabetes Pilot Program
Final Report January 2010 18
making attempts to recruit patients. This was also reinforced in the case studies, with pharmacists stating that their enthusiasm waned as frustration grew with patients declining to participate and other inhibiting factors.
As previously noted, pharmacists’ decisions to participate in the DMAS were not based on financial gain, however there is an opportunity cost in undertaking these activities. The case studies indicated that whilst the payment received for the consultations with recruited patients was generally consistent with the time spent on this activity, it did not cover the significant amount of time that pharmacists spent in trying to recruit patients in the first instance. As this activity continued (often without success) there was increasing financial pressure to use this time for other, revenue-earning pharmacy activities. Had those recruitment efforts been more successful, this pressure may have been less. Consequently, we have concluded that the financial cost associated with unsuccessful patient recruitment has been a factor, at least to some degree, in pharmacists limiting or ceasing their efforts to recruit patients.
An analysis of the data entered into the on-line system indicates that there are a number of factors that do not appear to have contributed systematically to the lack of patient participation. That is, participation rates were consistently low across all of these factors. These factors include:
• State/Territory • PhARIA • Size of pharmacy • Location of pharmacy • Type of ownership • Number of pharmacists. (Tables supporting these findings are presented in Appendix A)
The only real exception was PhARIA where participation rates in PhARIA 3, 4 and 5 were still low (<1.8 patients per pharmacy), however, greater than in PhARIA 1 and 2 (< 1 patient per pharmacy). However, the issue was highlighted more so by our telephone interviews and case studies. About half of the rural pharmacies included in the case studies indicated that recruitment had been more successful in these areas as a result of a close relationship with the GP(s), and a shortage of alternative diabetes services in these areas.
This was further emphasised by a Community Pharmacist who was offering the DMAS in both a Metropolitan and Rural Pharmacy. She noted that there was much stronger interest by patients for the DMAS in the rural pharmacy as a result of infrequent visits by the diabetic nurse educators from the region’s centre. Additionally, the Community Pharmacist had a long term and strong relationship with the local GPs who were referring to and/or supporting the DMAS.
These findings suggest a more focussed provision of DMAS in those areas where other Diabetes management services are infrequent or do not currently exist and that could be integrated with General Practice and/or other services could be of significant value to patients with Diabetes.
2.3 PARTICIPATION BY PATIENTS
This section discusses the level of and factors influencing participation by patients in the DMAS and the inter-relatedness of these factors with pharmacist participation.
2.3.1 PATIENT PARTICIPATION RATES
The evaluation used two methods for identifying participation by patients in the DMAS. Whilst these two data sets do not necessarily align exactly, there are aspects of each that are informative to the evaluation.
• Pharmacists entered data into the on-line system in respect to patients approached, referred, eligible/ineligible, declining, and withdrawing that allows a summation of those participating; and

Australian Government Department of Health and Ageing Evaluation of the Diabetes Pilot Program
Final Report January 2010 19
• Pharmacists entered patient data at Consultations 1-5 that confirm actual enrolment among the 50% evaluation sample of patients in DMAS.
In the case of the first data entry process, understanding the total numbers of people approached, the proportion not interested and the proportion not eligible contributes to an understanding of the reasons people did not participate.
The latter data entry process identifies the number of actual participants in the program in the evaluation sample and also provides demographic information, health background and outcomes from their participation in the program.
ACT UAL PA RT I C I P A N T S
The actual number of patients participating in the program is very low compared to original expectations. At the end of February 2010, data for the 50% sample of patients in the evaluation had been entered for a total of 611 patients, of whom 569 (93%) had some consultation data recorded.
In the context of the program:
• Patient data had only been received from 37% of the credentialed pharmacists (n=251) who were offering the DMAS (n=677).20,
• The actual number of patients (n=611) enrolled in the evaluation sample compared to the potential sample size of 5,495 participants (785 pharmacists with up to 7 patients in the evaluation sample), represents 11% of the potential sample size. Adjusted for the number of pharmacists who were offering DMAS, this represent 13% of the potential sample size.
• The number of actual patients in the evaluation sample (n=611) represents 0.78 patients for every pharmacist trained (n=785) or 0.90 for every pharmacist offering the DMAS. If this represents 50% of the total number of participants, then the average number of patients per pharmacist trained would still only be 1.56/1.80.
In respect to the actual total number of patients participating in the program, given the nature of the sampling strategy (i.e. every second patient to be included in the evaluation), and assuming that all participating pharmacies followed that strategy, then the number of patients participating in the program could range from 971 to 1,453. As noted previously, the case studies indicated that some pharmacists had included all participating patients in the evaluation sample, particularly where patient recruitment was low. It is also possible that some pharmacists with patients have not entered data, however, our experience indicates that patient recruitment is often the trigger for the commencement of data entry. Assuming that at the conclusion of the program the upper estimate of 1,453 patients were participating, this still only represents 1.88 patients per trained pharmacist or 13% of the potential program size.
PA TI E N T RE C RU IT M EN T PR OC E S S E S
In addition to their knowledge of the clinical history of the patient and hence making a direct approach to the patient, pharmacists utilised a range of tools in an effort to engage eligible patients in the DMAS, including the Guild Brochure and Poster, and a mailed letter. The case studies also revealed that in some locations (particularly in rural areas), pharmacists made a direct approach to the local GP to identify and recruit patients to the program – an approach that was found to be quite successful. However, the most common approach was a direct invitation to the patient based on their dispensing history that was supported by provision of the Guild brochure. The number of patients approached was recorded by pharmacists.
Pharmacists also recorded the number of referrals they received from other professionals for possible enrolment in the DMAS, however these were minimal. As illustrated in Table 2.2 overleaf , 10,353 patients were approached and a further 406 customers were referred by other health professionals, with the total number of patients contacted being 10,759.
20 108 pharmacists formally withdrew from the program after completing the training and credentialing process leaving 677 who were offering
DMAS to their customers.
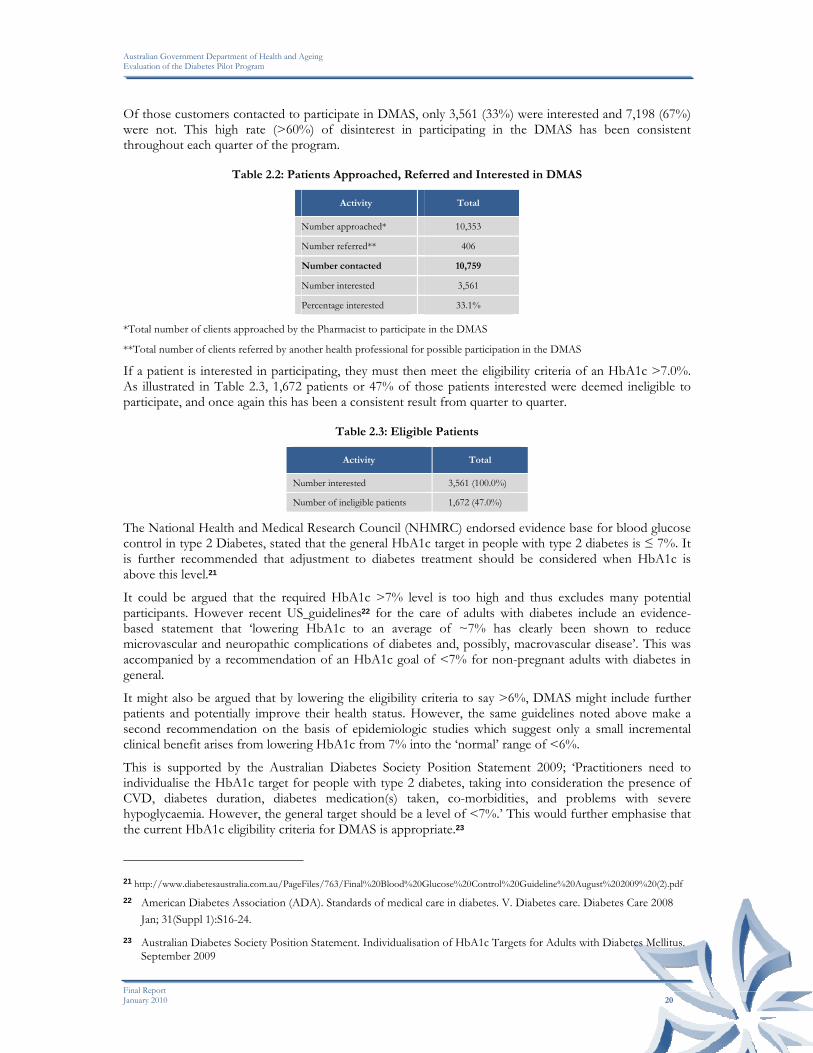
Australian Government Department of Health and Ageing Evaluation of the Diabetes Pilot Program
Final Report January 2010 20
Of those customers contacted to participate in DMAS, only 3,561 (33%) were interested and 7,198 (67%) were not. This high rate (>60%) of disinterest in participating in the DMAS has been consistent throughout each quarter of the program.
Table 2.2: Patients Approached, Referred and Interested in DMAS
Activity Total
Number approached* 10,353
Number referred** 406
Number contacted 10,759
Number interested 3,561
Percentage interested 33.1%
*Total number of clients approached by the Pharmacist to participate in the DMAS
**Total number of clients referred by another health professional for possible participation in the DMAS
If a patient is interested in participating, they must then meet the eligibility criteria of an HbA1c >7.0%. As illustrated in Table 2.3, 1,672 patients or 47% of those patients interested were deemed ineligible to participate, and once again this has been a consistent result from quarter to quarter.
Table 2.3: Eligible Patients
Activity Total
Number interested 3,561 (100.0%)
Number of ineligible patients 1,672 (47.0%)
The National Health and Medical Research Council (NHMRC) endorsed evidence base for blood glucose control in type 2 Diabetes, stated that the general HbA1c target in people with type 2 diabetes is ≤ 7%. It is further recommended that adjustment to diabetes treatment should be considered when HbA1c is above this level.21
It could be argued that the required HbA1c >7% level is too high and thus excludes many potential participants. However recent US guidelines22 for the care of adults with diabetes include an evidence-based statement that ‘lowering HbA1c to an average of ~7% has clearly been shown to reduce microvascular and neuropathic complications of diabetes and, possibly, macrovascular disease’. This was accompanied by a recommendation of an HbA1c goal of <7% for non-pregnant adults with diabetes in general.
It might also be argued that by lowering the eligibility criteria to say >6%, DMAS might include further patients and potentially improve their health status. However, the same guidelines noted above make a second recommendation on the basis of epidemiologic studies which suggest only a small incremental clinical benefit arises from lowering HbA1c from 7% into the ‘normal’ range of <6%.
This is supported by the Australian Diabetes Society Position Statement 2009; ‘Practitioners need to individualise the HbA1c target for people with type 2 diabetes, taking into consideration the presence of CVD, diabetes duration, diabetes medication(s) taken, co-morbidities, and problems with severe hypoglycaemia. However, the general target should be a level of <7%.’ This would further emphasise that the current HbA1c eligibility criteria for DMAS is appropriate.23
21 http://www.diabetesaustralia.com.au/PageFiles/763/Final%20Blood%20Glucose%20Control%20Guideline%20August%202009%20(2).pdf 22 American Diabetes Association (ADA). Standards of medical care in diabetes. V. Diabetes care. Diabetes Care 2008
Jan; 31(Suppl 1):S16-24. 23 Australian Diabetes Society Position Statement. Individualisation of HbA1c Targets for Adults with Diabetes Mellitus.
September 2009

Australian Government Department of Health and Ageing Evaluation of the Diabetes Pilot Program
Final Report January 2010 21
After being deemed eligible, 266 patients subsequently declined to enrol in the program or participants withdrew from the program. These factors result in a net estimated number of 1,623 participants or 46% of those originally interested. Hence, the original potential pool of 10,759 participants was reduced by approximately 67% as a result of patient lack of interest and, of those interested, 47% were excluded due to non-eligibility. The final number of patients participating represents approximately 15% of those originally approached/referred as illustrated in Table 2.4 below.
Table 2.4: Eligible Patients
Activity Total
Number interested 3,561 (100.0%)
Number of eligible patients 1,889 (53.0%)
Number eligible who declined/withdrew 266
Number ‘participating’ 1,623 (46%)
2.4 FACTORS CONTRIBUTING TO PATIENTS NOT PARTICIPATING
Given the low levels of participation, it is critical to understand the reasons why patients elected not to participate. Three data sources have been used in this analysis: (1) what patients who declined to participate told pharmacists; (2) deductions made from the information gathered from participating patients; and (3) case studies of participating pharmacists.
2.4.1 FEEDBACK FROM PATIENTS WHO DECLINED TO PARTICIPATE
Information relating to this issue was collected directly from patients by pharmacists at the time they were approached and declined to be involved, with their responses entered into the on-line data base. More than one reason could be provided.
The most common reason given by patients approached for not participating in the DMAS was their perception that they had no need to improve their health (24% of patients declining). This reason was given at twice the rate of the next most common reason, which was that patients were already participating in another program (12%).
Being advised by another health professional not to participate was recorded in 9% of cases and may be associated with the patient’s involvement in other programs.
Also of note was that 8% of patients cited inconvenience as a reason not to participate. This may suggest that they did not perceive their attendance at a community pharmacy as being a convenient time to seek assistance with their diabetes.
Cost influenced nearly 7% of clients to decline participation, although approximately 49% of pharmacists charged the minimum rate of patient contribution of $2.75 and 90% charged $5 or less. Combined with an unwillingness to purchase a downloadable glucometer (6%), another possible cost related factor, it appears that some patients were deterred by cost, however, this was not at a level that would seem to jeopardise the success of the program.
The full range of reasons for declining to participate is detailed in Table 2.5 below.
Table 2.5: Reasons for Patients Declining to Participate
Factor Response Rate
No need to improve health (customer perception) 23.7% (1,706)
Already participating in other programs/services 12.3% (884)
Other 12.3% (882)
Advised by health professional 8.5% (609)

Australian Government Department of Health and Ageing Evaluation of the Diabetes Pilot Program
Final Report January 2010 22
Factor Response Rate
Inconvenience 8.2% (591)
Cost 6.6% (478)
Not willing to purchase downloadable glucose meter 5.8% (415)
Advised by family/carer 1.6% (117)
2.4.2 LEARNINGS FROM PARTICIPATING PATIENTS
As the on-line data system only collects information for participating patients, it is not possible to directly analyse factors relating to non-participating patients. However, if, from an analysis of the participating patient and pharmacy-related factors, the reasons for participation could be determined, it could be conversely assumed that the opposite/absence of these factors might affect non-participation.
PH A R M A C Y-RE LA TE D FA C T O RS
As noted previously, an analysis of patient participation levels was undertaken against pharmacy-related factors including State/Territory, PhARIA, pharmacy size, location of pharmacy, type of ownership and the number of pharmacists employed. With the exception of PhARIA 3, 4 and 5 where there was some moderately greater success with recruitment, the proportion of pharmacists successfully recruiting patients to the program was consistent with their representation in the profile of credentialed pharmacists. (See Appendix A for detailed tables). We have therefore concluded that with the exception of some PhARIA these factors have not had an influence on the level of patient participation, and conversely that none of these factors influenced the level of non-participation.
PA TI E N T DE M O G R A P HY
The second factor considered is that of the relationship between the demographic profile of patients and the participation rates in the DMAS. AGE
Research shows that the youngest average age of diagnosis for type-2 diabetes is 39 years where both parents have diabetes and 48 years where there is no family history.24
The age range of the DMAS participants was 17-90 years and the mean age was 62.4 years. 82% of patients were aged between 51 years and 80 years, and 96% were older than 40 years. The following figure illustrates the age distribution of DMAS patients.
The age distribution indicates that the program is responding to all of the relevant age groups above 41 years, which approximates to the average age of diagnosis of type-2 diabetes in the general population. This suggests that the age of patients is not a factor in program participation.
24 http://www.diabetesnsw.com.au/campaign_familyhistory/runsinfamily.asp
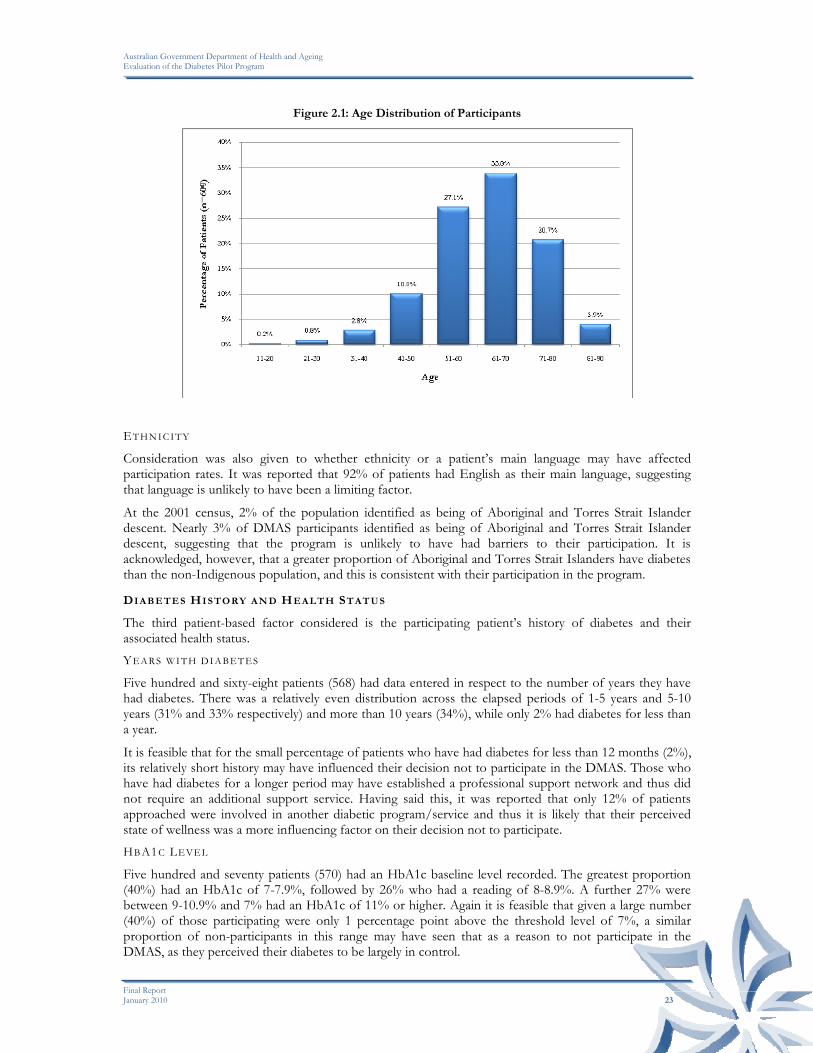
Australian Government Department of Health and Ageing Evaluation of the Diabetes Pilot Program
Final Report January 2010 23
Figure 2.1: Age Distribution of Participants
ET H N I C I T Y
Consideration was also given to whether ethnicity or a patient’s main language may have affected participation rates. It was reported that 92% of patients had English as their main language, suggesting that language is unlikely to have been a limiting factor.
At the 2001 census, 2% of the population identified as being of Aboriginal and Torres Strait Islander descent. Nearly 3% of DMAS participants identified as being of Aboriginal and Torres Strait Islander descent, suggesting that the program is unlikely to have had barriers to their participation. It is acknowledged, however, that a greater proportion of Aboriginal and Torres Strait Islanders have diabetes than the non-Indigenous population, and this is consistent with their participation in the program.
DI A B E TE S HI S TO RY A N D HE A LT H ST AT U S
The third patient-based factor considered is the participating patient’s history of diabetes and their associated health status. YE A R S W I T H D I A B E T E S
Five hundred and sixty-eight patients (568) had data entered in respect to the number of years they have had diabetes. There was a relatively even distribution across the elapsed periods of 1-5 years and 5-10 years (31% and 33% respectively) and more than 10 years (34%), while only 2% had diabetes for less than a year.
It is feasible that for the small percentage of patients who have had diabetes for less than 12 months (2%), its relatively short history may have influenced their decision not to participate in the DMAS. Those who have had diabetes for a longer period may have established a professional support network and thus did not require an additional support service. Having said this, it was reported that only 12% of patients approached were involved in another diabetic program/service and thus it is likely that their perceived state of wellness was a more influencing factor on their decision not to participate. HBA1C LE VE L
Five hundred and seventy patients (570) had an HbA1c baseline level recorded. The greatest proportion (40%) had an HbA1c of 7-7.9%, followed by 26% who had a reading of 8-8.9%. A further 27% were between 9-10.9% and 7% had an HbA1c of 11% or higher. Again it is feasible that given a large number (40%) of those participating were only 1 percentage point above the threshold level of 7%, a similar proportion of non-participants in this range may have seen that as a reason to not participate in the DMAS, as they perceived their diabetes to be largely in control.
Australian Government Department of Health and Ageing Evaluation of the Diabetes Pilot Program
Final Report January 2010 24
SE L F MA N AGE M E NT
There are a number of factors that indicate the capacity of participants to manage their diabetes on their own. The outcomes for those participating in the program include:
• 94% reported that they do not require any assistance with managing their diabetes or medications;
• 93% of patients reported monitoring their glucose levels at home; • Only 8% of patients are participating in DAA, 13% in PMP and 10% in HMR; • 35% use podiatry services, 32% a diabetes educator, 27% a dietician, 15% use the services of a
practice nurse and a further 15% another health professional. (Patients could nominate more than one professional group).
The above profile of patients participating suggests that many of those participating in DMAS manage many aspects of their diabetes care independently and perhaps only seek the services of others on an as-needed basis. It is feasible that those who declined to participate came from the same perspective, and is consistent with the main reason provided by patients for declining was the perception their health status was satisfactory.
This finding is further reinforced by the data below in respect to visits to hospital or an Accident and Emergency Department in the six months before being approached to participate in DMAS. HOS PI T AL/EM E R GE NC Y DE PA R T M ENT (ED) VIS IT S
Seventy-nine percent (79%) of patients reported they had not been admitted to a hospital in the previous 6 months. 15% had been admitted once, while 6% had been admitted on 2 or more occasions.
Sixteen percent of patients reported presenting to an Emergency Department in the last six months; 11% had presented once; 3% had presented two times; and 1% had presented three or more times.
This relatively low requirement for hospital services among participants, if reflected among non-participants reinforces their perception that they did not require the DMAS service. CO-M O RB I D I T I E S
Eighty-nine percent of participants (89%) reported having some form of co-morbidity. High blood pressure was the most commonly reported co-morbidity (74%), followed by high cholesterol (65%). Diabetes-related foot (19%), eye (17%) and kidney problems (14%) were also present. If non-participants had a similar profile, their focus may have been more on managing their co-morbidities than addressing their diabetes.
2.4.3 CASE STUDIES
The case studies revealed a similar response to the factors described above. Patient lack of interest, typically because they considered that their diabetes was under control, was consistently identified as the main reason for patients declining to participate in the program. This was followed by the fact that the patient was already in a diabetes program, often managed by their GP or a diabetes educator.
The level of support for the program offered by GPs was also identified as a further issue affecting patient participation, although it had a lesser impact than patient preferences. Where GPs were supportive of the program, participation tended to be higher and conversely, where not supportive (as demonstrated by them refusing or being tardy in providing HbA1c results, or advising their patients not to participate), then patient participation was reduced. The difference in these responses was often affected by the relationship between the GP and the pharmacist, as well as access to alternative diabetes services in the area. The latter was a noticeable factor reported in the rural case studies, and in some locations where existing diabetes services were unable to keep up with demand, diabetes educators were referring patients to the DMAS.
As noted previously, among the case study sites with low numbers of participants, the low response rate to their approaches to patients had a progressively negative impact on the enthusiasm of pharmacists to continue their recruitment efforts. This effect, combined with the requirement to meet the other priorities of a busy community pharmacy often led to a waning of enthusiasm for continued patient recruitment by

Australian Government Department of Health and Ageing Evaluation of the Diabetes Pilot Program
Final Report January 2010 25
credentialed pharmacists. The large majority of case study pharmacists indicated that they had ceased their patient recruitment efforts.
2.4.4 SUMMARY
Through our analysis of the various data sources available in an effort to understand why patients have not participated in the DMAS to the extent expected, pharmacy-related factors (such as location, size etc) and patient demographics appear unlikely to have influenced this outcome to any significant or systematic degree.
What we know is that people participating in the DMAS have: (a) had diabetes for a considerable period of time; (b) HbA1c levels that are unacceptably above 7% but few with the extreme levels of 10% and greater and minimal history of hospitalisation; and (c) are self-managing and only utilise other health professionals as required. It is possible that these same factors also apply in reverse to non-participants, and have had an equal, but opposite influence on their decision not to participate.
This is supported by the major reason given by patients for electing not to participate at the time they were approached - a self-perception that their health status is satisfactory, reflecting an attitudinal difference between participants and non-participants, rather than anything else. The case studies also indicated that the support (or lack thereof) for the DMAS by other health professionals (especially GPs) has had some effect, but by no means to the same extent as patient preferences.
Further, the continued inability among many pharmacists to attract patients to the program has progressively eroded enthusiasm for their recruitment effort, particularly given the competing priorities they face in the pharmacy.
Consequently, it seems likely that the patient perspective that they do not need the DMAS is the main reason why patients have not participated in the DMAS to the extent expected, rather than a deficiency in the program itself.
Through the case studies and somewhat supported by the data, it is apparent that participation by patients has occurred in those areas where other services are unavailable. On this basis there could be a case for providing a more targeted approach to the provision of DMAS to these under-serviced areas.
2.5 PATIENT PARTICIPATION OUTSIDE THE DIABETES PILOT
PROGRAM
Given the fact that nearly 50% of patients who expressed an interest in participating in DMAS were excluded because of ineligibility (mainly due to their HbA1c level being below the threshold), an area of interest was whether or not these patients received a diabetes service from outside the funding umbrella of DMAS. At the end of the data collection period (end February 2010), 59 pharmacists (164 respondents to this question) reported providing services to patients outside the funding umbrella of the DMAS. This is represented in table 2.6 below.
Table 2.6: Provision of Services outside of DMAS
Number of Pharmacists providing services outside of
DMAS
Number of patients receiving a service outside of
DMAS
21 1 patient
11 2 patients
10 3 patients
7 4 patients
10 5 or more patients
The case studies revealed a similar response. Rural sites all reported that non-eligible patients received a service, generally of a very similar type to that provided under DMAS, particularly given the shortage of

Australian Government Department of Health and Ageing Evaluation of the Diabetes Pilot Program
Final Report January 2010 26
alternative diabetes services in these areas. In metropolitan and regional locations, non-eligible patients also received a service, but generally at a less intensive and regular level, with less clinical monitoring and data collection. This was seen as a “step-down” service, and more opportunistic and less formal in its nature. In all instances, the pharmacist did not charge for these services, as it was seen as part of their normal patient interaction.
2.6 OBTAINING CLINICAL DATA FROM GPS
Another area of interest was the number of times pharmacists needed to follow up the patients’ GP in order to obtain patients’ HbA1c results. This question was asked of pharmacists on the on-line system, and their responses are illustrated in the following figure.
Figure 2.2: Number of Clinical Data Follow-ups per Patient
As can be seen from the figure, 52% of pharmacists did not need to follow up the GP whilst 27% had to follow the GP up only once. A further 16% were required to follow up the GP 2-3 times, while 6% of pharmacists had to follow up the GP 4 times or more. While the need to follow up a GP may have deterred either the pharmacist or indeed the patient from proceeding with DMAS involvement, the relatively small number having to make contact more than 3 times suggests this was not a significant deterrent across the program as a whole. In the sample of 46 telephone interviews to non-participating pharmacists, this was not identified as a reason at all. In the case studies, however, pharmacists indicated that the inability to obtain the HbA1c results from a GP was the second reason given for a patient being ineligible (after their HbA1c level being below the threshold). Thus in some instances at least, lack of GP support and responsiveness has had a negative impact on patient participation.
2.7 INVESTMENT IN THE PROGRAM
This section relates to the investment by pharmacy in implementing the program, in terms of costs and time. Pharmacists were asked to report on both start-up costs and the ongoing costs associated with the DMAS.
2.7.1 START-UP COSTS
Three hundred and forty-two (342) pharmacists reported start-up costs to a standard suitable for analysis (records were excluded if the data fields were blank or the components did not sum to the reported total). The mean total start-up cost across these pharmacists was $1,006. This was comprised of $486 in infrastructure investment, and $520 in labour costs.

Australian Government Department of Health and Ageing Evaluation of the Diabetes Pilot Program
Final Report January 2010 27
Approximately 25% of pharmacists reported spending nothing, 37% spent up to $1,000 and 24% spent between $1,000 and $2,000. The remaining 15% spent more than $2,000. This distribution is illustrated in the figure below.
Figure 2.3: Total Pharmacy DMAS Start-up Costs
IN VE S TME N T I N IN F R A S TR U C TU R E
The mean investment in additional infrastructure was $486 (median $100). Approximately 39% of pharmacists reported spending nothing, while nearly 49% reported spending up to $1,000. A further 8% reported spending between $1,000 and $2,000, with the remaining 4% spending more than $2,000 on infrastructure. This distribution is illustrated in the figure below.
Figure 2.4: Start-up Investment by Pharmacy in Infrastructure
About 40% of pharmacists reported purchasing a computer or parts to conduct the DMAS. A smaller proportion (between 15% and 30%) of pharmacists needed to purchase various other forms of clinical equipment (e.g. scales, sphygmomanometer, or a tape measure etc.) to conduct the program, while 15%
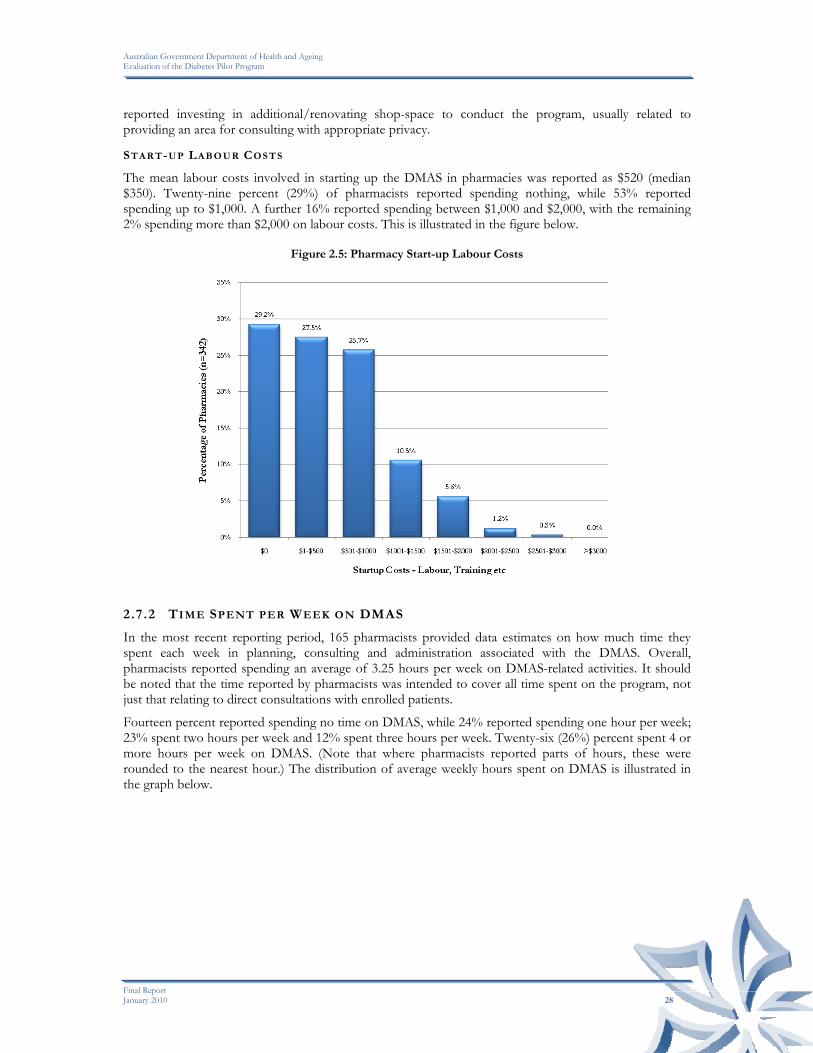
Australian Government Department of Health and Ageing Evaluation of the Diabetes Pilot Program
Final Report January 2010 28
reported investing in additional/renovating shop-space to conduct the program, usually related to providing an area for consulting with appropriate privacy.
ST AR T-U P LA B O U R COS T S
The mean labour costs involved in starting up the DMAS in pharmacies was reported as $520 (median $350). Twenty-nine percent (29%) of pharmacists reported spending nothing, while 53% reported spending up to $1,000. A further 16% reported spending between $1,000 and $2,000, with the remaining 2% spending more than $2,000 on labour costs. This is illustrated in the figure below.
Figure 2.5: Pharmacy Start-up Labour Costs
2.7.2 TIME SPENT PER WEEK ON DMAS
In the most recent reporting period, 165 pharmacists provided data estimates on how much time they spent each week in planning, consulting and administration associated with the DMAS. Overall, pharmacists reported spending an average of 3.25 hours per week on DMAS-related activities. It should be noted that the time reported by pharmacists was intended to cover all time spent on the program, not just that relating to direct consultations with enrolled patients.
Fourteen percent reported spending no time on DMAS, while 24% reported spending one hour per week; 23% spent two hours per week and 12% spent three hours per week. Twenty-six (26%) percent spent 4 or more hours per week on DMAS. (Note that where pharmacists reported parts of hours, these were rounded to the nearest hour.) The distribution of average weekly hours spent on DMAS is illustrated in the graph below.

Australian Government Department of Health and Ageing Evaluation of the Diabetes Pilot Program
Final Report January 2010 29
Figure 2.6: Average Weekly Hours Spent on DMAS
When examining the average time spent per patient, there are limitations to the data which makes interpretation problematic. As previously noted, the sampling approach to the selection of patients in the evaluation applied a 50% sampling fraction i.e. pharmacists were required to recruit every second patient participating in DMAS to the evaluation sample. If this sampling rule was followed, this translates the above estimate to 0.7 hours per patient per week across all DMAS participants. However, as the case studies revealed, a number of pharmacists who have recruited seven or less patients (the large majority) have included all of them in the evaluation sample. Consequently, simply multiplying the evaluation sample by two is likely to overstate the total number of participants in the DMAS. Consequently, using that number to estimate the average time per patient would result in an understatement of the average time per patient. For example, if 50% of pharmacists followed the sampling rule and the other 50% enrolled all participants in the evaluation sample, then the above estimate of time spent per patient per week would rise to approximately 1.1 hours per week. If all pharmacists enrolled all their DMAS patients in the evaluation sample, then the estimate rises further to 1.3 hours per patient per week.
The case studies provided some insight to this issue. Pharmacists reported that the first consultation typically took 60-90 minutes, with subsequent consultations taking 45 to 60 minutes, plus about 15-30 minutes for preparation and writing up of notes etc. This implies an average time per consultation of approximately 75 minutes. The average number of patients per ‘active’ pharmacy in the evaluation sample was 2.4 (611/251), which translates to approximately 5 patients in total (assuming the 50% sampling fraction was applied). If these patients were seen monthly (based on the DMAS model), then on average, pharmacists would see 1.25 patients per week, for 1.25 hours each, resulting in 1.6 hours per week spent on consultation time. The remaining 1.6 hours per week would be spent on patient recruitment, administration etc. This estimate is broadly consistent with the information provided by pharmacists in the case studies.
2.7.3 ONGOING COSTS
Between 150 and 200 pharmacists provided data on their ongoing costs in providing DMAS services over the five quarters of data collection. (It should be noted that pharmacies reporting costs were not necessarily the same across quarters, which may have some (albeit small) impact on the trends reported) These costs were divided between labour costs and consumables costs, and are illustrated in the following figures.
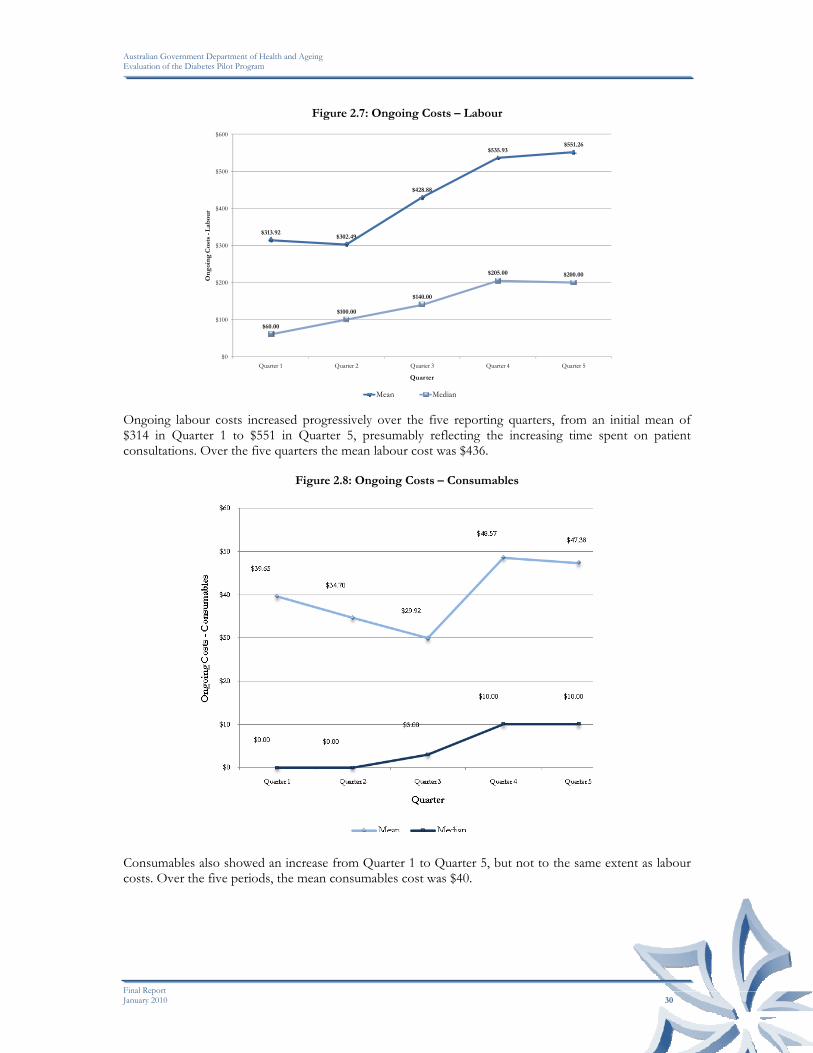
Australian Government Department of Health and Ageing Evaluation of the Diabetes Pilot Program
Final Report January 2010 30
Figure 2.7: Ongoing Costs – Labour
$313.92$302.49
$428.88
$535.93$551.26
$60.00
$100.00
$140.00
$205.00 $200.00
$0
$100
$200
$300
$400
$500
$600
Quarter 1 Quarter 2 Quarter 3 Quarter 4 Quarter 5
On
goi
ng
Cos
ts -
Lab
our
Quarter
Mean Median Ongoing labour costs increased progressively over the five reporting quarters, from an initial mean of $314 in Quarter 1 to $551 in Quarter 5, presumably reflecting the increasing time spent on patient consultations. Over the five quarters the mean labour cost was $436.
Figure 2.8: Ongoing Costs – Consumables
Consumables also showed an increase from Quarter 1 to Quarter 5, but not to the same extent as labour costs. Over the five periods, the mean consumables cost was $40.

Australian Government Department of Health and Ageing Evaluation of the Diabetes Pilot Program
Final Report January 2010 31
Figure 2.9: Ongoing Costs – Total
$353.55$337.19
$458.80
$584.50$598.64
$100.00 $100.00
$200.00
$267.50$240.00
$0
$100
$200
$300
$400
$500
$600
$700
Quarter 1 Quarter 2 Quarter 3 Quarter 4 Quarter 5
On
goi
ng
Cos
ts -
Tot
al
Quarter
Mean Median Total ongoing costs rose from $353 in Quarter 1 to $599 in Quarter 5. The mean total cost across all periods was $477. Labour accounted for 91% of total costs, and consumables for 9% of total costs.
2.7.4 FEES CHARGED TO PATIENTS
A fee is charged to patients involved in the DMAS although 9 (3.4%) pharmacists reported not charging anything in the most recent period. Forty-six percent (46%) of pharmacists reported charging a fee up to the recommended $2.75 per consultation, while 90% charged $5.00 or less per consultation. The distribution of patient fees is illustrated in Table 2.7 below.
Table 2.7: Patient Charges for DMAS
Charge for Consultation ($) Number Percentage
$0 9 3.4%
$0.01-$2.75 121 46.0%
$2.76-$3.00 35 13.3%
$3.01-$4.00 18 6.8%
$4.01-$5.00 54 20.5%
>$5 26 9.9%
Total 263 100.0%
Whilst virtually all pharmacists reported charging a fee to patients, the case studies revealed that many of them considered that the fee charged was not commensurate with the professional nature of the service, and considered that it undermined the value of the service to patients. However, they also acknowledged that the low cost to patients would have been a factor in attracting (or at least not deterring) them from participating in the first place.
2.8 OPERATIONAL ASPECTS OF DMAS
Twenty case studies were conducted in late 2009, with representation across rural and metropolitan areas, and involving pharmacists with varying numbers of patients. The following summary of responses to a

Australian Government Department of Health and Ageing Evaluation of the Diabetes Pilot Program
Final Report January 2010 32
series of questions regarding their experience of the DMAS provides an insight into some of the operational aspects of providing services to eligible patients under the DMAS and their impact on the pharmacy. Comments regarding training, the value of supporting materials and most aspects of patient recruitment have been previously reported.
IM P A C T O F P H AR M A CY A T T R I BU T ES O N R E C R U I T M EN T O F P A T I E N T S
Pharmacists consistently identified the nature of their relationship with their patients as a particularly important factor in recruiting them to the DMAS. This was in turn affected by them having a regular client base and to some degree their opening hours. These positive attributes tended to be more pronounced in rural areas, especially where the pharmacist was the only one in town, and they had developed a close and ongoing relationship with their patients.
A further key element was the interest and enthusiasm of the trained pharmacist for the program, which was seen as being particularly important for maintaining their recruitment efforts in the face of ongoing rebuttals from many of the patients approached. However, as previously noted, their enthusiasm often waned as frustration grew.
RE LAT I O NSH I P W I T H OTH E R P RO F E S SION ALS
In the on-line reporting system, pharmacists reported little interaction with other health professionals. Thirty percent reported no contact with GPs, while a further 18% reported only one contact; 73% reported no contact with practice nurses, with 18% reporting one contact; and 78% reported no contact with diabetes educators, with 18% reporting a single contact.
In the case studies, pharmacists generally (with some notable exceptions) reported little interaction or relationship with other health professionals (especially diabetes educators). GPs were described by some as being hard to win over, were often already providing diabetes services and saw little need for, or value in, the DMAS. Consequently, the DMAS generally had little or no interface with the annual cycle of care approach and team care arrangements involving other relevant health professionals.
Several exceptions to this overall trend were reported however, again mainly in rural locations. In these instances, the GP was less likely to be providing diabetes services, and diabetes educators were far less available. Pharmacists also tended to have a closer relationship with the local GP. In these circumstances, the GP was more supportive and willing to refer patients to the program and hence patient recruitment tended to be more successful.
RE CR U I TM E N T A N D RE T E N TI ON OF P A TI EN TS
Pharmacists’ comments relating to the recruitment of patients and the factors that inhibited their participation have been previously reported. The fee charged to the patient was not identified as being a major inhibiting factor to their participation.
Pharmacists generally reported having under-estimated the time and effort required to recruit patients to the program, and found this to be the most time-consuming and generally frustrating aspect of the program. This was exacerbated by the fact that this activity received no funding.
In contrast to the difficulties in recruiting patients, pharmacists widely reported high retention rates among DMAS participants, with very few withdrawing from the program. Where patients did withdraw, it generally resulted from a lack of motivation, or difficulties associated with other medical conditions/complications.
Within this context, however, patient attitudes and their willingness to modify their behaviour and lifestyle to better manage their diabetes varied considerably, with corresponding results. Some were reported as doing spectacularly well, while others struggled to maintain their motivation and effort.
When asked what they considered to be the optimum number of patients to participate in the program at any given time at their pharmacy, responses varied considerably across the case study sites. Those pharmacists with fewer patients (generally less than 5) tended to be less willing or able to take on any more, given the time commitment required to recruit patients and other demands on their time within the pharmacy. It should also be noted that in some of these instances, the trained pharmacists only worked

Australian Government Department of Health and Ageing Evaluation of the Diabetes Pilot Program
Final Report January 2010 33
part time, and hence had obvious time constraints. In contrast, those pharmacists with more DMAS patients (i.e. more than 10), generally reported that they could continue to manage that number and potentially more. The main differentiating factors to these responses tended to be the enthusiasm of the pharmacist, available time and the other demands they faced within the pharmacy. In several instances, the DMAS pharmacist’s role within the pharmacy was to develop and deliver professional services, and in these instances, they were able to focus their time and activities to these activities, without the pressure to participate in other routine activities within the pharmacy.
SE R VI CE D ELI VE RY
The delivery of DMAS generally followed the protocol established for the program, with monthly consultations and clinical monitoring over six months. Several pharmacists commented, however, that a significant number of patients failed to keep their appointments. This was attributed to the fact that this process was alien to their normal interaction with the pharmacist which tended to be more opportunistic or casual rather than scheduled. This difference was noted as being a further factor influencing patient participation and motivation.
Pharmacists reported that the government payment received for the consultation service was generally consistent with the costs of delivering those services. However, the time spent on patient recruitment was essentially un-funded, and this placed financial pressure on the continuation of this activity, particularly when it yielded low response rates.
PR OG RA M OU T C O M E S
From a pharmacy perspective, the DMAS has provided the opportunity to expand their professional services beyond the dispensing function, and to develop a closer relationship with their patients and hence build patient loyalty. At the same time, it has also enabled pharmacists to develop professionally and to add to their skill set. However, from a financial perspective, DMAS was not seen as a profit-maker, and indeed there were opportunity costs associated with the time involved in delivering DMAS at the expense of other more profitable activities. This, as previously noted, placed pressure on the pharmacist in continuing to commit time to the program.
From a patient perspective, pharmacists were extremely supportive of the effectiveness of the program, considering that it had a lot to offer its patients. Improved management of their medications, improved diet, adoption of a better exercise regime, and improved motivation were widely cited as outcomes observed among most patients. For other patients, the results were less convincing, often related to their personal motivation, and the occurrence of complications or other medical conditions. Patient motivation was regarded as being a critical factor in the outcomes achieved.
KE Y S U CC ES S F A CT O RS
The case study pharmacists were consistent in their views as to what the main ingredients were to the success of the program. These were:
• A motivated pharmacist with the time and capacity to implement the program; • Some “early wins” in recruiting patients which sustain their motivation; and • Their relationship with GPs and the support this engendered for the program.
Conversely, the greatest barriers were identified as:
• Patient apathy or lack of interest in the program which inhibited recruitment; • GP resistance; and • The lack of promotion and hence awareness of the program both among patients and GPs and
other health professionals.
Australian Government Department of Health and Ageing Evaluation of the Diabetes Pilot Program
Final Report January 2010 34
OP P OR T U N I TI E S F O R I MP R OVE M E NT
Case study pharmacists were generally supportive of the DMAS, and considered that it had the potential to be a valuable service to patients, once enrolled. Their suggestions as to how it could be improved in future included the following:
• Greater promotion of the program amongst the general public, GPs and diabetes educators to improve recruitment.
• Consider targeting the program to areas where there is a shortage of other diabetes services, particularly rural areas, and to patients who are not already engaged in other diabetes programs/services.
• Additional funding to cover the time and costs associated with patient recruitment to the program.
• Align the program more closely to other programs such as the HMR and NDSS. • Provide additional clinical support to pharmacists to increase their confidence and to provide
additional back-up. • In rural areas, consider providing a home/outreach service to isolated patients who may have
difficulty travelling to the pharmacy.
2.9 CONCLUSION
The DMAS provided the opportunity for 800 pharmacists to be trained in the provision of pharmacy-based diabetes services to patients who met the defined eligibility criteria. The 785 Pharmacists who took up the opportunity to enrol in the program did so because they considered that the program provided them with the opportunity to extend the professional services of their pharmacy, and to expand their activities beyond the traditional dispensing function. As such, they considered that it could add further value to the services they offer their patients. They were generally very satisfied with the training and associated support materials provided.
Subsequent uptake of the program by patients has been very low relative to the original targets and expectations for the program. Only 32% of the trained and credentialed pharmacists (n=785) reported having been successful in recruiting patients to the service, with an estimated 1,000-1,250 patients having participated in the program across the country. This represents approximately 10% of the original target nationally. Among those pharmacies that reported recruiting any patients, the overwhelming majority reported recruiting less than five patients to the program, compared to an upper limit of fourteen patients.
This outcome is largely attributable to apathy or lack of interest in the program among their patients, rather than a deficiency in the program itself. This appears to be related directly to their perception of need and whether the program would be of benefit to them. Many considered their health status to be sufficient to not require the service, while others were already involved in other diabetes programs/services negating their need for DMAS. Within the pharmacy, limited time and capacity have been further inhibiting factors, exacerbated by the frustration experienced in low recruitment rates. The fact that the recruitment activity required so much time, coupled with the fact that this activity attracted no funding under the program, led to frustration among many pharmacists, and pressure to reallocate their efforts to other revenue-generating activities within the pharmacy.
Analysis of other factors such as PhARIA, pharmacy location, pharmacy size, ethnicity of patients and fees charged to patients do not appear to have had a significant influence on their participation although it is apparent that where other services do not exist, the service was taken up more readily.
For those pharmacists successful in recruiting patients to the program, the DMAS provided the opportunity to expand their professional services to patients. At the same time, it also enabled pharmacists to develop professionally and to add to their skill set. However, from a financial perspective, DMAS was not seen as a profit-maker, and indeed there were opportunity costs associated with the time involved in delivering DMAS at the expense of other more profitable activities.
Australian Government Department of Health and Ageing Evaluation of the Diabetes Pilot Program
Final Report January 2010 35
Pharmacists reported observing some patients demonstrating improved management of their medications, improved diet, adoption of a better exercise regime, and improved motivation. For others, the results were less convincing, often related to their personal motivation, and the occurrence of complications or other medical conditions. However, it must also be recognised that lifestyle and behavioural change is difficult and more often takes a concerted effort over an extended time.
Participating pharmacists were generally supportive of the DMAS, and considered that it had the potential to be a valuable service to patients, once enrolled. Their suggestions as to how it could be improved in future included:
• Greater promotion of the program amongst the general public, GPs and diabetes educators to improve recruitment.
• Consider targeting the program to areas where there is a shortage of other diabetes services, particularly rural areas, and to patients who are not already engaged in other diabetes programs/services.
• Additional funding to cover the time and costs associated with patient recruitment to the program.
• Align the program more closely to other pharmacy programs such as the HMR and NDSS. • Provide additional clinical support to pharmacists to increase their confidence and to provide
additional back-up. • In rural areas, consider providing a home/outreach service to isolated patients who may have
difficulty travelling to the pharmacy.

Australian Government Department of Health and Ageing Evaluation of the Diabetes Pilot Program
Final Report January 2010 36
3
IMPACT ON PATIENTS
This chapter presents the evaluation findings in regard to the impact of the DMAS on patients. The information supporting these findings comes from two sources: clinical data collected by pharmacists and recorded on the on-line reporting system; and a survey completed by patients themselves. The following findings are based on the information collected from these two sources at Consultation 1 (the beginning of their involvement) and Consultation 5 (the end of their involvement), a period of six months for each patient.
3.1 PATIENT CONSULTATIONS
3.1.1 CONSULTATIONS RECORDED
At the end of February 2010, 569 patients had consultation data entered for Consultation 1. Of these, 263 had proceeded to their final consultation (Consultation 5). Approximately 33% of participating patients had completed only Consultations 1 or 2, with 46% having completed Consultation 5. The distribution of consults is illustrated in Table 3.1 below.
Table 3.1: Distribution of Consultations
Consult Number Number of Patients
Consultation 1 108 (19.0%)
Consultation 2 82 (14.4%)
Consultation 3 59 (10.4%)
Consultation 4 57 (10.0%)
Consultation 5 263 (46.2%)
Total 569 (100.0%)
The clinical outcomes discussed below are based on the 263 patients who had progressed through all five consultations. Comparative analysis is provided for the changes in selected variables between Consultation 1 and Consultation 5. Interpretation of the results should take into account the sample size of 263 patents.
CLI N I CAL ME AS U R E ME N TS A T CO N S U LT S 1 AN D 5
BO DY MA SS INDEX
Table 3.2 illustrates the distribution of patients’ Body Mass Index (BMI) at Consultations 1 and 5. Overall there has not been a significant change in BMI, with the mean BMI reducing marginally from 33.1 to 32.9. There was a small reduction (4%) in the proportion of patients recording a BMI of 30-39 at Consultation 5 compared to Consultation 1, and a corresponding increase in the proportion recording a BMI of 20-30 between these two periods.
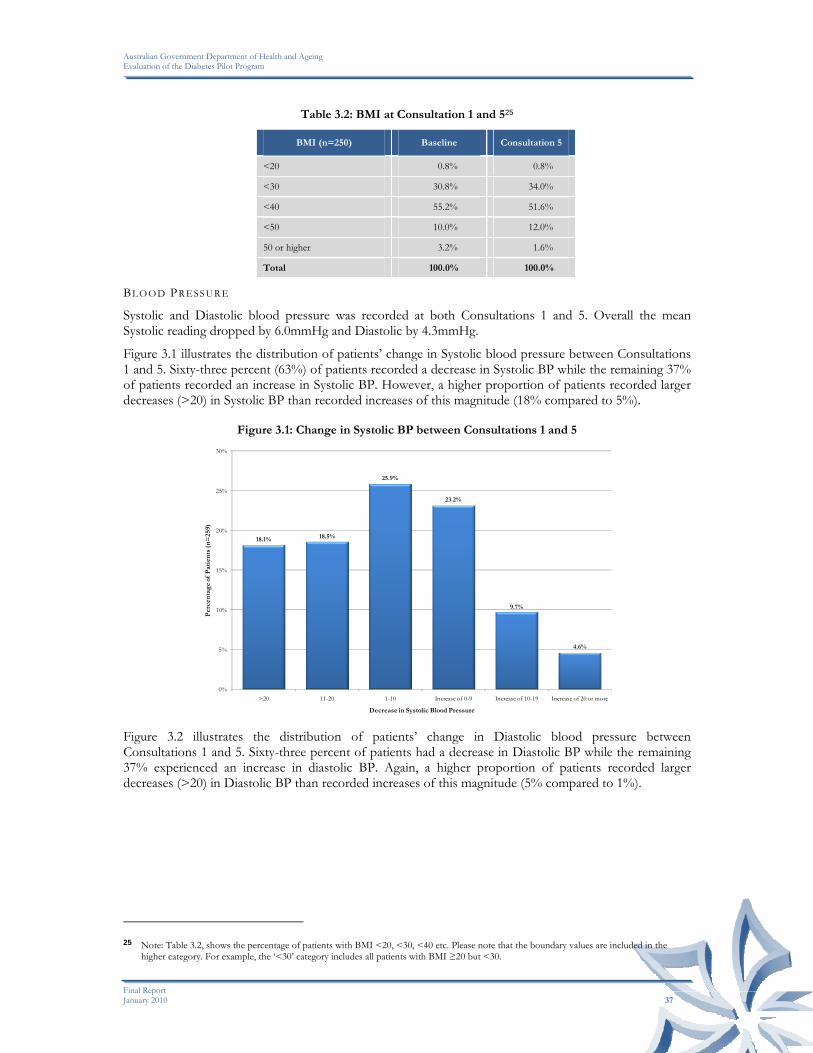
Australian Government Department of Health and Ageing Evaluation of the Diabetes Pilot Program
Final Report January 2010 37
Table 3.2: BMI at Consultation 1 and 525
BMI (n=250) Baseline Consultation 5
<20 0.8% 0.8%
<30 30.8% 34.0%
<40 55.2% 51.6%
<50 10.0% 12.0%
50 or higher 3.2% 1.6%
Total 100.0% 100.0%
BL O O D PR ESS U R E
Systolic and Diastolic blood pressure was recorded at both Consultations 1 and 5. Overall the mean Systolic reading dropped by 6.0mmHg and Diastolic by 4.3mmHg.
Figure 3.1 illustrates the distribution of patients’ change in Systolic blood pressure between Consultations 1 and 5. Sixty-three percent (63%) of patients recorded a decrease in Systolic BP while the remaining 37% of patients recorded an increase in Systolic BP. However, a higher proportion of patients recorded larger decreases (>20) in Systolic BP than recorded increases of this magnitude (18% compared to 5%).
Figure 3.1: Change in Systolic BP between Consultations 1 and 5
18.1% 18.5%
25.9%
23.2%
9.7%
4.6%
0%
5%
10%
15%
20%
25%
30%
>20 11-20 1-10 Increase of 0-9 Increase of 10-19 Increase of 20 or more
Per
cen
tag
e of
Pat
ien
ts (
n=
259)
Decrease in Systolic Blood Pressure Figure 3.2 illustrates the distribution of patients’ change in Diastolic blood pressure between Consultations 1 and 5. Sixty-three percent of patients had a decrease in Diastolic BP while the remaining 37% experienced an increase in diastolic BP. Again, a higher proportion of patients recorded larger decreases (>20) in Diastolic BP than recorded increases of this magnitude (5% compared to 1%).
25 Note: Table 3.2, shows the percentage of patients with BMI <20, <30, <40 etc. Please note that the boundary values are included in the
higher category. For example, the ‘<30’ category includes all patients with BMI ≥20 but <30.

Australian Government Department of Health and Ageing Evaluation of the Diabetes Pilot Program
Final Report January 2010 38
Figure 3.2: Change in Diastolic BP between Consultations 1 and 5
5.0%
19.7%
37.8%
28.6%
7.7%
1.2%
0%
5%
10%
15%
20%
25%
30%
35%
40%
>20 11-20 1-10 Increase of 0-9 Increase of 10-19 Increase of 20 or more
Per
cen
tag
e of
Pat
ien
ts (
n=
259)
Decrease in Diastolic Blood Pressure In summary, it appears that the majority of participants in the DMAS have demonstrated an improvement in both their systolic and diastolic blood pressure levels. BL O O D GL U COS E
Blood glucose levels were recorded at Consultations 1 and 5. The variance at the individual patient level is illustrated in the following figure.
Figure 3.3: Variance in Blood Glucose Levels between Consultations 1 and 526
8.3%
2.5%
9.5%
16.9%
28.5%
21.9%
12.4%
0%
5%
10%
15%
20%
25%
30%
<-4 <-3 <-2 <-1 <0 <1 Increase of 1 or more
Per
cen
tag
e of
Pat
ien
ts (
n=
242)
Change in Blood Glucose (mmol/L) Nearly two-thirds (66%) of patients recorded a reduction in their blood glucose levels between Consultations 1 and 5, with 34% recording an increase. Nearly 30% of patients recorded a decrease of up to 1mmol/L, while 8% recorded a decrease of more than 4mmol/L.
26 Note: In Figure 3.3 and Figure 3.4, the boundary values are included in the higher category. For example, the ‘<-3’ category in Figure 3.3
includes all patients with a change in blood glucose level ≥-4 but <-3 (i.e. a decrease of ≤4 but >3). Accordingly, patients with zero change in blood glucose level are included in the ‘<1’ category.

Australian Government Department of Health and Ageing Evaluation of the Diabetes Pilot Program
Final Report January 2010 39
Figure 3.4: Mean Blood Glucose Levels, Consultations 1 and 5
0%
5%
10%
15%
20%
25%
30%
35%
<7 <8 <9 <10 <11 <12 <13 <14 14 or higher
Per
cen
tag
e of
Pat
ien
ts (
n=
242)
Mean Blood Glucose Reading (mmol/L)
Baseline Consultation 5 The mean blood glucose level across all patients (illustrated in the above figure) decreased from 9.48mmol/L to 8.64mmol/L, a reduction of 0.84mmol/L, or 8.9 %. At baseline, approximately 70% recorded a blood glucose level below 10, and by Consultation 5, this had increased to 80%. The proportion of patients with blood glucose levels below 7mmol/L increased from 7% to 15%.
In summary, it appears that participants in the DMAS have demonstrated an improvement in their blood glucose levels.
LI FES T Y LE A N D DAI LY LI VIN G
A number of lifestyle and daily living activities of patients in DMAS were recorded at Consultations 1 and 5. The key characteristics and changes in outcomes include: SM OK I NG
Approximately 89% of participants reported not smoking at Consultation 1. Three patients in the program ceased to smoke during the evaluation period. Among the remaining patients, 18 (7%) reduced their smoking, three (1%) increased their smoking, while 92% made no change to their smoking levels (including those that did not smoke in the first instance). EXE R C I S I N G
Patients were asked to indicate the number of times a week they exercised for at least 30 minutes. Their responses at Consultation 1 and 5 are illustrated in the following table.
Table 3.3: Number of Times Exercising per Week, Consultations 1 and 5
Exercise (times per week) Baseline Consultation 5
0 100 59
1 18 16
2 35 28
3 23 50
4 10 5
5 or more 77 105
Total 263 263
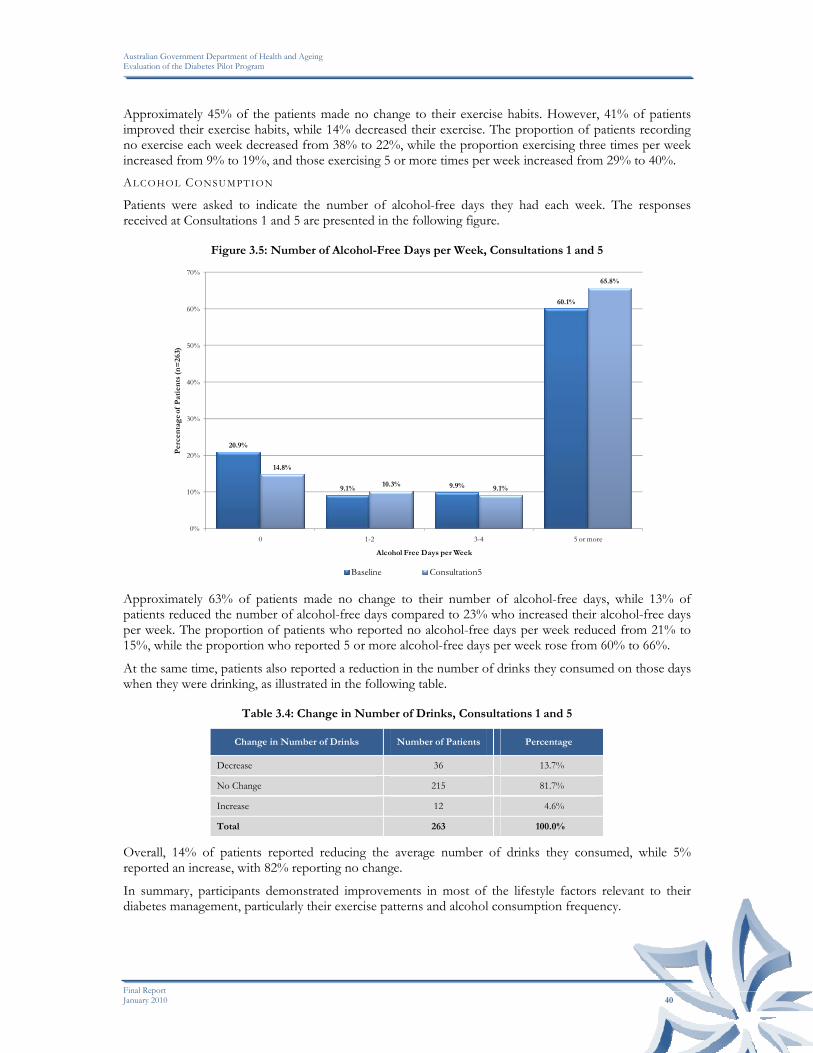
Australian Government Department of Health and Ageing Evaluation of the Diabetes Pilot Program
Final Report January 2010 40
Approximately 45% of the patients made no change to their exercise habits. However, 41% of patients improved their exercise habits, while 14% decreased their exercise. The proportion of patients recording no exercise each week decreased from 38% to 22%, while the proportion exercising three times per week increased from 9% to 19%, and those exercising 5 or more times per week increased from 29% to 40%. AL CO H OL CO NS U M PT I ON
Patients were asked to indicate the number of alcohol-free days they had each week. The responses received at Consultations 1 and 5 are presented in the following figure.
Figure 3.5: Number of Alcohol-Free Days per Week, Consultations 1 and 5
20.9%
9.1% 9.9%
60.1%
14.8%
10.3%9.1%
65.8%
0%
10%
20%
30%
40%
50%
60%
70%
0 1-2 3-4 5 or more
Per
cen
tag
e of
Pat
ien
ts (
n=
263)
Alcohol Free Days per Week
Baseline Consultation5 Approximately 63% of patients made no change to their number of alcohol-free days, while 13% of patients reduced the number of alcohol-free days compared to 23% who increased their alcohol-free days per week. The proportion of patients who reported no alcohol-free days per week reduced from 21% to 15%, while the proportion who reported 5 or more alcohol-free days per week rose from 60% to 66%.
At the same time, patients also reported a reduction in the number of drinks they consumed on those days when they were drinking, as illustrated in the following table.
Table 3.4: Change in Number of Drinks, Consultations 1 and 5
Change in Number of Drinks Number of Patients Percentage
Decrease 36 13.7%
No Change 215 81.7%
Increase 12 4.6%
Total 263 100.0%
Overall, 14% of patients reported reducing the average number of drinks they consumed, while 5% reported an increase, with 82% reporting no change.
In summary, participants demonstrated improvements in most of the lifestyle factors relevant to their diabetes management, particularly their exercise patterns and alcohol consumption frequency.

Australian Government Department of Health and Ageing Evaluation of the Diabetes Pilot Program
Final Report January 2010 41
MED I C A TI ON U SE
The evaluation examined whether there was any change in the use of medications for participants as a result of the DMAS. The changes recorded at Consultations 1 and 5 are illustrated in the following table.
Table 3.5: Number of Prescribed Medications Taken at Consultation 1
Prescribed Medications Taken(n=263)
Baseline Consultation 5 Mean Change
Oral Hypoglycaemics 94.3% 94.3% 0.0%
Insulin 26.2% 32.3% +6.1%
Antihypertensives 72.6% 81.7% +9.1%
Lipid Modifying Agents 78.7% 80.6% +1.9%
Antiplatelet Agents 52.5% 64.3% +11.8%
Other Medications 38.4% 32.3% -6.1%
The results demonstrate an increase in the proportion of patients using all identified drug groups. However, some groups of medication demonstrated a decreased use whilst other showed an increasing use. The use of oral hypoglycaemics was unchanged.
MED I C A TI ON S M AN A GE M EN T
The number of patients identified as having difficulties adhering to their medications or experiencing other problems associated with their medication management was reported at Consultations 1 and 5, the results of which are presented in the following table.
Table 3.6: Changes in Medication Management, Consultations 1 and 5
Medication Issues Identified (n=263)
Baseline Consultation 5 Mean Change
Adherence 35.0% 17.5% -17.5%
Drug Interaction(s) 5.3% 1.9% -3.4%
Drug/Dose Discrepancy 4.9% 3.8% -1.1%
Inappropriate Self-Medication 7.2% 4.2% -3.0%
Other 10.6% 7.6% -3.0%
There was a consistent decrease across all forms of medication management problems identified between Consultations 1 and 5, particularly adherence issues, with the proportion of patients identified with problems in this area halving from 35% to 18%.
US E O F HE ALTH S E RVI C E S
Patients were asked the number of occasions on which they had been to see a health professional since their last consultation. The results are presented in the following table, although some caution should be exercised in interpreting the results given the small numbers involved.
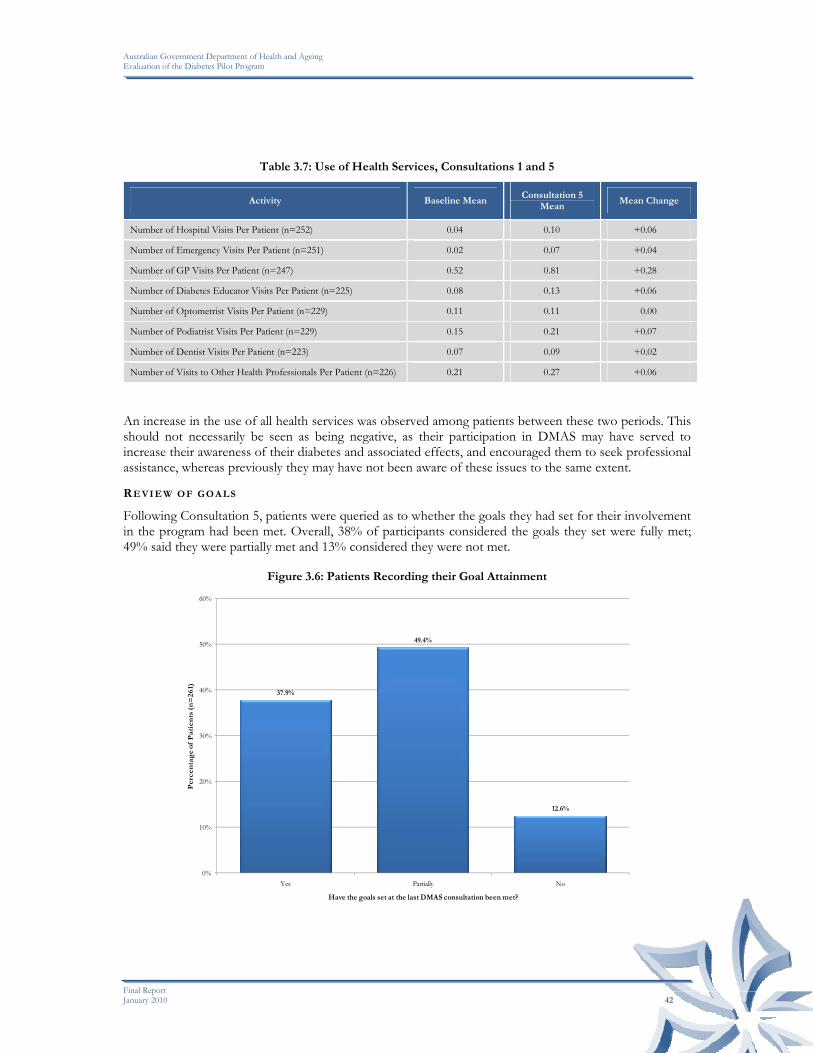
Australian Government Department of Health and Ageing Evaluation of the Diabetes Pilot Program
Final Report January 2010 42
Table 3.7: Use of Health Services, Consultations 1 and 5
Activity Baseline Mean Consultation 5
Mean Mean Change
Number of Hospital Visits Per Patient (n=252) 0.04 0.10 +0.06
Number of Emergency Visits Per Patient (n=251) 0.02 0.07 +0.04
Number of GP Visits Per Patient (n=247) 0.52 0.81 +0.28
Number of Diabetes Educator Visits Per Patient (n=225) 0.08 0.13 +0.06
Number of Optometrist Visits Per Patient (n=229) 0.11 0.11 0.00
Number of Podiatrist Visits Per Patient (n=229) 0.15 0.21 +0.07
Number of Dentist Visits Per Patient (n=223) 0.07 0.09 +0.02
Number of Visits to Other Health Professionals Per Patient (n=226) 0.21 0.27 +0.06
An increase in the use of all health services was observed among patients between these two periods. This should not necessarily be seen as being negative, as their participation in DMAS may have served to increase their awareness of their diabetes and associated effects, and encouraged them to seek professional assistance, whereas previously they may have not been aware of these issues to the same extent.
RE VI E W OF G O A L S
Following Consultation 5, patients were queried as to whether the goals they had set for their involvement in the program had been met. Overall, 38% of participants considered the goals they set were fully met; 49% said they were partially met and 13% considered they were not met.
Figure 3.6: Patients Recording their Goal Attainment
37.9%
49.4%
12.6%
0%
10%
20%
30%
40%
50%
60%
Yes Partially No
Per
cen
tag
e of
Pat
ien
ts (
n=
261)
Have the goals set at the last DMAS consultation been met?

Australian Government Department of Health and Ageing Evaluation of the Diabetes Pilot Program
Final Report January 2010 43
3.2 PATIENT SURVEY DATA
At the time of Consultations 1 and 5 with pharmacists, patients in the evaluation sample were asked to complete a survey to ascertain their views about DMAS and whether it was beneficial to them. The survey for new DMAS patients covered their quality of life (using the EuroQol-5D), current health state and how they maintained their diabetes. Patients were also given the opportunity to identify the key benefits of the service (anticipated and realised), how much they would be willing to pay for the service in the future and why they were taking part. To date, 480 Survey #1 had been received from 198 pharmacies (13 surveys were received where there was no pharmacy identification). A total of 233 surveys (Survey #2) completed at the end of their participation in DMAS (at Consultation 5) had been received from 114 pharmacies (7 surveys were received where there was no pharmacy identification) and are also analysed below. Comparisons at an individual patient level between Survey #1 and Survey #2 are also reported.
3.2.1 NEW PARTICIPANTS - SURVEY #1
RE AS ON S FO R PA RT I C I P AT I O N
Patients were asked to identify their reasons for taking part in DMAS. (Note that patients could provide multiple responses.) The large majority (84%) indicated that they believed they needed to improve their health. Sixty-three patients (13%) indicated that a family member or carer thought they should do it, 17% cited convenience as a major reason, and 9% indicated that the low cost of the program was an incentive for participating.
Figure 3.7: Patients’ Reasons for Participating in DMAS
84.2%
13.1%
9.0%
17.1%14.2%
0%
10%
20%
30%
40%
50%
60%
70%
80%
90%
Improved Health Family Member Cost Convenience Other
Per
cen
tag
e of
Tot
al S
urv
eys
(n=
480)
Reason for participation in the Diabetes Service Sixty-eight patients (14%) nominated other reasons for their participation, of whom sixty-one provided additional information, as reported in the following table.
Table 3.8: Other Reasons for Participation in DMAS
Additional reason for participation No. %
Approached/Asked by Pharmacist 23 37.7%
Other 12 19.7%
Additional support 11 18.0%
Additional information 10 16.4%
Doctor recommendation 5 8.2%
Total 61 100.0%

Australian Government Department of Health and Ageing Evaluation of the Diabetes Pilot Program
Final Report January 2010 44
QU A L I T Y OF L IF E
Patients were asked to rate their quality of life, based on how they were feeling on the day of their interview, in the following areas:
• Level of mobility; • Ability to look after their personal care; • Ability to perform their usual activities; • Perceived level of pain/discomfort; and • Perceived level of anxiety/depression.
Answers were categorised into “None” - where the patient indicated no problems in each of these areas; “Some” - where the patient indicated there were some problems with ‘walking around’, with washing or dressing themselves’ or with ‘performing their usual activities’ or moderate ‘pain or discomfort’ and they were moderately ‘anxious or depressed’; “Extreme” - where the patient indicated that they were ‘confined to bed’, ‘unable to wash or dress themselves’, unable to perform their usual activities’, in extreme pain or discomfort’ or ‘extremely anxious or depressed’. The responses are shown in the following figure.
Figure 3.8: Patients’ Perceived Quality of Life
67.5%
90.8%
69.8%
41.7%
64.8%
31.3%
7.5%
27.9%
52.5%
29.4%
0.6% 1.0% 1.9%
5.8% 5.2%
0.6% 0.6% 0.4% 0.6%0%
10%
20%
30%
40%
50%
60%
70%
80%
90%
100%
Mobility Personal Care Usual Activities Pain/Discomfort Anxiety/Depression
Per
cen
tag
e of
Tot
al S
urv
eys
(n=
480)
None Some Extreme No response The major highlights are:
• 68% reported no mobility problems, while 31% had some mobility problems; • 91% were able to look after their own personal care needs; • 70% had no difficulty with their usual activities, while 28% had some difficulty; • 42% had no pain/discomfort and 53% had some pain/discomfort; • 65% had no anxiety/depression, while 29% experienced some anxiety/depression.
CU R R E N T HE A LTH ST A TE
Patients were asked to rate how good or bad their health state was on the day they were interviewed, where the best they could feel would be 100 and the worst was scored as 0. For ease of presentation in the following figure, the health states have been grouped in categories of 20, with just over a third (39%) of all patients rating their health between 60 and 80.

Australian Government Department of Health and Ageing Evaluation of the Diabetes Pilot Program
Final Report January 2010 45
Figure 3.9: Patients’ Perceived Current Health State
2.7%
7.7%
24.4%
39.4%
19.2%
6.7%
0%
5%
10%
15%
20%
25%
30%
35%
40%
45%
0 - 20 21 - 40 41 - 60 61 - 80 81 - 100 No data recorded
Per
cen
tag
e of
Tot
al S
urv
eys
(n=
480)
Current Health State Overall, the average current health state was scored at 67.2 with nine patients indicating that their state of health was 100 and one patient scoring their health at 5.
PA TI E N T S’ DIAB E TE S MA N AG E M E N T
Patients were given the following statements in regard to how they maintain their diabetes:
• “I always follow the instructions about how to take my diabetes medication” • “I have good diet habits” • “I have good exercise habits” • “I am able to manage my diabetes”.
It should be noted that these statements did not have precise definitions, and hence the responses reflect the personal opinions and views of respondents as to what comprise e.g. “good diet habits” and “good exercise habits”.
Figure 3.10: Patients’ Perceptions of their Ability to Follow Instructions for their Diabetes Medication
2.5% 2.7%
6.3%
35.8%
49.4%
3.3%
0%
10%
20%
30%
40%
50%
60%
Strongly disagree Disagree Neither agree or disagree Agree Strongly agree No data recorded
Per
cen
tag
e of
Tot
al S
urv
eys
(n=
480)

Australian Government Department of Health and Ageing Evaluation of the Diabetes Pilot Program
Final Report January 2010 46
The large majority of patients (85%) agreed at least to some extent that they followed the instructions about how to take their diabetes medication (49% strongly agreeing), with only twelve patients (3%) “Strongly Disagreeing” with this statement.
Figure 3.11: Patients’ Perceptions of their Dietary Habits
4.6%
15.8%
25.2%
39.4%
11.9%
3.1%
0%
5%
10%
15%
20%
25%
30%
35%
40%
45%
Strongly disagree Disagree Neither agree or disagree Agree Strongly agree No data recorded
Per
cen
tag
e of
Tot
al S
urv
eys
(n=
480)
When asked about their dietary habits, half (51%) of patients agreed that they had good dietary habits, with 20% disagreeing to some extent.
Figure 3.12: Patients’ Perceptions of their Exercise Habits
9.4%
27.1%
23.1%
26.5%
10.4%
3.5%
0%
5%
10%
15%
20%
25%
30%
Strongly disagree Disagree Neither agree or disagree Agree Strongly agree No data recorded
Per
cen
tag
e of
Tot
al S
urv
eys
(n=
480)
Patients’ perceptions of their exercise habits were evenly distributed, with just over a third (37%) of patients considering that they had good exercise habits with the same proportion (37%) disagreeing to some extent with this statement.

Australian Government Department of Health and Ageing Evaluation of the Diabetes Pilot Program
Final Report January 2010 47
Figure 3.13: Patients’ Perceptions of their Ability to Manage their Diabetes
3.5%
14.8%
24.4%
41.3%
12.9%
3.1%
0%
5%
10%
15%
20%
25%
30%
35%
40%
45%
Strongly disagree Disagree Neither agree or disagree Agree Strongly agree No data recorded
Per
cen
tag
e of
Tot
al S
urv
eys
(n=
480)
When asked about their ability to manage their diabetes over half (54%) agreed and only 18% disagreed.
EX P E C TE D BE NE F IT S OF T H E DMAS
Patients were asked in Consultation 1 to indicate what they expected would be the main benefits of participating in DMAS. (Note that patients were able to provide multiple responses.) The large majority (83%) of patients identified that “extra support to manage my health” to be the major benefit expected from taking part in the service. Just over a third (37%) also identified “better medication management” and almost half (46%) that “improved lifestyle” were also expected to be benefits. Only one patient indicated that there were no key benefits expected of the service. Where patients indicated “other” as their key benefit there was a general trend towards increased knowledge, assistance to lose weight and overall diabetes management.
Figure 3.14: Expected Benefits for Patients Taking Part in DMAS
82.9%
36.7%
46.3%
6.3%
0.2%0%
10%
20%
30%
40%
50%
60%
70%
80%
90%
Extra Support Medication Management Improved Lifestyle Other None
Per
cen
tag
e of
Tot
al S
urv
eys
(n=
480)
Key benefits of the Diabetes Service

Australian Government Department of Health and Ageing Evaluation of the Diabetes Pilot Program
Final Report January 2010 48
WI LLI N G NES S TO PA Y
Patients were asked to consider the benefits they expected from the service and to indicate the maximum price they would be willing to pay per consultation. Thirty-two patients (6.7%) indicated that they would not be willing to pay for this type of service. About one-third indicated that they would be willing to pay either $2.75 or $5.00 for consultations (33% and 32% respectively), with just under 25% willing to pay $10.00 or more, as shown in the following table.
Table 3.9: Patients’ Willingness to Pay for DMAS
All Patients Amount per Consultation
No. %
$2.75 159 33.1%
$5.00 153 31.9%
$10.00 79 16.5%
More than $10 39 8.1%
Not willing to pay 32 6.7%
Not recorded 18 3.8%
Total 480 100.0%
3.2.2 END OF PARTICIPATION - SURVEY #2
At the conclusion of their participation in DMAS, patients were asked to complete another survey to ascertain the degree to which their participation in DMAS had benefitted them. Similar to the survey they had completed at the start of the study, the ‘end of participation’ survey covered their quality of life, current health state and how they maintain their diabetes. In addition, patients were also given the opportunity to identify the usefulness and key benefits of the service, how much they would be willing to pay for the service in the future and suggested improvements to the service. To date, 233 surveys were received from 114 pharmacies.
QU A L I T Y OF L IF E
Based on how the patient was feeling on the day of their final interview, they were asked to rate their quality of life in the following areas:
• Level of mobility; • Ability to look after their personal care; • Ability to perform their usual activities; • Perceived level of pain/discomfort; and • Perceived level of anxiety/depression.
Answers were categorised on the same basis as Survey #1. The responses are shown in the following figure.

Australian Government Department of Health and Ageing Evaluation of the Diabetes Pilot Program
Final Report January 2010 49
Figure 3.15: Patients’ Perceived Quality of Life
62.7%
91.0%
68.2%
43.3%
67.8%
37.3%
9.0%
30.5%
50.2%
29.6%
0.9%
6.4%
2.6%0.4%
0%
10%
20%
30%
40%
50%
60%
70%
80%
90%
100%
Mobility Personal Care Usual Activities Pain/Discomfort Anxiety/Depression
Per
cen
tag
e of
Tot
al S
urv
eys
(n=
233)
None Some Extreme No response The major highlights are:
• 63% reported no mobility problems, while 37% had some mobility problems; • 91% were able to look after their own personal care needs; • 68% had no difficulty with their usual activities, while 31% had some difficulty; • 43% had no pain/discomfort and 50% had some pain/discomfort; • 68% had no anxiety/depression, while 30% experienced some anxiety/depression.
CU R R E N T H E A L T H S T A TE
Patients were asked to rate how good or bad their health state was on the day they were interviewed, where the best they could feel would be 100 and the worst was scored as 0. Overall, the average current health state was scored at 72.1 with four patients indicating that their state of health was 100 and one patient indicating their health at 5. Just over a half (51%) of all patients rated their health between 60 and 80.
Figure 3.16: Patients’ Perceived Current Health State
1.3%2.6%
17.6%
51.1%
24.5%
3.0%
0%
10%
20%
30%
40%
50%
60%
0 - 20 21 - 40 41 - 60 61 - 80 81 - 100 No data recorded
Per
cen
tag
e of
Tot
al S
urv
eys
(n=
233)
Current Health State

Australian Government Department of Health and Ageing Evaluation of the Diabetes Pilot Program
Final Report January 2010 50
PA TI E N T S’ DIAB E TE S MA N AG E M E N T
Patients were given the following statements in regard to the services provided and how they maintain their diabetes:
• “I am satisfied that the service was delivered in a confidential manner.” • “The service gave me confidence to deal with my diabetes.” • “I am better at following instructions about taking my medications since participating in the
service.” • “I have improved my lifestyle (diet and exercise habits) since participating in the service.” • “I felt at ease receiving this service in the pharmacy.” • “My overall health has improved as a result of participating in this diabetes service.” • “Since participating in the diabetes service I am better able to manage my diabetes.”
As in Survey #1, these statements did not have precise definitions applied, and hence the responses reflect the personal opinions and views of respondents as to what comprise e.g. “good diet habits” and “good exercise habits”.
Figure 3.17: Patients’ Satisfaction with DMAS
0.4%
9.9%
88.8%
0.9%0%
10%
20%
30%
40%
50%
60%
70%
80%
90%
Strongly disagree Disagree Neither agree or disagree Agree Strongly agree No data recorded
Per
cen
tag
e of
Tot
al S
urv
eys
(n=
233)
The large majority of patients (89%) strongly agreed that they were satisfied that the DMAS was delivered in a confidential manner, with no patients disagreeing with this statement.
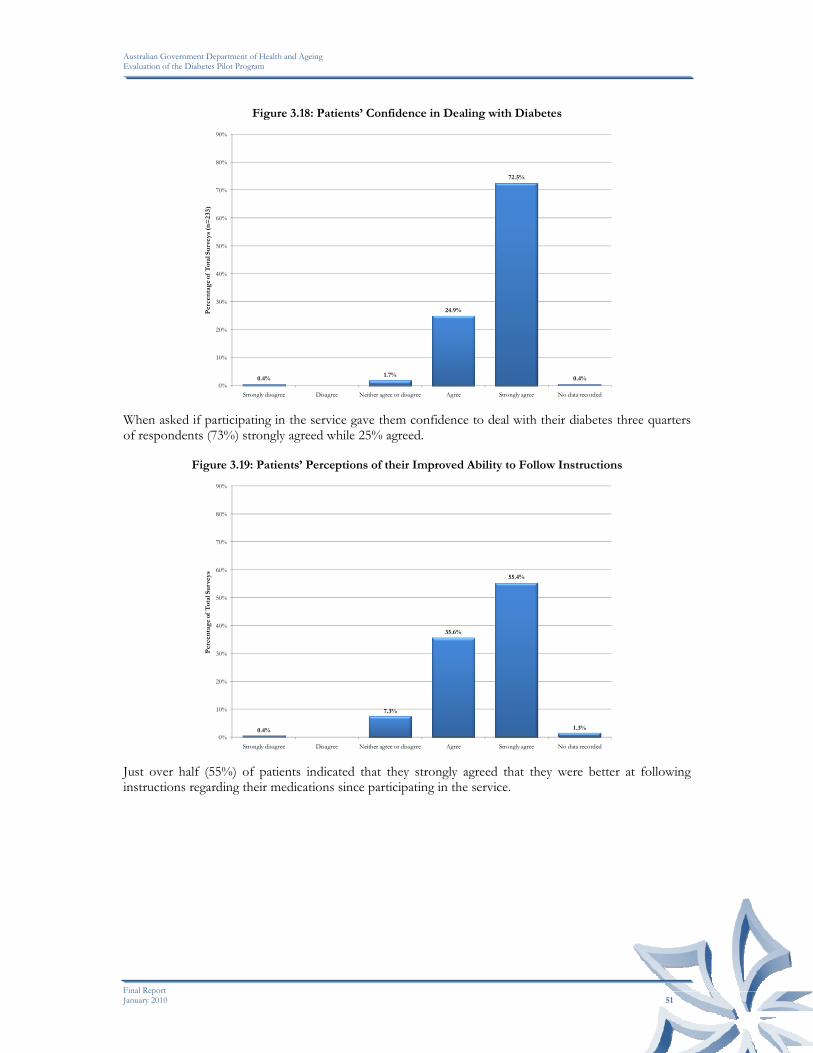
Australian Government Department of Health and Ageing Evaluation of the Diabetes Pilot Program
Final Report January 2010 51
Figure 3.18: Patients’ Confidence in Dealing with Diabetes
0.4%1.7%
24.9%
72.5%
0.4%0%
10%
20%
30%
40%
50%
60%
70%
80%
90%
Strongly disagree Disagree Neither agree or disagree Agree Strongly agree No data recorded
Per
cen
tag
e of
Tot
al S
urv
eys
(n=
233)
When asked if participating in the service gave them confidence to deal with their diabetes three quarters of respondents (73%) strongly agreed while 25% agreed.
Figure 3.19: Patients’ Perceptions of their Improved Ability to Follow Instructions
0.4%
7.3%
35.6%
55.4%
1.3%
0%
10%
20%
30%
40%
50%
60%
70%
80%
90%
Strongly disagree Disagree Neither agree or disagree Agree Strongly agree No data recorded
Per
cen
tag
e of
Tot
al S
urv
eys
Just over half (55%) of patients indicated that they strongly agreed that they were better at following instructions regarding their medications since participating in the service.
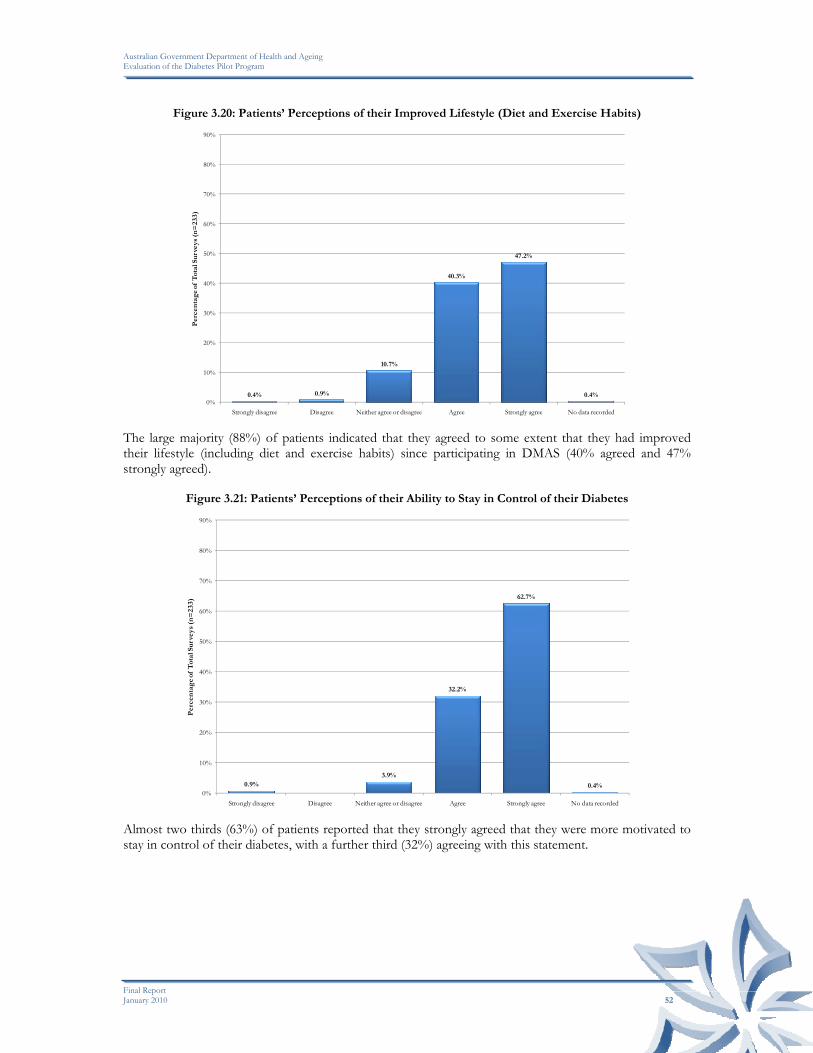
Australian Government Department of Health and Ageing Evaluation of the Diabetes Pilot Program
Final Report January 2010 52
Figure 3.20: Patients’ Perceptions of their Improved Lifestyle (Diet and Exercise Habits)
0.4% 0.9%
10.7%
40.3%
47.2%
0.4%0%
10%
20%
30%
40%
50%
60%
70%
80%
90%
Strongly disagree Disagree Neither agree or disagree Agree Strongly agree No data recorded
Per
cen
tag
e of
Tot
al S
urv
eys
(n=
233)
The large majority (88%) of patients indicated that they agreed to some extent that they had improved their lifestyle (including diet and exercise habits) since participating in DMAS (40% agreed and 47% strongly agreed).
Figure 3.21: Patients’ Perceptions of their Ability to Stay in Control of their Diabetes
0.9%3.9%
32.2%
62.7%
0.4%0%
10%
20%
30%
40%
50%
60%
70%
80%
90%
Strongly disagree Disagree Neither agree or disagree Agree Strongly agree No data recorded
Per
cen
tag
e of
Tot
al S
urv
eys
(n=
233)
Almost two thirds (63%) of patients reported that they strongly agreed that they were more motivated to stay in control of their diabetes, with a further third (32%) agreeing with this statement.

Australian Government Department of Health and Ageing Evaluation of the Diabetes Pilot Program
Final Report January 2010 53
Figure 3.22: Patients’ Perceptions of Receiving the DMAS in the Pharmacy
0.9% 0.4%
17.6%
80.3%
0.9%0%
10%
20%
30%
40%
50%
60%
70%
80%
90%
Strongly disagree Disagree Neither agree or disagree Agree Strongly agree No data recorded
Per
cen
tag
e of
Tot
al S
urv
eys
(n=
233)
When asked if they felt at ease receiving the DMAS in the pharmacy, the large majority of participants agreed to some extent that they felt at ease (80% strongly agreed and 18% agreed).
Figure 3.23: Patients’ Perceptions of their Overall Health Improvement
0.4% 0.9%
12.9%
43.3%40.8%
1.7%
0%
10%
20%
30%
40%
50%
60%
70%
80%
90%
Strongly disagree Disagree Neither agree or disagree Agree Strongly agree No data recorded
Per
cen
tag
e of
Tot
al S
urv
eys
(n=
233)
When patients were asked whether their overall health had improved as a result of participating in DMAS, the majority (84%) indicated they agreed to some extent that their overall health had improved (43% agreed and 41% strongly agreed).

Australian Government Department of Health and Ageing Evaluation of the Diabetes Pilot Program
Final Report January 2010 54
Figure 3.24: Patients’ Perceptions of their Ability to Better Manage their Diabetes
0.4% 0.4%
6.9%
40.8%
51.1%
0.4%0%
10%
20%
30%
40%
50%
60%
70%
80%
90%
Strongly disagree Disagree Neither agree or disagree Agree Strongly agree No data recorded
Per
cen
tag
e of
Tot
al S
urv
eys
(n=
233)
Patients were asked if, as a result of taking part in DMAS, they were better able to manage their diabetes. Half of respondents (51%) strongly agreed and a further 41% agreed.
US E F U LN ESS O F DMAS
Patients were asked to indicate what they believed were the most useful aspects of DMAS. All patients nominated at least one factor that they found useful, with three quarters (79%) indicating “being able to review their blood glucose” and “general support from the pharmacist” (79%) as being the most useful parts of the service. Responses are shown in the following figure (note that patients were able to provide multiple responses).
Figure 3.25: Patients’ Perceptions of the Usefulness of DMAS
79.4%
65.2%
35.6%
30.0%
78.5%
60.5%
66.5%
9.9%
0%
10%
20%
30%
40%
50%
60%
70%
80%
90%
Blood Clucose Review
Learning about Diabetes
Follow-up Check Reminder
Referrals to Health Care Professionals
General Support Improved Relationship with
Pharmacist
Ability to View Results
Other
Per
cen
tag
e of
Tot
al S
urv
eys
(n=
233)
Identified useful parts of Diabetes Service

Australian Government Department of Health and Ageing Evaluation of the Diabetes Pilot Program
Final Report January 2010 55
KE Y BE N EFI T S O F T H E DMAS
Patients were asked to indicate what they had found to be the key benefits of participating in DMAS. As can be seen in the following figure, the large majority (81%) of patients identified that “extra support to manage my health” was the major benefit of taking part in the service. Just over half (50-59%) also identified that “complementary to current services”, “medication management” and “improved lifestyle” were also key benefits of the service. No patients indicated that there were no benefits of the service. (Note that patients were able to provide multiple responses.)
Figure 3.26: Key Benefits from Patients Taking Part in DMAS
81.5%
57.9%
53.2%
61.4%
8.6%
0%
10%
20%
30%
40%
50%
60%
70%
80%
90%
Extra Support Complementary to Current Services
Medication Management
Improved Lifestyle Other None
Per
cen
tag
e of
Tot
al S
urv
eys
(n=
233)
Key benefits of the Diabetes Service The fifteen patients who indicated “other” as their key benefit from participating in DMAS also nominated at least one of the above key benefits. Below is a selection of their responses:
“Chemist wrote to my GP with info which helped greatly.”
“Gave me good resources”
“Giving me a sounding block for ideas re diet etc.”
“Good to get chemist's insight, stress & ill health greatly affect diabetes.”
“Helped manage amount of times of smaller food intakes.”
“Helped me accept and start using insulin”
“Helped me understand my diabetes better.”
“Helped my knowledge of diabetes.”
“It also helped me monitor my BSL's more”
“Learn about medication”
ARE AS F OR IM P R OVE M E N T
One-third of patients indicated how they thought the service could be improved. A selection of their responses follows.
“Ability for later in day appointments and on other/different days”
“Cost - should be free for diabetics”
“Follow up meetings for me would be an advantage”
“Having their own private room for consultation”
“Home visits”
“How much time do we have? Pharmacist was very professional, informed, positive and helpful, but the scope of the service was prescribed elsewhere and could be usefully reviewed.”

Australian Government Department of Health and Ageing Evaluation of the Diabetes Pilot Program
Final Report January 2010 56
“I am sure I would benefit from more than 5 appointments”
“I find the service so helpful and comforting. I am also very pleased with the notable improvements produced by this efficient service.”
“I found the service and the consultant to be extremely good”
“Instructional DVD’s, lifestyle movies”
“More available hours, more contact with diabetic educator”
“More frequent consultations to help me maintain my general health”
“The service continues on a regular basis. Please keep this service, it has helped me immensely, to have this service really has given me a lift in my life. I need this service.”
“The support, professional and sincere caring attention by my pharmacist Tracey, was magnificent. The only way to improve this service is to allow it to continue.”
“There is always room for improvement as new products and advances in medicine changes. But I feel this was a valuable exercise for the pharmacist and me.”
WI LLI N G NES S TO PA Y
Patients were asked to consider the benefits they had achieved from the service and to indicate the maximum price they would be willing to pay per consultation in the future. Only 9 patients (6%) indicated that they would not be willing to pay for this type of consultation. Twenty percent were willing to pay $2.75 (the current minimum fee); just over a third (39%) indicated that they would be willing to pay $5.00 for consultations, while just over one-third (35%) were willing to pay $10.00 or more, as shown in the following table.
Table 3.10: Patients’ Willingness to Pay for DMAS
All Patients Amount per Consultation
No. %
$2.75 47 20.2%
$5.00 90 38.6%
$10.00 54 23.2%
More than $10 27 11.6%
Not willing to pay 11 4.7%
Not recorded 4 1.7%
233
ACC E SS T O BL O O D GL U C O S E ME TE R
Patients were asked if they obtained a new blood glucose meter during their participation in DMAS. Forty-three percent indicated that they obtained a new meter so that their levels “could be downloaded by the pharmacist”, and 6% because they “didn’t have one or their old one was broken or lost”. Half (50%) did not obtain a new meter, either because they already had one and “the pharmacist was able to download their results” or “the pharmacists wrote them down” (47% and 3% respectively).
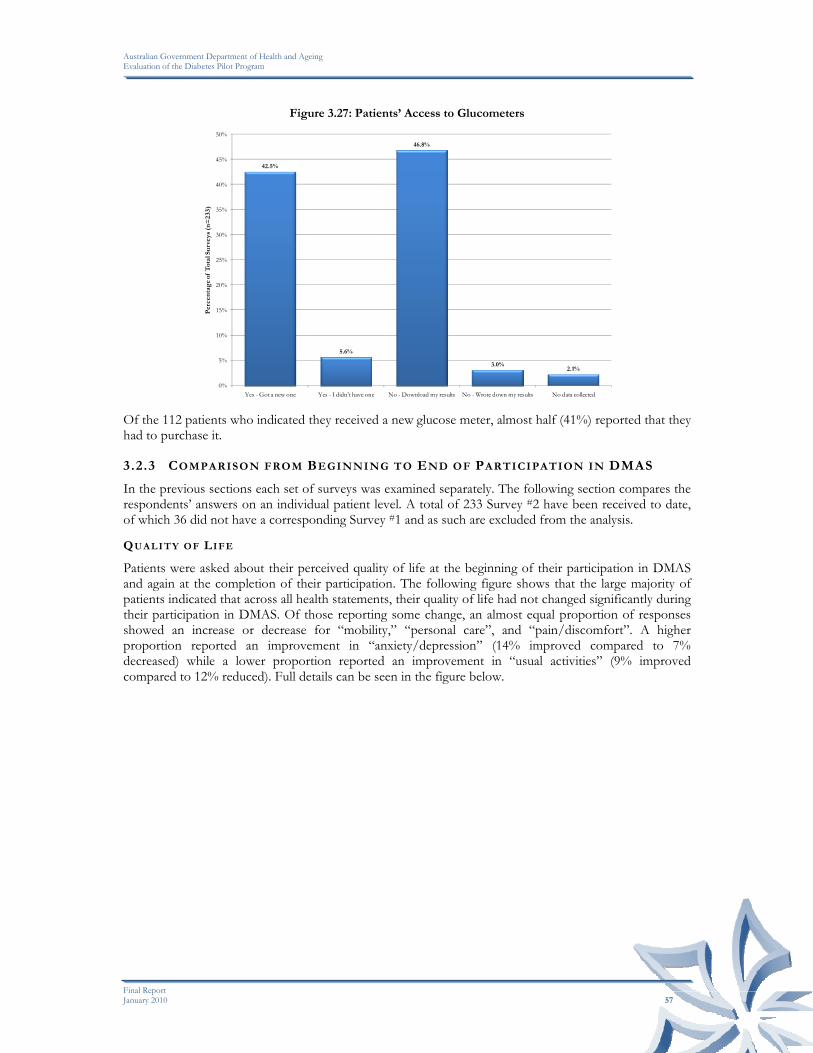
Australian Government Department of Health and Ageing Evaluation of the Diabetes Pilot Program
Final Report January 2010 57
Figure 3.27: Patients’ Access to Glucometers
42.5%
5.6%
46.8%
3.0%2.1%
0%
5%
10%
15%
20%
25%
30%
35%
40%
45%
50%
Yes - Got a new one Yes - I didn't have one No - Download my results No - Wrote down my results No data collected
Per
cen
tag
e of
Tot
al S
urv
eys
(n=
233)
Of the 112 patients who indicated they received a new glucose meter, almost half (41%) reported that they had to purchase it.
3.2.3 COMPARISON FROM BEGINNING TO END OF PARTICIPATION IN DMAS
In the previous sections each set of surveys was examined separately. The following section compares the respondents’ answers on an individual patient level. A total of 233 Survey #2 have been received to date, of which 36 did not have a corresponding Survey #1 and as such are excluded from the analysis.
QU A L I T Y OF LIFE
Patients were asked about their perceived quality of life at the beginning of their participation in DMAS and again at the completion of their participation. The following figure shows that the large majority of patients indicated that across all health statements, their quality of life had not changed significantly during their participation in DMAS. Of those reporting some change, an almost equal proportion of responses showed an increase or decrease for “mobility,” “personal care”, and “pain/discomfort”. A higher proportion reported an improvement in “anxiety/depression” (14% improved compared to 7% decreased) while a lower proportion reported an improvement in “usual activities” (9% improved compared to 12% reduced). Full details can be seen in the figure below.

Australian Government Department of Health and Ageing Evaluation of the Diabetes Pilot Program
Final Report January 2010 58
Figure 3.28: Comparison of Quality of Life from Beginning to End of Participation in DMAS
80%
92%
79%
68%
79%
10%
4%
9%
18%
14%
11%
5%
12%
14%
7%
0% 10% 20% 30% 40% 50% 60% 70% 80% 90% 100%
Mobility
Personal Care
Usual Activities
Pain/Discomfort
Anxiety/Depression
Percentage of Matched Surveys (n=197)
No change Quality of life increased Quality of life decreased CU R R E N T HE A LTH ST A TE
Patients were asked to rate their perception of their health state at the time they completed the surveys. The majority (54%) of patients ranked their health state higher at the completion of their participation than at the beginning. Forty-one percent (41%) recorded their overall state of health between 0 and 25 points higher, and a further 13% by more than 25 points. Twenty-four percent (24%) of patients rated their overall health state lower. Three (3%) patients indicated that their health had decreased by greater than 25 points and 21% indicated that their health had decreased by 0 to 25 points. Twenty-two percent (22%) recorded no change in their health state score. Details are shown in the following figure.
Figure 3.29: Comparison of Current Health State from Beginning to End of Participation in DMAS
21.8%
41.1%
13.2%
20.8%
3.0%
0%
5%
10%
15%
20%
25%
30%
35%
40%
45%
No Change Improved by 0 - 25 Improved by >25 Decreased by 0 - 25 Decreased by >25
Per
cen
tag
e of
Tot
al S
urv
eys
(n=
197)

Australian Government Department of Health and Ageing Evaluation of the Diabetes Pilot Program
Final Report January 2010 59
BE NE FI TS FR O M PAR T I C I P A TIN G IN DMAS
Patients were asked in Survey #1 what they expected to be the key benefits of participating in the study and then in Survey #2 they were asked what they considered were they key benefits realised in participating in the service. The following figure shows that two thirds (69%) of patients who indicated that they expected ‘extra support’ to be a key benefit also reported at the conclusion of their participation that this was indeed one of the key benefits they received. Twenty-five patients (13%) also reported realising this benefit, but had not nominated it at the commencement of their participation, while 16% who expected this benefit did not realise their expectations. A third (31%) of patients identified that “better medication management’ was a key benefit at the conclusion of the study but had not identified it at the beginning of their participation, while 27% realised a similar unexpected outcome in regard to “improved lifestyle”. Details for each key benefit area are shown below.
Figure 3.30: Comparison of Key Benefits from Beginning to End of Participation in DMAS
69.0%
23.4%
33.5%
1.0%
15.7% 15.2%17.8%
5.6%
12.7%
30.5%
26.9%
6.6%
0%
10%
20%
30%
40%
50%
60%
70%
80%
Extra Support Medication Management Improved Lifestyle Other
Per
cen
tag
e of
Mat
ched
Su
rvey
s (n
=19
7)
Expectations met Expectations not met Unexpected benefits

Australian Government Department of Health and Ageing Evaluation of the Diabetes Pilot Program
Final Report January 2010 60
WI LLI N G NES S TO PA Y
Almost half (43%) of patients did not change the amount they stated were willing to pay for consultations for the DMAS. Seventy-five (38%) of patients were willing to pay more at the conclusion of their participation than at the beginning and twenty-six patients (19%) indicated that they would pay less. Full details are shown in the following table.
Table 3.11: Patients’ Payment Summary at Conclusion of DMAS
Summary of Payment per Consultation at Conclusion of DMAS Participation
No. %
Not willing to pay 3 1.5%
$2.75 24 12.2%
$5.00 34 17.3%
$10.00 17 8.6%
Pay the same
>$10 7 3.6%
$2.75 - $0 4 2.0%
$5.00 - $0 3 1.5%
$5.00 - $2.75 9 4.6%
$10.00 - $0 3 1.5%
$10.00 - $2.75 2 1.0%
$10.00 - $5.00 7 3.6%
>$10 - $2.75 1 0.5%
>$10 - $5.00 3 1.5%
Pay less
>$10 - $10.00 5 2.5%
$0 - $2.75 3 1.5%
$0 - $5.00 5 2.5%
$0 - $10.00 3 1.5%
$0 - >$10 3 1.5%
$2.75 - $5.00 23 11.7%
$2.75 - $10.00 6 3.0%
$2.75 - >$10 4 2.0%
$5.00 - $10.00 16 8.1%
$5.00 - >$10 5 2.5%
Pay more
$10.00 - >$10 7 3.6%
3.3 CONCLUSION
Overall the changes observed by pharmacists in the patients who have completed the DMAS consultations have been variable. In regard to clinical measures, there was little change in BMI, a small improvement in blood pressure levels, and a slightly more noticeable reduction in blood glucose levels. Improvements were also observed in the lifestyle factors of exercise, alcohol use and medication management. Approximately 90% of patients reported to pharmacists that their goals in participating in the DMAS were partially or fully met at the time of their completion of the program.
The findings in the self-reported data collected from the patient survey also illustrate variable responses. The large majority of patients reported being very satisfied with the DMAS, particularly the general support it provided, and their ability to monitor their blood glucose levels. As a consequence, they
Australian Government Department of Health and Ageing Evaluation of the Diabetes Pilot Program
Final Report January 2010 61
considered that it had assisted them in raising their confidence in managing their diabetes, improved their medication management, and improved their dietary and exercise habits. They also considered that their overall health state had improved, although this was not reflected in the individual quality of life measures. Some patients indicated at the completion of their participation that they were willing to pay more for the service than they had at the beginning of their participation, reinforcing the value they placed on the service.
These findings are consistent with the views expressed by pharmacists participating in the case studies. They reported that patients who were motivated to follow the advice offered regarding managing their diabetes made noticeable changes to their lifestyles, such as their exercise routine, diet and drinking patterns. This did not always reveal itself in the clinical measures, with only modest changes often observed, although there were some notable exceptions. Improvements in their medication management were also widely reported, as illustrated in the data. Patients who were less motivated did not demonstrate the same changes, and their results reflected this.
Overall, the DMAS appears to have had a positive impact on the majority of patients, mainly in their self-confidence and capacity to better manage their diabetes, and to adopt a healthier lifestyle. At this stage, however, these effects have not translated into any significant change in their clinical indicators, although this could occur later if they sustain the changes they have made.

Australian Government Department of Health and Ageing Evaluation of the Diabetes Pilot Program
Final Report January 2010 62
4
ECONOMIC IMPACTS
4.1 IMPACT ON PATIENTS
The impact on patients from their participation in the DMAS may be assessed by a comparison of the benefits they have derived relative to the costs they incurred. Both these elements have been previously described, but are considered together in the following section.
4.1.1 BENEFITS
As previously reported, there were some observed changes for the better in the clinical measures used for patients participating in the DMAS from their commencement to their completion of the program. Overall, these included a very small change in BMI, a small improvement in blood pressure levels, and a slightly more noticeable reduction in blood glucose levels, with considerable variation between patients. Pharmacists reported that patients who were less motivated did not demonstrate the same changes, and their results reflected this.
In regard to the lifestyle factors of exercise, alcohol use and medication management, noticeable changes were reported for many patients. Approximately 90% of patients reported to pharmacists that their goals in participating in the DMAS were partially or fully met at the time of their completion of the program.
The large majority of patients responding to a survey reported being very satisfied with the DMAS, particularly the general support it provided, and their ability to monitor their blood glucose levels. They considered that it had assisted them in raising their confidence in managing their diabetes, improved their medication management, and improved their dietary and exercise habits. They also considered that their overall health state had improved, although this was not reflected in the individual quality of life measures.
Overall, the DMAS appears to have had a positive impact on the majority of patients, mainly in their self-confidence and capacity to better manage their diabetes, and to adopt a healthier lifestyle. To date, however, these effects do not appear to have translated into a significant change in their clinical indicators, although this could occur later if they sustain the changes they have made. Thus, the socio-psychological impact of the DMAS on patients seems to have been greater than its physical impact so far.
4.1.2 COSTS
The cost to patients of participating in the DMAS has been limited to the fee charged by the pharmacist for consultations. As previously reported, 46% of pharmacists reported charging a fee up to the recommended $2.75 per consultation, while 90% charged $5.00 or less per consultation.
At the commencement of their participation in the program, a third of patients indicated that they would be willing to pay either $2.75 or $5.00 for consultations (33% and 32% respectively), while just under 25% were willing to pay $10.00 or more. At the end of their participation in the program, 43% of patients did not change the amount they were willing to pay for the DMAS. However, 38% of patients were willing to pay more, while 19% indicated that they would pay less. This overall increase in willingness to pay for the service is indicative of the value patients placed on the DMAS.

Australian Government Department of Health and Ageing Evaluation of the Diabetes Pilot Program
Final Report January 2010 63
4.1.3 CONCLUSION
Given the positive feedback that patients have provided on the DMAS, the changes they have made to their lifestyle and diabetes management, their willingness to continue paying for the service (and in some instances to pay more), and the relatively low cost of their participation, we conclude that most patients would consider their participation in the DMAS to be cost-effective, and to represent value for money.
4.2 IMPACT ON PHARMACIES
The impact on pharmacies from their participation in the DMAS may be assessed by a comparison of the benefits they have derived relative to the costs they incurred.
4.2.1 BENEFITS
Pharmacists enrolled in the DMAS because they considered that the program provided them with the opportunity to extend the professional services of their pharmacy, and to expand their activities beyond the traditional dispensing function. As such, they considered that it could add further value to the services they offer their patients. The program also provided the opportunity for pharmacists to be trained in the provision of pharmacy-based diabetes services, thereby adding to their professional development and expanding their skill set. Pharmacists reported that they were generally very satisfied with the training and associated support materials provided.
However, subsequent uptake of the program by patients has been very low, and has been the source of considerable frustration and disappointment by many pharmacists. Only 32% of the trained and credentialed pharmacists reported having been successful in recruiting patients to the service, and two-thirds (68%) of these were only able to recruit 1 or 2 patients for inclusion in the DMAS evaluation. This equates to an estimated 1,000-1,250 patients participating in the program across the country, representing approximately 10% of the original target nationally. The fact that the recruitment activity required so much time, coupled with the fact that this activity attracted no funding under the program, led to pressure to reallocate pharmacists’ efforts to other revenue-generating activities within the pharmacy.
For those patients participating in the program, pharmacists saw some patients demonstrating improved management of their medications, improved diet, adoption of a better exercise regime, and improved motivation. For others, the results were less convincing, often related to their personal motivation, and the occurrence of complications or other medical conditions. Overall, pharmacists were generally supportive of the DMAS in regard to its effect on patients, and considered that it had the potential to be a valuable service to patients, once enrolled. However, the low participation rates by patients have significantly diminished the overall benefits of the program to pharmacies.
4.2.2 COSTS
Pharmacists reported start-up and ongoing costs as part of the evaluation data. The mean start-up cost was $1,006, comprised of $486 in infrastructure investment and $520 in labour costs. Approximately 25% of pharmacists reported spending nothing, 37% spent up to $1,000 and 24% spent between $1,000 and $2,000. The remaining 15% spent more than $2,000.
These costs were offset by payments received from the government under the DMAS. As at 19 November 2009, these amounted to $606,164, comprised of $198,414 for Training Subsidies and $407,750 for Readiness Payments. Pharmacists in the case studies reported that these payments largely met the start-up costs they incurred.
Ongoing costs incurred were comprised of 90% labour costs and 10% materials costs. The reporting of ongoing costs has been of variable quality, however, the reporting of time spent on DMAS activities has been more consistent, and given the dominance of labour as the main cost element, may be used as an indicator of the ongoing costs incurred by pharmacies.

Australian Government Department of Health and Ageing Evaluation of the Diabetes Pilot Program
Final Report January 2010 64
Those pharmacies which did not recruit any patients to the DMAS reported spending approximately three hours per week on recruitment and related activities. At an average cost of $50 per hour (the most commonly reported wage cost for pharmacists among case study sites), these activities cost pharmacies approximately $150 per week. Given that the only payments made for the DMAS related to patient consultations, these activities received no payment, and were direct costs to the pharmacy, approximating $7,500 to $8,000 per annum (assuming that they maintained their recruitment efforts throughout the year).
Pharmacies successfully recruiting patients also reported spending approximately three hours per week on DMAS activities, covering recruitment, patient consultations and administration. We have previously estimated that this time may be allocated 50% to patient consultations (1.5 hours per week) and 50% to recruitment and administration (1.5 hours per week) for pharmacies recruiting five patients to the program. The payment received from the DMAS for patient consultations was a total of $320 for monthly consultations over six months (with pro-rata payments for patients exiting the program). Assuming five patients per pharmacy (the basis for the above time estimates), this translates to an average payment per pharmacy of $61.50 per week, compared to labour costs of $75 per week for this activity. The time spent on recruitment and administration (valued at $75 per week) was not funded. Thus on average, pharmacies recruiting five patients to the DMAS patients incurred un-funded labour costs of approximately $90 per week, plus materials cost (10% or $10), less the patient fee charged (typically $2.75 or $5), representing approximately $95 to $100 per week, or $5,000 to $5,200 per annum.
For pharmacies which spent less time on recruitment and/or less time per consultation, these costs would be lower, and conversely would be higher for those adopting the opposite practices.
In summary, pharmacies have incurred costs higher than the payments received for their DMAS activities, largely related to the time spent on the recruitment of patients. The payments received for patient consultations are broadly consistent with the costs incurred on these activities, however, there is no profit margin in these activities. Consequently, there were further opportunity costs associated with using the time spent on DMAS as opposed to other revenue-generating activities.
These estimates are consistent with the views expressed by pharmacists participating in the case studies, who reported that their consultation time was generally covered by the payments received, but that the recruitment and ancillary costs were borne by the pharmacy.
4.2.3 CONCLUSION
The large majority of pharmacists chose to participate in the DMAS to expand their professional services to their patients, and to provide professional development opportunities to their staff. It was not regarded as a profit-making exercise in its own right, although increased patient loyalty resulting from their participation in the program might contribute to that outcome.
Whilst pharmacy staff may have benefitted from the training received and the expansion of their skill set, their capacity to apply these skills and knowledge has been limited by the number of patients recruited to the program. This has also limited the extent to which pharmacies have been able to expand their professional services across a large number of patients, with only 10% of the original target number of patients having participated in the program. Consequently, and notwithstanding the positive benefits that participating patients may have realised, the overall benefits to pharmacy are likely to be considerably lower than originally expected.
Conversely, the costs incurred by pharmacy are considerable, estimated on average at between $5,000 and $8,000 per annum over and above the payments received under the DMAS and patient fees. The large majority of these costs relate to the time spent in seeking to recruit patients to the program, which was not funded.
Despite the positive impact that pharmacists saw on patients participating in the program, and the professional development opportunities offered by the program for pharmacists, the benefits to the pharmacy itself have been significantly diminished by the low participation rates. With identified out-of-pocket costs plus opportunity costs, we conclude that many pharmacies would question whether their participation in the DMAS was cost-effective.

Australian Government Department of Health and Ageing Evaluation of the Diabetes Pilot Program
Final Report January 2010 65
4.3 IMPACT ON THE HEALTH SYSTEM
The impact on the broader health system of the DMAS may be assessed by a comparison of the impact it has had on service capacity and delivery relative to the costs incurred by government in establishing and running the program.
4.3.1 BENEFITS
From a broader health system perspective, the DMAS provided the opportunity to expand the professional service capacity of pharmacists to assist patients with type-2 diabetes who were not already engaged with an existing diabetes service. It was consistent with other community pharmacy strategies and provided the opportunity to trial the service in approximately 800 pharmacies across the country. It also provided the opportunity to determine the uptake of the service among patients, and to assess the impact of the service among patients participating in the program.
The program was successful in attracting the target number of pharmacists, and in providing the requisite training and credentialing of those pharmacists. All indications are that the training was effective, resulting in participating pharmacists expanding their professional skills, and increasing pharmacy capacity in providing professional services in this area.
However, as previously reported, the greatest limitation to the DMAS has been the inability to attract the target number of patients to the program. Only 32% of the trained pharmacists reported recruiting any patients, with only 1,000-1,250 patients participating, representing 10% of the original target. The reasons behind this low participation rate have been previously discussed, and are primarily lack of patient interest (for a variety of reasons), participation in other available diabetes services, and failure to meet the eligibility criteria.
Among the patients participating in the program, the clinical benefits to date have been variable and relatively modest. Patients themselves have been highly complimentary of the program, and there is evidence to demonstrate that it has had a positive impact on some of the main lifestyle factors that impact on their diabetes. However, the ultimate impacts of these changes on their clinical indicators and ongoing disease management are yet to be demonstrated.
In summary, whilst the program has resulted in increased service capacity in community pharmacy, the translation of this capacity to service delivery has been limited. In order to achieve the targets originally set, patient recruitment and participation would have to increase significantly. Without such an increase, we conclude that the benefits originally envisaged from the DMAS are unlikely to be realised.
4.3.2 COSTS
The Department of Health and Ageing has provided data relating to the financial budget and expenditure on Stages 1 and 2 of the DMAS to date. The evaluators have excluded data relating to Stage 1 (where separately identified) and extrapolated the remaining expenditure to date to derive an estimate of the likely expenditure to the end of Stage 2 of the DMAS. It should be noted that the extrapolations are estimates made by the evaluators based on the data provided and should not be seen as representing any official program estimates. This data is summarised in the following table.

Australian Government Department of Health and Ageing Evaluation of the Diabetes Pilot Program
Final Report January 2010 66
Table 4.1: Government Expenditure on Stage 2 of DMAS
Activity Budget June
2009 Expenditure Extrapolation
Administration and Program Management: (1)
- Pharmacy Readiness Kit $101,074 $100,871 $100,000
- Advertising/Promotion $287,609 $28,403 $40,000
- Other Administration/Program Management $1,070,206 $820,489 $1,100,000
- Sub-Total $1,458,889 $949,763 $1,240,000
Training and Credentialing (2)
- Training $998,600 $871,300 $1,000,000
- Credentialing $100,000 $86,520 $90,000
- Sub-Total $1,098,600 $957,820 $1,090,000
Payments to Pharmacy (2)
- Training Subsidy $896,000 $198,414 $200,000
- Readiness Payments $400,000 $407,750 $410,000
- Service Payments $3,584,000 $14,440 $350,000
- Other $147,840 - $150,000
- Sub-Total $5,027,840 $620,604 $1,110,000
Other Costs (1) $889,356 $379,991 $650,000
TOTAL $8,474,685 $2,908,178 $4,090,000
(1) Expenditure to 30 June 2009 (2) Expenditure to 19 November 2009
Total estimated government expenditure on Stage 2 of the DMAS is $4.1 million. Using the major categories in the table above, 30% of the anticipated expenditure relates to Program Administration and Management, 27% to Training and Credentialing of pharmacists, 27% to Payments to Pharmacy (including training subsidy, readiness payments and service payments), and 16% to other costs.
These costs translate to approximately $5,200 per pharmacist trained and credentialed, or $3,700 per participating patient. Had the original target of 11,000 patients been attained, the cost per patient (after allowing for higher service payments to pharmacists) would have been approximately $660. Thus the limited patient participation experienced to date has resulted in a nearly six-fold increase in costs per patient.
By way of comparison, AIHW reports that the direct costs of treating type-2 diabetes in 2004-05 were $828 million27. Of these costs, 38% were on hospital services, 29% on out-of-hospital medical services, and 28% on diabetes-related pharmaceuticals. It should be noted that these costs exclude the costs of treating complications and indirect costs of the disease.
Estimates of the prevalence of diabetes vary according to the data source used (see AIHW 2008 for a discussion), however a recent study on the burden of disease in Australia, 28 provides an estimate of just over 1 million people with type-2 diabetes in 2003. Bringing costs of treatment to 2007-08 prices and applying this prevalence rate suggests annual direct costs of treatment of type-2 diabetes of approximately $800 per patient per annum. The cost per patient of the DMAS service ($3,700 per participating patient),
27 Australian Institute of Health and Welfare 2008. Diabetes: Australian facts 2008. Diabetes series no. 8. Cat. No. CVD 40. Canberra: AIHW. 28 Begg S, Vos T, Barker B, Stevenson C, Stanley L, Lopez AD, 2007. The burden of disease and injury in Australia 2003. PHE 82. Canberra:
AIHW
Australian Government Department of Health and Ageing Evaluation of the Diabetes Pilot Program
Final Report January 2010 67
given the current participation rate, is therefore four to five times higher than current annual treatment costs for type-2 diabetes.
When looking for potential cost offsets to the health system in the form of reduced health care costs resulting from the DMAS, there is no evidence from the data collected to date that there has been a decrease in the use of other health services among patients participating in the DMAS – in fact health service utilisation has increased marginally. Whilst this might change in the longer term as a result of their improved lifestyle and clinical outcomes, this is yet to be demonstrated. Consequently there have been no demonstrated cost offsets to the health system, at least in the short term.
In order for the DMAS to be cost neutral, the participation rate would need to increase by about four-fold, or alternatively improvements in clinical outcomes would need to be achieved in order to reduce future demand for treatment services.
4.3.3 CONCLUSION
An economic evaluation of health care initiatives such as the DMAS seeks to identify the benefits that accrue to clients, service providers and the broader health system as a result of the initiative, and to compare those benefits to the costs incurred. Governments and other stakeholders may then form a judgement as to whether the benefits achieved warrant the costs incurred.
The investment by Government in the DMAS sought to increase community pharmacy capacity to provide services to patients with type-2 diabetes, thereby increasing access to such services by patients not engaged in existing services. The evidence gathered to date indicates that DMAS has succeeded in increasing professional service capacity in community pharmacies. However, translation of this increased capacity to service delivery has been very limited, due primarily to low patient participation rates. Consequently, the “reach” of the program has been much lower than originally expected. These low participation rates have also caused the cost per patient to increase nearly six-fold over the cost that would have been realised had patient participation expectations been met. A comparison of the cost per patient participating in the DMAS to other direct treatment costs indicates that the cost per patient in DMAS is four to five times greater than alternative treatment costs, although this would reduce proportionally to any increase in the participation rate.
At the same time, the evidence from the pilot indicates that whilst some patients have improved their lifestyle factors and have reported valuing the service provided, there is limited evidence of any improvement in their clinical indicators to date. Consequently, the impact to date of the DMAS on patient well-being has largely been psycho-social rather than physical. Whilst further patient benefits may become evident in the longer term, there is no evidence to indicate that the DMAS has contributed to reduced health care costs to date.
Ultimately, the Department of Health and Ageing will determine whether or not the investment to date in the DMAS represents value for money, and whether ongoing investment is warranted. Clearly, however, the cost-effectiveness of the service would improve significantly from greater patient participation.
In this regard, a number of strategies have been suggested. These include:
• Review the positioning of the DMAS relative to other diabetes services and programs. Some pharmacists participating in the program, as well as stakeholders consulted at the national level from a number of relevant organisations, queried whether a stand-alone program such as DMAS was (a) viable, and (b) clinically appropriate. The view was expressed that the pharmacist’s role should be recast within a broader multi-disciplinary team involving GPs, diabetes educators and other health professionals in existing programs (such as the Practice Incentives Program – Diabetes Incentive Program for GPs.) Similarly, closer linkages to the National Diabetes Services Scheme (NDSS) and other pharmacy-based programs (such as DAA/PMP and HMR) were also advocated. It was suggested that the pharmacists would have a particularly valuable role in the areas of medication management and general support and advice to patients in managing their diabetes.
• Greater promotion of the program among the general public, GPs, diabetes educators and other health professionals. In this regard, we note that only 10% of the budget allocated for advertising
Australian Government Department of Health and Ageing Evaluation of the Diabetes Pilot Program
Final Report January 2010 68
and promotion of the program was expended, which reinforces the views expressed by many pharmacists that the program was not sufficiently promoted.
• Target the program to areas where there is an existing shortage of other diabetes services, especially rural areas, and to patients who are not currently receiving diabetes services.
• Review the current funding of services to allow for the time and costs incurred on patient recruitment. This would provide an incentive for pharmacists to continue their recruiting effort, which in its current unfunded form acts as a disincentive for many pharmacists to continue to invest in this activity.

Australian Government Department of Health and Ageing Evaluation of the Diabetes Pilot Program
Final Report March 2010 A-I
A APPENDIX A – PHARMACY DATA
Pharmacists Credentialed and Entering Data by Jurisdiction
14
233
7
166
105
15
172
73
8
148
4
104
71
11
102
45
57.1%
63.5%
57.1%
62.7%
67.6%
73.3%
59.3% 61.6%
0%
10%
20%
30%
40%
50%
60%
70%
80%
0
50
100
150
200
250
ACT NSW NT QLD SA TAS VIC WA
Percentage of P
harmacies w
ho have Entered D
ata (n=493)
Nu
mb
er o
f P
har
mac
ies
(n=
785)
Number Credentialed Number Entered Data Percentage of Credentialed Data Entered
Pharmacists Entering Data and Recruiting Patients by Jurisdiction
Jurisdiction Pharmacies Entering
Data Percentage
Pharmacies Recruiting Patients
Percentage
ACT 8 1.6% 5 2.0%
NSW 148 30.0% 74 29.5%
NT 4 0.8% 1 0.4%
QLD 104 21.1% 56 22.3%
SA 71 14.4% 27 10.8%
TAS 11 2.2% 7 2.8%
VIC 102 20.7% 62 24.7%
WA 45 9.1% 19 7.6%
Total 493 100.0% 251 100.0%

Australian Government Department of Health and Ageing Evaluation of the Diabetes Pilot Program
Final Report March 2010 A-II
Pharmacists Trained, Entering Data and Recruiting Patients by PhARIA
PhARIA Pharmacists
Trained Percentage
Pharmacies Entering Data
Percentage Pharmacies
Recruiting Patients Percentage
1 659 83.9% 415 84.2% 203 80.9%
2 43 5.5% 29 5.9% 14 5.6%
3 43 5.5% 27 5.5% 21 8.4%
4 17 2.2% 12 2.4% 6 2.4%
5 12 1.5% 5 1.0% 4 1.6%
6 3 0.4% 2 0.4% 1 0.4%
Unknown 8 1.0% 3 0.6% 2 0.8%
Total 785 100.0% 493 100.0% 251 100.0%
Pharmacists Entering Data and Recruiting Patients by Floor Space
Floor space (sq m) Pharmacies Entering Data Percentage Pharmacies Recruiting Patients Percentage
0-100 118 23.9% 63 25.1%
101-200 153 31.0% 72 28.7%
201-300 97 19.7% 51 20.3%
301-400 72 14.6% 38 15.1%
401-500 29 5.9% 17 6.8%
501-600 12 2.4% 4 1.6%
>600 12 2.4% 6 2.4%
Total 493 100.0% 251 100.0%
Pharmacists Entering Data by Number of Pharmacists Employed
8.9%
26.4%27.4%
14.4%
9.3%
12.2%
1.4%
0%
5%
10%
15%
20%
25%
30%
1 2 3 4 5 >5 Not Stated
Per
cen
tag
e of
Ph
arm
acie
s (n
=49
3)
Number of Pharmacies
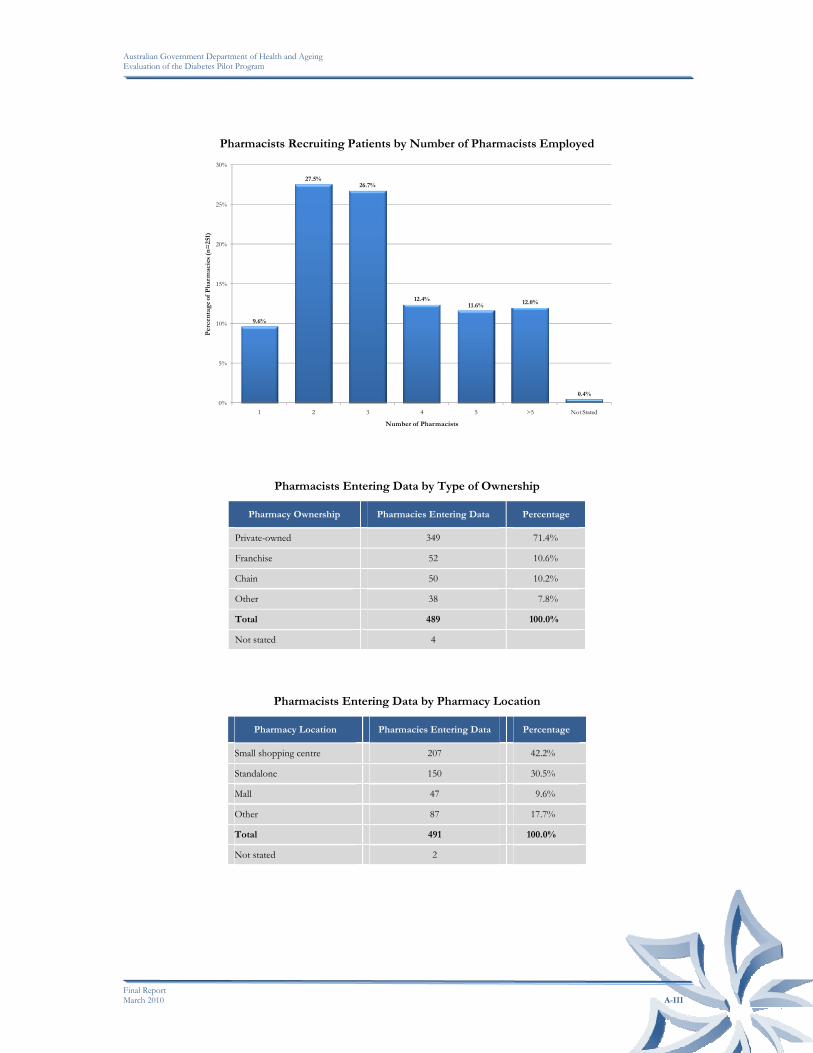
Australian Government Department of Health and Ageing Evaluation of the Diabetes Pilot Program
Final Report March 2010 A-III
Pharmacists Recruiting Patients by Number of Pharmacists Employed
9.6%
27.5%26.7%
12.4%11.6% 12.0%
0.4%
0%
5%
10%
15%
20%
25%
30%
1 2 3 4 5 >5 Not Stated
Per
cen
tag
e of
Ph
arm
acie
s (n
=25
1)
Number of Pharmacists
Pharmacists Entering Data by Type of Ownership
Pharmacy Ownership Pharmacies Entering Data Percentage
Private-owned 349 71.4%
Franchise 52 10.6%
Chain 50 10.2%
Other 38 7.8%
Total 489 100.0%
Not stated 4
Pharmacists Entering Data by Pharmacy Location
Pharmacy Location Pharmacies Entering Data Percentage
Small shopping centre 207 42.2%
Standalone 150 30.5%
Mall 47 9.6%
Other 87 17.7%
Total 491 100.0%
Not stated 2
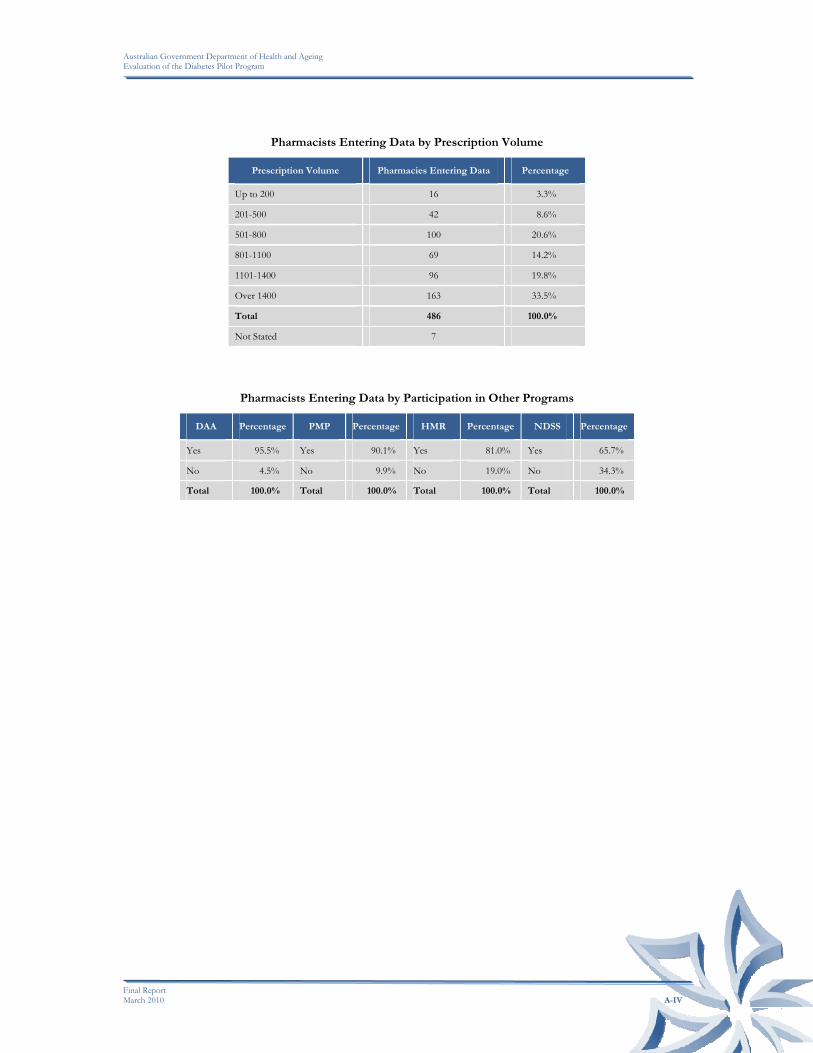
Australian Government Department of Health and Ageing Evaluation of the Diabetes Pilot Program
Final Report March 2010 A-IV
Pharmacists Entering Data by Prescription Volume
Prescription Volume Pharmacies Entering Data Percentage
Up to 200 16 3.3%
201-500 42 8.6%
501-800 100 20.6%
801-1100 69 14.2%
1101-1400 96 19.8%
Over 1400 163 33.5%
Total 486 100.0%
Not Stated 7
Pharmacists Entering Data by Participation in Other Programs
DAA Percentage PMP Percentage HMR Percentage NDSS Percentage
Yes 95.5% Yes 90.1% Yes 81.0% Yes 65.7%
No 4.5% No 9.9% No 19.0% No 34.3%
Total 100.0% Total 100.0% Total 100.0% Total 100.0%

Australian Government Department of Health and Ageing Evaluation of the Diabetes Pilot Program
Final Report March 2010 A-V
Patient Flows by Reporting Period
Quarter Number
ApproachedNumber Referred
Number Interested
Number Commencing
Number Withdrawing
Number Withdrawing When
Invoice Raised
Quarter 1 1,797 69 634 327 27 12
Quarter 2 1,470 41 472 219 27 5
Quarter 3 2,138 82 780 392 33 15
Quarter 4 3,496 143 1,177 639 56 23
Quarter 5 1,452 71 498 312 63 5
Total 10,353 406 3,561 1,889 206 60
Reasons for Patients Declining to Participate by Reporting Period
Quarter
No need to improve health
(customer perception)
Already participating in other programs
/services
Advised by family/carer
Advised by health
professional Cost Convenience
Not willing to purchase
glucose meter Other
Total patients declining
Quarter 1 26.1% (322) 12.6% (155) 2.2% (27) 10.6% (131) 8.7% (107) 6.5% (80) 5.6% (69) 9.9% (122) 1,232
Quarter 2 29.7% (309) 13.7% (142) 2.5% (26) 5.4% (56) 9% (93) 6.5% (68) 6.5% (68) 6.5% (68) 1,039
Quarter 3 25.3% (365) 12.9% (186) 0.8% (11) 5.3% (77) 6.7% (96) 7.6% (109) 6.6% (95) 10.9% (157) 1,440
Quarter 4 22.7% (558) 11.7% (288) 1.1% (27) 8.6% (212) 5.4% (133) 10.9% (269) 6.4% (158) 17.4% (429) 2,462
Quarter 5 14.8% (152) 11% (113) 2.5% (26) 13% (133) 4.8% (49) 6.3% (65) 2.4% (25) 10.3% (106) 1,025
Total 23.7% (1,706) 12.3% (884) 1.6% (117) 8.5% (609) 6.6% (478) 8.2% (591) 5.8% (415) 12.3% (882) 7,198

Australian Government Department of Health and Ageing Evaluation of the Diabetes Pilot Program
Final Report March 2010 A-VI
Patient Recruitment Methods by Reporting Period
Quarter Guild Brochure Guild Poster Mailed Letter Dispensing History Other Total responses
Quarter 1 (n=198) 62.1% (123) 50% (99) 30.8% (61) 58.6% (116) 17.2% (34) Quarter 1 (n=198)
Quarter 2 (n=169) 66.3% (112) 51.5% (87) 34.9% (59) 56.8% (96) 20.7% (35) Quarter 2 (n=169)
Quarter 3 (n=203) 76.4% (155) 61.1% (124) 31% (63) 67% (136) 20.2% (41) Quarter 3 (n=203)
Quarter 4 (n=240) 77.9% (187) 55.8% (134) 37.5% (90) 72.9% (175) 27.1% (65) Quarter 4 (n=240)
Quarter 5 (n=175) 60% (105) 46.9% (82) 28% (49) 58.9% (103) 17.7% (31) Quarter 5 (n=175)
Nature of Infrastructure Costs by Reporting Period
Quarter Shop Space Computer Parts Furniture Blood pressure cuff/machine/
sphygmomanometerScales Tape Measure
Other clinical equipment
Other infrastructure
Quarter 1 (n=198) 18.2% (36) 45.5% (90) 20.2% (40) 26.8% (53) 27.3% (54) 28.8% (57) 15.7% (31) 14.6% (29)
Quarter 2 (n=169) 14.2% (24) 30.8% (52) 14.8% (25) 20.7% (35) 19.5% (33) 16% (27) 14.8% (25) 10.7% (18)
Quarter 3 (n=203) 13.8% (28) 32.5% (66) 15.3% (31) 24.1% (49) 23.2% (47) 20.2% (41) 12.3% (25) 8.9% (18)
Quarter 4 (n=240) 15% (36) 45.4% (109) 18.3% (44) 32.9% (79) 27.9% (67) 26.7% (64) 15% (36) 12.5% (30)
Quarter 5 (n=175) 10.3% (18) 30.3% (53) 14.9% (26) 21.7% (38) 20% (35) 20.6% (36) 13.1% (23) 6.9% (12)

Australian Government Department of Health and Ageing Evaluation of the Diabetes Pilot Program
Final Report March 2010 A-VII
Average Number of Patients per Pharmacy in each Jurisdiction
Jurisdiction Average Number of
Patients
ACT (n=14) 1.00
NSW (n=233) 0.94
NT (n=7) 0.29
QLD (n=166) 0.72
SA (n=105) 0.58
TAS (n=15) 1.20
VIC (n=172) 0.74
WA (n=73) 0.67
Average Number of Patients per Pharmacy in each PhARIA
PhARIA Average Number of
Patients
PhARIA 1 (n=659) 0.70
PhARIA 2 (n=43) 0.79
PhARIA 3 (n=43) 1.77
PhARIA 4 (n=17) 1.47
PhARIA 5 (n=12) 1.00
PhARIA 6 (n=3) 0.67
Not Stated (n=8) 0.25
Average Number of Patients per Pharmacy Prescription Volume
Prescription Volume Average Number of
Patients
Up to 200 (n=16) 0.69
201-500 (n=42) 1.60
501-800 (n=100) 1.17
801-1100 (n=69) 1.13
1101-1400 (n=96) 1.31
Over 1400 (n=163) 1.27
Not Stated (n=299) 0.02
Average Number of Patients per Floor Space of Pharmacy
Floor Space Average Number of
Patients
0-100 (n=118) 1.03
101-200 (n=153) 1.29
201-300 (n=97) 1.35
301-400 (n=72) 1.26
401-500 (n=29) 1.66
501-600 (n=12) 0.50
>600 (n=12) 1.33
Not Stated (n=292) 0.00

Australian Government Department of Health and Ageing Evaluation of the Diabetes Pilot Program
Final Report March 2010 A-VIII
Average Number of Patients per Pharmacy Location
Pharmacy Location Average Number of
Patients
Small shopping centre (n=207) 1.27
Standalone (n=150) 1.45
Mall (n=47) 0.77
Other (n=87) 1.09
Not Stated (n=294) 0.00
Average Number of Patients per Pharmacy Ownership Type
Ownership Type Average Number of
Patients
Private-owned (n=349) 1.29
Franchise (n=52) 1.48
Chain (n=50) 1.16
Other (n=38) 0.66
Not Stated (n=296) 0.00
Average Number of Patients per Pharmacy in each Jurisdiction
Number of Pharmacists Average Number of
Patients
1 Pharmacist (n=44) 1.68
2 Pharmacists (n=130) 1.33
3 Pharmacists (n=135) 1.09
4 Pharmacists (n=71) 1.10
5 Pharmacists (n=46) 1.57
>5 Pharmacists (n=60) 1.10
Not Stated (n=299) 0.00
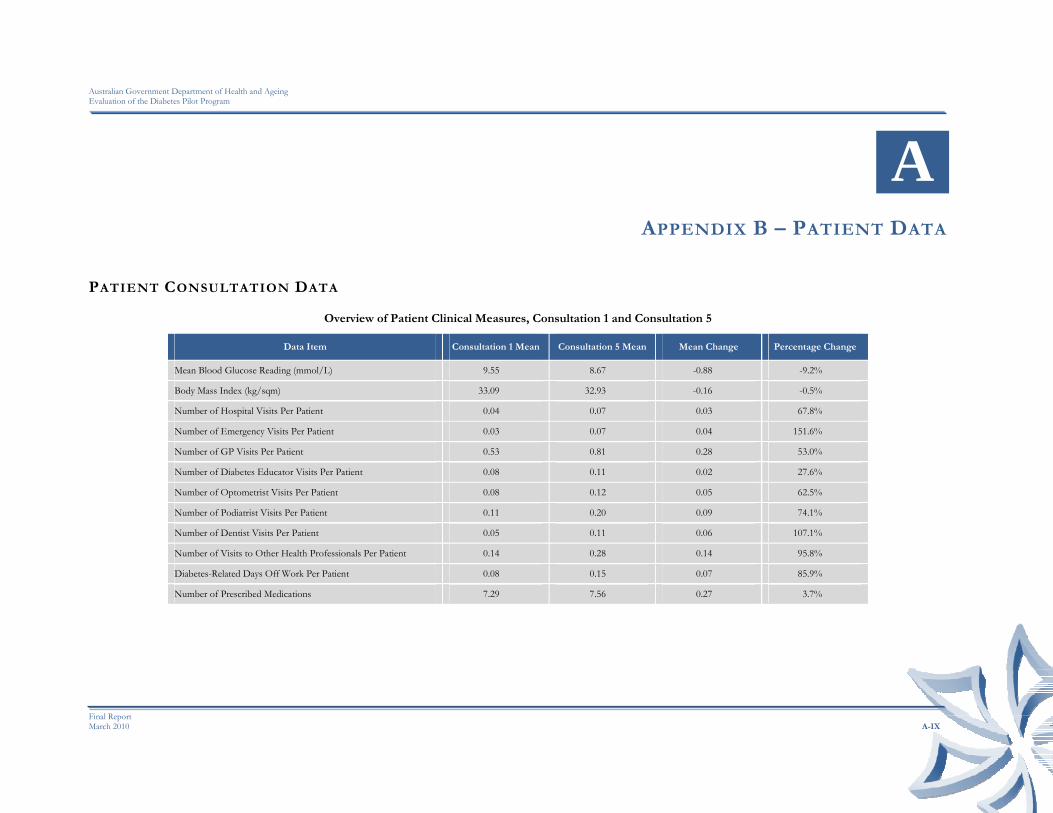
Australian Government Department of Health and Ageing Evaluation of the Diabetes Pilot Program
Final Report March 2010 A-IX
A APPENDIX B – PATIENT DATA
PATIENT CONSULTATION DATA
Overview of Patient Clinical Measures, Consultation 1 and Consultation 5
Data Item Consultation 1 Mean Consultation 5 Mean Mean Change Percentage Change
Mean Blood Glucose Reading (mmol/L) 9.55 8.67 -0.88 -9.2%
Body Mass Index (kg/sqm) 33.09 32.93 -0.16 -0.5%
Number of Hospital Visits Per Patient 0.04 0.07 0.03 67.8%
Number of Emergency Visits Per Patient 0.03 0.07 0.04 151.6%
Number of GP Visits Per Patient 0.53 0.81 0.28 53.0%
Number of Diabetes Educator Visits Per Patient 0.08 0.11 0.02 27.6%
Number of Optometrist Visits Per Patient 0.08 0.12 0.05 62.5%
Number of Podiatrist Visits Per Patient 0.11 0.20 0.09 74.1%
Number of Dentist Visits Per Patient 0.05 0.11 0.06 107.1%
Number of Visits to Other Health Professionals Per Patient 0.14 0.28 0.14 95.8%
Diabetes-Related Days Off Work Per Patient 0.08 0.15 0.07 85.9%
Number of Prescribed Medications 7.29 7.56 0.27 3.7%

Australian Government Department of Health and Ageing Evaluation of the Diabetes Pilot Program
Final Report March 2010 A-X
PATIENT SURVEY #1 DATA
QUALITY OF LIFE
Patients’ Perceptions of their level of Mobility - Survey #1
PhARIA 1 PhARIA 2 PhARIA 3 PhARIA 4 PhARIA 5 PhARIA 6 No PhARIA Total Mobility
No. % No. % No. % No. % No. % No. % No. % No. %
No problems in walking around 243 68.3% 16 72.7% 35 60.3% 12 75.0% 7 63.6% 2 100.0% 9 60.0% 324 67.5%
Some problems walking around 110 30.9% 6 27.3% 21 36.2% 4 25.0% 4 36.4% 0 0.0% 5 33.3% 150 31.3%
Confined to bed 0 0.0% 0 0.0% 2 3.4% 0 0.0% 0 0.0% 0 0.0% 1 6.7% 3 0.6%
No data collected 3 0.8% 0 0.0% 0 0.0% 0 0.0% 0 0.0% 0 0.0% 0 0.0% 3 0.6%
Total 356 22 58 16 11 2 15 480
Patients’ Perceptions of their Personal Care - Survey #1
PhARIA 1 PhARIA 2 PhARIA 3 PhARIA 4 PhARIA 5 PhARIA 6 No PhARIA Total Personal Care
No. % No. % No. % No. % No. % No. % No. % No. %
No problems with personal care 321 90.2% 20 90.9% 54 93.1% 13 81.3% 11 100.0% 2 100.0% 15 100.0% 436 90.8%
Some problems with personal care 29 8.1% 2 9.1% 2 3.4% 3 18.8% 0 0.0% 0 0.0% 0 0.0% 36 7.5%
Unable to wash or dress self 3 0.8% 0 0.0% 2 3.4% 0 0.0% 0 0.0% 0 0.0% 0 0.0% 5 1.0%
No data collected 3 0.8% 0 0.0% 0 0.0% 0 0.0% 0 0.0% 0 0.0% 0 0.0% 3 0.6%
Total 356 22 58 16 11 2 15 480
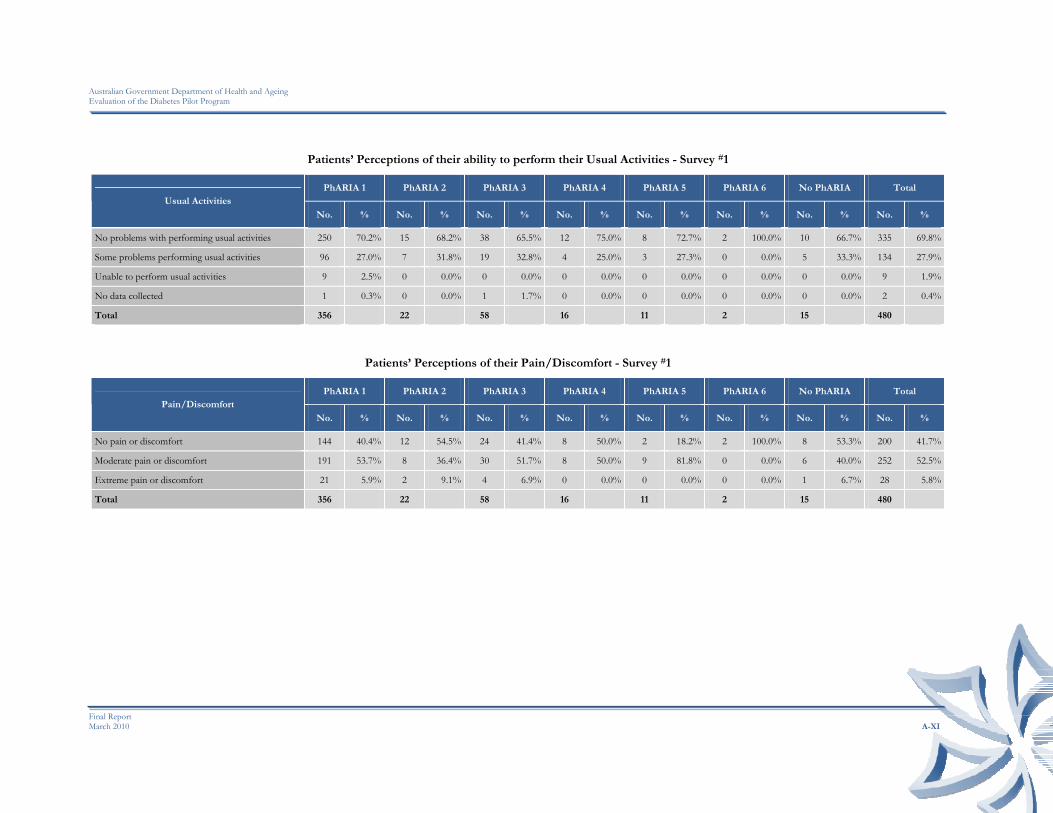
Australian Government Department of Health and Ageing Evaluation of the Diabetes Pilot Program
Final Report March 2010 A-XI
Patients’ Perceptions of their ability to perform their Usual Activities - Survey #1
PhARIA 1 PhARIA 2 PhARIA 3 PhARIA 4 PhARIA 5 PhARIA 6 No PhARIA Total Usual Activities
No. % No. % No. % No. % No. % No. % No. % No. %
No problems with performing usual activities 250 70.2% 15 68.2% 38 65.5% 12 75.0% 8 72.7% 2 100.0% 10 66.7% 335 69.8%
Some problems performing usual activities 96 27.0% 7 31.8% 19 32.8% 4 25.0% 3 27.3% 0 0.0% 5 33.3% 134 27.9%
Unable to perform usual activities 9 2.5% 0 0.0% 0 0.0% 0 0.0% 0 0.0% 0 0.0% 0 0.0% 9 1.9%
No data collected 1 0.3% 0 0.0% 1 1.7% 0 0.0% 0 0.0% 0 0.0% 0 0.0% 2 0.4%
Total 356 22 58 16 11 2 15 480
Patients’ Perceptions of their Pain/Discomfort - Survey #1
PhARIA 1 PhARIA 2 PhARIA 3 PhARIA 4 PhARIA 5 PhARIA 6 No PhARIA Total Pain/Discomfort
No. % No. % No. % No. % No. % No. % No. % No. %
No pain or discomfort 144 40.4% 12 54.5% 24 41.4% 8 50.0% 2 18.2% 2 100.0% 8 53.3% 200 41.7%
Moderate pain or discomfort 191 53.7% 8 36.4% 30 51.7% 8 50.0% 9 81.8% 0 0.0% 6 40.0% 252 52.5%
Extreme pain or discomfort 21 5.9% 2 9.1% 4 6.9% 0 0.0% 0 0.0% 0 0.0% 1 6.7% 28 5.8%
Total 356 22 58 16 11 2 15 480
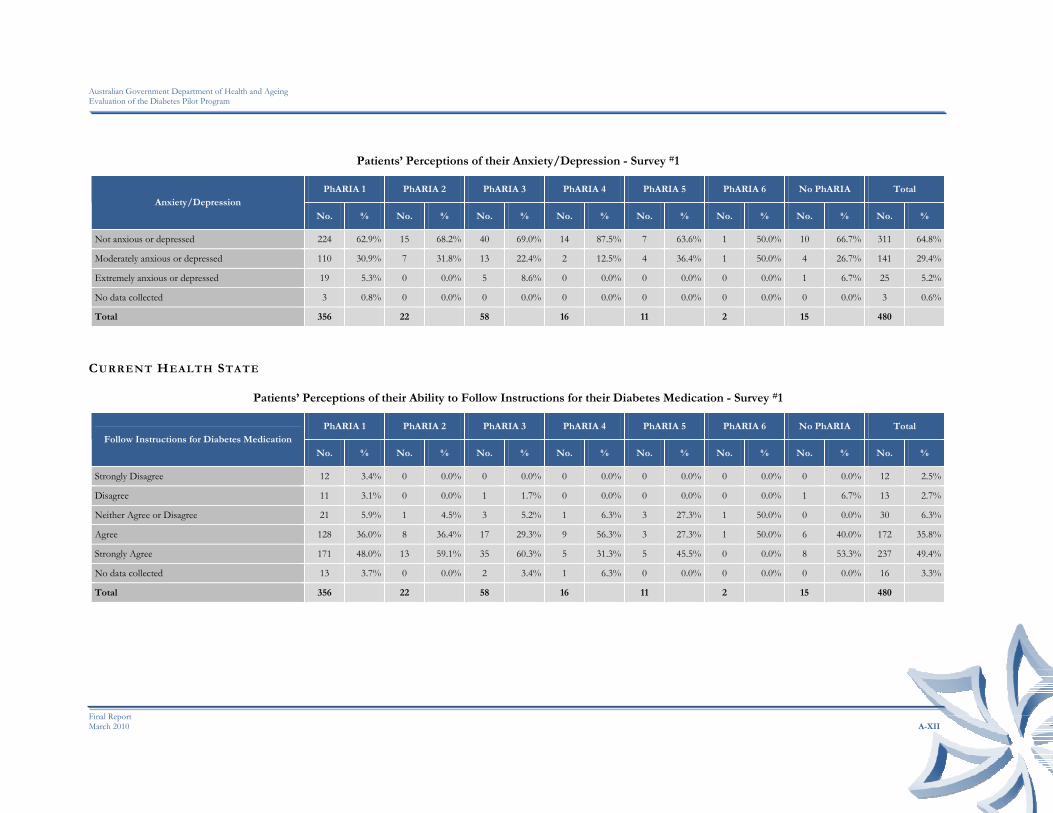
Australian Government Department of Health and Ageing Evaluation of the Diabetes Pilot Program
Final Report March 2010 A-XII
Patients’ Perceptions of their Anxiety/Depression - Survey #1
PhARIA 1 PhARIA 2 PhARIA 3 PhARIA 4 PhARIA 5 PhARIA 6 No PhARIA Total Anxiety/Depression
No. % No. % No. % No. % No. % No. % No. % No. %
Not anxious or depressed 224 62.9% 15 68.2% 40 69.0% 14 87.5% 7 63.6% 1 50.0% 10 66.7% 311 64.8%
Moderately anxious or depressed 110 30.9% 7 31.8% 13 22.4% 2 12.5% 4 36.4% 1 50.0% 4 26.7% 141 29.4%
Extremely anxious or depressed 19 5.3% 0 0.0% 5 8.6% 0 0.0% 0 0.0% 0 0.0% 1 6.7% 25 5.2%
No data collected 3 0.8% 0 0.0% 0 0.0% 0 0.0% 0 0.0% 0 0.0% 0 0.0% 3 0.6%
Total 356 22 58 16 11 2 15 480
CURRENT HEALTH STATE
Patients’ Perceptions of their Ability to Follow Instructions for their Diabetes Medication - Survey #1
PhARIA 1 PhARIA 2 PhARIA 3 PhARIA 4 PhARIA 5 PhARIA 6 No PhARIA Total Follow Instructions for Diabetes Medication
No. % No. % No. % No. % No. % No. % No. % No. %
Strongly Disagree 12 3.4% 0 0.0% 0 0.0% 0 0.0% 0 0.0% 0 0.0% 0 0.0% 12 2.5%
Disagree 11 3.1% 0 0.0% 1 1.7% 0 0.0% 0 0.0% 0 0.0% 1 6.7% 13 2.7%
Neither Agree or Disagree 21 5.9% 1 4.5% 3 5.2% 1 6.3% 3 27.3% 1 50.0% 0 0.0% 30 6.3%
Agree 128 36.0% 8 36.4% 17 29.3% 9 56.3% 3 27.3% 1 50.0% 6 40.0% 172 35.8%
Strongly Agree 171 48.0% 13 59.1% 35 60.3% 5 31.3% 5 45.5% 0 0.0% 8 53.3% 237 49.4%
No data collected 13 3.7% 0 0.0% 2 3.4% 1 6.3% 0 0.0% 0 0.0% 0 0.0% 16 3.3%
Total 356 22 58 16 11 2 15 480
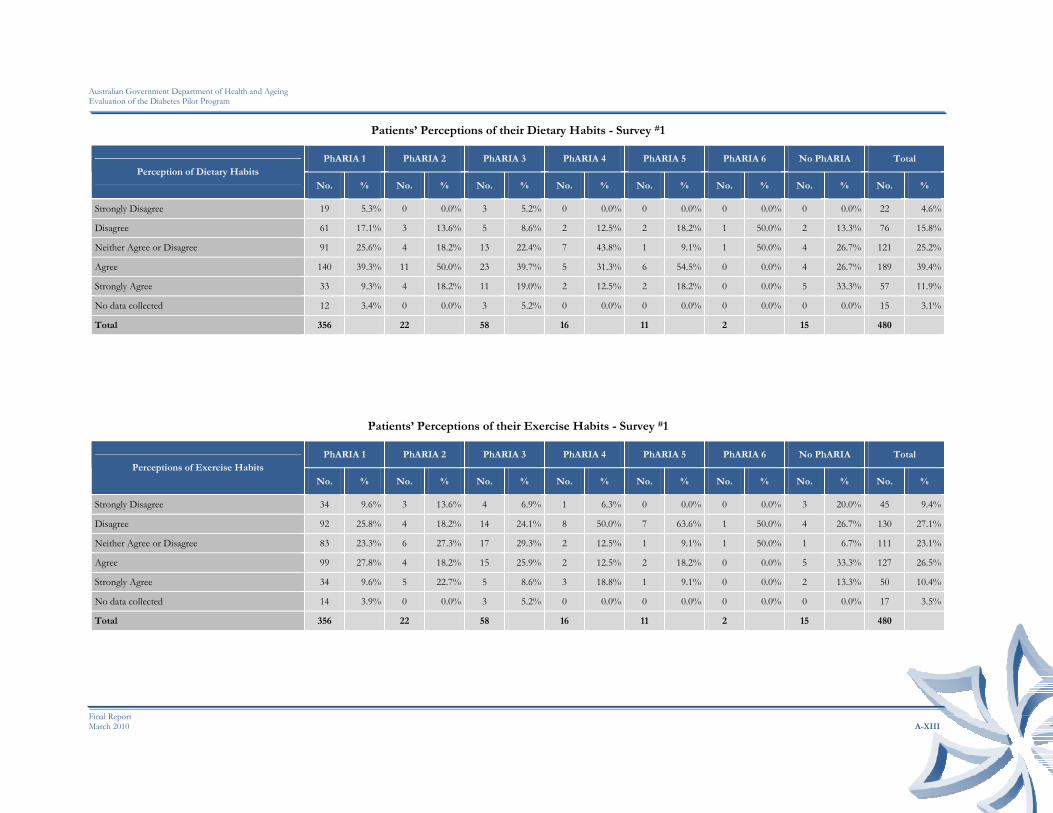
Australian Government Department of Health and Ageing Evaluation of the Diabetes Pilot Program
Final Report March 2010 A-XIII
Patients’ Perceptions of their Dietary Habits - Survey #1
PhARIA 1 PhARIA 2 PhARIA 3 PhARIA 4 PhARIA 5 PhARIA 6 No PhARIA Total Perception of Dietary Habits
No. % No. % No. % No. % No. % No. % No. % No. %
Strongly Disagree 19 5.3% 0 0.0% 3 5.2% 0 0.0% 0 0.0% 0 0.0% 0 0.0% 22 4.6%
Disagree 61 17.1% 3 13.6% 5 8.6% 2 12.5% 2 18.2% 1 50.0% 2 13.3% 76 15.8%
Neither Agree or Disagree 91 25.6% 4 18.2% 13 22.4% 7 43.8% 1 9.1% 1 50.0% 4 26.7% 121 25.2%
Agree 140 39.3% 11 50.0% 23 39.7% 5 31.3% 6 54.5% 0 0.0% 4 26.7% 189 39.4%
Strongly Agree 33 9.3% 4 18.2% 11 19.0% 2 12.5% 2 18.2% 0 0.0% 5 33.3% 57 11.9%
No data collected 12 3.4% 0 0.0% 3 5.2% 0 0.0% 0 0.0% 0 0.0% 0 0.0% 15 3.1%
Total 356 22 58 16 11 2 15 480
Patients’ Perceptions of their Exercise Habits - Survey #1
PhARIA 1 PhARIA 2 PhARIA 3 PhARIA 4 PhARIA 5 PhARIA 6 No PhARIA Total Perceptions of Exercise Habits
No. % No. % No. % No. % No. % No. % No. % No. %
Strongly Disagree 34 9.6% 3 13.6% 4 6.9% 1 6.3% 0 0.0% 0 0.0% 3 20.0% 45 9.4%
Disagree 92 25.8% 4 18.2% 14 24.1% 8 50.0% 7 63.6% 1 50.0% 4 26.7% 130 27.1%
Neither Agree or Disagree 83 23.3% 6 27.3% 17 29.3% 2 12.5% 1 9.1% 1 50.0% 1 6.7% 111 23.1%
Agree 99 27.8% 4 18.2% 15 25.9% 2 12.5% 2 18.2% 0 0.0% 5 33.3% 127 26.5%
Strongly Agree 34 9.6% 5 22.7% 5 8.6% 3 18.8% 1 9.1% 0 0.0% 2 13.3% 50 10.4%
No data collected 14 3.9% 0 0.0% 3 5.2% 0 0.0% 0 0.0% 0 0.0% 0 0.0% 17 3.5%
Total 356 22 58 16 11 2 15 480

Australian Government Department of Health and Ageing Evaluation of the Diabetes Pilot Program
Final Report March 2010 A-XIV
Patients’ Perceptions of their Ability to Manage their Diabetes - Survey #1
PhARIA 1 PhARIA 2 PhARIA 3 PhARIA 4 PhARIA 5 PhARIA 6 No PhARIA Total Ability to Manage own Diabetes
No. % No. % No. % No. % No. % No. % No. % No. %
Strongly Disagree 13 3.7% 0 0.0% 3 5.2% 0 0.0% 1 9.1% 0 0.0% 0 0.0% 17 3.5%
Disagree 56 15.7% 1 4.5% 6 10.3% 3 18.8% 0 0.0% 0 0.0% 5 33.3% 71 14.8%
Neither Agree or Disagree 80 22.5% 4 18.2% 18 31.0% 5 31.3% 7 63.6% 2 100.0% 1 6.7% 117 24.4%
Agree 160 44.9% 12 54.5% 14 24.1% 6 37.5% 2 18.2% 0 0.0% 4 26.7% 198 41.3%
Strongly Agree 34 9.6% 5 22.7% 15 25.9% 2 12.5% 1 9.1% 0 0.0% 5 33.3% 62 12.9%
No data collected 13 3.7% 0 0.0% 2 3.4% 0 0.0% 0 0.0% 0 0.0% 0 0.0% 15 3.1%
Total 356 22 58 16 11 2 15 480
KEY BENEFITS
Expected Key Benefits for Patients’ taking part in DMAS - Survey #1
PhARIA 1 (356) PhARIA 2 (22) PhARIA 3 (58) PhARIA 4 (16) PhARIA 5 (11) PhARIA 6 (2) No PhARIA (15) Total (480)
Extra Support 83.1% 54.5% 89.7% 75.0% 100.0% 100.0% 86.7% 82.9%
Medication Management 39.3% 36.4% 31.0% 6.3% 27.3% 50.0% 33.3% 36.7%
Improved Lifestyle 47.8% 63.6% 37.9% 31.3% 36.4% 100.0% 33.3% 46.3%
Other 5.9% 4.5% 5.2% 12.5% 18.2% 0.0% 6.7% 6.3%
None 0.3% 0.0% 0.0% 0.0% 0.0% 0.0% 0.0% 0.2%

Australian Government Department of Health and Ageing Evaluation of the Diabetes Pilot Program
Final Report March 2010 A-XV
REASON FOR PA RTICIPATION
Patients’ Reasons for Participating in DMAS - Survey #1
PhARIA 1 (356) PhARIA 2 (22) PhARIA 3 (58) PhARIA 4 (16) PhARIA 5 (11) PhARIA 6 (2) No PhARIA (15) Total (480)
Improve Health 83.4% 86.4% 87.9% 68.8% 100.0% 100.0% 86.7% 84.2%
Family Member 15.4% 4.5% 6.9% 0.0% 18.2% 0.0% 6.7% 13.1%
Cost 10.4% 0.0% 1.7% 0.0% 18.2% 0.0% 20.0% 9.0%
Convenience 18.8% 18.2% 6.9% 0.0% 18.2% 0.0% 33.3% 17.1%
Other 12.4% 9.1% 19.0% 43.8% 9.1% 0.0% 20.0% 14.2%
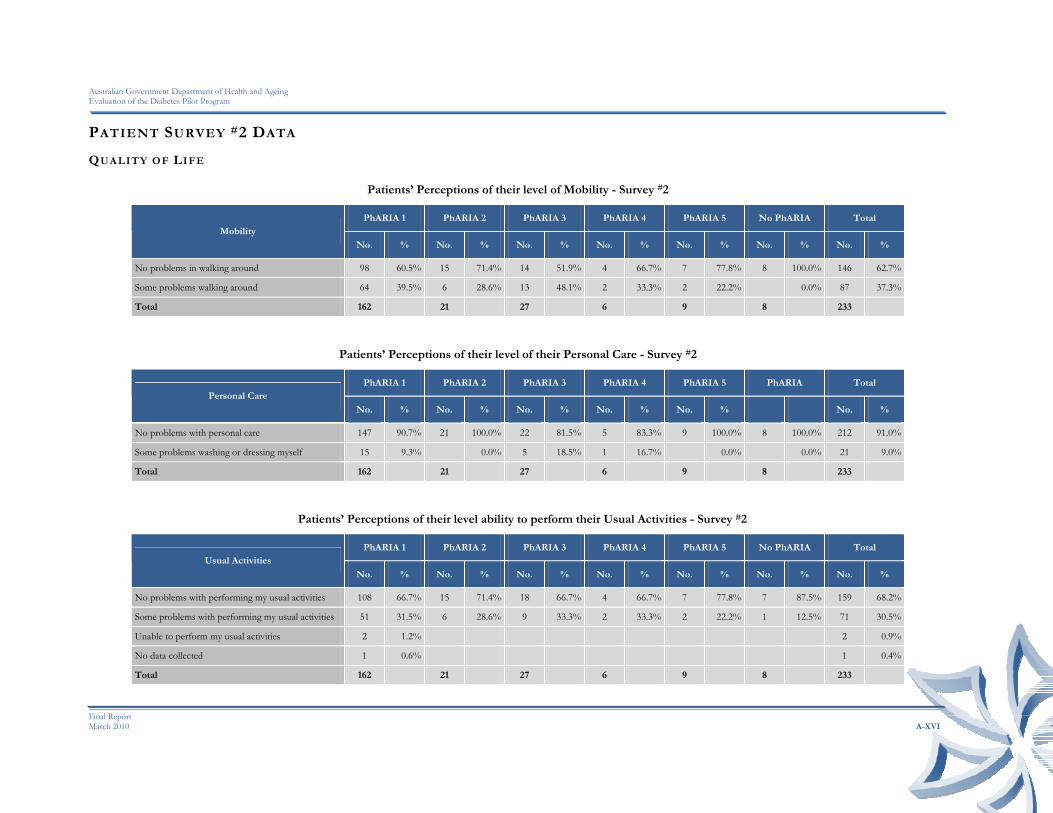
Australian Government Department of Health and Ageing Evaluation of the Diabetes Pilot Program
Final Report March 2010 A-XVI
PATIENT SURVEY #2 DATA
QUALITY OF LIFE
Patients’ Perceptions of their level of Mobility - Survey #2
PhARIA 1 PhARIA 2 PhARIA 3 PhARIA 4 PhARIA 5 No PhARIA Total Mobility
No. % No. % No. % No. % No. % No. % No. %
No problems in walking around 98 60.5% 15 71.4% 14 51.9% 4 66.7% 7 77.8% 8 100.0% 146 62.7%
Some problems walking around 64 39.5% 6 28.6% 13 48.1% 2 33.3% 2 22.2% 0.0% 87 37.3%
Total 162 21 27 6 9 8 233
Patients’ Perceptions of their level of their Personal Care - Survey #2
PhARIA 1 PhARIA 2 PhARIA 3 PhARIA 4 PhARIA 5 PhARIA Total Personal Care
No. % No. % No. % No. % No. % No. %
No problems with personal care 147 90.7% 21 100.0% 22 81.5% 5 83.3% 9 100.0% 8 100.0% 212 91.0%
Some problems washing or dressing myself 15 9.3% 0.0% 5 18.5% 1 16.7% 0.0% 0.0% 21 9.0%
Total 162 21 27 6 9 8 233
Patients’ Perceptions of their level ability to perform their Usual Activities - Survey #2
PhARIA 1 PhARIA 2 PhARIA 3 PhARIA 4 PhARIA 5 No PhARIA Total Usual Activities
No. % No. % No. % No. % No. % No. % No. %
No problems with performing my usual activities 108 66.7% 15 71.4% 18 66.7% 4 66.7% 7 77.8% 7 87.5% 159 68.2%
Some problems with performing my usual activities 51 31.5% 6 28.6% 9 33.3% 2 33.3% 2 22.2% 1 12.5% 71 30.5%
Unable to perform my usual activities 2 1.2% 2 0.9%
No data collected 1 0.6% 1 0.4%
Total 162 21 27 6 9 8 233

Australian Government Department of Health and Ageing Evaluation of the Diabetes Pilot Program
Final Report March 2010 A-XVII
Patients’ Perceptions of their Pain/Discomfort - Survey #2
PhARIA 1 PhARIA 2 PhARIA 3 PhARIA 4 PhARIA 5 No PhARIA Total Usual Activities
No. % No. % No. % No. % No. % No. % No. %
No pain or discomfort 66 40.7% 12 57.1% 8 29.6% 3 50.0% 6 66.7% 6 75.0% 101 43.3%
Moderate pain or discomfort 86 53.1% 9 42.9% 14 51.9% 3 50.0% 3 33.3% 2 25.0% 117 50.2%
Extreme pain or discomfort 10 6.2% 0.0% 5 18.5% 0.0% 0.0% 0.0% 15 6.4%
Total 162 21 27 6 9 8 233
Patients’ Perceptions of their Anxiety/Depression - Survey #2
PhARIA 1 PhARIA 2 PhARIA 3 PhARIA 4 PhARIA 5 No PhARIA Total Usual Activities
No. % No. % No. % No. % No. % No. % No. %
Not anxious or depressed 106 65.4% 16 76.2% 18 66.7% 5 83.3% 7 77.8% 6 75.0% 158 67.8%
Moderately anxious or depressed 52 32.1% 5 23.8% 8 29.6% 1 16.7% 2 22.2% 1 12.5% 69 29.6%
Extremely anxious or depressed 4 2.5% 0.0% 1 3.7% 0.0% 0.0% 1 12.5% 6 2.6%
Total 162 21 27 6 9 8 233
CURRENT HEALTH STATE
Patients’ Perceptions of their Satisfaction with DMAS - Survey #2
PhARIA 1 PhARIA 2 PhARIA 3 PhARIA 4 PhARIA 5 No PhARIA Total Satisfaction with Diabetes Service
No. % No. % No. % No. % No. % No. % No. %
Strongly disagree 1 0.6% 0 0.0% 0 0.0% 0 0.0% 0 0.0% 0 0.0% 1 0.4%
Agree 18 11.1% 2 9.5% 2 7.4% 0 0.0% 1 11.1% 0 0.0% 23 9.9%
Strongly Agree 141 87.0% 19 90.5% 25 92.6% 6 100.0% 8 88.9% 8 100.0% 207 88.8%
No data recorded 2 1.2% 0 0.0% 0 0.0% 0 0.0% 0 0.0% 0 0.0% 2 0.9%
Total 162 21 27 6 9 8 233
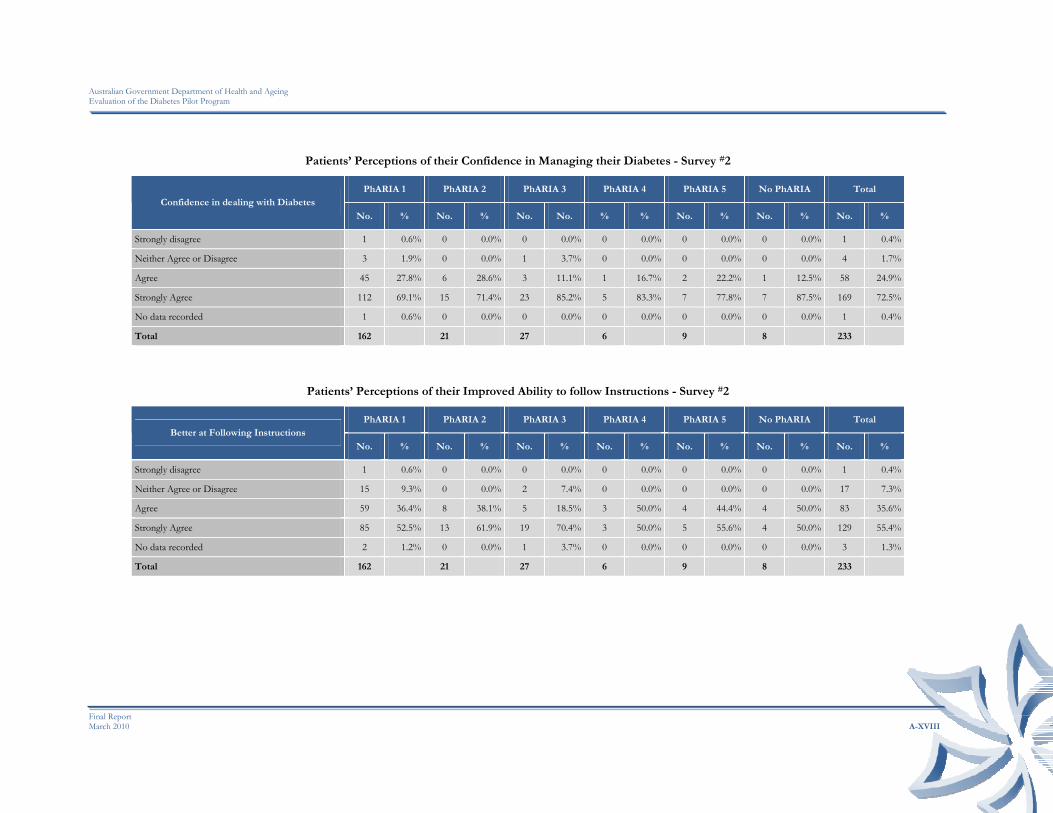
Australian Government Department of Health and Ageing Evaluation of the Diabetes Pilot Program
Final Report March 2010 A-XVIII
Patients’ Perceptions of their Confidence in Managing their Diabetes - Survey #2
PhARIA 1 PhARIA 2 PhARIA 3 PhARIA 4 PhARIA 5 No PhARIA Total Confidence in dealing with Diabetes
No. % No. % No. No. % % No. % No. % No. %
Strongly disagree 1 0.6% 0 0.0% 0 0.0% 0 0.0% 0 0.0% 0 0.0% 1 0.4%
Neither Agree or Disagree 3 1.9% 0 0.0% 1 3.7% 0 0.0% 0 0.0% 0 0.0% 4 1.7%
Agree 45 27.8% 6 28.6% 3 11.1% 1 16.7% 2 22.2% 1 12.5% 58 24.9%
Strongly Agree 112 69.1% 15 71.4% 23 85.2% 5 83.3% 7 77.8% 7 87.5% 169 72.5%
No data recorded 1 0.6% 0 0.0% 0 0.0% 0 0.0% 0 0.0% 0 0.0% 1 0.4%
Total 162 21 27 6 9 8 233
Patients’ Perceptions of their Improved Ability to follow Instructions - Survey #2
PhARIA 1 PhARIA 2 PhARIA 3 PhARIA 4 PhARIA 5 No PhARIA Total Better at Following Instructions
No. % No. % No. % No. % No. % No. % No. %
Strongly disagree 1 0.6% 0 0.0% 0 0.0% 0 0.0% 0 0.0% 0 0.0% 1 0.4%
Neither Agree or Disagree 15 9.3% 0 0.0% 2 7.4% 0 0.0% 0 0.0% 0 0.0% 17 7.3%
Agree 59 36.4% 8 38.1% 5 18.5% 3 50.0% 4 44.4% 4 50.0% 83 35.6%
Strongly Agree 85 52.5% 13 61.9% 19 70.4% 3 50.0% 5 55.6% 4 50.0% 129 55.4%
No data recorded 2 1.2% 0 0.0% 1 3.7% 0 0.0% 0 0.0% 0 0.0% 3 1.3%
Total 162 21 27 6 9 8 233
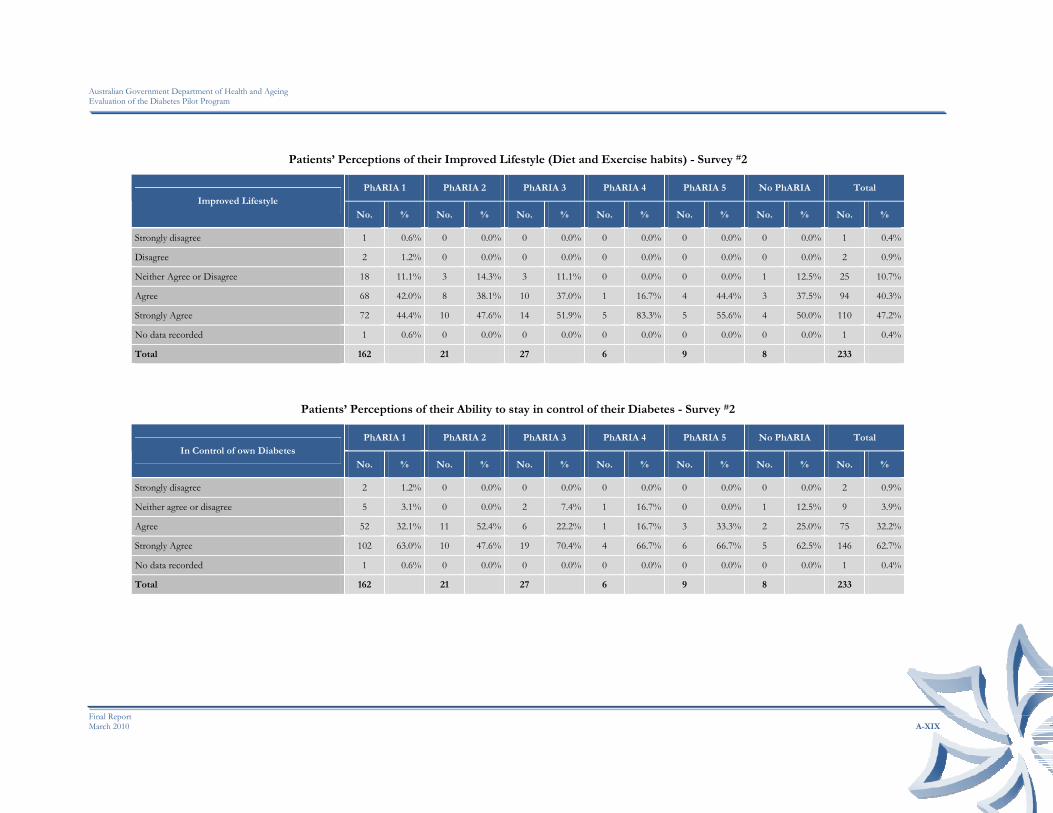
Australian Government Department of Health and Ageing Evaluation of the Diabetes Pilot Program
Final Report March 2010 A-XIX
Patients’ Perceptions of their Improved Lifestyle (Diet and Exercise habits) - Survey #2
PhARIA 1 PhARIA 2 PhARIA 3 PhARIA 4 PhARIA 5 No PhARIA Total Improved Lifestyle
No. % No. % No. % No. % No. % No. % No. %
Strongly disagree 1 0.6% 0 0.0% 0 0.0% 0 0.0% 0 0.0% 0 0.0% 1 0.4%
Disagree 2 1.2% 0 0.0% 0 0.0% 0 0.0% 0 0.0% 0 0.0% 2 0.9%
Neither Agree or Disagree 18 11.1% 3 14.3% 3 11.1% 0 0.0% 0 0.0% 1 12.5% 25 10.7%
Agree 68 42.0% 8 38.1% 10 37.0% 1 16.7% 4 44.4% 3 37.5% 94 40.3%
Strongly Agree 72 44.4% 10 47.6% 14 51.9% 5 83.3% 5 55.6% 4 50.0% 110 47.2%
No data recorded 1 0.6% 0 0.0% 0 0.0% 0 0.0% 0 0.0% 0 0.0% 1 0.4%
Total 162 21 27 6 9 8 233
Patients’ Perceptions of their Ability to stay in control of their Diabetes - Survey #2
PhARIA 1 PhARIA 2 PhARIA 3 PhARIA 4 PhARIA 5 No PhARIA Total In Control of own Diabetes
No. % No. % No. % No. % No. % No. % No. %
Strongly disagree 2 1.2% 0 0.0% 0 0.0% 0 0.0% 0 0.0% 0 0.0% 2 0.9%
Neither agree or disagree 5 3.1% 0 0.0% 2 7.4% 1 16.7% 0 0.0% 1 12.5% 9 3.9%
Agree 52 32.1% 11 52.4% 6 22.2% 1 16.7% 3 33.3% 2 25.0% 75 32.2%
Strongly Agree 102 63.0% 10 47.6% 19 70.4% 4 66.7% 6 66.7% 5 62.5% 146 62.7%
No data recorded 1 0.6% 0 0.0% 0 0.0% 0 0.0% 0 0.0% 0 0.0% 1 0.4%
Total 162 21 27 6 9 8 233

Australian Government Department of Health and Ageing Evaluation of the Diabetes Pilot Program
Final Report March 2010 A-XX
Patients’ Perceptions of receiving the DMAS in the Pharmacy - Survey #2
PhARIA 1 PhARIA 2 PhARIA 3 PhARIA 4 PhARIA 5 No PhARIA Total At ease with Pharmacy Providing Service
No. % No. % No. % No. % No. % No. % No. %
Strongly disagree 2 1.2% 0 0.0% 0 0.0% 0 0.0% 0 0.0% 0 0.0% 2 0.9%
Neither agree or disagree 1 0.6% 0 0.0% 0 0.0% 0 0.0% 0 0.0% 0 0.0% 1 0.4%
Agree 28 17.3% 5 23.8% 3 11.1% 2 33.3% 2 22.2% 1 12.5% 41 17.6%
Strongly Agree 129 79.6% 16 76.2% 24 88.9% 4 66.7% 7 77.8% 7 87.5% 187 80.3%
No data recorded 2 1.2% 0 0.0% 0 0.0% 0 0.0% 0 0.0% 0 0.0% 2 0.9%
Total 162 21 27 6 9 8 233
Patients’ Perceptions of their Overall Health Improvement - Survey #2
PhARIA 1 PhARIA 2 PhARIA 3 PhARIA 4 PhARIA 5 No PhARIA Total Overall Health Improvement
No. % No. % No. % No. % No. % No. % No. %
Strongly disagree 1 0.6% 0 0.0% 0 0.0% 0 0.0% 0 0.0% 0 0.0% 1 0.4%
Disagree 2 1.2% 0 0.0% 0 0.0% 0 0.0% 0 0.0% 0 0.0% 2 0.9%
Neither Agree or Disagree 23 14.2% 3 14.3% 2 7.4% 1 16.7% 0 0.0% 1 12.5% 30 12.9%
Agree 74 45.7% 9 42.9% 12 44.4% 1 16.7% 2 22.2% 3 37.5% 101 43.3%
Strongly Agree 59 36.4% 8 38.1% 13 48.1% 4 66.7% 7 77.8% 4 50.0% 95 40.8%
No data recorded 3 1.9% 1 4.8% 0 0.0% 0 0.0% 0 0.0% 0 0.0% 4 1.7%
Total 162 21 27 6 9 8 233

Australian Government Department of Health and Ageing Evaluation of the Diabetes Pilot Program
Final Report March 2010 A-XXI
Patients’ Perceptions of their Ability to better Manage their Diabetes - Survey #2
PhARIA 1 PhARIA 2 PhARIA 3 PhARIA 4 PhARIA 5 No PhARIA Total Diabetes Management
No. % No. % No. % No. % No. % No. % No. %
Strongly disagree 1 0.6% 0 0.0% 0 0.0% 0 0.0% 0 0.0% 0 0.0% 1 0.4%
Disagree 0 0.0% 0 0.0% 0 0.0% 1 16.7% 0 0.0% 0 0.0% 1 0.4%
Neither Agree or Disagree 10 6.2% 1 4.8% 4 14.8% 0 0.0% 0 0.0% 1 12.5% 16 6.9%
Agree 72 44.4% 8 38.1% 8 29.6% 2 33.3% 2 22.2% 3 37.5% 95 40.8%
Strongly Agree 78 48.1% 12 57.1% 15 55.6% 3 50.0% 7 77.8% 4 50.0% 119 51.1%
No data recorded 1 0.6% 0 0.0% 0 0.0% 0 0.0% 0 0.0% 0 0.0% 1 0.4%
Total 162 21 27 6 9 8 233
USEFULNESS OF DMAS
Patient-identified Useful Elements DMAS - Survey #2
PhARIA 1 (162) PhARIA 2 (21) PhARIA 3 (27) PhARIA 4 (6) PhARIA 5 (9) No PhARIA (8) Total (233) Usefulness of Diabetes Service
No. % No. % No. % No. % No. % No. % No. %
Blood Glucose Review 133 82.1% 14 66.7% 19 70.4% 5 83.3% 8 88.9% 6 75.0% 185 79.4%
Learning about Diabetes 107 66.0% 12 57.1% 16 59.3% 4 66.7% 8 88.9% 5 62.5% 152 65.2%
Follow-up Check Reminder 54 33.3% 8 38.1% 13 48.1% 0 0.0% 5 55.6% 3 37.5% 83 35.6%
Referrals to Health Care Professionals 49 30.2% 8 38.1% 7 25.9% 0 0.0% 3 33.3% 3 37.5% 70 30.0%
General Support 125 77.2% 19 90.5% 21 77.8% 5 83.3% 6 66.7% 7 87.5% 183 78.5%
Improved Relationship with Pharmacist 91 56.2% 16 76.2% 18 66.7% 3 50.0% 6 66.7% 7 87.5% 141 60.5%
Ability to View Results 106 65.4% 14 66.7% 20 74.1% 1 16.7% 8 88.9% 6 75.0% 155 66.5%
Other 14 8.6% 1 4.8% 3 11.1% 1 16.7% 2 22.2% 2 25.0% 23 9.9%

Australian Government Department of Health and Ageing Evaluation of the Diabetes Pilot Program
Final Report March 2010 A-XXII
KEY BENEFITS
Realised Key Benefits for Patients taking part in DMAS – Survey #2
PhARIA 1 (162) PhARIA 2 (21) PhARIA 3 (27) PhARIA 4 (6) PhARIA 5 (9) No PhARIA (8) Total (233) Key Benefits
No. % No. % No. % No. % No. % No. % No. %
Extra Support 126 77.8% 17 81.0% 25 92.6% 6 100.0% 8 88.9% 8 100.0% 190 81.5%
Complementary to Current Services 94 58.0% 11 52.4% 18 66.7% 2 33.3% 3 33.3% 7 87.5% 135 57.9%
Medication Management 86 53.1% 10 47.6% 13 48.1% 2 33.3% 7 77.8% 6 75.0% 124 53.2%
Improved Lifestyle 99 61.1% 15 71.4% 14 51.9% 3 50.0% 8 88.9% 4 50.0% 143 61.4%
Other 15 9.3% 1 4.8% 2 7.4% 0 0.0% 1 11.1% 1 12.5% 20 8.6%
WILLINGNESS TO PAY
Patient Willingness to Pay for DMAS - Survey #2
PhARIA 1 (162) PhARIA 2 (21) PhARIA 3 (27) PhARIA 4 (6) PhARIA 5 (9) No PhARIA (8) Total (233) Price Per Consultation
No. % No. % No. % No. % No. % No. % No. %
2.75 34 21.0% 6 28.6% 5 18.5% 1 16.7% 0 0.0% 1 12.5% 47 20.2%
5.00 55 34.0% 9 42.9% 12 44.4% 3 50.0% 5 55.6% 6 75.0% 90 38.6%
10.00 45 27.8% 3 14.3% 3 11.1% 0 0.0% 2 22.2% 1 12.5% 54 23.2%
More than $10 18 11.1% 1 4.8% 5 18.5% 1 16.7% 2 22.2% 0 0.0% 27 11.6%
Not willing to pay 8 4.9% 1 4.8% 1 3.7% 1 16.7% 0 0.0% 0 0.0% 11 4.7%
Not recorded 2 1.2% 1 4.8% 1 3.7% 0 0.0% 0 0.0% 0 0.0% 4 1.7%
Total 162 21 27 6 9 8 233