australian cerebral palsy register report
TRANSCRIPT

AUSTRALIAN CEREBRAL PALSY REGISTER REPORT 2016

The ACPR Group consists of representatives from each state and territory register.
Australian Capital Territory and New South Wales Nadia Badawi, Isabelle Balde, Shona Goldsmith, Petra Karlsson, Sarah McIntyre, Iona Novak, Paul Novak and Hayley Smithers-Sheedy
Northern Territory Keith Edwards, Rebecca Jarman
Queensland Michael deLacy, Christalla Louca
South Australia Catherine Gibson, Rosie Rice, Heather Scott
Tasmania Kirsty Bartlett-Clark, Eliza Maloney, Madeline Rowell, Robyn Sheppard, Hayley Smithers-Sheedy and Lyndsay Quamby
Victoria Elaine Meehan, Dinah Reddihough and Sue Reid
Western Australia Eve Blair, Noula Gibson, Sarah Love and Linda Watson
AUTHORS
THE AUSTRALIAN CEREBRAL PALSY REGISTER GROUP
Australian Cerebral Palsy Register Group and visiting scholars, March 2016
AUSTRALIAN CEREBRAL PALSY REGISTER REPORT 20162

3AUSTRALIAN CEREBRAL PALSY REGISTER REPORT 2016
The Australian Cerebral Palsy Register (ACPR) Group sincerely thanks all the families and health professionals involved in this Australia wide effort. In these endeavours, we aim to collect the most accurate and complete data possible to monitor cerebral palsy (CP) in Australia, identify causal pathways, evaluate preventative strategies and evaluate management options for those with CP and their families.
The ACPR Group acknowledges and thanks:
• Mr Rob White CEO for his vision and commitment to the work of the ACPR;
• Dr Hayley Smithers-Sheedy and Dr Sarah McIntyre for developing, coordinating and writing this report;
• Mrs Marelle Thornton AM and Mrs Shona Goldsmith for their expert editing;
• Mrs Renee Price for her tireless work on the design and publishing of the report;
• Mr Paul Novak for his contribution to the smooth running of the ACPR web-based infrastructure;
• Macquarie Group Foundation for their printing sponsorship of this report; and
• Colonial First State for their generous support of the Australian Cerebral Palsy Register.
The staff at the Cerebral Palsy Alliance Research Institute would like to thank all members of the ACPR Policy Group for their expertise, time and commitment shown over the last twelve months while uploading data, attending meetings, participating in working groups and writing this report. The ACPR exists as a result of collaborative partnerships between all the Australian state and territory CP registers, and the organisations which support each register.
ACKNOWLEDGEMENTS
• Australian Capital Territory and New South Wales Cerebral Palsy Registers – Cerebral Palsy Alliance, University of Sydney
• Northern Territory Cerebral Palsy Register – Centre for Disease Control
• Queensland Cerebral Palsy Register – CPL – Choice, Passion, Life and Queensland Department of Communities, Child Safety and Disability Services
• South Australian Cerebral Palsy Register – Women’s and Children’s Health Network
• Tasmanian Cerebral Palsy Register – St Giles
• Victorian Cerebral Palsy Register – Murdoch Childrens Research Institute, Royal Children’s Hospital, Melbourne
• Western Australian Register of Developmental Anomalies – Cerebral Palsy – Department of Health WA
The contributing registers and their organisations are as follows:


5AUSTRALIAN CEREBRAL PALSY REGISTER REPORT 2016
I am honoured to write the foreword for the third report of the Australian Cerebral Palsy Register. Cerebral palsy is the most common cause of physical disability in early childhood, occurring in about two babies per 1000 live births. It is an umbrella term that encompasses a diverse group of disorders resulting from damage to the developing brain either during pregnancy or shortly after birth. Cerebral palsy is a non-progressive, but permanent condition that has lifelong consequences for individuals with cerebral palsy and their families.
Although some of the causes and risk factors for cerebral palsy are known, such as preterm birth and congenital anomalies, many are not. The relatively uncommon occurrence of cerebral palsy, its multiple presentations and diverse causal pathways, make it a complex condition to study and to target intervention. Furthermore, in order to monitor prevalence rates and evaluate prevention and treatment strategies, especially within different subgroups, it is necessary to study large populations of patients. Such challenges make registers a vital piece of the jigsaw in improving the health outcomes for those with cerebral palsy.
Australia has a proud history of cerebral palsy registries, with the first jurisdictional registry established by Fiona Stanley in Western Australia in 1975. Other registries followed in Australia, notably in Victoria and South Australia, with the national Australian Cerebral Palsy Register introduced in 2008. Cerebral palsy registries provide a number of important functions including monitoring trends, research, prevention, education and resource planning. They are used to provide accurate advice to patients, to improve care pathways, to prospectively identify patients eligible for clinical trials and to retrospectively analyse the effectiveness of interventions. Whether from a single cerebral palsy register or from a network of registries – such as the Australian Cerebral Palsy Register – the data are an excellent resource for informing health professionals, policy makers and those living with cerebral palsy. Indeed, the power of cerebral palsy register research is exemplified by the recent publication of a number of wide-ranging studies from the Australian cerebral palsy registries1.
As information technology and methods for linking and transferring information between different data collections evolve, so too do the challenges and opportunities for cerebral palsy registries. The challenges relate to harmonising data between registries and considerations around sharing data. However, the opportunities far outweigh the challenges. Larger data sets with more cases and richer information on antecedents and long-term follow up of persons with cerebral palsy provide exciting possibilities for realising the full potential of cerebral palsy registries in the future. This so called ‘big data’ approach to research enables new questions to be tackled using large-scale data that span the biomedical, clinical, health services and public health domains. Such an approach facilitates specific subgroup analysis which is a necessity for our understanding of cerebral palsy.
I congratulate the Australian Cerebral Palsy Register on this excellent report. It represents a shared collaboration across the country reflecting the foresight of those in 2008 who developed the Australian Cerebral Palsy Register. I also wish to thank the many families, persons with cerebral palsy and health professionals who have made this report possible.
Associate Professor Georgina Chambers Director, National Perinatal Epidemiology and Statistics Unit
FOREWORD

7AUSTRALIAN CEREBRAL PALSY REGISTER REPORT 2016
EXECUTIVE SUMMARY
The Australian Cerebral Palsy Register (ACPR) was established in 2008 as a research database to facilitate the study of the distribution, frequency and severity of CP; the causes and determinants of CP; the effectiveness of prevention strategies and to help plan and evaluate services. The ACPR contains a deidentified copy of data that have been securely uploaded from each of the state and territory CP registers.
This is the third report of combined data from the ACPR Group. This year, the report contains a number of new analyses that have been made possible due to the availability of denominator data provided by our colleagues at the National Perinatal Epidemiology and Statistics Unit. This new data has provided opportunities for the ACPR Group to begin to explore rates and trends in the CP population over time. Another addition to this report is a new section describing the two recently established CP registers in Bangladesh and New Zealand that commenced active recruitment in 2015. These CP registers are affiliated with the ACPR and utilise the same infrastructure and minimum data set. The ACPR Group looks forward to continuing our collaboration with the talented researchers from these registers and to the inclusion of new data from these registers in future reports.
This 2016 report comprises data uploaded in October 2015 for the 1993-2009 birth years. Any children notified to state/territory registers after this date were not included in the report. This report contains a total of 7241 records of children with CP reported from all states and territories of Australia. This includes data provided by the three long-standing registers from South Australia (established in 1998), Victoria (1980) and Western Australia (1979) which have good ascertainment and are believed to have registered all eligible children in their respective jurisdictions. Data from these CP Registers have been selected for any calculations pertaining to rates of CP. Since the last report two of the more recently established CP registers, Queensland and the Northern Territory reached the minimum ACPR ascertainment requirement of 1.5 children with CP per 1000 live births excluding those with a known post-neonatal cause. Despite these excellent advances, the researchers from these registers report that they believe they remain under-ascertained.
In this birth cohort (1993-2009) there were 3892 children with CP registered on the three long-standing CP registers (South Australia, Victoria and Western Australia). This cerebral palsy cohort included 5.9% of children who had a recognised post-neonatal brain injury acquired more than 28 days after birth. The predominant post-neonatal cause of CP was cardiovascular accident either spontaneous, or associated with surgery or with cardiac complications.
For the remaining cohort (94.1%), the brain injury responsible for CP is believed to have occurred during the prenatal and perinatal period of infant development.
• After a long period of stable prevalence at around 2-2.5/1000, the rate of CP per 1000 live births declined to 1.4-2.1/1000 in the 2007-2009 period, p22,23.
• Over the 1993-2009 period the rate of CP per 1000 live births reduced across all gestational age groups, p29.
• In contrast to the Australian population where 7.2% of live births in this period were born preterm (<37 weeks), 43% of children with CP were born preterm, p29.
• The decline in CP prevalence for children born at 20-27 weeks observed in the previous two triennia (2001-2003 and 2004-2006) did not continue in the most recent triennium (2007-2009) where a slight increase in rates of CP per 1000 live births was observed, p29.
• Amongst children born preterm, the rate of CP per 1000 neonatal survivors shows no shared trend across all jurisdictions, notably in the last triennium (2007-2009), p30,31.
• The declining rate of CP for children born as a twin or higher multiple has plateaued in this last triennium (2007-2009), p39.
• Males were found to be at higher risk of developing cerebral palsy. 57% of the cohort was male compared to 51% of the Australian population born during this period, p26.
• Rates of CP per 1000 live births have improved for all maternal age groups except for mothers <20 years which have remained stable over the 14 years reported, p28.
The following key findings pertain to this pre/perinatally acquired CP cohort:


9AUSTRALIAN CEREBRAL PALSY REGISTER REPORT 2016
INDEX
Authors .. . . . . . . . . . . . . . . . . . . . . . . . . . . . . . . . . . . . . . . . . . . . . . . . . . . . . . . . . . . . . . . . . . . . . . . . . . . . . . . 2
Acknowledgements .. . . . . . . . . . . . . . . . . . . . . . . . . . . . . . . . . . . . . . . . . . . . . . . . . . . . . . . . . . . . . 3
Foreword .. . . . . . . . . . . . . . . . . . . . . . . . . . . . . . . . . . . . . . . . . . . . . . . . . . . . . . . . . . . . . . . . . . . . . . . . . . . . . 5
Executive summary .. . . . . . . . . . . . . . . . . . . . . . . . . . . . . . . . . . . . . . . . . . . . . . . . . . . . . . . . . . . . . 7
About Cerebral Palsy .. . . . . . . . . . . . . . . . . . . . . . . . . . . . . . . . . . . . . . . . . . . . . . . . . . . . . . . . . 10
What is the Australian Cerebral Palsy Register? .. . . . . . . . . . . . . . . . 11
Aims of the ACPR ... . . . . . . . . . . . . . . . . . . . . . . . . . . . . . . . . . . . . . . . . . . . . . . . . . . . . . . . . . . . 12
Methods .. . . . . . . . . . . . . . . . . . . . . . . . . . . . . . . . . . . . . . . . . . . . . . . . . . . . . . . . . . . . . . . . . . . . . . . . . . . . 13
Results: .. . . . . . . . . . . . . . . . . . . . . . . . . . . . . . . . . . . . . . . . . . . . . . . . . . . . . . . . . . . . . . . . . . . . . . . . . . . . . 15
1. All cerebral palsy .. . . . . . . . . . . . . . . . . . . . . . . . . . . . . . . . . . . . . . . . . . . . . . . . . . . . . . . . . . . 15
All children with cerebral palsy .. . . . . . . . . . . . . . . . . . . . . . . . . . . . . . . . . . . . . 16
Indigenous status of mother .. . . . . . . . . . . . . . . . . . . . . . . . . . . . . . . . . . . . . . . . . .18
2. Prenatally or perinatally acquired cerebral palsy .. . . . . . . . . . .20
Prevalence .. . . . . . . . . . . . . . . . . . . . . . . . . . . . . . . . . . . . . . . . . . . . . . . . . . . . . . . . . . . . . . . . . . . . 22
Timing of initial cerebral palsy description .. . . . . . . . . . . . . . . . . . . . 25
Sex .. . . . . . . . . . . . . . . . . . . . . . . . . . . . . . . . . . . . . . . . . . . . . . . . . . . . . . . . . . . . . . . . . . . . . . . . . . . . . . . .26
Maternal age at time of delivery .. . . . . . . . . . . . . . . . . . . . . . . . . . . . . . . . . . . .28
Gestational age at delivery .. . . . . . . . . . . . . . . . . . . . . . . . . . . . . . . . . . . . . . . . . . . .29
Birth weight .. . . . . . . . . . . . . . . . . . . . . . . . . . . . . . . . . . . . . . . . . . . . . . . . . . . . . . . . . . . . . . . . . . 32
Plurality .. . . . . . . . . . . . . . . . . . . . . . . . . . . . . . . . . . . . . . . . . . . . . . . . . . . . . . . . . . . . . . . . . . . . . . . . .38
Predominant motor type .. . . . . . . . . . . . . . . . . . . . . . . . . . . . . . . . . . . . . . . . . . . . . . 40
Gross motor function .. . . . . . . . . . . . . . . . . . . . . . . . . . . . . . . . . . . . . . . . . . . . . . . . . . . .45
Congenital anomalies .. . . . . . . . . . . . . . . . . . . . . . . . . . . . . . . . . . . . . . . . . . . . . . . . . . . 48
Associated impairments .. . . . . . . . . . . . . . . . . . . . . . . . . . . . . . . . . . . . . . . . . . . . . . . .50
Vision .. . . . . . . . . . . . . . . . . . . . . . . . . . . . . . . . . . . . . . . . . . . . . . . . . . . . . . . . . . . . . . . . . . . . . . .50
Hearing .. . . . . . . . . . . . . . . . . . . . . . . . . . . . . . . . . . . . . . . . . . . . . . . . . . . . . . . . . . . . . . . . . . . . 51
Speech ... . . . . . . . . . . . . . . . . . . . . . . . . . . . . . . . . . . . . . . . . . . . . . . . . . . . . . . . . . . . . . . . . . . 51
Epilepsy .. . . . . . . . . . . . . . . . . . . . . . . . . . . . . . . . . . . . . . . . . . . . . . . . . . . . . . . . . . . . . . . . . . . 52
Intellectual impairment .. . . . . . . . . . . . . . . . . . . . . . . . . . . . . . . . . . . . . . . . . . . . 52
3. Post-neonatally acquired cerebral palsy .. . . . . . . . . . . . . . . . . . . . . . . .54
Prevalence .. . . . . . . . . . . . . . . . . . . . . . . . . . . . . . . . . . . . . . . . . . . . . . . . . . . . . . . . . . . . . . . . . . . .56
Post-neonatal cause .. . . . . . . . . . . . . . . . . . . . . . . . . . . . . . . . . . . . . . . . . . . . . . . . . . . . . .56
Sex .. . . . . . . . . . . . . . . . . . . . . . . . . . . . . . . . . . . . . . . . . . . . . . . . . . . . . . . . . . . . . . . . . . . . . . . . . . . . . . . . 57
Maternal age at time of delivery .. . . . . . . . . . . . . . . . . . . . . . . . . . . . . . . . . . . . 57
Predominant motor type and topography .. . . . . . . . . . . . . . . . . . . . . .58
Associated impairments .. . . . . . . . . . . . . . . . . . . . . . . . . . . . . . . . . . . . . . . . . . . . . . . .59
4. Affiliated Cerebral Palsy Registers .. . . . . . . . . . . . . . . . . . . . . . . . . . . . . . . . 61
The New Zealand Cerebral Palsy Register .. . . . . . . . . . . . . . . . . . . . . 62
The Bangladesh Cerebral Palsy Register .. . . . . . . . . . . . . . . . . . . . . . .63
Appendix A .. . . . . . . . . . . . . . . . . . . . . . . . . . . . . . . . . . . . . . . . . . . . . . . . . . . . . . . . . . . . . . . . . . . . . . . .65
Information and contact details from contributing registers .. . . . . . . . . . . . . . . . . . . . . . . . . . . . . . . . . . . . . . . . . . . . . . . . . . . . . . . . . . . . . . . . . . . . . . . .65
Appendix B ... . . . . . . . . . . . . . . . . . . . . . . . . . . . . . . . . . . . . . . . . . . . . . . . . . . . . . . . . . . . . . . . . . . . . .70
CP Description Form and Australian Spasticity Assessment Scale23
.. . . . . . . . . . . . . . . . . . . . . . . . . . . . . . . . . . . . . . . . . . . . . . . . . . . . . . .70
Appendix C .. . . . . . . . . . . . . . . . . . . . . . . . . . . . . . . . . . . . . . . . . . . . . . . . . . . . . . . . . . . . . . . . . . . . . . . . 72
References generated by registers in Australia (January 2013 – June 2016)... . . . . . . . . . . . . . . . . . . . . . . . . . . . . . . . . . . . . . . . 72
Appendix D ... . . . . . . . . . . . . . . . . . . . . . . . . . . . . . . . . . . . . . . . . . . . . . . . . . . . . . . . . . . . . . . . . . . . . . 75
Minimum data set at time of data provision .. . . . . . . . . . . . . . . . . . 75
References .. . . . . . . . . . . . . . . . . . . . . . . . . . . . . . . . . . . . . . . . . . . . . . . . . . . . . . . . . . . . . . . . . . . . . . . . 77

AUSTRALIAN CEREBRAL PALSY REGISTER REPORT 201610
Both internationally and in Australia, CP registers draw on a range of references and perspectives when considering the definition which best suits their purposes2. The ACPR has adopted the approach used by the Surveillance of Cerebral Palsy in Europe (SCPE)3, allowing the use of any definition that includes the following five key elements common to the definitions published by Bax4, Rosenbaum5 and Mutch.6
CP:
(1) is an umbrella term for a group of disorders
(2) is a condition that is permanent but not unchanging
(3) involves a disorder of movement and/or posture and of motor function
(4) is due to a non-progressive interference, lesion or abnormality, and
(5) the interference, lesion or abnormality originates in the immature brain3
For the majority of individuals with CP the complete causal pathway to brain injury is not well understood. CP is associated with numerous perinatal factors, e.g., congenital infections, birth defects, preterm birth, intrauterine growth restriction, sentinel events and multiple pregnancy and with post-neonatal factors such as head trauma or cerebral infections7.
The motor impairments of CP are classified into four main subtypes: spastic, dyskinetic, ataxic and hypotonic. Individuals with spasticity may exhibit increased deep tendon reflexes, weakness, abnormal gait and posture8. Individuals with dyskinetic CP may have dystonic, athetoid or choreathetoid movement patterns including involuntary, uncontrolled, recurring, occasionally stereotyped movements and fluctuating muscle tone9. Ataxic CP is characterised by problems with balance and depth perception and loss of coordination, so that movements are poorly organized in terms of force, rhythm and accuracy9. Hypotonic CP, where an individual has diminished muscle tone without other signs of motor impairment is the least common form of CP10. A proportion of individuals with CP exhibit mixed motor types, e.g., a predominantly spastic motor pattern with dyskinesia.
Among individuals with CP, the severity of the physical disability/gross motor impairment ranges from minimal to profound, and the complexity of the condition can be increased by the co-occurrence of associated impairments11,12. The likelihood and severity of associated impairments increase with the severity of motor impairment13-16. Many individuals with CP will have more than one associated impairment, and their presence can complicate therapy and decrease quality of life for the individual and their family, and increase costs for the family and to society12.
Estimates of the prevalence of CP throughout the world vary depending on the methodology of “count”, percentage ascertained and variations in selection criteria17. CP registers have identified rates ranging between 1.4-2.77/1000 live births; surveillance programs range between 2.1-3.6/1000 live births; and cross-sectional surveys range between 1.05 and 4.1/1000 live births12. The two largest data sets, the ACPR and the SCPE both have an overall birth prevalence of approximately 2/1000 live births and a recent meta-analysis reported 2.11/100 live births17. Although CP is found in all socioeconomic groups, since low birthweight is associated with low socio-economic status (SES) and CP is strongly associated with low birth weight, it can be anticipated that there would be an association between CP and low SES. However even in the normal birth weight ranges, rates of CP are 2.42/1000 live births for those in the lowest socio-economic groups, compared to 1.29/1000 for the most affluent groups18,19.
ABOUT CEREBRAL PALSY
For further information about the ACPR and a recent suite of papers from the ACPR Group please see, Smithers-Sheedy H, McIntyre S, Gibson C, Meehan E, Scott H, Goldsmith S, et al. A special supplement: findings from the Australian Cerebral Palsy Register, birth years 1993 to 2006. Dev Med Child Neurol. 2016;58 Suppl 2:5-10.

QUEENSLAND20.1%
NEW SOUTH WALES32%
SOUTH AUSTRALIA
7.2%
NORTHERN TERRITORY
1.0%
WESTERN AUSTRALIA
10.9%
AUSTRALIAN CAPITAL
TERRITORY 1.6%
TASMANIA 2.2%
VICTORIA 25%
11AUSTRALIAN CEREBRAL PALSY REGISTER REPORT 2016
The Australian Cerebral Palsy Register (ACPR) is an electronic database of data uploaded from the CP registers in each state and territory of Australia, from which individual identifiers have been removed and replaced by a unique code in order to ensure privacy of data.
The ACPR exists as a result of collaborative partnerships between all Australian state and territory CP registers, and the organisations which support each register. The contributing registers and their organisations are as follows:
• Australian Capital Territory (ACT) and New South Wales Cerebral Palsy Register (NSW)
Cerebral Palsy Alliance Research Institute
• Northern Territory (NT) Cerebral Palsy Register
Centre for Disease Control
• Queensland (QLD) Cerebral Palsy Register
CPL - Choice, Passion, Life and Queensland Department of Communities, Child Safety and Disability Services
• The South Australian (SA) Cerebral Palsy Register
Women’s and Children’s Health Network
• Tasmanian (Tas) Cerebral Palsy Register
Cerebral Palsy Alliance and St Giles
• Victorian (Vic) Cerebral Palsy Register
Murdoch Childrens Research Institute, Royal Children’s Hospital, Melbourne
• Western Australian (WA) Register of Developmental Anomalies – Cerebral Palsy
Department of Health WA
A map showing the states and territories and the percentage of total population has been provided below. Australia has a total population of approximately 23.7 million people20 with the bulk of the population living along the eastern seaboard.
Population proportions for the States and Territories of Australia20
WHAT IS THE AUSTRALIAN CEREBRAL PALSY REGISTER?
For a more detailed description of each of the state and territory CP registers, including contact details, please see Appendix A.

AUSTRALIAN CEREBRAL PALSY REGISTER REPORT 201612
The overarching vision for the ACPR is that the register should be used to assist in efforts both to reduce the incidence of CP and significantly enhance the quality of life of those living with CP.
Specifically, the aim for the ACPR is to be a source of data that will support research relating to:
a) monitoring of CP
b) identifying interventions that effectively improve quality of life
c) identifying causal pathways to enable prevention
d) evaluating future preventative strategies.
The ACPR Research and Policy Group includes a representative from each state and territory CP register. This group is able to provide consultation to researchers who are seeking advice regarding CP research and accessing identified and non-identified CP register data within Australia. For further information please contact: [email protected]
Ethics
Contribution of data to the ACPR has been approved by the relevant Human Research Ethics Committee (HREC) overseeing each state and territory register. Additionally, both the management of ACPR data and the activities of, and work related to the ACPR are reviewed regularly by the Cerebral Palsy Alliance Human Research Ethics Committee (EC00402), a National Health and Medical Research Council approved HREC.
The Cerebral Palsy Alliance Research Institute, University of Sydney is the custodian organisation for the ACPR. Both the Research Institute and the ACPR are funded by Cerebral Palsy Alliance Research Foundation which is a wholly owned company of Cerebral Palsy Alliance.
Use of CP Register data
One of the important functions of both the state/territory and Australian CP registers is to act as a source of information about CP. Staff and researchers from CP registers respond to frequent enquiries from researchers, members of the public, university students, individuals with CP and their families, service providers and government agencies about CP, the epidemiology of CP in their geographic area and available services.
Current projects
In addition to their state and territory register responsibilities, ACPR Policy Group members have worked and continue to work with their national and international colleagues on a number of projects including:
• The contribution of papers and participation in the World CP Registers, Surveys and Networks Day, part of the 5th International Cerebral Palsy Conference, Sweden, 2016
• A collaborative research study with researchers from the Surveillance of Cerebral Palsy in Europe to investigate the contribution of higher multiple births to CP
• A collaborative research study with researchers from the Surveillance of Cerebral Palsy in Europe to further investigate the role of congenital anomalies as a risk factor for CP
• Completion of a data linkage to support the evaluation of long-term outcome measures for the ACTOMgS04 trial
• A collaboration with researchers from the School of Medicine, Discipline of Pediatrics and Adolescent Health and the Marie Bashir Institute of Infectious Disease and Biosecurity, University of Sydney to investigate the prevalence of congenital cytomegalovirus amongst CP registrants
• The support of other research groups internationally to establish new CP registers including the Bangladesh Cerebral Palsy Register (BCPR) and the New Zealand Cerebral Palsy Register (NZCPR) see section 4
• Ongoing member/support of the Impact for CP network https://impact.cerebralpalsy.org.au/ in relation to the Cerebral Palsy Register and Surveillance Research Cluster.
The work of CP registers in Australia has added to our understanding of CP and contributed significantly to research in this field. Please see Appendix C for a list of publications that have been generated by state and territory CP registers in Australia since the publication of the 2013 ACPR report.
AIMS OF THE ACPR

13AUSTRALIAN CEREBRAL PALSY REGISTER REPORT 2016
Cohort
The cohort selected for this report was born 1993-2009. In order to ensure that duplicate records were not included in the dataset, each state and territory group contributed only records of children that were born in their state or territory within this time frame. A de-duplication algorithm designed to highlight potential duplicates was run also as a further measure to avoid reporting duplications.
Inclusion/exclusion criteria
In order to be included in the dataset, a case must fulfil the criteria contained in the five definitional elements3 as outlined earlier. Contributing registers consider a child’s record to be confirmed / verified when the individual reaches 5 years of age. In the event that new information becomes available the child’s record may be updated, which may involve inclusion or exclusion. Records of children who have been described by a suitably qualified health professional to have met the criteria for CP but who die prior to 5 years of age continue to be included in the registers.
Denominator data
Data on live births for the years 1993-2009 (the denominator) were obtained from the National Perinatal Epidemiology and Statistics Unit.
Reporting of numerator data
Case ascertainment varies between states and territories, reflecting differences in both the time of establishment and the governance and consent requirements of each register (see description of CP Registers in Appendix A). Three states of Australia - Western Australia, Victoria and South Australia have long established CP registers. These CP registers are believed to have registered all (or very nearly all) eligible persons and have been selected for any calculations pertaining to rates of CP. CP registers that have been established more recently in the Australian Capital Territory, New South Wales, Northern Territory, Queensland and Tasmania are also included in this report. The ascertainment rates of these registers are increasing rapidly; however, these groups are aware that they are currently under-ascertained. In regards to missing data, where more than 20% of data is missing or unknown, this data has been reported in data tables only and has not been included in calculations of combined data. Trends were analysed by χ2 for trend (Epi Info 7, Centers for Disease Control and Prevention, Atlanta, GA, USA).
Results
The results of this report have been divided into four sections. Section 1 reports on all CP cases not differentiated by timing of brain injury, Section 2 refers to CP arising from an injury to the developing brain during the pre/perinatal period (throughout pregnancy and the first 28 completed days after birth) and Section 3 refers to CP where a known post-neonatal cause (occurring after 28 days of life and before 2 years of age) has been identified. The results have been presented in this format as the majority of pre/perinatal causes of CP are not well understood, whereas the likely proximal cause has been identified in post-neonatally acquired cases.
Section 4 is a new addition to the ACPR report which provides information regarding the New Zealand and Bangladesh CP Registers which share the ACPR minimum dataset and infrastructure.
METHODS


RESULTS:ALL CEREBRAL PALSY1

SECTION 1: ALL CEREBRAL PALSY16
Table 1. Pre/perinatally and post-neonatally acquired CP by state/territory of birth (1993-2009)
Live births(1993-2009)
n
Pre/perinatally acquired CP
n
Post-neonatally acquired CP
n
TOTALCPn
Prevalence all CP Rate per 1000
live births
ACT 78697 104 13 117 1.5
NSW 1509760 1549 122 1671 1.1
NT 62643 96 18 114 1.8
QLD 862792 1255 53 1308 1.5
SA* 317536 609 29 638 2.0
TAS 104187 137 2 139 1.3
VIC* 1104389 1930 118 2048 1.9
WA* 448215 1123 83 1206 2.7
TOTAL 4488219 6803 438 7241
COMBINED* 1870140 3662 (94.1) 230 (5.9) 3892 2.1 (95%CI 2.0,2.2)
NB: Whilst the ascertainment of registrations for CP in ACT, NT and QLD has increased rapidly to a total CP prevalence ≥1.5 per 1000 live births, these regions remain under-ascertained. As such the data from these regions has not been used in the calculation of combined rates.
ALL CHILDREN WITH CEREBRAL PALSY
The combined data indicates that the brain injury responsible for CP primarily arises during the pre/perinatal period (94.1%). For a small group (5.9%) the brain injury occurred post-neonatally and before 2 years of age.
For this report of the Australian Cerebral Palsy Register, data pertaining to 7241 individuals with CP are reported. The total prevalence for CP is 2.1 per 1000 live births (95% CI 2.0, 2.2).
The rate of CP in Western Australia is considerably higher than that reported by other long-standing CP registers in Victoria and South Australia. The Western Australian CP Register has higher rates of ascertainment related at least in part to having a small population and centralised services in the state capital, Perth.

ALL CP PRE/PERINATALLY ACQUIRED CP POST-NEONATALLY ACQUIRED CP
1993-1994 1995-1997 1998-2000 2001-2003 2007-20092004-2007
RATE OFCP PER1000 LB
RATE OF POST-NEONATALLY ACQUIRED CP PER 10,000 LB
2.5
2.0
1.5
1.0
0.5
0.0
2.5
2.0
1.5
1.0
0.5
0.0
17AUSTRALIAN CEREBRAL PALSY REGISTER REPORT 2016
Table 2. Rate of pre/perinatally and post-neonatally acquired CP per live births (LB) and year of birth, South Australia, Victoria and Western Australia combined (1993-2009)
1993-1994 1995-1997 1998-2000 2001-2003 2004-2006 2007-2009 1993-2009
Pre/perinatally acquired CP/1000 LB 2.0 2.1 2.1 2.0 1.9 1.6 2.0
Post-neonatally acquired CP/10,000 LB 1.0 1.4 1.1 1.3 1.2 1.3 1.2
All CP/1000 LB 2.1 2.2 2.3 2.1 2.1 1.8 2.1
Figure 1. Rate of CP per 1000 live births (LB) and year of birth, South Australia, Victoria and Western Australia combined (1993-2009)

SECTION 1: ALL CEREBRAL PALSY18
Table 3. Number and percentage of children with CP by Indigenous status of mother and state/territory of birth (1993-2009)
Aboriginal Aboriginal and Torres
Strait Islander
Torres Strait Islander
Non-indigenous Total Unknown
n(%)^ n(%)^ n(%)^ n(%)^ n n(%)
ACT
Pre/peri (2.5) 0 (0.0) 0 (0.0) 79 (97.5) 104 23 (22.1)
PNN (10.0) 0 (0.0) 0 (0.0) 9 (90.0) 13 (23.1)
NSW
Pre/peri 71 (5.6) (0.2) 0 (0.0) 1186 (94.1) 1549 289 (18.7)
PNN 7 (7.4) 0 (0.0) 0 (0.0) 87 (92.6) 123 29 (23.6)
NT
Pre/peri 52 (54.2) 0 (0.0) 0 (0.0) 44 (45.8) 96 0 (0.0)
PNN 14 (77.8) (5.6) 0 (0.0) (16.7) 18 0 (0.0)
QLD
Pre/peri 49 (4.4) 8 (0.7) 8 (0.7) 1052 (94.2) 1255 138 (11.0)
PNN (6.3) 0 (0.0) 0 (0.0) 45 (93.8) 53 5 (9.4)
SA*
Pre/peri 18 (3.0) 0 (0.0) (0.6) 585 (96.6) 609 (0.7)
PNN (3.4) 0 (0.0) 0 (0.0) 28 (96.6) 29 0 (0.0)
TAS
Pre/peri 5 (4.4) 0 (0.0) 0 (0.0) 108 (95.6) 137 24 (17.5)
PNN 0 (0.0) 0 (0.0) 0 (0.0) (100.0) 0 (0.0)
VIC*
Pre/peri 14 (0.8) 0 (0.0) 0 (0.0) 1823 (99.2) 1930 93 (4.8)
PNN (0.9) 0 (0.0) 0 (0.0) 115 (99.1) 118 (1.7)
WA*
Pre/peri 94 (8.4) (0.1) 0 (0.0) 1022 (91.5) 1123 6 (0.5)
PNN 18 (21.7) 0 (0.0) 0 (0.0) 65 (78.3) 83 0 (0.0)
TOTAL
Pre/peri 305 12 10 5899 6803 577
PNN 45 0 354 438 39
All CP 350 13 10 6253 7241 616
COMBINED*
Pre/peri 126 (3.5) (0.0) (0.1) 3430 (96.4) 3662 103 (2.8)
PNN 20 (8.8) 0 (0.0) 0 (0.0) 208(91.2) 230 (0.9)
All CP 146 (3.9) (0.0) (0.1) 3638 (96.1) 3892 105 (2.7)
< 5 cases (%)^ calculated by n/total n minus unknown n; provided to allow state/territory comparisons Pre/peri CP: pre/perinatally acquired CP PNN CP: post-neonatally acquired CP
INDIGENOUS STATUS OF MOTHER

19AUSTRALIAN CEREBRAL PALSY REGISTER REPORT 2016
Table 4. Number and frequency of children with CP per 1000 neonatal survivors (95% confidence interval) in 1996-2005 births by state/territory, and time of CP acquisition
INDIGENOUS NON-INDIGENOUSLocation of Birth
Neonatal survivors
Pre/perinatal CP n: n/1000LB
(95%CI)
Post-neonatal CPn: n/1000LB
(95%CI)
Neonatal survivors
Pre/perinatal CP n: n/1000LB
(95%CI)
Post-neonatal CPn: n/1000LB
(95%CI)
NT 13036 33: 2.53 (1.69-3.39) 6: 0.46 (0.1-0.82) 22426 28: 1.25 (0.79-1.71) 1: 0.045 (0-0.13)
QLD 27748 53: 1.92 (1.41-2.44) 6: 0.22 (0.04-0.39) 464842 612: 1.32 (1.21 – 1.42) 20: 0.043 (0.02-0.06)
WA 15721 52: 3.31 (2.41-4.21) 11: 0.70 (0.29-1.11) 237364 608: 2.56 (2.36 – 2.76) 39: 0.16 (0.11-0.22)
COMBINED* 56505 138: 2.44 (2.03-2.85) 23: 0.41 (0.24 – 0.57) 724632 1248 1.72 (1.63 – 1.81) 60: 0.083 (0.06-0.10)
Bold type denotes statistically significant (p<0.05) difference in proportion of live births (LB) affected by CP between Indigenous and non-Indigenous populations.
Table 5. Distribution of characteristics of impairments in 1996-2005 births in NT, QLD and WA for children subsequently described as having CP, by Indigenous status and time of CP acquisition
PRE/PERINATAL CP POST-NEONATAL CPCharacteristic Indigenous
%Non-Indigenous
%Relative risk
(95%CI)Indigenous
%Non-Indigenous
%Relative risk
(95%CI)
Maximum n* 138 1248 23 60
GMFCS I-II 54 57 52 53
GMFCS III 9 17 4 9
GMFCS IV-V 37 26 1.4 (1.0-2.0) 44 38 1.2 (0.5-2.8)
ID (IQ<70) 61 46 1.3 (0.9-1.9) 71 51 1.4 (0.6-3.1)
Epilepsy at 5y 44 30 1.5 (1.1 – 2.0) 38 39 1.0(0.4-2.5)
Some visual impairment 37 31 27 38
Blind 11 5 2.4 (1.3 – 4.7) 18 6 3.3(0.7-16)
Some hearing impairment 22 8 18 2
Deaf 4 2 1.6 (0.6 – 4.2) 9 5 1.7 (0.1-21)
Some speech impairment 36 36 50 55
Non-verbal 30 23 1.3 (0.9 – 1.9) 40 27 1.5 (0.5-4.0)
* The maximum size of the denominator; missing data were excluded from denominators. 95% CI, 95% confidence intervals; GMFCS, Gross Motor Function Classification System; ID, intellectual disability.
Table 4 and 5 sourced from: Blair, E., Watson, L., O’Kearney, E. d’Antoine, H., deLacy, M. (2015) Comparing risks of cerebral palsy in births to Australian Indigenous and non-Indigenous. Dev Med Child Neurol. 2016;58 Suppl 2:36-42.
The combined data presented above were collated for a recent ACPR Group publication and provide the best available data on Indigenous status as a risk factor for CP. This data suggests that Indigenous children are at significantly increased risk of CP particularly post-neonatally acquired CP when compared with their Non-Indigenous peers.
For further information about Indigenous status as a risk factor for CP, please see Blair E, Watson L, O’Kearney E, D’Antoine H, Delacy MJ. Comparing risks of cerebral palsy in births between Australian Indigenous and non-Indigenous mothers. Dev Med Child Neurol. 2016;58 Suppl 2:36-42.
SECTION 2 OF THIS REPORT REFERS TO CP ARISING FROM AN
INJURY TO THE DEVELOPING BRAIN DURING THE PRENATAL/
PERINATAL PERIOD (THROUGHOUT PREGNANCY AND DURING
THE FIRST 28 COMPLETED DAYS AFTER BIRTH).
PRENATALLY OR PERINATALLY ACQUIRED CEREBRAL PALSY 2


SECTION 2: PRENATALLY OR PERINATALLY ACQUIRED CEREBRAL PALSY22
Birth prevalence of CP in this cohort is shown in Table 6 per 1000 live births and in Table 7 by 1000 neonatal survivors.
Table 6. Birth prevalence of CP by year and state/territory of birth, per 1000 live births (LB) (1993-2009)
1993-1994 1995-1997 1998-2000 2001-2003 2004-2006 2007-2009 1993-2009
ACT
Live Births (LB) 8875 13019 12300 12178 15369 16956 78697
CP Cases 14 12 27 20 18 13 104
CP cases/1000 LB 1.6 0.9 2.2 1.6 1.2 0.8 1.3
NSW
Live Births (LB) 177331 261600 259035 257505 267314 286975 1509760
CP Cases 127 230 285 291 310 306 1549
CP cases/1000 LB 0.7 0.9 1.1 1.1 1.2 1.1 1.0
NT
Live Births (LB) 7229 10916 10902 11336 10811 11449 62643
CP Cases 10 19 23 14 16 14 96
CP cases/1000 LB 1.4 1.7 2.1 1.2 1.5 1.2 1.5
QLD
Live Births (LB) 93356 141218 140198 143791 161785 182444 862792
CP Cases 106 236 223 204 235 251 1255
CP cases/1000LB 1.1 1.7 1.6 1.4 1.5 1.4 1.5
SA*
Live Births (LB) 39519 56986 54782 52917 54136 59196 317536
CP Cases 78 136 114 76 94 111 609
CP cases/1000 LB (95%CI) 2.0 2.4 2.1 1.4 1.7 1.9 1.9 (1.7,2.1)
TAS
Live Births (LB) 13582 19275 18111 16779 17458 18982 104187
CP Cases 8 13 18 30 34 34 137
CP cases/1000 LB 0.6 0.7 1.0 1.8 1.9 1.8 1.3
VIC*
Live Births (LB) 128660 187565 186272 187305 198353 216234 1104389
CP Cases 214 348 350 371 345 302 1930
CP cases/1000 LB (95%CI) 1.7 1.9 1.9 2.0 1.7 1.4 1.7 (1.7,1.9)
WA*
Live Births (LB) 50447 75855 76137 73879 80578 91319 448215
CP Cases 139 185 216 182 210 191 1123
CP cases/1000 LB (95%CI) 2.8 2.4 2.8 2.5 2.6 2.1 2.5 (2.4,2.6)
COMBINED*
Live Births (LB) 218626 320406 317191 314101 333067 366749 1870140
CP Cases 431 669 680 629 649 604 3662CP cases/1000 LB(95%CI)
2.0(1.8,2.2)
2.1(1.9,2.3)
2.1(1.9,2.3)
2.0(1.8,2.2)
1.9(1.8,2.0)
1.6(1.5,1.7)
2.0(1.9,2.1)
TOTAL pre/perinatal CP: 6803
PREVALENCE

0.0
0.5
1.0
1.5
2.0
2.5
3.0
3.5
ACT NSW NT QLD SA* TAS VIC* WA* COMBINED
RATE OF CHILDREN WITH CP PER 1000LB
1993-1994 1995-1997 1998-2000 2001-2003 2007-20092004-2006
23AUSTRALIAN CEREBRAL PALSY REGISTER REPORT 2016
Figure 2. Birth cohort prevalence of CP per 1000 live births (LB) by state/territory and year of birth, in two and three year intervals (1993-2009)
After a long period of stable prevalence at around 2-2.5/1000, the rate of CP per 1000 live births declined to 1.4-2.1/1000 in the 2007-2009 period.

SECTION 2: PRENATALLY OR PERINATALLY ACQUIRED CEREBRAL PALSY24
Table 7. Birth prevalence of CP per 1000 neonatal survivors (NNS) by state/territory of birth (1995 – 2009)
1995-1997 1998-2000 2001-2003 2004-2006 2007-2009 1995-2009
ACT & NSW
NNS 273794 272988 269953 281766 302883 1401384
CP Cases 242 312 311 328 393 1586
CP cases/1000 NNS 0.9 1.1 1.2 1.2 1.3 1.1
NT
NNS 10526 10100 10100* 10753 11404 52883
CP Cases 19 23 14 16 14 86
CP cases/1000 NNS 1.8 2.3 1.4 1.5 1.2 1.6
QLD
NNS 142880 144619 147702 161180 181803 778184
CP Cases 236 223 204 235 251 1149
CP cases/1000 NNS 1.7 1.5 1.4 1.5 1.4 1.5
SA*
NNS 56786 54641 52757 53986 59049 277219
CP Cases 136 114 76 94 111 531
CP cases/1000 NNS 2.4 2.1 1.4 1.7 1.9 1.9 (1.8, 2.1)
TAS
NNS 19173 17895 16706 17387 18937 90098
CP Cases 13 18 30 34 34 129
CP cases/1000 NNS 0.7 1.0 1.8 2.0 1.8 1.4
VIC*
NNS 186944 185419 186722 197671 197671# 954427
CP Cases 348 350 371 345 302 1716
CP cases/1000 NNS 1.9 1.9 2.0 1.7 1.5 1.8 (1.7,1.9)
WA*
NNS 75555 75951 73700 80380 91125 396711
CP Cases 185 216 182 210 191 984
CP cases/1000 NNS 2.4 2.8 2.5 2.6 2.1 2.5 (1.9,3.1)
COMBINED*
NNS 319285 316011 313179 332037 347845 1628357
CP Cases 669 680 629 649 604 3231
CP cases/1000 NNS 2.1(1.9,2.3)
2.2(2.0,2.4)
2.0(1.8,2.2)
2.0(1.8,2.1)
1.7(1.6,1.8)
2.0 (1.9,2.1)
#Total NNS for previous triennium reported here as complete NNS data not available for this triennium
Analysis of the combined data demonstrated a significantly declining trend in the rate of CP per 1000 live births and neonatal survivors between 2001-2003 and 2007-2009 (p< 0.05). Data from Victoria and Western Australia show a striking reduction in the rate of CP in the final triennium 2007-2009.
25AUSTRALIAN CEREBRAL PALSY REGISTER REPORT 2016
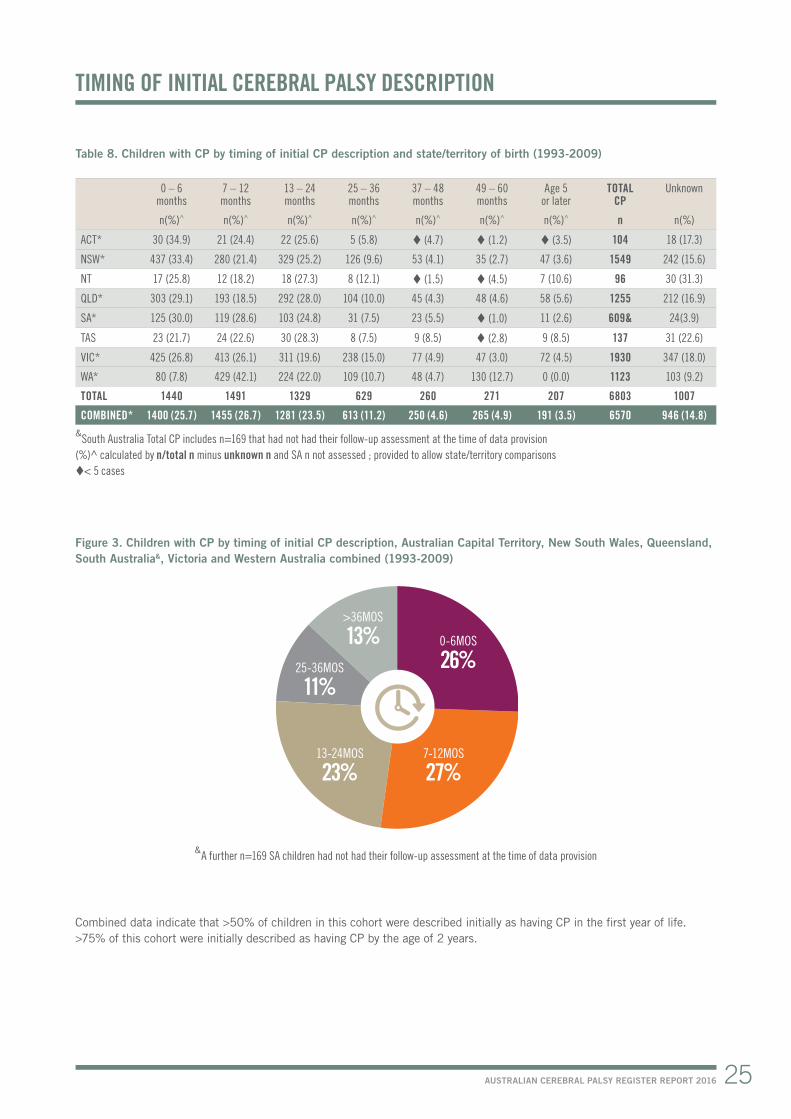
Table 8. Children with CP by timing of initial CP description and state/territory of birth (1993-2009)
0 – 6 months
7 – 12 months
13 – 24 months
25 – 36 months
37 – 48 months
49 – 60 months
Age 5 or later
TOTAL CP
Unknown
n(%)^ n(%)^ n(%)^ n(%)^ n(%)^ n(%)^ n(%)^ n n(%)
ACT* 30 (34.9) 21 (24.4) 22 (25.6) 5 (5.8) (4.7) (1.2) (3.5) 104 18 (17.3)
NSW* 437 (33.4) 280 (21.4) 329 (25.2) 126 (9.6) 53 (4.1) 35 (2.7) 47 (3.6) 1549 242 (15.6)
NT 17 (25.8) 12 (18.2) 18 (27.3) 8 (12.1) (1.5) (4.5) 7 (10.6) 96 30 (31.3)
QLD* 303 (29.1) 193 (18.5) 292 (28.0) 104 (10.0) 45 (4.3) 48 (4.6) 58 (5.6) 1255 212 (16.9)
SA* 125 (30.0) 119 (28.6) 103 (24.8) 31 (7.5) 23 (5.5) (1.0) 11 (2.6) 609& 24(3.9)
TAS 23 (21.7) 24 (22.6) 30 (28.3) 8 (7.5) 9 (8.5) (2.8) 9 (8.5) 137 31 (22.6)
VIC* 425 (26.8) 413 (26.1) 311 (19.6) 238 (15.0) 77 (4.9) 47 (3.0) 72 (4.5) 1930 347 (18.0)
WA* 80 (7.8) 429 (42.1) 224 (22.0) 109 (10.7) 48 (4.7) 130 (12.7) 0 (0.0) 1123 103 (9.2)
TOTAL 1440 1491 1329 629 260 271 207 6803 1007
COMBINED* 1400 (25.7) 1455 (26.7) 1281 (23.5) 613 (11.2) 250 (4.6) 265 (4.9) 191 (3.5) 6570 946 (14.8)&South Australia Total CP includes n=169 that had not had their follow-up assessment at the time of data provision (%)^ calculated by n/total n minus unknown n and SA n not assessed ; provided to allow state/territory comparisons < 5 cases
Figure 3. Children with CP by timing of initial CP description, Australian Capital Territory, New South Wales, Queensland, South Australia&, Victoria and Western Australia combined (1993-2009)
Combined data indicate that >50% of children in this cohort were described initially as having CP in the first year of life. >75% of this cohort were initially described as having CP by the age of 2 years.
TIMING OF INITIAL CEREBRAL PALSY DESCRIPTION
0-6MOS
26%
>36MOS
13%25-36MOS
11%
13-24MOS
23%7-12MOS
27%
&A further n=169 SA children had not had their follow-up assessment at the time of data provision

SECTION 2: PRENATALLY OR PERINATALLY ACQUIRED CEREBRAL PALSY26
Table 9. Number and percentage of children with CP by sex and state/territory of birth (1993-2009)
Female n(%)
Malen(%)
TOTAL n
ACT* 39 (37.5) 65 (62.5) 104NSW* 647 (41.8) 902 (58.2) 1549NT* 34 (35.4) 62 (64.6) 96QLD* 559 (44.5) 696 (55.5) 1255SA* 258 (42.4) 351 (57.6) 609TAS* 53 (38.7) 84 (61.3) 137VIC* 827 (42.8) 1103 (57.2) 1930WA* 505 (45.0) 618 (55.0) 1123COMBINED* 2922 (43.0) 3881 (57.0) 6803
Figure 4. Percentage of children with CP by sex, all states and territories (1993-2009)
Table 10. CP birth prevalence per 1000 live births (LB) by sex, South Australia, Victoria and Western Australia (1995-2009)
Grouped year of birth Males Females GENDERM/F ratio
1995-1997 CP 373 296 1.3Rate per 1000 LB 2.3 1.995% CI 2.1-2.5 1.7-2.1
1998-2000 CP 379 302 1.3Rate per 1000 LB 2.3 2.095% CI 2.1-2.5 1.8-2.2
2001-2003 CP 350 280 1.3Rate per 1000 LB 2.2 1.895% CI 2.0-2.4 1.6-2.0
2004-2006 CP 399 253 1.6Rate per 1000 LB 2.3 1.695% CI 2.1-2.5 1.4-1.8
2007-2009 CP 325 278 1.2Rate per 1000 LB 1.7 1.695% CI 1.5-1.9 1.4-1.8
Combined data demonstrated that males are at a higher risk of developing cerebral palsy. 57% of the cohort was male compared to 51% of the Australian population born during this period21.
For further information about associations of sex with specific subgroups of CP, please see Reid SM, Meehan E, Gibson CS, Scott H, Delacy MJ. Biological sex and the risk of CP in Victoria, Australia. Dev Med Child Neurol. 2016;58 Suppl 2:43-9.
SEX
MALES
57%FEMALES
43%


0.0
0.5
1.0
1.5
2.0
2.5
3.0
3.5
<20 YEARS 20-24 YEARS 25-29 YEARS 30-34 YEARS 35-39 YEARS 40+ YEARS
RATE OF CHILDREN WITH CP PER 1000LB
1995-1997 1998-2000 2001-2003 2004-2006 2007-2009
SECTION 2: PRENATALLY OR PERINATALLY ACQUIRED CEREBRAL PALSY28
Table 11. Number and percentage of children with CP by maternal age (years) at delivery and state/territory of birth (1993-2009)
<20 20-24 25-29 30-34 35-39 40+ TOTAL Unknown
n(%)^ n(%)^ n(%)^ n(%)^ n(%)^ n(%)^ n n(%)
ACT* 5 (5.4) 14 (15.1) 21 (22.6) 37 (39.8) 12 (12.9) (4.3) 104 11(10.6)
NSW* 65 (4.9) 212 (16.0) 343 (25.9) 419 (31.7) 234 (17.7) 49 (3.7) 1549 227(14.7)
NT* 19 (21.3) 20 (22.5) 21 (23.6) 17 (19.1) 9 (10.1) (3.4) 96 7(7.3)
QLD* 55 (5.5) 150 (14.9) 311 (31.0) 300 (29.9) 159 (15.8) 29 (2.9) 1255 251 (20.0)
SA* 33 (5.4) 120 (19.7) 167 (27.4) 187 (30.7) 92 (15.1) 10 (1.6) 609 0(0.0)
TAS* 8 (6.7) 22 (18.3) 33 (27.5) 37 (30.8) 13 (10.8) 7 (5.8) 137 17(12.4)
VIC* 72 (4.6) 206 (13.3) 439 (28.3) 540 (34.8) 235 (15.1) 61 (3.9) 1930 377(19.5)
WA* 85 (7.7) 181 (16.5) 317 (28.8) 319 (29.0) 169 (15.4) 29 (2.6) 1123 23(2.0)
COMBINED* 342 (5.8) 925 (15.7) 1652 (28.0) 1856 (31.5) 923 (15.7) 192 (3.3) 6803 913(13.4)
< 5 cases (%)^ calculated by n/total n minus unknown n; provided to allow state/territory comparisons
Figure 5. Children with CP per 1000 live births (LB), maternal age at delivery, South Australia, Victoria and Western Australia (1995-2009)
Rates of CP per 1000 live births have improved for all maternal age groups except for mothers <20 years which have remained stable over these 14 years.
MATERNAL AGE AT TIME OF DELIVERY

70
60
50
40
30
20
10
0
20-27 WEEKS 28-31 WEEKS 32-36 WEEKS 37+ WEEKS
RATE OF CHILDREN WITH CP PER 1000LB
1995-1997 1998-2000 2001-2003 2004-2006 2007-2009
29AUSTRALIAN CEREBRAL PALSY REGISTER REPORT 2016
Table 12. Number and percentage of children with CP by gestational age in weeks at delivery and state/territory of birth (1993-2009)
20-27 28-31 32-36 ≥37 TOTAL Unknown
n(%)^ n(%)^ n(%)^ n(%)^ n n(%)
ACT* 13 (13.1) 18 (18.2) 16 (16.2) 52 (52.5) 104 5 (4.8)
NSW* 206 (13.9) 195 (13.2) 227 (15.4) 849 (57.5) 1549 72 (4.6)
NT* 7 (7.7) 6 (6.6) 21 (23.1) 57 (62.6) 96 5 (5.2)
QLD* 165 (14.4) 184 (16.1) 201 (17.6) 595 (52.0) 1255 110 (8.8)
SA* 90 (14.9) 103 (17.0) 98 (16.2) 314 (51.9) 609 (0.7)
TAS* 13 (10.1) 13 (10.1) 23 (17.8) 80 (62.0) 137 8 (5.8)
VIC* 238 (12.8) 260 (14.0) 267 (14.4) 1095 (58.9) 1930 70 (3.6)
WA* 124 (11.2) 138 (12.4) 177 (15.9) 673 (60.5) 1123 11 (1.0)
COMBINED* 856 (13.1) 917 (14.1) 1030 (15.8) 3715 (57.0) 6803 285 (4.2)
< 5 cases (%)^ calculated by n/total n minus unknown n; provided to allow state/territory comparisons
Table 13. Rate of children with CP per 1000 live births (LB), gestational age in weeks at delivery, South Australia, Victoria and Western Australia combined (1995-2009)
1995-1997 1998-2000 2001-2003 2004-2006 2007-2009
20-27 weeks 65.5 66.2 50.5 39.0 40.9
28-31 weeks 36.4 45.1 35.0 31.6 32.7
32-36 weeks 5.2 4.7 4.8 4.9 4.1
37+ weeks 1.3 1.3 1.3 1.2 0.9
Figure 6. Children with CP per 1000 live births (LB), gestational age, South Australia, Victoria and Western Australia combined (1995-2009)
In this cohort the combined data indicate that 43% of CP births were preterm (< 37 weeks gestation). This is in contrast to the Australian population where 7.2% of live births were preterm21. The rate of CP per 1000 live births amongst the lower gestational age groups has risen slightly in the last triennium.
GESTATIONAL AGE AT DELIVERY

SECTION 2: PRENATALLY OR PERINATALLY ACQUIRED CEREBRAL PALSY30
Table 14. Number and rate of children with CP born preterm per 1000 live births (LB) and neonatal survivors (NNS), by gestational age in weeks at delivery and state/territory of birth (1995-2009)
Gestational age group Year of birth SA VIC WA
20-27 weeks 1995-1997 CP 29 44 17Rate/LB (95%CI) 98.0 (62.3 – 133.7) 57.5 (40.5 - 74.5) 54.1 (28.4 - 79.8)
Rate/NNS (95%CI) 166.7 (106.0 – 227.4) 98.7 (69.5 - 127.9) 82.5 (43.3 - 121.7)1998-2000 CP 20 46 25
Rate/LB (95%CI) 78.1 (43.9 – 112.3) 55.6 (39.5 - 71.7) 85.9 (52.2 – 119.6)Rate/NNS (95%CI) 111.7 (62.7 – 160.7) 94.7 (67.3 - 122.1) 128.2 (77.9 – 178.5)
2001-2003 CP 7 45 23Rate/LB (95%CI) 26.6 (6.9 – 46.3) 48.6 (34.4 – 62.8) 55.9 (33.1 – 78.7)
Rate/NNS (95%CI) 43.5 (11.3 – 75.7) 88.6 (62.7 – 114.5) 108.0 (63.9 – 152.1)2004-2006 CP 7 36 21
Rate/LB (95%CI) 24.1 (6.2 – 42.0) 37.0 (24.9 – 49.1) 55.9 (32.0 – 79.8)Rate/NNS (95%CI) 35.5 (9.2 – 61.8) 68.0 (45.8 – 90.3) 79.5 (45.5 – 113.6)
2007-2009 CP 18 33 19Rate/LB (95%CI) 65.5 (35.2 – 95.8) 31.8 (21.0 – 42.6) 47.4 (26.1 – 68.7)Rate/NNS(95%CI) 91.8 (49.4 – 134.3) 62.4 (41.1 – 83.7)* 61.69 (34.0 – 89.4)
28-31 weeks 1995-1997 CP 20 45 17Rate/LB (95%CI) 45.2 (25.4 – 65.0) 34.5 (24.4 – 44.6) 33.5 (17.6 – 49.4)
Rate/NNS (95%CI) 46.6 (26.2 – 67.0) 36.1 (25.6 – 46.6) 34.6 (18.2 – 51.0)1998-2000 CP 27 53 28
Rate/LB (95%CI) 56.5 (35.2 – 77.8) 39.9 (29.2 – 50.6) 47.5 (29.9 – 65.1)Rate/NNS (95%CI) 58.2 (36.2 – 80.2) 41.6 (30.4 – 52.8) 48.4 (30.5 – 66.3)
2001-2003 CP 9 51 21Rate/LB (95%CI) 20.2 (7.0 - 33.4) 38.1 (27.6 – 48.6) 39.8 (22.8 – 56.8)
Rate/NNS (95%CI) 20.7 (7.2 – 34.2) 39.2 (28.4 – 50.0) 41.1 (23.5 – 58.7) 2004-2006 CP 15 43 20
Rate/LB (95%CI) 33.7 (16.6 – 50.8) 30.9 (21.7 – 40.1) 31.8 (17.9 – 45.7) Rate/NNS (95%CI) 34.1 (16.8 – 51.4) 31.8 (22.3 – 41.3) 32.3 (18.1 – 46.5)
2007-2009 CP 16 43 32Rate/LB (95%CI) 33.5 (17.1 - 49.9) 27.0 (18.9 – 35.1) 44.9 (29.3 – 60.5)
Rate/NNS (95%CI) 34.3 (17.5 – 51.1) 31.8 (18.9-35.1)* 46.0 (30.1 – 61.9) 32-36 weeks 1995-1997 CP 20 46 29
Rate/LB (95%CI) 5.8 (3.3 - 8.3) 4.3 (3.1 – 5.5) 6.8 (4.3 – 9.3) Rate/NNS(95%CI) 5.8 (3.3 – 8.3) 4.4 (3.1 – 5.7) 6.8 (4.3 – 9.3)
1998-2000 CP 24 40 27Rate/LB (95%CI) 6.8 (4.1 – 9.5) 3.6 (3.1 – 5.5) 5.6 (4.3 – 9.3)
Rate/NNS (95%CI) 6.8 (4.1 – 9.5) 3.6 (3.1 – 5.7) 5.6 (4.3 – 9.3)2001-2003 CP 12 60 23
Rate/LB (95%CI) 3.5 (1.5 – 5.5) 5.3 (4.0 -6.6) 4.7 (3.5 – 7.7) Rate/NNS (95%CI) 3.5 (1.5 – 5.5) 5.3 (4.0 -6.6) 4.8 (3.5 – 7.7)
2004-2006 CP 14 51 42Rate/LB (95%CI) 3.8 (1.8 - 5.8) 4.1 (3.0 - 5.2) 7.4 (5.2 - 9.6)
Rate/NNS (95%CI) 3.8 (1.8 - 5.8) 4.2 (3.1 - 5.4) 7.4 (5.2 – 9.6)2007-2009 CP 16 46 36
Rate/LB (95%CI) 3.9 (2.0 – 5.8) 3.3 (2.3 – 4.3) 5.8 (3.9 – 7.7) Rate/NNS (95%CI) 4.0 (2.0 – 6.0) 5.0 (3.6 – 6.4)* 5.8 (3.9 – 7.7)
*Total NNS for previous triennium used here in calculation of rates as complete NNS data not available for this triennium

180
160
140
120
100
80
60
40
20
0
SA VIC WA
RATE OF CHILDREN WITH CP PER 1000NNS
1995-1997 1998-2000 2001-2003 2004-2006 2007-2009
20-27 WEEKS GESTATION
70
60
50
40
30
20
10
0
SA VIC WA
RATE OF CHILDREN WITH CP PER 1000NNS
1995-1997 1998-2000 2001-2003 2004-2006 2007-2009
28-31 WEEKS GESTATION
8
7
6
5
4
3
2
1
0
SA VIC WA
RATE OF CHILDREN WITH CP PER 1000NNS
1995-1997 1998-2000 2001-2003 2004-2006 2007-2009
32-36 WEEKS GESTATION
31AUSTRALIAN CEREBRAL PALSY REGISTER REPORT 2016
Figure 7. Rate of children with CP born preterm per 1000 neonatal survivors (NNS) by gestational age in weeks at delivery and state/territory of birth (1995-2009)
Amongst children born preterm, the rate of CP per 1000 neonatal survivors shows no shared trend across all jurisdictions, notably in the last triennium (2007-2009).
SECTION 2: PRENATALLY OR PERINATALLY ACQUIRED CEREBRAL PALSY32
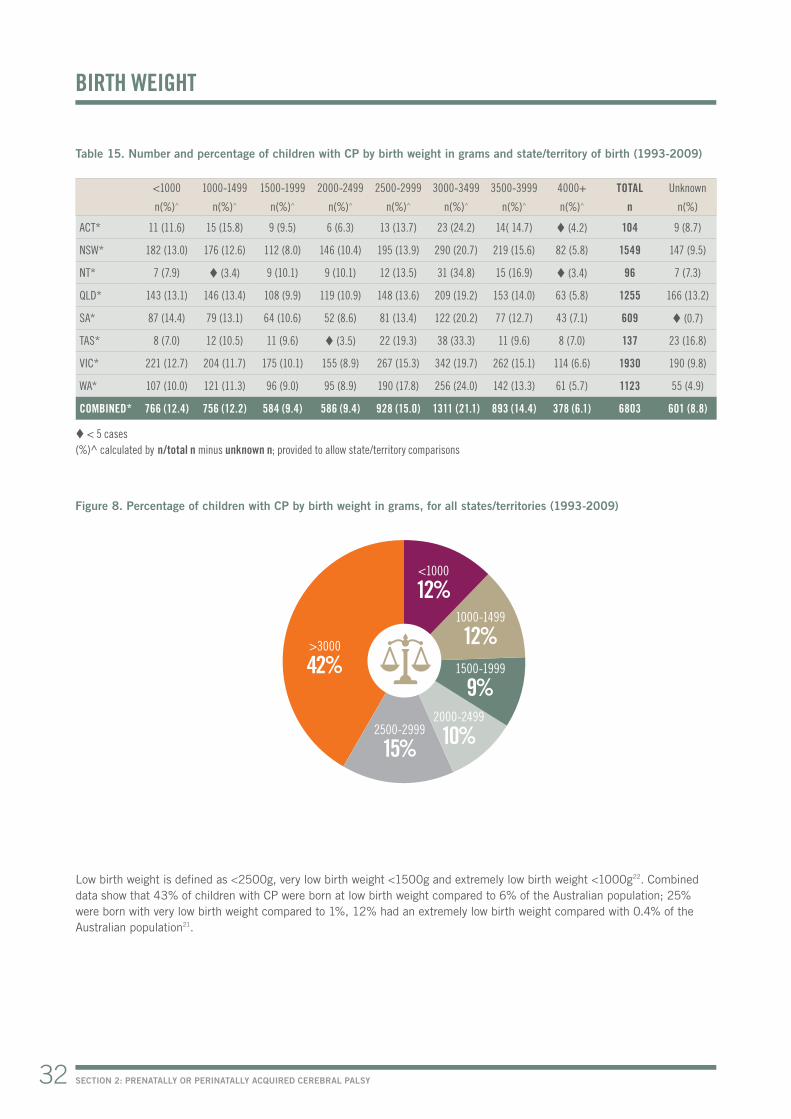
Table 15. Number and percentage of children with CP by birth weight in grams and state/territory of birth (1993-2009)
<1000 1000-1499 1500-1999 2000-2499 2500-2999 3000-3499 3500-3999 4000+ TOTAL Unknown
n(%)^ n(%)^ n(%)^ n(%)^ n(%)^ n(%)^ n(%)^ n(%)^ n n(%)
ACT* 11 (11.6) 15 (15.8) 9 (9.5) 6 (6.3) 13 (13.7) 23 (24.2) 14( 14.7) (4.2) 104 9 (8.7)
NSW* 182 (13.0) 176 (12.6) 112 (8.0) 146 (10.4) 195 (13.9) 290 (20.7) 219 (15.6) 82 (5.8) 1549 147 (9.5)
NT* 7 (7.9) (3.4) 9 (10.1) 9 (10.1) 12 (13.5) 31 (34.8) 15 (16.9) (3.4) 96 7 (7.3)
QLD* 143 (13.1) 146 (13.4) 108 (9.9) 119 (10.9) 148 (13.6) 209 (19.2) 153 (14.0) 63 (5.8) 1255 166 (13.2)
SA* 87 (14.4) 79 (13.1) 64 (10.6) 52 (8.6) 81 (13.4) 122 (20.2) 77 (12.7) 43 (7.1) 609 (0.7)
TAS* 8 (7.0) 12 (10.5) 11 (9.6) (3.5) 22 (19.3) 38 (33.3) 11 (9.6) 8 (7.0) 137 23 (16.8)
VIC* 221 (12.7) 204 (11.7) 175 (10.1) 155 (8.9) 267 (15.3) 342 (19.7) 262 (15.1) 114 (6.6) 1930 190 (9.8)
WA* 107 (10.0) 121 (11.3) 96 (9.0) 95 (8.9) 190 (17.8) 256 (24.0) 142 (13.3) 61 (5.7) 1123 55 (4.9)
COMBINED* 766 (12.4) 756 (12.2) 584 (9.4) 586 (9.4) 928 (15.0) 1311 (21.1) 893 (14.4) 378 (6.1) 6803 601 (8.8)
< 5 cases (%)^ calculated by n/total n minus unknown n; provided to allow state/territory comparisons
BIRTH WEIGHT
Figure 8. Percentage of children with CP by birth weight in grams, for all states/territories (1993-2009)
Low birth weight is defined as <2500g, very low birth weight <1500g and extremely low birth weight <1000g22. Combined data show that 43% of children with CP were born at low birth weight compared to 6% of the Australian population; 25% were born with very low birth weight compared to 1%, 12% had an extremely low birth weight compared with 0.4% of the Australian population21.
<1000
12%1000-1499
12%1500-1999
9%2000-2499
10%2500-2999
15%
>3000
42%

SECTION 2: PRENATALLY OR PERINATALLY ACQUIRED CEREBRAL PALSY34
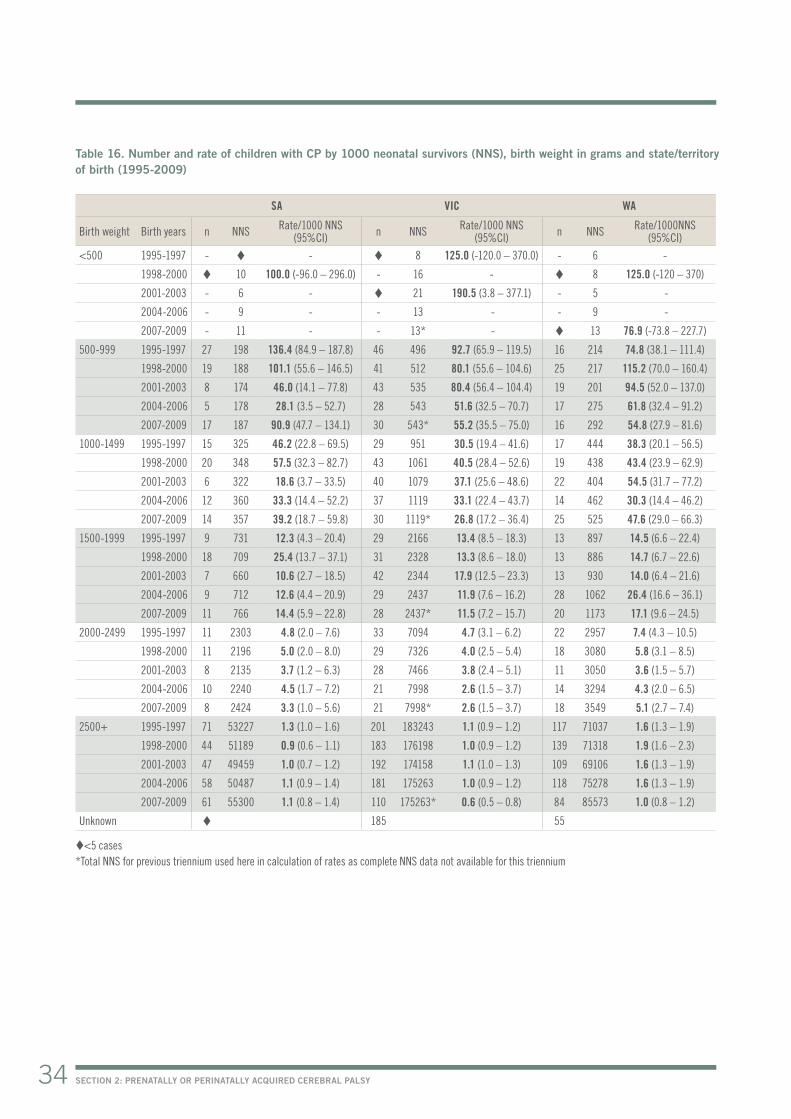
Table 16. Number and rate of children with CP by 1000 neonatal survivors (NNS), birth weight in grams and state/territory of birth (1995-2009)
SA VIC WA
Birth weight Birth years n NNS Rate/1000 NNS (95%CI) n NNS Rate/1000 NNS
(95%CI) n NNS Rate/1000NNS (95%CI)
<500 1995-1997 - - 8 125.0 (-120.0 – 370.0) - 6 -
1998-2000 10 100.0 (-96.0 – 296.0) - 16 - 8 125.0 (-120 – 370)
2001-2003 - 6 - 21 190.5 (3.8 – 377.1) - 5 -
2004-2006 - 9 - - 13 - - 9 -
2007-2009 - 11 - - 13* - 13 76.9 (-73.8 – 227.7)
500-999 1995-1997 27 198 136.4 (84.9 – 187.8) 46 496 92.7 (65.9 – 119.5) 16 214 74.8 (38.1 – 111.4)
1998-2000 19 188 101.1 (55.6 – 146.5) 41 512 80.1 (55.6 – 104.6) 25 217 115.2 (70.0 – 160.4)
2001-2003 8 174 46.0 (14.1 – 77.8) 43 535 80.4 (56.4 – 104.4) 19 201 94.5 (52.0 – 137.0)
2004-2006 5 178 28.1 (3.5 – 52.7) 28 543 51.6 (32.5 – 70.7) 17 275 61.8 (32.4 – 91.2)
2007-2009 17 187 90.9 (47.7 – 134.1) 30 543* 55.2 (35.5 – 75.0) 16 292 54.8 (27.9 – 81.6)
1000-1499 1995-1997 15 325 46.2 (22.8 – 69.5) 29 951 30.5 (19.4 – 41.6) 17 444 38.3 (20.1 – 56.5)
1998-2000 20 348 57.5 (32.3 – 82.7) 43 1061 40.5 (28.4 – 52.6) 19 438 43.4 (23.9 – 62.9)
2001-2003 6 322 18.6 (3.7 – 33.5) 40 1079 37.1 (25.6 – 48.6) 22 404 54.5 (31.7 – 77.2)
2004-2006 12 360 33.3 (14.4 – 52.2) 37 1119 33.1 (22.4 – 43.7) 14 462 30.3 (14.4 – 46.2)
2007-2009 14 357 39.2 (18.7 – 59.8) 30 1119* 26.8 (17.2 – 36.4) 25 525 47.6 (29.0 – 66.3)
1500-1999 1995-1997 9 731 12.3 (4.3 – 20.4) 29 2166 13.4 (8.5 – 18.3) 13 897 14.5 (6.6 – 22.4)
1998-2000 18 709 25.4 (13.7 – 37.1) 31 2328 13.3 (8.6 – 18.0) 13 886 14.7 (6.7 – 22.6)
2001-2003 7 660 10.6 (2.7 – 18.5) 42 2344 17.9 (12.5 – 23.3) 13 930 14.0 (6.4 – 21.6)
2004-2006 9 712 12.6 (4.4 – 20.9) 29 2437 11.9 (7.6 – 16.2) 28 1062 26.4 (16.6 – 36.1)
2007-2009 11 766 14.4 (5.9 – 22.8) 28 2437* 11.5 (7.2 – 15.7) 20 1173 17.1 (9.6 – 24.5)
2000-2499 1995-1997 11 2303 4.8 (2.0 – 7.6) 33 7094 4.7 (3.1 – 6.2) 22 2957 7.4 (4.3 – 10.5)
1998-2000 11 2196 5.0 (2.0 – 8.0) 29 7326 4.0 (2.5 – 5.4) 18 3080 5.8 (3.1 – 8.5)
2001-2003 8 2135 3.7 (1.2 – 6.3) 28 7466 3.8 (2.4 – 5.1) 11 3050 3.6 (1.5 – 5.7)
2004-2006 10 2240 4.5 (1.7 – 7.2) 21 7998 2.6 (1.5 – 3.7) 14 3294 4.3 (2.0 – 6.5)
2007-2009 8 2424 3.3 (1.0 – 5.6) 21 7998* 2.6 (1.5 – 3.7) 18 3549 5.1 (2.7 – 7.4)
2500+ 1995-1997 71 53227 1.3 (1.0 – 1.6) 201 183243 1.1 (0.9 – 1.2) 117 71037 1.6 (1.3 – 1.9)
1998-2000 44 51189 0.9 (0.6 – 1.1) 183 176198 1.0 (0.9 – 1.2) 139 71318 1.9 (1.6 – 2.3)
2001-2003 47 49459 1.0 (0.7 – 1.2) 192 174158 1.1 (1.0 – 1.3) 109 69106 1.6 (1.3 – 1.9)
2004-2006 58 50487 1.1 (0.9 – 1.4) 181 175263 1.0 (0.9 – 1.2) 118 75278 1.6 (1.3 – 1.9)
2007-2009 61 55300 1.1 (0.8 – 1.4) 110 175263* 0.6 (0.5 – 0.8) 84 85573 1.0 (0.8 – 1.2)
Unknown 185 55
<5 cases *Total NNS for previous triennium used here in calculation of rates as complete NNS data not available for this triennium

120
100
80
60
40
20
10
0
<1000 1000-1499 1500-1999 2000-2499 ≥2500
1995-1997 1998-2000 2001-2003 2004-2006 2007-2009
RATE OF CHILDREN WITH CP PER 1000NNS
35AUSTRALIAN CEREBRAL PALSY REGISTER REPORT 2016
Figure 9. Rate of children with CP per 1000 neonatal survivors (NNS), by birth weight in grams, South Australia, Victoria and Western Australia combined (1995 -2009)


THE AUSTRALIAN CEREBRAL PALSY REGISTER EXISTS AS A RESULT OF COLLABORATIVE PARTNERSHIPS BETWEEN ALL AUSTRALIAN STATE AND TERRITORY CEREBRAL PALSY REGISTERS, THE ORGANISATIONS THAT SUPPORT THEM AND THE FAMILIES AND INDIVIDUALS WITH CP WHO SO GENEROUSLY CONTRIBUTE THEIR DATA TO THIS RESEARCH.

SECTION 2: PRENATALLY OR PERINATALLY ACQUIRED CEREBRAL PALSY38
Table 17. Number and percentage of children with CP by birth plurality and state/territory of birth (1993-2009)
Birth plurality Singletons Twins Higher order multiples TOTAL Unknown
n(%)^ n(%)^ n(%)^ n n(%)
ACT* 81 (84.4) 15 (15.6) 0 (0.0) 104 8 (7.7)
NSW* 1225 (88.5) 143 (10.3) 16 (1.2) 1549 165 (10.7)
NT* 85 (95.5) (4.5) 0 (0.0) 96 7 (7.3)
QLD* 967 (86.0) 138 (12.3) 19 (1.7) 1255 131 (10.4)
SA* 539 (88.5) 69 (11.3) (0.2) 609 0 (0.0)
TAS* 110 (85.9) 15 (11.7) (2.3) 137 9 (6.6)
VIC* 1601 (87.1) 214 (11.6) 24 (1.3) 1930 91 (4.7)
WA* 987 (89.6) 106 (9.6) 8 (0.7) 1123 22 (2.0)
COMBINED* 5595 (87.8) 704 (11.1) 71 (1.1) 6803 433 (6.4)
< 5 cases (%)^ calculated by n/total n minus unknown n; provided to allow state/territory comparisons
PLURALITY
Combined data indicates that 12.2% of children with CP were from a multiple birth compared to 3.1% of all births in Australia21.

10
9
8
7
6
5
4
3
2
1
0
SINGLETONS TWINS AND HIGHER ORDER MULTIPLES
1995-1997 1998-2000 2001-2003 2004-2006 2007-2009
RATE OF CHILDREN WITH CP PER 1000NNS
39AUSTRALIAN CEREBRAL PALSY REGISTER REPORT 2016
Table 18. Rate of children with CP per 1000 neonatal survivors (NNS), by plurality, South Australia, Victoria and Western Australia combined (1995-2009)
1995-1997 1998-2000 2001-2003 2004-2006 2007-2009
Singletons
CP n 591 601 535 544 487
NNS 309955 306161 302794 320862 336519*
Rate/1000 NNS 1.9 2.0 1.8 1.7 1.4
95%CI 1.7 – 2.1 1.8 – 2.2 1.7 – 2.1 1.6 – 1.8 1.3 – 1.5
Twins and higher order multiples
CP n 81 70 75 64 67
NNS 9330 9850 10385 11175 11322*
Rate/1000 NNS 8.7 7.1 7.2 5.7 5.9
95%CI 6.8 – 10.6 5.4 – 8.7 5.6 – 8.9 4.2 – 7.0 4.5 – 7.3
*Total Victorian NNS for previous triennium reported here as complete NNS data not available for this triennium
Figure 10. Rate of children with CP per 1000 neonatal survivors (NNS) by plurality South Australia, Victoria and Western Australia combined (1995-2009)
Due to the small frequency of higher order multiple births, it is difficult to study CP in this sub-group of children. The ACPR is currently undertaking a collaborative research study with researchers from the Surveillance of Cerebral Palsy in Europe to pool de-identified data to examine the risk of CP amongst higher order multiple births.

SECTION 2: PRENATALLY OR PERINATALLY ACQUIRED CEREBRAL PALSY40
PREDOMINANT MOTOR TYPE
Table 19. Number and percentage of children with CP by predominant motor type (with spastic topography) and state/territory of birth (1993-2009)
Spastic Hemiplegia Diplegia Triplegia Quadriplegia Ataxic Dyskinetic Hypotonic TOTAL Unknown
n(%)^ n(%)^ n(%)^ n(%)^ n n(%)
ACT* 81 (88.0) 35 (43.2) 23 (28.4) 0 (0.0) 23 (28.4) (2.2) 7 (7.6) (2.2) 104 12 (11.5)
NSW* 1156 (83.8) 481 (41.6) 318 (27.5) 22 (1.9) 335 (29.0) 75 (5.4) 90 (6.5) 58 (4.2) 1549 170 (11.0)
NT* 71 (78.9) 29 (40.8) 20 (28.2) 0 (0.0) 22 (31.0) 5 (5.6) 10 (11.1) 4 (4.4) 96 6 (6.3)
QLD* 996 (86.9) 346 (34.7) 417 (41.9) 16 (1.6) 217 (21.8) 49 (4.3) 66 (5.8) 35 (3.1) 1255 109 (8.7)
SA* 564 (93.4) 228 (40.4) 197 (34.9) 15 (2.7) 124 (22.0) 19 (3.1) 18 (3.0) (0.5) 609 5 (0.8)
TAS 74 (88.1) 24 (32.4) 31 (41.9) (5.4) 15 (20.3) (4.8) 6 (7.1) 0 (0.0) 137 53 (38.7)
VIC* 1643 (86.7) 653 (39.7) 554 (33.7) 43 (2.6) 393 (23.9) 73 (3.9) 116 (6.1) 64 (3.4) 1930 34 (1.8)
WA* 922 (82.1) 353 (38.3) 430 (46.6) 24 (2.6) 115 (12.5) 81 (7.2) 97 (8.6) 23 (2.0) 1123 0 (0.0)
TOTAL 5507 2149 1990 124 1244 308 410 189 6803 389
COMBINED* 5433 (85.8) 2125 (39.1) 1959 (36.1) 120 (2.2) 1229 (22.6) 304 (4.8) 404 (6.4) 189 (3.0) 6666 336 (5.0)
< 5 cases (%)^ calculated by n/total n minus unknown n; provided to allow state/territory comparisons NB: ‘Dyskinetic cerebral palsy’ includes both dystonic and athetoid/choreoathetoid CP
Combined data indicates that spasticity was the predominant motor type of CP (85.8%). South Australia had a lower proportion of dyskinesia as the predominant motor type. The ACPR is endeavouring to determine whether these differences are aetiological.
Combined data indicates that hemiplegia (including monoplegia) is the most common topographical pattern of spasticity. However, if diplegia, triplegia and quadriplegia are grouped as bilateral spastic CP3 this group was predominant.
There is considerable variability in the proportions of hypotonic CP across jurisdictions (0.5%-4.4%). The ACPR Group is working with clinicians and researchers to consider the inclusion and exclusion criteria for hypotonic CP. The Surveillance of Cerebral Palsy in Europe do not include hypotonia as a sole motor type of CP. If cases of hypotonic CP were removed from combined ACPR data, there would be no difference in the reported rates.


37+ WEEKSn=3478
<37 WEEKSn=2652
HYPOTONIC ATAXIC DYSKINETIC TRI/QUADRIPLEGIA DIPLEGIA HEMIPLEGIA
3000
2500
2000
1500
1000
500
0
UNILATERAL SPASTIC CP BILATERAL SPASTIC CP
<37 WEEKS ≥37 WEEKS
NUMBER OF CHILDREN WITH CP
SECTION 2: PRENATALLY OR PERINATALLY ACQUIRED CEREBRAL PALSY42
Figure 11. Number and percentage of children with CP by predominant motor type and gestational age group in weeks, Australian Capital Territory, New South Wales, Northern Territory, Queensland, South Australia, Victoria and Western Australia combined (1993-2009)
Figure 12. Number of children with CP by predominant spastic subtype (unilateral or bilateral) and gestational age in weeks, Australian Capital Territory, New South Wales, Northern Territory, Queensland, South Australia, Victoria and Western Australia combined (1993-2009)
For information about the Australian Spasticity Assessment Scale, please see Love S, Gibson N, Smith N, Bear N, Blair E. Interobserver reliability of the Australian Spasticity Assessment Scale (ASAS). Dev Med Child Neurol. 2016;58 Suppl 2:18-24.
3.8%
1.8%
6.1%
3.2%
8.5%
3.5%
22.5%
19.3%
20.8%
44.4%
38.4%
27.8%

SOLE MOTOR TYPE SPASTICITY
SOLE MOTOR TYPE DYSKINESIA
MIXED SPASTIC AND DYSKINETIC MOTOR TYPES
100
90
80
70
60
50
40
30
20
10
0
SPASTIC ATAXIC DYSKINETIC HYPOTONIC NO SECONDARY TYPE RECORDED
PERCENTAGE OF CHILDREN WITH CP
Unilateral spastic Bilateral spastic Ataxic Dyskinetic Hypotonic
43AUSTRALIAN CEREBRAL PALSY REGISTER REPORT 2016
Figure 14. Number and percentage of children with CP by sole motor type (spastic or dyskinetic) and mixed motor type (spastic and dyskinetic), South Australia, Victoria and Western Australia combined (2007-2009*)
Figure 13. Number and percentage of children with CP by predominant and secondary motor type, South Australia, Victoria and Western Australia combined (2007-2009*)
Combined data suggests that amongst children who have a predominant spastic or dyskinetic motor type a minimum of 14% have a mixed motor type of both spastic and dyskinetic CP. The CP registers have historically focussed on collection of data pertaining to the predominant motor type so this figure is likely to be an underestimate. In recent years many states in Australia have adopted the Cerebral Palsy Description Form (see Appendix B) and the ACPR Group hopes this will assist with accurate data collection of mixed motor types.
82%n=457
14%n=77
4%n=20
*The 2007-2009 cohort was used for these figures, as this most recent triennium has the most complete available data from the CP registers at this time. NB: ‘Dyskinetic cerebral palsy’ includes both dystonic and athetoid/choreoathetoid CP.


45AUSTRALIAN CEREBRAL PALSY REGISTER REPORT 2016
Table 20. Number and percentage of children with CP by Gross Motor Function Classification System24 levels (GMFCS) and state/territory of birth (1993-2009)
I II III IV V Total Unknown
n(%)^ n(%)^ n(%)^ n(%)^ n(%)^ n n(%)
ACT* 34 (36.2) 19 (20.2) 13 (13.8) 15 (16.0) 13 (13.8) 104 10 (9.6)
NSW* 528 (37.2) 299 (21.0) 164 (11.5) 192 (13.5) 238 (16.7) 1549 128 (8.3)
NT* 38 (40.4) 21 (22.3) 7 (7.4) 7 (7.4) 21 (22.3) 96 (2.1)
QLD* 340 (29.3) 304 (26.2) 167 (14.4) 181 (15.6) 169 (14.6) 1255 94 (7.5)
SA* 193 (44.0) 90 (20.5) 55 (12.5) 46 (10.5) 55 (12.5) 609& (0.2)
TAS 29 (42.0) 12 (17.4) 8 (11.6) 8 (11.6) 12 (17.4) 137 68 (49.6)
VIC* 656 (35.4) 493 (26.6) 193 (10.4) 232 (12.5) 279 (15.1) 1930 77 (4.0)
WA 252 (47.0) 93 (17.4) 55 (10.3) 59 (11.0) 77 (14.4) 1123 587 (52.3)
TOTAL 2070 1331 662 740 864 6803 967
COMBINED* 1789 (35.3) 1226 (24.2) 599 (11.8) 673 (13.3) 775 (15.3) 5543 312 (5.8)
< 5 cases &South Australia Total CP includes n=169 that had not had their follow-up assessment at the time of data provision (%)^ calculated by n/total n minus unknown n and SA n not assessed; provided to allow state/territory comparisons
Combined data from South Australia and Victoria indicates that at the age of 5 years the predominant levels of gross motor function are GMFCS I and II (59.2%). More than half the children with CP are able to walk indoors and on level surfaces outdoors at age 5 years without needing an assistive mobility device.
GROSS MOTOR FUNCTION

1.6
1.4
1.2
1.0
0.8
0.6
0.4
0.2
0.0
SA VIC
RATE OF CHILDREN WITH CP PER 1000NNS
GMFCS I - II
1995-1997 1998-2000 2001-2003 2004-2006 2007-2009
0.8
0.7
0.6
0.5
0.4
0.3
0.2
0.1
0.0
SA VIC
RATE OF CHILDREN WITH CP PER 1000NNS
GMFCS III - V
1995-1997 1998-2000 2001-2003 2004-2006 2007-2009
SECTION 2: PRENATALLY OR PERINATALLY ACQUIRED CEREBRAL PALSY46
Table 21. Number and rate of children with CP per 1000 neonatal survivors (NNS), by Gross Motor Function Classification System (GMFCS) category (I-II or III-V), South Australia and Victoria (1995-2009)
GMFCS I-II GMFCS III-VBirth years NNS CP Rate/1000 NNS CP Rate/1000 NNS
SA& 1995-1997 56786 82 1.4 31 0.51998-2000 54641 51 0.9 31 0.62001-2003 52757 35 0.7 23 0.42004-2006 53986 49 0.9 25 0.52007-2009 59049 42 0.7 39 0.7
VIC 1995-1997 186944 188 1.0 141 0.81998-2000 185419 216 1.2 128 0.72001-2003 186722 233 1.2 135 0.72004-2006 197671 218 1.1 119 0.62007-2009 197671* 186 0.9 105 0.5
*Total Victorian NNS for previous triennium reported here as complete NNS data not available for this triennium &A further n=169 SA children had not had their follow-up assessment at the time of data provision
Figure 15. Rate of children with CP per 1000 neonatal survivors (NNS), by Gross Motor Function Classification System (GMFCS) category (I-II or III-V), South Australia and Victoria (1995-2009)

100
90
80
70
60
50
40
30
20
10
0
MONO/HEMIPLEGIA DIPLEGIA TRI/QUADRIPLEGIA ATAXIC HYPOTONICDYSKINETIC
PERCENTOF CHILDREN WITH CP
GMFCS I GMFCS II GMFCS III GMFCS IV GMFCS V
47AUSTRALIAN CEREBRAL PALSY REGISTER REPORT 2016
Figure 16. Percentage of children with CP by Gross Motor Function Classification System (GMFCS) level and predominant motor type at 5 years, South Australia and Victoria combined (1993-2009)

SECTION 2: PRENATALLY OR PERINATALLY ACQUIRED CEREBRAL PALSY48
Table 22. Number and percentage of identified congenital anomalies amongst children with CP by state/territory of birth (1993-2009)
No known congenital anomaly
n(%)^
One or more congenital anomalies
n(%)^
Total Unknownn(%)
ACT* 75 (82.4) 16 (17.6) 104 13 (12.5)
NSW* 1027 (78.5) 281 (21.5) 1549 241 (15.6)
NT 44 (73.3) 16 (26.7) 96 36 (37.5)
QLD* 819 (72.9) 304 (27.1) 1255 132 (10.5)
SA*# 365 (59.9) 244 (40.1) 609 0 (0.0)
TAS 97 (96.0) (4.0) 137 36 (26.3)
VIC* 1506 (78.5) 413 (21.5) 1930 11 (0.6)
WA* 856 (76.2) 267(23.8) 1123 0 (0.0)
TOTAL 4789 1545 6803 469
COMBINED* 4648 (75.3) 1525 (24.7) 6570 397 (6.0)
< 5 cases (%)^ calculated by n/total n minus unknown n; provided to allow state/territory comparisons # The SA CP Register is directly linked to SA Birth Defects Register – this figure therefore represents a more likely proportion of children with CP who have a congenital anomaly.
The proportions of children with CP with reported congenital anomalies range from 21.8% to 40.1% in the three long-standing CP registers.
Researchers from the ACPR Group are now investigating this risk factor through a collaboration between the Surveillance of Cerebral Palsy Europe and EUROCAT. This large study will explore the co-occurrence of congenital anomalies and CP. “The Comprehensive CA-CP Study” will link data between CP and congenital anomaly registers in regions of Europe and Australia and subsequently pool data to create a sufficiently large dataset to explore these heterogeneous conditions.
CONGENITAL ANOMALIES
For further information about congenital anomalies as a risk factor for CP, please see McIntyre S, Blair E, Goldsmith S, Badawi N, Gibson C, Scott H, et al. Congenital anomalies in cerebral palsy: where to from here? Dev Med Child Neurol. 2016;58 Suppl 2:71-5.
SECTION 2: PRENATALLY OR PERINATALLY ACQUIRED CEREBRAL PALSY50
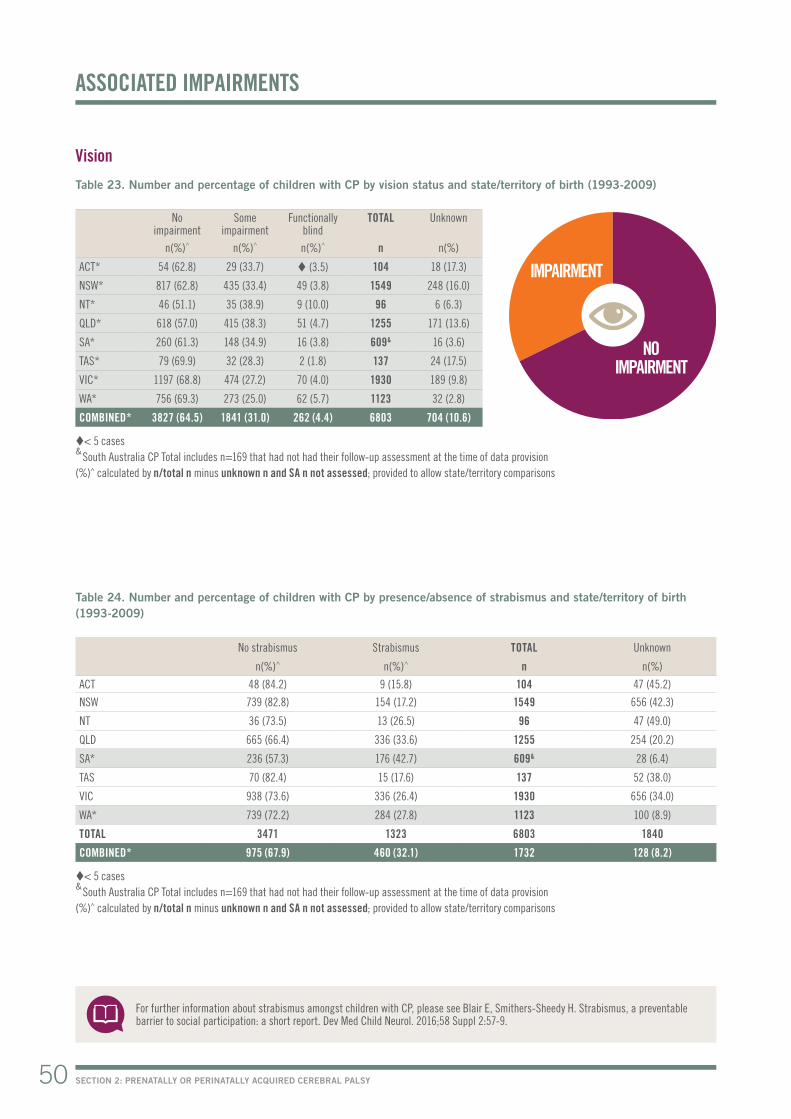
Vision
Table 23. Number and percentage of children with CP by vision status and state/territory of birth (1993-2009)
No impairment
Someimpairment
Functionallyblind
TOTAL Unknown
n(%)^ n(%)^ n(%)^ n n(%)
ACT* 54 (62.8) 29 (33.7) (3.5) 104 18 (17.3)
NSW* 817 (62.8) 435 (33.4) 49 (3.8) 1549 248 (16.0)
NT* 46 (51.1) 35 (38.9) 9 (10.0) 96 6 (6.3)
QLD* 618 (57.0) 415 (38.3) 51 (4.7) 1255 171 (13.6)
SA* 260 (61.3) 148 (34.9) 16 (3.8) 609& 16 (3.6)
TAS* 79 (69.9) 32 (28.3) 2 (1.8) 137 24 (17.5)
VIC* 1197 (68.8) 474 (27.2) 70 (4.0) 1930 189 (9.8)
WA* 756 (69.3) 273 (25.0) 62 (5.7) 1123 32 (2.8)
COMBINED* 3827 (64.5) 1841 (31.0) 262 (4.4) 6803 704 (10.6)
< 5 cases & South Australia CP Total includes n=169 that had not had their follow-up assessment at the time of data provision(%)^ calculated by n/total n minus unknown n and SA n not assessed; provided to allow state/territory comparisons
ASSOCIATED IMPAIRMENTS
Table 24. Number and percentage of children with CP by presence/absence of strabismus and state/territory of birth (1993-2009)
No strabismus Strabismus TOTAL Unknown
n(%)^ n(%)^ n n(%)
ACT 48 (84.2) 9 (15.8) 104 47 (45.2)
NSW 739 (82.8) 154 (17.2) 1549 656 (42.3)
NT 36 (73.5) 13 (26.5) 96 47 (49.0)
QLD 665 (66.4) 336 (33.6) 1255 254 (20.2)
SA* 236 (57.3) 176 (42.7) 609& 28 (6.4)
TAS 70 (82.4) 15 (17.6) 137 52 (38.0)
VIC 938 (73.6) 336 (26.4) 1930 656 (34.0)
WA* 739 (72.2) 284 (27.8) 1123 100 (8.9)
TOTAL 3471 1323 6803 1840
COMBINED* 975 (67.9) 460 (32.1) 1732 128 (8.2)
< 5 cases & South Australia CP Total includes n=169 that had not had their follow-up assessment at the time of data provision(%)^ calculated by n/total n minus unknown n and SA n not assessed; provided to allow state/territory comparisons
For further information about strabismus amongst children with CP, please see Blair E, Smithers-Sheedy H. Strabismus, a preventable barrier to social participation: a short report. Dev Med Child Neurol. 2016;58 Suppl 2:57-9.
NO IMPAIRMENT
IMPAIRMENT

51AUSTRALIAN CEREBRAL PALSY REGISTER REPORT 2016
Hearing
Table 25. Number and percentage of children with CP by hearing status and state/territory of birth (1993-2009)
No impairment
Someimpairment
Bilateraldeafness
TOTAL Unknown
n(%)^ n(%)^ n(%)^ n n(%)
ACT* 80 (87.0) 10 (10.9) (2.2) 104 12 (11.5)
NSW* 1188 (86.8) 115 (8.4) 66 (4.8) 1549 180 (11.6)
NT* 64 (73.6) 20 (23.0) (3.4) 96 9 (9.4)
QLD* 989 (88.2) 107 (9.5) 25 (2.2) 1255 134 (10.7)
SA* 409 (94.5) 17 (3.9) 7 (1.6) 609& 7 (1.6)
TAS* 111 (95.7) 5 (4.3) 0 (0.0) 137 21 (15.3)
VIC* 1503 (86.5) 181 (10.4) 53 (3.1) 1930 193 (10.0)
WA* 998 (92.2) 63 (5.8) 21 (1.9) 1123 41 (3.7)
COMBINED* 5342 (88.5) 518 (8.6) 177 (2.9) 6803 597 (9.9)
< 5 cases & South Australia CP Total includes n=169 that had not had their follow-up assessment at the time of data provision(%)^ calculated by n/total n minus unknown n and SA n not assessed; provided to allow state/territory comparisons
Table 26. Number and percentage of children with CP by speech status and state/territory of birth (1993-2009)
No impairment
Some impairment
Non-verbal TOTAL Unknown
n(%)^ n(%)^ n(%)^ n n(%)
ACT* 38 (40.4) 36 (38.3) 20 (21.3) 104 10 (9.6)
NSW* 465 (33.1) 612 (43.6) 328 (23.3) 1549 144 (9.3)
NT* 30 (33.3) 30 (33.3) 30 (33.3) 96 6 (6.3)
QLD* 460 (40.4) 406 (35.6) 273 (24.0) 1255 116 (9.2)
SA* 194 (44.5) 185 (42.4) 57 (13.1) 609& (0.9)
TAS* 60 (51.3) 46 (39.3) 11 (9.4) 137 20 (14.6)
VIC* 683 (39.6) 564 (32.7) 476 (27.6) 1930 207 (10.7)
WA* 411 (38.3) 392 (36.6) 269 (25.1) 1123 51 (4.5)
COMBINED* 2341 (38.5) 2271 (37.4) 1464 (24.1) 6803 558 (8.4)
< 5 cases & South Australia CP Total includes n=169 that had not had their follow-up assessment at the time of data provision(%)^ calculated by n/total n minus unknown n and SA n not assessed; provided to allow state/territory comparisons
For further information about associated impairments amongst children with CP, please see Delacy MJ, Reid SM. Profile of associated impairments at age 5 years in Australia by cerebral palsy subtype and Gross Motor Function Classification System level for birth years 1996 to 2005. Dev Med Child Neurol. 2016;58 Suppl 2:50-6.
Speech
NO IMPAIRMENT
NO IMPAIRMENT
IMPAIRMENT
IMPAIRMENT

SECTION 2: PRENATALLY OR PERINATALLY ACQUIRED CEREBRAL PALSY52
Epilepsy
Table 27. Number and percentage of children with CP by presence/absence of epilepsy and state/territory of birth (1993-2009)
No epilepsy Resolved# Epilepsy TOTAL Unknown
n(%)^ n(%)^ n(%)^ n n(%)
ACT* 68 (72.3) (4.3) 22 (23.4) 104 10 (9.6)
NSW* 955 (68.3) 71 (5.1) 372 (26.6) 1549 151 (9.7)
NT* 49 (53.3) (2.2) 41 (44.6) 96 (4.2)
QLD* 740 (64.6) 46 (4.0) 359 (31.4) 1255 110 (8.8)
SA* 317 (74.2) 23 (5.4) 87 (20.4) 609& 13 (3.0)
TAS* 85 (68.0) 8 (6.4) 32 (25.6) 137 12 (8.8)
VIC* 1268 (68.1) 37 (2.0) 557 (29.9) 1930 68 (3.5)
WA* 755 (68.7) 15 (1.4) 329 (29.9) 1123 24 (2.1)
COMBINED* 4237 (67.9) 206 (3.3) 1799 (28.8) 6803 392 (5.9)
< 5 cases & South Australia CP Total includes n=169 that had not had their follow-up assessment at the time of data provision(%)^ calculated by n/total n minus unknown n and SA n not assessed; provided to allow state/territory comparisons Resolved # = Resolved by 5 years of age (seizure free for two or more years without medication) Epilepsy is defined as two or more afebrile seizures before age 5 years; does not include neonatal seizures.
Intellectual impairment
Table 28. Number and percentage of children with CP by level of intellectual impairment and state/territory of birth (1993-2009)
No impairment
Unconfirmedprobably
borderline or no impairment
Unconfirmedprobably greater than borderline
impairment
Mildimpairment
Moderate –severeimpairment
TOTAL Unknown
n(%)^ n(%)^ n(%)^ n(%)^ n(%)^ n n(%)
ACT* 36 (41.4) 11 (12.6) 17 (19.5) 9 (10.3) 14 (16.1) 104 17 (16.3)
NSW* 480 (35.1) 153 (11.2) 210 (15.4) 172 (12.6) 353 (25.8) 1549 181 (11.7)
NT* 39 (41.9) (4.3) 20 (21.5) 8 (8.6) 22 (23.7) 96 (3.1)
QLD* 432 (38.4) 130 (11.5) 174 (15.5) 121 (10.7) 269 (23.9) 1255 129 (10.3)
SA* 259 (59.5) 27 (6.2) 33 (7.6) 54 (12.4) 62 (14.3) 609& 5 (1.1)
TAS* 62 (54.4) 8 (7.0) 8 (7.0) 15 (13.2) 21 (18.4) 137 23 (16.8)
VIC* 510 (29.8) 376 (22.0) 303 (17.7) 189 (11.0) 334 (19.5) 1930 218 (11.3)
WA* 651 (58.0) 10 (0.9) 113 (10.1) 97 (8.6) 251 (22.4) 1123 (0.1)
COMBINED* 2469 (40.8) 719 (11.9) 878 (14.5) 665 (11.0) 1326 (21.9) 6803 577 (8.7)
< 5 cases & South Australia CP Total includes n=169 that had not had their follow-up assessment at the time of data provision(%)^ calculated by n/total n minus unknown n and SA n not assessed; provided to allow state/territory comparisons
For further information about associated impairments amongst children with CP, please see Delacy MJ, Reid SM. Profile of associated impairments at age 5 years in Australia by cerebral palsy subtype and Gross Motor Function Classification System level for birth years 1996 to 2005. Dev Med Child Neurol. 2016;58 Suppl 2:50-6.
NO IMPAIRMENT
IMPAIRMENT

53AUSTRALIAN CEREBRAL PALSY REGISTER REPORT 2016
Figure 17. Percentage of children with CP by level of intellectual impairment, all state/territories combined (1993-2009)
Combined data indicates that associated impairments were common for children with CP. At the age of five: 28.8% had epilepsy; >50% had an intellectual impairment; >60% had a speech impairment; >30% had a vision impairment and >10% had a hearing impairment.
NO IMPAIRMENT
41%
UNCONFIRMED IMPAIRMENT
26%
CONFIRMED IMPAIRMENT
33%
MILD IMPAIRMENT
11%MODERATE-SEVERE
IMPAIRMENT 22%

POST-NEONATALLY ACQUIRED CEREBRAL PALSY3


SECTION 3: POST-NEONATALLY ACQUIRED CEREBRAL PALSY56
Prevalence of CP where there is an identified post-neonatal cause
Table 29. Number and rate of children with post-neonatally acquired (PNN) CP per 10,000 live births (LB) and state/territory of birth (1993-2009)
PNN acquired CP
Percentage of all CP
LB Rate of children with PNN CP per 10,000 LB
ACT 13 11.1 78697 1.7
NSW 122 7.4 1509760 0.8
NT 18 14.8 62643 2.7
QLD 53 4.1 862792 0.6
SA* 29 4.5 317536 0.9 (95% CI 0.6, 1.2)
TAS 1.4 104187 0.2
VIC* 118 5.8 1104389 1.1 (95%CI 0.9, 1.3)
WA* 83 6.9 448215 1.9 (65% CI 1.5, 2.5)
TOTAL 438 6.0 4488219 1.0
COMBINED* 230 6.0 1870140 1.2 (95% CI 1.0,1.4)
< 5 cases
PREVALENCE
POST-NEONATAL CAUSE
Table 30. Number and percentage of children with CP by identified post-neonatal cause of CP, South Australia, Victoria and Western Australia (1993-2009)
POST-NEONATAL CAUSE CPn(%)
Viral/bacterial infection unspecified 60 (26.1)
Cerebrovascular accident associated with surgery 15 (6.5)
Cerebrovascular accident associated with cardiac complications 12 (5.2)
Spontaneous/other cerebrovascular accident 41 (17.8)
Fall 7 (3.0)
Non-accidental injury 29 (12.6)
Other head injury (1.7)
Near drowning 6 (2.6)
Apparent life threatening event 7 (3.0)
Post-seizure 10 (4.3)
Peri-operative hypoxia 5 (2.2)
Other post-natal event 25 (10.9)
Motor vehicle accident 9 (3.9)
TOTAL 230
Combined data indicates the prevalence for post-neonatally acquired CP to be 1.2 per 10,000 live births. The predominant post-neonatal cause of CP was cardiovascular accident being either spontaneous, associated with surgery or with cardiac complications.

57AUSTRALIAN CEREBRAL PALSY REGISTER REPORT 2016
Figure 18. Number and percentage of children with post-neonatally acquired (PNN) CP by sex, all states/territories (1993-2009)
Combined data demonstrates that males are at a higher risk of post-neonatally acquired CP. 57% of the cohort of children with CP due to post-neonatal causes were male, compared to 51% of the Australian population21.
SEX
MATERNAL AGE AT TIME OF DELIVERY
Table 31. Number and percentage of children with post-neontally acquired CP by maternal age at delivery, all state/territories combined (1993-2009)
<20 20-24 25-29 30-34 35-39 40+ TOTAL Unknown
n(%)^ n(%)^ n(%)^ n(%)^ n(%)^ n(%)^ n n(%)
All states / territories 41 (10.9) 86 (22.8) 91 (24.1) 102 (27.1) 48 (12.7) 9 (2.4) 438 61 (13.9 )
(%)^ calculated by n/total n minus unknown n
MALES
57%FEMALES
43%

SOLE MOTOR TYPE SPASTICITY
SOLE MOTOR TYPE DYSKINESIA
MIXED SPASTIC AND DYSKINETIC MOTOR TYPES
SECTION 3: POST-NEONATALLY ACQUIRED CEREBRAL PALSY58
Table 32. Number and percentage of children with post-neonatally acquired (PNN) CP by predominant motor type and spastic topography, South Australia, Victoria and Western Australia combined (1993-2009)
Spastic Hemiplegia Diplegia Tri / Quad riplegia
Ataxic Dyskinetic Hypotonic TOTAL Unknown
n(%)^ n(%) n(%) n(%) n(%)^ n(%)^ n(%)^ n n(%)
South Australia, Victoria and Western Australia combined
372 (89.9) 193 (51.9) 41 (11.0) 138 (37.1) 17 (4.1) 16 (3.9) 9 (2.2) 438 24 (5.5)
(%)^ calculated by n/total n minus unknown n; provided to allow state/territory comparisons NB: ‘Dyskinetic cerebral palsy’ includes both dystonic and athetoid/choreoathetoid CP
Combined data indicates that spasticity was the most predominant motor type of CP (89.9%) and hemiplegia (including monoplegia) or unilateral spastic CP (52%) the most common topographical pattern of spasticity.
PREDOMINANT MOTOR TYPE AND TOPOGRAPHY
*Only data 2007-2009 were used for these figures, as this most recent triennium has the most complete available data from the CP registers at this time. NB: ‘Dyskinetic cerebral palsy’ includes both dystonic and athetoid/choreoathetoid CP
Combined data suggests that amongst children who have a predominant spastic or dyskinetic motor type, a minimum of 15% have a mixed motor type of both spastic and dyskinetic CP. The CP registers have historically focussed on collection of data pertaining to the predominant motor type and so this figure is likely to be an underestimate. In recent years many states in Australia have adopted the Cerebral Palsy Description Form (see Appendix B) and the ACPR Group hopes this will assist with accurate data collection of mixed motor types.
Figure 19. Number and percentage of children with post-neonatally acquired CP by sole motor type (spastic or dyskinetic) and mixed motor type (spastic and dyskinetic), South Australia, Victoria and Western Australia combined (2007-2009*)
83%n=38
15%n=7
2%n<5

59AUSTRALIAN CEREBRAL PALSY REGISTER REPORT 2016
Table 33. Number and percentage of children with post-neonatally acquired CP by associated impairment status, all states/territories combined (1993-2009)
Associated Impairment No impairmentn(%)^
Some impairment n(%)^
Severe impairment{}
n(%)^TOTAL Unknown
n(%)
Vision 212 (53.5) 141 (35.6) 43 (10.9) 438 42 (9.6)
Hearing 338 (84.5) 43 (10.8) 19 (4.8) 438 38 (8.7)
Speech 107 (26.3) 165 (40.5) 135 (33.2) 438 31 (7.1)
Intellectual impairment 113 (28.0) 171 (42.4) 119 (29.5) 438 35 (8.0)
No epilepsy n(%)^
Resolved#
n(%)^Epilepsy
n(%)^ TOTAL Unknown
n(%)
Epilepsy 188 (44.2) 37 (8.7) 200 (47.1) 438 13 (3.0)
(%)^ calculated by n/total n minus unknown n {} Severe impairments: vision (functional blindness), hearing (bilateral deafness), speech (non-verbal communication), intellectual impairment (moderate to severe impairment) Resolved # = Resolved by 5 years of age (seizure free for two or more years without medication) Epilepsy is defined as two or more afebrile seizures before age 5 years; does not included neonatal seizures.
Combined data show that associated impairments were common for children with CP. At the age of five: almost 50% had epilepsy; >70% had an intellectual impairment; >70% had a speech impairment; >40% had a vision impairment and >15% had a hearing impairment.
ASSOCIATED IMPAIRMENTS

THIS SECTION HIGHLIGHTS THE WORK OF CP REGISTERS
WHICH ARE UTILISING THE ACPR INFRASTRUCTURE AND
SHARE THE SAME MINIMUM DATA AS THE ACPR. IN THE
FUTURE AS THESE CP REGISTERS BECOME MORE ESTABLISHED
IT IS PLANNED THAT OPPORTUNITIES FOR SHARED RESEARCH
AND REPORTING BETWEEN THE ACPR AND THESE NEW CP
REGISTERS WILL BE POSSIBLE.
AFFILIATED CEREBRAL PALSY REGISTERS4

SECTION 4: AFFILIATED CEREBRAL PALSY REGISTERS62
Thanks to a never ending supply of patience, perseverance and passion from Professor Sue Stott and Dr Anna Mackey, the New Zealand Cerebral Palsy Register began active recruitment in April 2015. It would also not have been possible without the financial support from the Starship Foundation’s fifth annual Friends of Starship Diamonds & Stars Tea Party in 2014 fundraiser and contributions from the Cerebral Palsy Society and Allergan.
The Past
To assist with establishing the aims and potential benefits of having a New Zealand register, a survey was sent to relevant health professionals in 2012 asking, “What do people want to gain from a New Zealand register?”. Together with the publication of a poster presentation at the 2012 International Cerebral Palsy Conference in Pisa(1) the aims of the register were established:
• Improve understanding of CP: prevalence, impact of the condition, service planning
• Evaluate clinical practice: surveillance, preventative practice, service quality
• Identify / address any potential disparities• Facilitate research: causes, prevention and clinical practice
The Present
A dedicated team of a research officer and an honorary research associate working part-time have spent the last eight months publishing marketing material through written and web based avenues, establishing systems and processes to manage recruitment and ethical obligations, and generally promoting the NZCPR at every available opportunity. To date we have almost 100 registrants and we are looking forward to sharing our de-identified data with Australia in 18 months’ time.
The Future
Exciting developments and plans for 2016 include the formation of a NZCPR Governance Committee, our very own New Zealand website going “live” and putting together a robust “opt-off” ethics proposal for Health and Disability Ethics Committee approval which we feel will assist with increasing the number of registrations. The focus will be on assisting individual District Health Boards with outstanding locality ethics to obtain approval and to continue assisting local paediatric teams with recruitment to ensure that there is national representation of the CP population on the register.
THE NEW ZEALAND CEREBRAL PALSY REGISTER
Reference: (1) Mackey, A H., O’Callaghan, M., & Stott, N S. (2012) Development of a cerebral palsy population register: case study in New Zealand. Proceedings of 4th International Cerebral Palsy conference, Pisa, Italy, p.243.
TARGET POPULATION: All people with cerebral palsy residing in New Zealand
CONTACT DETAILS: Paediatric Orthopaedics, Starship Children’s Hospital, Park Road, Auckland, New Zealand
WEBSITE: https://nz.cpregister.com/
EMAIL: [email protected]
PHONE NUMBER: +64(0)93074949 ext 21898
ETHICS COMMITTEE REFERENCE NUMBER: 13/NTA/130
NZCPR
Professor Susan Stott, Ms Alexandra Sorhage, Dr Anna Mackey
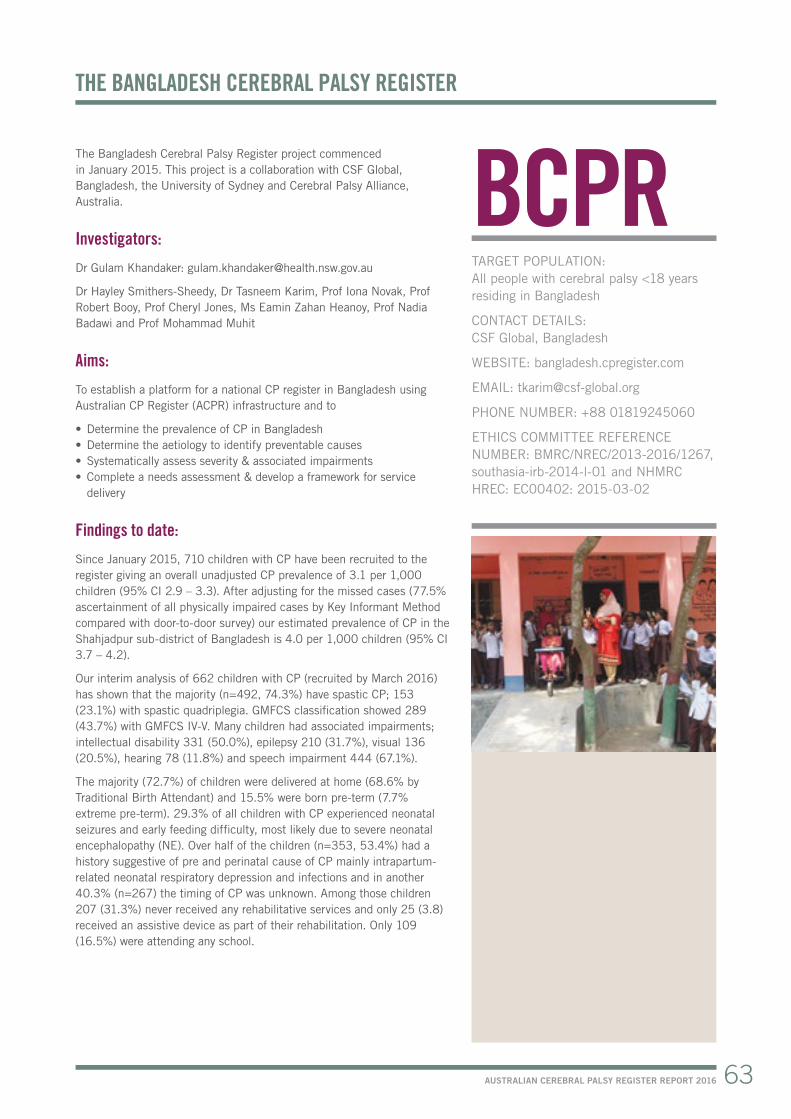
63AUSTRALIAN CEREBRAL PALSY REGISTER REPORT 2016
TARGET POPULATION: All people with cerebral palsy <18 years residing in Bangladesh
CONTACT DETAILS: CSF Global, Bangladesh
WEBSITE: bangladesh.cpregister.com
EMAIL: [email protected]
PHONE NUMBER: +88 01819245060
ETHICS COMMITTEE REFERENCE NUMBER: BMRC/NREC/2013-2016/1267, southasia-irb-2014-l-01 and NHMRC HREC: EC00402: 2015-03-02
The Bangladesh Cerebral Palsy Register project commenced in January 2015. This project is a collaboration with CSF Global, Bangladesh, the University of Sydney and Cerebral Palsy Alliance, Australia.
Investigators:
Dr Gulam Khandaker: [email protected]
Dr Hayley Smithers-Sheedy, Dr Tasneem Karim, Prof Iona Novak, Prof Robert Booy, Prof Cheryl Jones, Ms Eamin Zahan Heanoy, Prof Nadia Badawi and Prof Mohammad Muhit
Aims:
To establish a platform for a national CP register in Bangladesh using Australian CP Register (ACPR) infrastructure and to
• Determine the prevalence of CP in Bangladesh• Determine the aetiology to identify preventable causes • Systematically assess severity & associated impairments • Complete a needs assessment & develop a framework for service
delivery
Findings to date:
Since January 2015, 710 children with CP have been recruited to the register giving an overall unadjusted CP prevalence of 3.1 per 1,000 children (95% CI 2.9 – 3.3). After adjusting for the missed cases (77.5% ascertainment of all physically impaired cases by Key Informant Method compared with door-to-door survey) our estimated prevalence of CP in the Shahjadpur sub-district of Bangladesh is 4.0 per 1,000 children (95% CI 3.7 – 4.2).
Our interim analysis of 662 children with CP (recruited by March 2016) has shown that the majority (n=492, 74.3%) have spastic CP; 153 (23.1%) with spastic quadriplegia. GMFCS classification showed 289 (43.7%) with GMFCS IV-V. Many children had associated impairments; intellectual disability 331 (50.0%), epilepsy 210 (31.7%), visual 136 (20.5%), hearing 78 (11.8%) and speech impairment 444 (67.1%).
The majority (72.7%) of children were delivered at home (68.6% by Traditional Birth Attendant) and 15.5% were born pre-term (7.7% extreme pre-term). 29.3% of all children with CP experienced neonatal seizures and early feeding difficulty, most likely due to severe neonatal encephalopathy (NE). Over half of the children (n=353, 53.4%) had a history suggestive of pre and perinatal cause of CP mainly intrapartum-related neonatal respiratory depression and infections and in another 40.3% (n=267) the timing of CP was unknown. Among those children 207 (31.3%) never received any rehabilitative services and only 25 (3.8) received an assistive device as part of their rehabilitation. Only 109 (16.5%) were attending any school.
THE BANGLADESH CEREBRAL PALSY REGISTER
BCPR

SECTION 4: AFFILIATED CEREBRAL PALSY REGISTERS64
Collaboration with Wheelchairs for Kids
The Bangladesh CP Register project has provided the opportunity to develop a partnership with Wheelchairs for Kids and Rotary Club of Turramurra. This has allowed the distribution of 332 wheelchairs across Shahjadpur to date and installation of 50 wheelchair accessible ramps at the houses and schools of the children with CP registered in the BCPR. Transportation of those wheelchairs from Australia was supported by tna Solutions. This initiative has provided wheeled mobility to children with CP, making an enormous difference to the daily lives of both the children and their families.
World Cerebral Palsy Day
Families and children with CP celebrated World CP Day in 2015. Events such as this create a sense of community for children with CP and their families. World CP Day provided opportunity for families to come together and has been an important initiative to raise awareness of CP and to reduce some of the cultural stigma attached to disability.
Current research projects
The BCPR is a key source of recruitment for a variety of current research projects including but not limited to:
• CP oral health study - Factors affecting dental caries experience among children and adolescents with CP in rural Bangladesh
• Bangladesh CP Quality of Life study - Health related quality of life of adolescents with CP in rural Bangladesh and the psychological wellbeing of their primary caregivers
• Early diagnosis of CP - General Movement Assessment (GMA) and early diagnosis of CP at community level
Publications and conference presentations
Khandaker G, Smithers-Sheedy H, Islam J, Alam M, Jung J, Novak I, Booy R, Jones C. Bangladesh Cerebral Palsy Register (BCPR): a pilot study to develop a national cerebral palsy (CP) register with surveillance of children for CP. BMC neurology. 2015;15:173.
Khandaker G, Smithers-Sheedy H, Islam J, Alam M, Jung J, Novak I, Booy R, Jones C, Badawi N, Muhit M. Bangladesh Cerebral Palsy Register (BCPR): a pilot study towards developing a national cerebral palsy (CP) register and surveillance of children with CP. 28th EACD Annual Meeting - Stockholm, 1-4 June 2016 [Poster]
Jung J, Muhit M, Smithers-Sheedy H, Islam J, Novak I, Booy R, Jones C, Badawi N, Khandaker G. Nutritional status of children with Cerebral Palsy (CP) in rural Bangladesh: preliminary results from Bangladesh Cerebral Palsy Register (BCPR) pilot study. 28th EACD Annual Meeting - Stockholm, 1-4 June 2016 [Oral]
Akhter R, Hassan N, Martin F, Muhit M, Rahman R, Smithers-Sheedy H, Jones C, Badawi N, Khandaker G. Factors Affecting Dental Caries Among Bangladeshi Children With Cerebral Palsy. 94th General Session & Exhibition of the IADR in Seoul, Republic of Korea on 21st June 2016 [Poster].
Khandaker G, Smithers-Sheedy H, Shahama S, Huda A, Novak I, Booy R, Jones C, Badawi N, Muhit M. Bangladesh Cerebral Palsy Register (BCPR): developing a cerebral palsy (CP) register and surveillance of children with CP in a typical low-and middle-income country. 70th Annual Meeting of the American Academy for Cerebral Palsy and Developmental Medicine (AACPDM) will take place September 20-24, 2016 in Hollywood, Florida [Oral].

65AUSTRALIAN CEREBRAL PALSY REGISTER REPORT 2016
Information and contact details of the contributing State and Territory CP Registers
Name Date of Establishment Custodian Organisation Type of Consent Required Contactable for Future Research
NSW and ACT Cerebral Palsy Register
2005 Cerebral Palsy Alliance IC Yes
Northern Territory Cerebral Palsy Register
2008 Centre for Disease Control IC Yes
Queensland Cerebral Palsy Register
2006 CPL - Choice, Passion, Life and Queensland Department of Communities, Child Safety and Disability Services
IC 90%
South Australian Cerebral Palsy Register
1998 Women‘s and Children’s Health Network
L, IC Yes
Tasmanian Cerebral Palsy Register
2008 St Giles in collaboration with Cerebral Palsy Alliance
IC Yes
Victorian Cerebral Palsy Register
1986 Murdoch Childrens Research Institute, Royal Children’s Hospital, Melbourne
E, IC,O Yes (Approximately 80%)
Western Australian Register of Developmental Anomalies - Cerebral Palsy
1977 Department of Health WA E, O No
IC Registration after gaining individual consent, L Legislation allowing collection of data, E Ethics approval to collect data without informed consent, O Other e.g. combination or alternative
APPENDIX A

66 AUSTRALIAN CEREBRAL PALSY REGISTER REPORT 2016
New South Wales and Australian Capital Territory Cerebral Palsy Registers
Cerebral Palsy Alliance Research Institute, University of Sydney
Target population: Individuals who have acquired CP before age 5 years who were born or currently live in New South Wales or the Australian Capital Territory.
Dr Sarah McIntyre Cerebral Palsy Alliance Research Institute 187 Allambie RdAllambie Heights NSW 2100 [email protected] (02) 9479 7200
Purpose: The main aims of the CP Register are to monitor incidence and prevalence of CP, gain further understanding about the causes of CP, evaluate preventative strategies and assist in planning services for children and adults who have CP. These goals represent the aims of the NSW and ACT CP Register and are aligned with this register’s partnership with the Australian Cerebral Palsy Register.
We are moving into an era where prevention of secondary impairments has become a particularly high priority for the NSW CP Register and CP Alliance due to the resounding success of a follow-up program for CP, called CPUP, which was initiated in Sweden in 1994 and the establishment of the Australian Hip Surveillance Guidelines. These programs have reduced the incidence of hip dislocation, pain, scoliosis and contractures amongst children with CP. An extension to the CP Register, called CP Check-UpTM has been built and now provides a platform for collection of surveillance data in NSW / ACT.
For further information, please contact lead Research Project Officer Petra Karlsson at [email protected]
Northern Territory Cerebral Palsy Register
Department of Health and Families
Target population: All individuals who have CP, who were born in, or live in the Northern Territory.
Rebecca Jarman and Dr Keith EdwardsCentre for Disease ControlBuilding 4, Royal Darwin Hospital NT 0811Australia [email protected] (08) 8922 8044
Purpose: The main aims of the CP Register are to determine the prevalence, location and functional status of people in the Northern Territory who have CP. This information is used to assist in the planning, development and provision of services, and to support research into CP.

67AUSTRALIAN CEREBRAL PALSY REGISTER REPORT 2016
Queensland Cerebral Palsy Register
CPL - Choice, Passion, Life and Queensland Department of Communities, Child Safety and Disability Services
Target population: All people were born in or receive services in Queensland who have CP.
Michael deLacy QCPR PO Box 386 Fortitude Valley Brisbane QLD 4006 Australia [email protected](07) 3358 8122
Purpose: Determine the number, locations and general abilities of the population of people with CP in QLD for use by government, non-government agencies and people with CP in service planning. Provide a population resource for intervention trials. Contribute to investigations into causes and prevention of CP.
The South Australian Cerebral Palsy Register (part of the South Australian Birth Defects Register)
Women’s and Children’s Health Network
Target population: All children who live in or were born in South Australia who have been diagnosed with CP, including post-neonatally acquired CP up to 2 years of age.
Dr Catherine Gibson and Heather Scott Women’s and Children’s Health Network 72 King William Road North Adelaide Adelaide SA 5006 Australia [email protected] (08) 8161 7368
Purpose: The main aims of the South Australian Cerebral Palsy Register are to determine and monitor the prevalence of CP in South Australia; gather information about affected children that may provide clues to the causes of CP; document the severity and range of disabilities experienced by children with CP; use the information collected to plan facilities for affected children; act as a source of information about CP for both families and the community; improve community and professional awareness of CP including its causes and outcomes; provide a resource for research into CP and contribute to mortality and morbidity studies of CP.

68 AUSTRALIAN CEREBRAL PALSY REGISTER REPORT 2016
Tasmanian Cerebral Palsy Register
St Giles
Target population: The Register only collects information on CP. The main focus is on young children, but accepts registrations from all Tasmanians with CP.
Madeline Rowell, Kirsty Bartlett-Clark, Dr Eliza Maloney St Giles PO Box 416 Launceston TAS 7250Australia [email protected](03) 6345 7333
Purpose: To monitor how many people are living with CP in Tasmania, in which areas they live and whether there are any changing trends in the incidence or severity of CP in the state. The register also aims to facilitate research into the causes, prevention and treatment of CP.
Victorian Cerebral Palsy Register
Murdoch Childrens Research Institute / Royal Children’s Hospital, Melbourne
Target population: Individuals with CP born since 1970
Dr Sue Reid Murdoch Childrens Research Institute Royal Children’s Hospital Flemington Road Parkville VIC 3052 Australia [email protected] (03) 9345 4807
Purpose: To determine the frequency and describe the characteristics of CP in Victoria, to enable research into aetiology and to select cohorts for intervention and other studies.

69AUSTRALIAN CEREBRAL PALSY REGISTER REPORT 2016
Western Australian Register of Developmental Anomalies - Cerebral Palsy
Target population: All individuals from birth-year 1956 who have CP acquired before age 5 years and were born or currently live in WA.
Linda Watson WARDAKing Edward Memorial HospitalPO Box 314 Subiaco WA 6904 Australia [email protected] (08) 9340 27680403 806 932http://www.kemh.health.wa.gov.au/services/register_developmental_anomalies/
Purpose: (1) To monitor trends in the CPs and identify areas of concern for future investigation (2) To conduct population based epidemiological studies of the various CP subgroups, particularly to elucidate causes (3) To evaluate changes in antenatal, obstetric and neonatal care in relation to CP as an index of neurological outcome (4) To identify CP as an outcome in other study populations (5) To aid in the planning of services for individuals with CP by providing distribution of CP in WA by age, severity, geographical area, etc to service organisations (6) To contribute WA CP data to the Australian Cerebral Palsy Register.
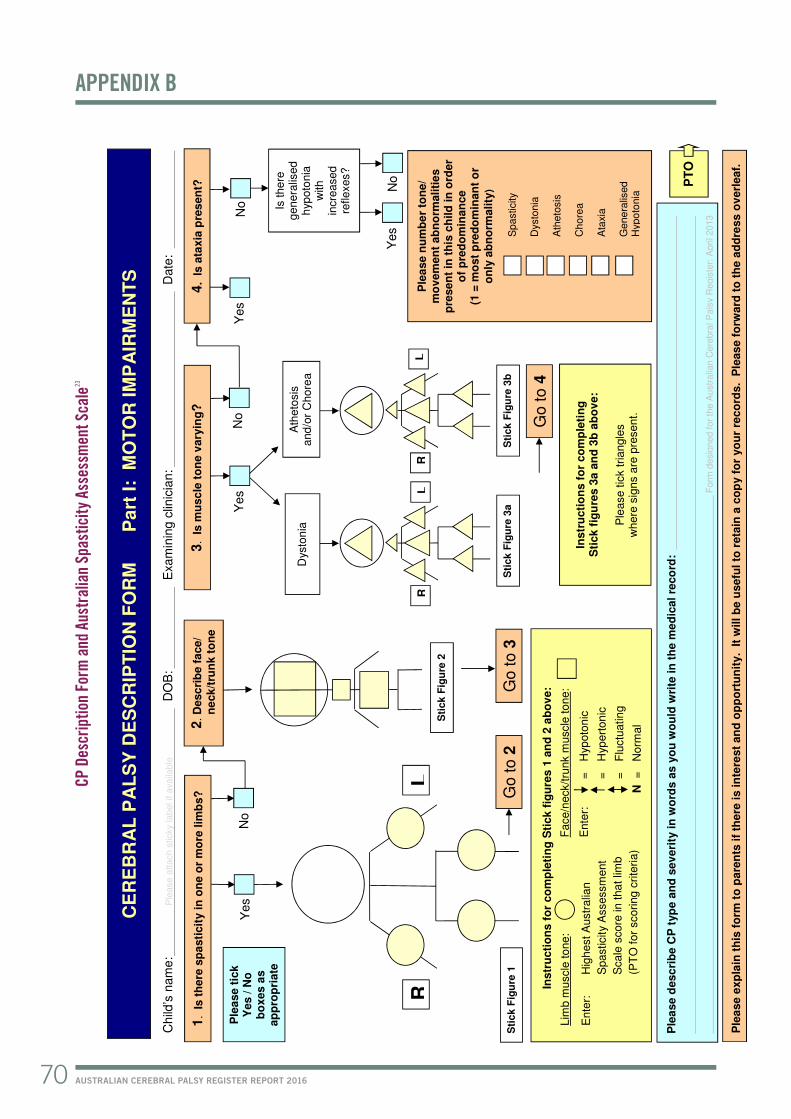
Ple
ase d
esc
rib
e C
P t
yp
e a
nd
sev
eri
ty in
wo
rds a
s y
ou
wo
uld
wri
te in
th
e m
ed
ical
reco
rd:
F
orm
desig
ned f
or
the A
ustr
alia
n C
ere
bra
l P
als
y R
egis
ter:
April 2013
CE
RE
BR
AL
PA
LS
Y D
ES
CR
IPT
ION
FO
RM
P
art
I:
MO
TO
R I
MP
AIR
ME
NT
S
Child
’s n
am
e:
Ple
ase a
ttach s
ticky
label if a
vaila
ble
DO
B: E
xam
inin
g c
linic
ian:
Date
:
4. Is a
taxia
pre
sen
t?
Ple
ase n
um
be
r to
ne/
mo
vem
en
t ab
no
rmaliti
es
pre
sen
t in
th
is c
hild
in
ord
er
of
pre
do
min
an
ce
(1
= m
ost
pre
do
min
an
t o
r
on
ly a
bn
orm
ality
)
Sp
asticity
Dysto
nia
A
the
tosis
C
ho
rea
Ata
xia
G
en
era
lised
Hyp
oto
nia
Instr
ucti
on
s f
or
co
mp
leti
ng
S
tick f
igu
res 3
a a
nd
3b
ab
ov
e:
P
lease t
ick triangle
s
where
sig
ns a
re p
resent.
Is there
genera
lised
hyp
oto
nia
w
ith
incre
ased
re
flexes?
3. Is m
usc
le t
on
e v
ary
ing?
Sti
ck
Fig
ure
1
Yes
Yes
No
Ple
ase t
ick
Yes / N
o
bo
xes a
s
ap
pro
pri
ate
No
Yes
1. Is t
here
sp
asti
cit
y in
on
e o
r m
ore
lim
bs?
Go to 3
No
Instr
ucti
on
s f
or
co
mp
leti
ng
Sti
ck f
igu
res 1
an
d 2
ab
ov
e:
E
nte
r:
=
Hyp
oto
nic
=
H
yp
ert
on
ic
=
F
luctu
atin
g
N
=
Norm
al
Ente
r:
Hig
hest A
ustr
alia
n
S
pasticity A
ssessm
ent
S
cale
score
in
tha
t lim
b
(P
TO
for
scoring c
rite
ria)
Lim
b m
uscle
tone:
F
ace/n
eck/tru
nk m
uscle
to
ne:
Go to 4
Dysto
nia
A
the
tosis
and/o
r C
hore
a
Sti
ck
Fig
ure
3a
Sti
ck
Fig
ure
3b
R
L
R
L
Ple
ase e
xp
lain
th
is f
orm
to
pare
nts
if
the
re i
s in
tere
st
an
d o
pp
ort
un
ity. It
will b
e u
sefu
l to
reta
in a
co
py f
or
yo
ur
reco
rds.
Ple
as
e f
orw
ard
to
th
e a
dd
ress o
verl
eaf.
PT
O
Yes
2. D
esc
rib
e f
ace/
n
eck/t
run
k t
on
e
R
L
Sti
ck
Fig
ure
2
Go to 2
No
70 AUSTRALIAN CEREBRAL PALSY REGISTER REPORT 2016
CP D
escr
iptio
n Fo
rm a
nd A
ustr
alia
n Sp
astic
ity A
sses
smen
t Sca
le23
APPENDIX B

Australian Spasticity Assessment Scale (ASAS) Love SC, Gibson N, Blair E
0 No catch on rapid passive movement (RPM) (no spasticity).
1 Catch on RPM followed by release. There is no resistance to RPM throughout rest of range.
2 Catch occurs in second half of available range (after halfway point) during RPM and is followed by resistance throughout remaining range.
3 Catch occurs in first half of available range (up to and including the halfway point) during RPM and is followed by resistance throughout remaining range.
4 When attempting RPM, the body part appears fixed but moves on slow passive movement.
NB Contractures do not need to be recorded on this form.
Part II: FUNCTION AND ASSOCIATED IMPAIRMENTS
Please indicate Gross Motor Function Classification System E&R level (Palisano et al, 2007):
GMFCS: Level I Level II Level III Level IV Level V
Please indicate Manual Ability Classification System level (Eliasson et al, 2006):
MACS: Level I Level II Level III Level IV Level V Please indicate associated impairments present in this child:
Intellectual: IQ / DQ or severity range
Normal Method of assessment / Date assessed
Comments
Epilepsy: Previously, but now resolved
None Seizure type(s) if current
Age at onset
Visual: Some impairment
Normal Bilateral blindness
Strabismus
Uncertain
Hearing: Some impairment
Normal Bilateral deafness
Uncertain
Speech: Some impairment
Normal Non-verbal
Uncertain
Swallowing: Modifications required (eg, special spoon, food thickening)
Normal Non-oral feeding
Uncertain
PTO
Please forward to: Western Australian Register of Developmental Anomalies - CP
King Edward Memorial Hospital, PO Box 134, Subiaco WA 6904
71AUSTRALIAN CEREBRAL PALSY REGISTER REPORT 2016
For further information about the Australian Spasticity Assessment Scale please see Love S, Gibson N, Smith N, Bear N, Blair E. Interobserver reliability of the Australian Spasticity Assessment Scale (ASAS). Dev Med Child Neurol. 2016;58 Suppl 2:18-24.

72 AUSTRALIAN CEREBRAL PALSY REGISTER REPORT 2016
• Blair EM, Nelson KB. Fetal growth restriction and risk of cerebral palsy in singletons born after at least 35 weeks’ gestation. Am J Obstet Gynecol 2015 Apr; 212(4): 520.
• Blair E, Watson L, O’Kearney E, et al. Comparing risks of cerebral palsy in births between Australian Indigenous and non-Indigenous mothers. Dev Med Child Neurol. 2016;58 Suppl 2:36-42.
• Blair E, Smithers-Sheedy H. Strabismus, a preventable barrier to social participation: a short report. Dev Med Child Neurol. 2016;58 Suppl 2:57-9.
• Blair E, Watson L. Cerebral palsy and perinatal mortality after pregnancy-induced hypertension across the gestational age spectrum: observations of a reconstructed total population cohort. Dev Med Child Neurol. 2016;58 Suppl 2:76-81.
• Boyd RN, Jordan R, Pareezer L, et al. Australian Cerebral Palsy Child Study: Protocol of a prospective population based study of motor and brain development of preschool aged children with cerebral palsy. BMC Neurology 2013; 13:57.
• Bower C, McKenzie A, Watson L, et al. Collaborating with consumers: the key to achieving statutory notification for birth defects and cerebral palsy in Western Australia. Journal of Registry Management. 2013;40(1):9-13.
• Coleman A, Weir K, Ware RS, et al. Predicting functional communication ability in children with cerebral palsy at school entry. Dev Med Child Neurol 2015; 57:279-85.
• Coleman A, Weir KA, Ware RS, et al. Relationship between communication skills and gross motor function in preschool-aged children with cerebral palsy. Arch Phys Med Rehabil 2013; 94:2210-7.
• Craven A, Pym A, Boyd RN. Reliability of radiologic measures of hip displacement in a cohort of preschool-aged children with cerebral palsy. J Pediatr Orthop 2014; 34:597-602.
• Crompton KE, Elwood N, Kirkland M, et al. Feasibility of trialling cord blood stem cell treatments for cerebral palsy in Australia. J Paediatr Child Health 2014; 50:540-44.
• Davis E, Mackinnon A, Davern M, et al. Description and psychometric properties of the CP QOL-Teen: a quality of life questionnaire for adolescents with cerebral palsy. Res Dev Disabil 2013; 34:344-52.
• DeLacy MJ, Louca C, Smithers-Sheedy H, et al. Change in residential remoteness during the first 5 years of life in an Australian cerebral palsy cohort. Dev Med Child Neurol. 2016;58 Suppl 2:60-5.
• Delacy MJ, Reid SM. Profile of associated impairments at age 5 years in Australia by cerebral palsy subtype and
Gross Motor Function Classification System level for birth years 1996 to 2005. Dev Med Child Neurol. 2016;58 Suppl 2:50-6.
• Gehrmann FE, Coleman A, Weir KA, et al. School readiness of children with cerebral palsy. Dev Med Child Neurol 2014; 56:786-93.
• Georgiades M, Elliott C, Wilton J, et al. The Neurological Hand Deformity Classification for children with cerebral palsy. Aust Occup Ther J. 2014 Dec; 61(6): 394-402.
• Goldsmith S, McIntyre S, Smithers-Sheedy H, et al. An international survey of cerebral palsy registers and surveillance systems. Dev Med Child Neurol. 2016;58 Suppl 2:11-7.
• Harvey A, Randall M, Reid SM, et al. Children with cerebral palsy and periventricular white matter injury: does gestational age affect functional outcome? Res Dev Disabil 2013; 34:2500-06.
• Hyde C, Fuelscher I, Enticott PG, et al. Rapid online control to reaching is preserved in children with congenital spastic hemiplegia: evidence from double-step reaching performance. J Child Neurol 2015; 30:1186-91.
• Jiang B, Walstab J, Reid S, et al. Quality of life in young adults with cerebral palsy. Disability and Health Journal 2016.
• Love S, Blair E. The right interventions for each child with cerebral palsy [letter]. Dev Med Child Neurol 2014 Apr; 56(4): 392.
• Love S, Gibson N, Smith N, et al. Interobserver reliability of the Australian Spasticity Assessment Scale (ASAS). Dev Med Child Neurol. 2016;58 Suppl 2:18-24.
• Lionti T, Reid SM, Reddihough DS, et al. Monitoring height and weight: Findings from a developmental paediatric service. J Paediatr Child Health 2013; 49:1063-68.
• McIntyre S, Blair E, Badawi N, et al. Antecedents of cerebral palsy and perinatal death in term and late preterm singletons. Obstetrics & Gynecology 2013; 122(4): 869-877.
• McIntyre S, Taitz D, Keogh J, et al. Systematic review of risk factors for cerebral palsy in children born at term in developed countries. Dev Med Child Neurol 2013; 55(6): 499-508.
• McIntyre S, Badawi N, Blair E, et al. Does aetiology of neonatal encephalopathy and hypoxic-ischaemic encephalopathy influence the outcome of treatment? Dev Med Child Neurol 2015 Apr; 57 Suppl 3: 2-7.
• McIntyre S, Blair E, Goldsmith S, et al. Congenital anomalies in cerebral palsy: where to from here? Dev Med Child Neurol. 2016;58 Suppl 2:71-5.
APPENDIX C
References generated by registers in Australia (January 2013 – June 2016)

73AUSTRALIAN CEREBRAL PALSY REGISTER REPORT 2016
• Meehan E, Reid SM, Williams K, et al. Medical service use in children with cerebral palsy: the role of child and family characteristics. Journal of Paediatrics and Child Health. 2016: 52 (6); 621-27.
• Meehan E, Harvey A, Reid S, et al. Therapy service use in children and adolescents with cerebral palsy: an Australian perspective. Journal of Paediatrics and Child Health. 2016; 52 (3): 308-14.
• Meehan E, Freed GL, Reid SM, et al. Tertiary paediatric hospital admissions in children and young people with cerebral palsy. Child: Care, Health and Development. 2015: 41 (6); 928-937.
• Meehan E, Reid SM, Williams K, et al. Tertiary paediatric emergency department use in children and young people with cerebral palsy. Journal of Paediatrics and Child Health. 2015: 51(10); 994-1000.
• Mei C, Reilly S, Reddihough D, et al. Activities and participation of children with cerebral palsy: parent perspectives. Disabil Rehabil 2015; 37:2164-73.
• Mei C, Reilly S, Reddihough D, et al. Motor speech impairment, activity, and participation in children with cerebral palsy. International Journal of Speech-Language Pathology 2014; 16:427-35.
• Morgan P, Murphy A, Opheim A, et al. The safety and feasibility of an intervention to improve balance dysfunction in ambulant adults with cerebral palsy: A pilot randomized controlled trial. Clin Rehabil 2014.
• Nelson K, Blair E. Prenatal factors in singletons with cerebral palsy born at or near term. N Engl J Med 2015; 373: 946-53.
• O’Callaghan ME, MacLennan AH, Gibson CS, et al. Genetic and clinical contributions to cerebral palsy: A multi-variable analysis. J Paediatr Child Health 2013; 49:575-81.
• Randall M, Harvey A, Imms C, et al. Reliable classification of functional profiles and movement disorders of children with cerebral palsy. Phys Occ Ther Ped 2013; 33:342-52.
• Read SA, Morton TA, Ryan MK. Negotiating identity: a qualitative analysis of stigma and support seeking for individuals with cerebral palsy. Disabil Rehabil 2015; 37:1162-69.
• Reddihough D, Jiang B, Lanigan A, et al. Social outcomes of young adults with cerebral palsy. J Intellect Dev Disabil 2013; 38:215-22.
• Reddihough DS, Meehan E, Stott NS, et al. The National Disability Insurance Scheme: a time for real change in Australia. Dev Med Child Neurol. 2016;58 Suppl 2:66-70.
• Reid S. Trends in cerebral palsy survival: are health
measures really making a difference? [Invited commentary]. Dev Med Child Neurol 2014.
• Reid S, Dagia C, Ditchfield M, et al. Systematic review of population-based studies of brain imaging patterns in cerebral palsy. Dev Med Child Neurol 2013.
• Reid SM. Improving survival in cerebral palsy: where do we go from here? [Invited commentary]. . Dev Med Child Neurol 2015; 57:703-4.
• Reid SM, Dagia CD, Ditchfield MR, et al. An Australian population study of factors associated with MRI patterns in cerebral palsy. Dev Med Child Neurol 2014; 56:178-84.
• Reid SM, Meehan E, Gibson CS, et al. Biological sex and the risk of cerebral palsy in Victoria, Australia. Dev Med Child Neurol. 2016;58 Suppl 2:43-9.
• Reid SM, Dagia CD, Ditchfield MR, et al. Population-based studies of brain imaging patterns in cerebral palsy. Dev Med Child Neurol 2014; 56:222-32.
• Reid SM, Dagia CD, Ditchfield MR, et al. Grey matter injury patterns in cerebral palsy: associations between structural involvement on MRI and clinical outcomes. Dev Med Child Neurol 2015.
• Reid SM, Ditchfield MR, Bracken J, et al. Relationship between characteristics on magnetic resonance imaging and motor outcomes in children with cerebral palsy and white matter injury. Res Dev Disabil 2015; 45-46:178-87.
• Reid SM, Meehan E, McIntyre S, et al. Temporal trends in cerebral palsy by impairment severity and birth gestation. Dev Med Child Neurol. 2016;58 Suppl 2:25-35.
• Sherwell S, Reid S, Reddihough D, et al. Measuring intellectual ability in children with cerebral palsy: can we do better? Res Dev Disabil 2014; 35:2558-67.
• Smithers-Sheedy H, Raynes-Greenow C, Badawi N, et al. Congenital cytomegalovirus is associated with severe forms of cerebral palsy and female gender in an Australian population cohort study. Infectious Diseases 2014; 56:846-52.
• Smithers-Sheedy H, Raynes-Greenow C, Badawi N, et al. Neuroimaging findings in a series of children with cerebral palsy and congenital cytomegalovirus infection. Infect Disord Drug Targets 2015; 14:185-90.
• Smithers-Sheedy H, Badawi N, Blair E, et al. What constitutes cerebral palsy in the twenty-first century? Dev Med Child Neurol. 2014;56(4):323-8.
• Smithers-Sheedy H, McIntyre S, Gibson C, et al. A special supplement: findings from the Australian Cerebral Palsy Register, birth years 1993 to 2006. Dev Med Child Neurol. 2016;58 Suppl 2:5-10.

74 AUSTRALIAN CEREBRAL PALSY REGISTER REPORT 2016
• Taylor NF, Dodd KJ, Baker RJ, et al. Progressive resistance training and mobility-related function in young people with cerebral palsy: a randomized controlled trial. Dev Med Child Neurol 2013; 55:806-12.
• Wawrzuta J, Willoughby KL, Molesworth C, et al. Hip health at skeletal maturity: a population-based study of young adults with cerebral palsy. Dev Med Child Neurol 2016.
• Weir KA, Bell KL, Caristo F, et al. Reported eating ability of young children with cerebral palsy: is there an association with gross motor function? Arch Phys Med Rehabil 2013; 94:495-502.

75AUSTRALIAN CEREBRAL PALSY REGISTER REPORT 2016
State submitting data Numeric code representing state/territory submitting data
CP number Unique identifier from state/territory CP register
Date of birth Year of birth
Sex Single digit: 1 male, 2 female, 9 unknown
Postcode of mother’s address at time of birth Four digit: postcode
Postcode of case address at 5 years Four digit: postcode
Postcode of case at latest known address Four digit: postcode
Mother’s date of birth Eight digit: (dd-mm-yy)
Mother’s age at time of delivery Two digit: (years)
Mother’s indigenous status Single digit: 1 Aboriginal but not Torres Strait Islander origin, 2 Torres Strait Islander but not Aboriginal origin, 3 Aboriginal and Torres Strait Islander origin, 4 Neither Aboriginal nor Torres Strait Islander origin, 9 not stated
Mother’s country of birth Four digit: Standard Australian Classification of Countries (SACC) (ABS Catalogue No. 1269.0).
Mother’s occupation at time of, or prior to pregnancy Single digit: Major group, Australian Standard Classification of Occupations, Second Edition, 1997 (ABS Catalogue No. 1220.0).
Father’s occupation at time of birth Single digit: Major group, Australian Standard Classification of Occupations, Second Edition, 1997 (ABS Catalogue No. 1220.0).
Mother’s highest level academic qualification at time of delivery Single digit: 0 none, 1 primary, 2 incomplete secondary, 3 complete secondary, 4 secondary NOS, 5 apprenticeship/trade qualifications, 6 incomplete tertiary, 7 complete tertiary or higher, 8 tertiary NOS, 9 not stated
Mother’s highest level academic qualification at time of birth of child Single digit: 0 none, 1 primary, 2 incomplete secondary, 3 complete secondary, 4 secondary NOS, 5 apprenticeship/trade qualifications, 6 incomplete tertiary, 7 complete tertiary or higher, 8 tertiary NOS, 9 not stated
Age at which motor disorder first described as CP by clinician (not corrected for preterm birth) Single digit: 0, 0–6 months, 1, 7-12 months, 2, 13-24 months (during second year), 3, 25-36 months (during third year), 4, 37-48 months (during fourth year), 5, 49-60 months (during fifth year), 6, Age 5 or later, 9, not stated
Predominant type of CP at age 5 years Single digit: 0 spastic monoplegia, 1 spastic hemiplegia, 2 spastic diplegia, 3 spastic triplegia, 4 spastic quadriplegia, 5 ataxia, 6 dyskinetic CP, mainly athetoid, 7 dyskinetic CP, mainly dystonic , 8 hypotonic CP, 9 not stated
Limb(s) affected in monoplegia and hemiplegia or limbs most affected in other spastic CP types, as the predominant CP type at age 5 years Single digit: 1 right upper limb, 2 right lower limb, 3 right side – upper and lower limbs, 4 left upper limb, 5 left lower limb, 6 left side – upper and lower limbs, 9 unknown
Secondary type of CP at age 5 years Single digit: 0 spastic monoplegia, 1 spastic hemiplegia, 2 spastic diplegia, 3 spastic triplegia, 4 spastic quadriplegia, 5 ataxia, 6 dyskinetic CP, mainly athetoid, 7 dyskinetic CP, mainly dystonic , 8 hypotonic CP, 9 not stated
Limb(s) affected in monoplegia and hemiplegia or limbs most affected in other spastic CP types, as the secondary CP type at age 5 years Single digit: 1 right upper limb, 2 right lower limb, 3 right side – upper and lower limbs, 4 left upper limb, 5 left lower limb, 6 left side – upper and lower limbs, 9 unknown
Gross Motor Function Classification System (GMFCS) level at age 5 years Single digit: 1 level 1, 2 level 2, 3 level 3, 4 level 4, 5 level 5, 9 Unknown
Manual Ability Classification System (MACS) level age 5 years Single digit: 1 level 1, 2 level 2, 3 level 3, 4 level 4, 5 level 5, 9 Unknown
Postneonatal timing of brain injury that caused CP Single digit: 0 No postneonatal cause, 1 Postneonatal cause (after 28 days and before age 2 years), 2 neonatal injury in an undisputedly normal infant, 9 uncertain whether postneonatal cause or not
Attributed cause of CP if known with certainty Two digit: Pre/perinatal causal factors: 01 genetic/chromosomal, 02 intrauterine CMV infection, 03 other intrauterine TORCH infection, 08 other prenatal cause. Postneonatal causes: 21 dehydration due to gastroenteritis, 22 other bacterial infection, 23 other viral infection, 28 infection nos, 31 CVA associated with surgery, 32 CVA associated with cardiac complications (not during/post surgery), 38 CVA spontaneous / other CVA, 41 MVA –
APPENDIX D
Minimum data set at time of data provision

76 AUSTRALIAN CEREBRAL PALSY REGISTER REPORT 2016
passenger in vehicle, 42 MVA – Pedestrian, 43 fall, 44 non-accidental, 48 other head injury / nos,51 near drowning, 52 apparent life-threatening event, 54 post-seizure, 55 peri-operative hypoxia, 58 other postneonatal event
Associated syndrome co-existing with motor disability or syndrome having a motor component that meets the definition of CP Four digit: Possum codes www.possum.net.au
Congenital anomalies Two digit: Birth defects codes categorised by ICD10 major headings: 01 no birth defect, 02 nervous system, 03 urogenital, 04 musculoskeletal, 05 cardiovascular, 06 gastrointestinal, 07 chromosomal, 08 respiratory, 09 metabolic, 10 haematological/ immune
Epilepsy at age 5 years Single digit: 0 none, 1 resolved by age 5 years (seizure free for two or more years without medication), 2 epilepsy, 9 unknown. NB: epilepsy defined as two or more afebrile seizures before age 5 years; does not include neonatal seizures.
Intellectual impairment at age 5 years Single digit: 0 normal (IQ > 70 or so described), 2 mild impairment (IQ 50-69 or so described), 3 moderate impairment (IQ 35-49 or so described), 4 severe impairment (IQ < 35 or so described), 5 probably greater than borderline impairment, severity uncertain, 6 probably borderline or no impairment, 9 intellectual ability unknown
Vision impairment at age 5 years Single digit: 0 no impairment, 2 some visual impairment (wears glasses), 3 functionally blind (may have light perception, ability to see colour differences, see shadows but unable to use), 9 visual status unknown
Strabismus at age 5 years Single digit: 0 no strabismus, 2 strabismus, 9 strabismus status unknown
Hearing at age 5 years Single digit: 0 no impairment, 2 some impairment (includes conductive loss), 3 bilateral deafness, 9 hearing status unknown
Speech impairment at age 5 years Single digit: 0 no impairment, 2 some impairment, 3 non-verbal, 9 speech status unknown
Place of birth Single digit: 1 hospital, 2 birth centre, attached to hospital, 3 birth centre, free standing, 4 home birth, planned, 5 home birth, unplanned, 6 born before arrival at hospital, 7 born outside home or hospital without medical assistance, 8 other, 9 not stated
State/territory of birth Numeric code representing state/territory submitting data
Level of care facility of hospital of birth Single digit: 1 home / hospital without neonatal intensive care unit or special care nursery, 2 hospital with special care nursery, 3 hospital with neonatal intensive care unit, 9 not stated
Length of stay in neonatal intensive care unit (days) Three digit: Number of days, 000 not admitted to higher level care, 888 admitted to higher level care than general ward, length of stay unknown, 999 not stated
Assisted conception used in this pregnancy Single digit: 0 unassisted conception, 1 fertility drugs only, 2 artificial insemination, 3 IVF, 4 ICSI, 5 GIFT, 6 other assisted conception, 7 assisted conception, type u/k, 9 unknown / no information
Number of mother’s previous births of 20 weeks or more, excluding co-multiples of case Single digit: 1 singleton, 2 twins, 3 triplets, 4 quadruplets, 5 quintuplets, 6 sextuplets, 8 other, 9 unknown
Plurality of birth Single digit: 1 singleton, 2 twins, 3 triplets, 4 quadruplets, 5 quintuplets, 6 sextuplets, 8 other, 9 unknown
Birth order Single digit: 1 singleton or first of a multiple birth, 2 second of a multiple birth, 3 third of a multiple birth, 4 fourth of a multiple birth, 5 fifth of a multiple birth, 6 sixth of a multiple birth, 8 other, 9 unknown
Birth weight (grams) Four digit: birth weight grams
Gestational age (completed weeks) Two digit: completed weeks
MRI 1 completed after neonatal period (28 days) and prior to 2 years of age Single digit: 0 no, 1 MRI normal, 2 MRI abnormal, 9 unknown
MRI 2 completed after 2 years of age Single digit: 0 no, 1 MRI normal, 2 MRI abnormal, 9 unknown
Date of death Eight digit: dd-mm-yyyy, 01-01-1901 unknown, 02-02-1902 not applicable
Death cause ICD10 alpha-numeric code
Post mortem carried out Single digit: 0 no, 1 yes, 9 unknown

77AUSTRALIAN CEREBRAL PALSY REGISTER REPORT 2016
1. Cans C, Blair E, Gibson C, Reid S, eds. Special Issue: Cerebral Palsy in Australia, Submissions from the Australian Cerebral Palsy Register Group. Dev Med Child Neurol. 2016;58.
2. Goldsmith S, McIntyre S, Smithers-Sheedy H, et al. on behalf of the Australian Cerebral Palsy Register Group. An International Survey of Cerebral Palsy Registers and Surveillance Systems. Dev Med Child Neurol. 2016;58 (Suppl 2):11-17.
3. Surveillance of cerebral palsy in Europe: a collaboration of cerebral palsy surveys and registers. Surveillance of Cerebral Palsy in Europe (SCPE). Dev Med Child Neurol. 2000;42(12):816-824.
4. Bax M. Terminology and classification of cerebral palsy. Dev Med and Child Neurol. 1964;11:295-7.
5. Rosenbaum P, Paneth N, Leviton A, et al. A report: the definition and classification of cerebral palsy April 2006. Dev Med Child Neurol Suppl. 2007;109:8-14.
6. Mutch L, Alberman E, Hagberg B, et al. Cerebral palsy epidemiology: where are we now and where are we going? Dev Med Child Neurol. 1992;34(6):547-551.
7. Stanley F, Blair E, Alberman E. Epidemiological issues in evaluating the management of cerebral palsy. Cerebral Palsies: Epidemiology and Causal Pathways. London: MacKeith Press; 2000:176-194.
8. Koman LA, Smith BP, Shilt JS. Cerebral palsy. Lancet. May 15 2004;363(9421):1619-1631.
9. Krageloh-Mann I, Petruch, U., Weber P-M. SCPE Reference and Training Manual (R&TM). Grenoble: Surveillance of Cerebral Palsy in Europe;2005.
10. Stanley F, Blair, E., Alberman, E. The classification of the cerebral palsies. Cerebral Palsies: Epidemiology and Causal Pathways. London: MacKeith Press; 2000:14-21.
11. Novak I, Hines M, Goldsmith S, et al. Clinical prognostic messages from a systematic review on cerebral palsy. Pediatrics. 2012;130(5):e1285-1312.
12. McIntyre S, Morgan C, Walker K, et al. Cerebral palsy-don’t delay. Dev Disabil Res Rev 2011;17(2):114-291.
13. Stanley F, Blair E, Alberman E. What are the cerebral palsies? Cerebral Palsies: Epidemiology and Causal Pathways. London: MacKeith Press; 2000:8-13.
14. Himmelmann K, Beckung E, Hagberg G, et al Gross and fine motor function and accompanying impairments in cerebral palsy. Dev Med Child Neurol. 2006;48(6):417-423.
15. Odding E, Roebroeck ME, Stam HJ. The epidemiology of cerebral palsy: incidence, impairments and risk factors. Disabil Rehabil. 2006;28(4):183-191.
16. Delacy MJ, Reid SM. Profile of associated impairments at age 5 years in Australia by cerebral palsy subtype and Gross Motor Function Classification System level for birth years 1996 to 2005. Dev Med Child Neurol. 2016;58 Suppl 2:50-56.
17. Oskoui M, Coutinho F, Dykeman J, et al. An update on the prevalence of cerebral palsy: a systematic review and meta-analysis. Dev Med Child Neurol. 2013;55(6):509-519.
18. Solaski M, Majnemer A, Oskoui M. Contribution of socio-economic status on the prevalence of cerebral palsy: a systematic search and review. Dev Med Child Neurol. 2014;56(11):1043-1051.
19. Oskoui M, Messerlian C, Blair A, et al. Variation in cerebral palsy profile by socio-economic status. Dev Med Child Neurol. 2016;58(2):160-6.
20. ABS. 3101.0 - Australian Demographic Statistics, 2015. 2015; http://www.abs.gov.au/ausstats/[email protected]/mf/3101.0. Accessed October 2015, 2015.
21. National Perinatal Epidemiology Statistics Unit (NPSEU). NPESU analysis of AIHW National Perinatal Data Collection: Australian birth denominator data, by gestational age and higher order multiples with various stratifications. In: Unit NPS, ed 2015.
22. Laws P, Hilder L. Australia’s mothers and babies 2006. Sydney 2008.
23. Love S, Gibson N, Smith N, et al. Interobserver reliability of the Australian Spasticity Assessment Scale (ASAS). Dev Med Child Neurol. 2016;58 Suppl 2:18-24.
24. Palisano R, Rosenbaum R, Walter S, et al. Development and reliability of a system to classify gross motor function in children with cerebral palsy. Dev Med Child Neurol. 1997;45:113-120.
REFERENCES

78 AUSTRALIAN CEREBRAL PALSY REGISTER REPORT 2016
Australian Cerebral Palsy RegisterT: (02) 9479 7200E: [email protected] W: cpregister.com
CONTACT DETAILS
Recommended citation:Report of the Australian Cerebral Palsy Register, Birth Years 1993-2009, September 2016.

