australian cbd office · dexus, investa and charter hall. ... the project is47% pre ... kumpulan...
TRANSCRIPT

RESEARCH
AUSTRALIAN CBD OFFICE Top Sales Transactions 2013 Calendar Year
HIGHLIGHTS • Contrary to conditions being experienced in the leasing market, the depth of demand and competition
amongst buyer types has intensified in the capital markets. This is highlighted by sales activity across Australia’s major CBD office markets, with almost $9.4 billion of sales ($10 million+) changing hands in 2013, more than double the 2012 level. However, the recorded data by number of transactions (93 against the 5 year average of 69) are partly boosted by a significant number of large asset sales and numerous portfolio sales. Melbourne, Sydney and Brisbane CBD’s all recorded over $2 billion of sales in 2013, with Melbourne CBD the most invested city in 2013, however, Perth also recorded a standout year in a historical context. As is common at this time of year, there are also a number of assets presently under contract or final negotiations.
• Domestic institutions became very acquisitive once again in 2013, with 63% of deals, up from 56% in 2012 and against the 5 year average of 50%. The wholesale vehicles/syndicates (32%) and the domestic listed groups (23%) have been particularly active, with multiple purchases by Mirvac Group, Cromwell Property Group, DEXUS, Investa and Charter Hall. This activity has been driven by the consistent reduction in their respective cost of capital making even the most core, passive acquisitions accretive for their shareholders. Super fund’s ISPT, Cbus Property and Telstra Super made up the remaining 8%. Despite offshore investors being increasingly outbid for prime, passive CBD assets, they continue to remain active participants, making up 32% of sales by value, however they have shown a greater risk tolerance to non-CBD prime assets and thus have been more successful in outbidding local investors in that sphere.
• The yield compression that begun in late 2012, predominately for “trophy” or upper-prime, passive assets, has continued into 2013, with recent benchmark CBD office sales occurring implying a degree of further firming, particularly assets with stable income streams. We are also now starting to see yield compression come through in those parts of the market which have to-date attracted more limited investor interest, such as non-core or suburban markets and more “value add” opportunities.

JANUARY 2014
AUSTRALIAN CBD OFFICE Top Sales Transactions 2013 Calendar Year
2
The Sydney CBD market has seen another active year with 2013 sales of $2.53 billion. With the bulk of passive prime assets relatively tightly held, a high proportion of the largest sales have consisted of either development assets/ opportunities (eg. 200 George Street and the Mirvac acquisition of the GE portfolio) or residential conversion opportunities (227 Elizabeth Street and 115 Bathurst Street). Offshore investors have been the largest net buyer of assets, with net purchases of $931 million.
Figure 1 Sydney CBD Transactions $10million+ $ million total transaction value
Source Knight Frank
Although there remains a considerable depth of willing buyers in the market, it is likely that CBD sales volumes by value may be softer in 2014. The absence of prime assets available for sale is likely to see a higher level of purchaser activity in the secondary tier of the market, where on average assets trade at lower price points. In addition, investors are having to look to non-CBD markets in order to satisfy their demand for prime investments. This has seen a dramatic rise in non-CBD sales, which currently amount to $2.41 billion year to date or 131% higher than 2012. It is anticipated that these factors will sustain buoyant sales activity across Sydney in 2014, albeit with a shift in the composition of sales volumes by grade and location.
0
500
1,000
1,500
2,000
2,500
3,000
2007 2008 2009 2010 2011 2012 2013
1. 200 George Street Price: $317.0 million (50% share)
Date: July 2013
NLA: 39,200m²
Yield: 6.5% reported cap rate
Rate/m² of NLA: $16,173/m²
Vendor: Mirvac Group Purchaser: AMP (AWOF) Comment: 37 storey, premium grade building, currently under construction with completion scheduled for early 2016. 74% pre-leased to EY with Mirvac providing an income guarantee over vacant space at completion.
2. 260-300 Elizabeth St. Price: c. $305 million
Date: December 2013
NLA: 53,637m²
Yield: c. 8.0%-8.25% core market
Rate/m² of NLA: c. $5,686/m²
Vendor: Investa Property Group (80.01%)/ Aust. Unity Office Property Fund (19.99%) Purchaser: Invesco (CIC) Comment: Three A-grade buildings, each on separate title, adjacent to Central Railway Station at the Southern end of CBD. Acquired on behalf of the Chinese Investment Corporation.
3. 231 Elizabeth Street Price: $201.0 million
Date: March 2013
NLA: 23,275m²
Yield: 7.10% core market (7.50% initial)
Rate/m² of NLA: $8,636/m²
Vendor: Investa (ICPF and IOF) Purchaser: Bright Ruby Comment: 18 level A-grade building fully occupied by Telstra under two primary 10 year leases expiring 2020. Corner location opposite Hyde Park. Quality views from mid and upper levels.
4. Alfred, Pitt, Dalley and George Streets Portfolio Price: $184.0 million
Date: May 2013 NLA: 34,161m²
Yield: 8.20% core market (7.80% initial)
Rate/m² of NLA: $5,386/m²
Vendor: GE Real Estate Purchaser: Mirvac Group Comment: Five assets for redevelopment located within the “APDG” precinct that benefit from alternative planning controls. The assets comprised a $184 million apportionment of a $584 million total portfolio acquisition.
5. 9 Castlereagh Street Price: $172.5 million
Date: February 2013
NLA: 20,899m²
Yield: 7.60% core market (6.80% initial)
Rate/m² of NLA: $8,254/m²
Vendor: Stockland Purchaser: Charter Hall (CPOF) Comment: 32 level, Seidler designed, A-grade office tower, with $8.5 million full lobby refurbishment recently completed. Staggered lease expiry profile with a WALE of 2.4 years extending to circa three years subject to income support.
6. 227 Elizabeth Street Price: c. $145 million
Date: November 2013
NLA: 17,052m²
Yield: N/A
Rate/m² of NLA: c. $8,503/m²
Vendor: Valad Property Group (V-Plus Fund, managed by Blackstone Group) Purchaser: Undisclosed Asian Investor Comment: A 23 level B-grade office building with frontages to Elizabeth, Castlereagh and Bathurst Streets. Sold as a proposed residential conversion opportunity.
SYDNEY CBD OFFICE MARKET

KnightFrank.com.au
3
7. 207 Kent Street Price: $133.03 million Date: June 2013 NLA: 21,107m² Yield: 7.70% core market (8.10% initial) Rate/m² of NLA : $6,324/m² Vendor: NSW Government Purchaser: Cromwell Group Comment: 24 level A-grade building forming part of a twin tower complex. The asset forms a sublease from the leasehold owners of 201 Kent Street. Purchased as part of a seven asset portfolio.
8. 2-24 Rawson Place Price: $130.0 million Date: June 2013 NLA: 25,251m² Yield: 8.20% core market (8.50% initial) Rate/m² of NLA : $5,148/m² Vendor: NSW Government Purchaser: Cromwell Group Comment: Circa 1979, 23 level office building refurbished in 1992. Purchased as part of seven asset portfolio and subject to a 15 year leaseback.
9. 115 Bathurst & 339 Pitt St Price: $107.50 million Date: March 2013 NLA: 28,643m² Yield: N/A Rate/m² of NLA : $3,753/m² Vendor: Brookfield Purchaser: Greenland Group Comment: Acquired for residential redevelopment. Proposal includes 67 storey mixed-use building, accommodating 490 apartments and 173 room hotel.
10. 20 Hunter Street Price: c. $96.00 million (excl. income support) Date: October 2013 NLA: 9,936m² Yield: 7.00% core market (6.9% initial#) Rate/m² of NLA : c. $10,376/m² Vendor: CLSA Capital Partners Purchaser: TIAA-CREF (US Fund)* Comment: A-grade building, completed in 1998 and comprising ground floor retail and 16 office levels, with a typical floor plate size of 600m². Gross price (circa $103 million) includes around $7 million in income support.
SYDNEY CBD MAP
Source of Map: Knight Frank * Teachers Insurance and Annuity Association - College Retirement Equities Fund # with income support

JANUARY 2014
AUSTRALIAN CBD OFFICE Top Sales Transactions 2013 Calendar Year
4
In stark contrast to the muted leasing activity, strong investment appetite from all buyer groups has resulted in a record level of transactional activity over 2013. Investment sales activity (above $10 million) in 2013, within the Melbourne CBD, totalled $2.63 billion across 31 properties, surpassing the $934 million that was transacted in 2012 and the previous calendar year record (2010) of $1.7 billion. Transactional activity has been boosted by a number of significant sales with nine transactions above $100 million recorded in the Melbourne CBD. In 2013 to date, offshore groups were the most prominent purchaser, accounting for 37% of sales buy value, spending more than $988 million in the Melbourne CBD, up from the $321 million acquired in 2012. Offshore investors ranged from institutional groups, listed developers and private investors with most investment funds originating from Asia.
Figure 2
Melbourne CBD Transactions $10mill+ $ million total transaction value
Source Knight Frank
While investors continue to focus on core assets characterised by the large individual transactions, increasingly investors are seeking opportunities that offer redevelopment potential with 18% of all sales categorised as opportunistic or development transactions.
0
500
1,000
1,500
2,000
2,500
3,000
2007 2008 2009 2010 2011 2012 2013
1. 567 Collins Street # Price: $462.00 million Date: February 2013
NLA: 54,271m² Yield: 6.90% core market (6.70% initial) Rate/m² of NLA : $8,513/m²
# fund through
Vendor: Leighton Properties Purchaser: Investa (ICPF & IOF) Comment: 26 level premium grade office tower under construction, due to complete in mid-2015. The project is 47% pre-committed by Corrs Chambers Westgarth, Leighton Contractors and Virgin Active. The asset is co-owned by Investa’s IOF and ICPF funds.
2. 3 Collins Square Price: $279.00 million
Date: September 2013 NLA: 38,000m² Yield: 6.25% initial
Rate/m² of NLA : $7,342/m²
Vendor: Walker Corporation Purchaser: CIMB Trust Capital Advisors Comment: Singapore’s CIMB Trust Capital Advisors, on behalf of the Malaysian government fund, Kumpulan Wang Persaraan (KWAP) and Permodalan Nasional Berhad (PNB) acquired the recently completed office building. The asset is fully leased to the ATO on a 15 year lease.
3. 367 Collins Street Price: $227.84 million Date: November 2013 NLA: 37,612m²
Yield: 7.00% core market (7.80% initial) Rate/m² of NLA: $6,058/m²
Vendor: Colonial (DPIF) Purchaser: Mirvac Group Comment: A-grade office sold with a WALE of 3.5 years. The vendor provided a one-year income guarantee over the 11% vacancy. Over 2013, within its office portfolio, Mirvac has increased its exposure to the Melbourne CBD from 5% to 22%.
4. 485 La Trobe Street Price: $181.65 million Date: December 2013
NLA: 33,496m² Yield: 7.20% core market (7.70% initial) Rate/m² of NLA: $5,423/m²
Vendor: CLSA Capital Partners Purchaser: Lend Lease (APPF Commercial) Comment: Two office towers joined by a six storey glass atrium and lobby. Fully leased with a diverse tenancy mix, the asset was sold with a WALE of 3.8 years.
5. 90 Collins Street Price: $170.00 million
Date: May 2013 NLA: 21,253m² Yield: 7.00% core market (7.00% initial)
Rate/m² of NLA : $7,999/m²
Vendor: GE Real Estate Purchaser: Mirvac Group Comment: Acquired as part of a seven-building office asset portfolio sale. 21 level A-grade office building was sold with a WALE of 4.7 years. The vendor provided a two-year income guarantee over the 43% vacancy.
6. 8 Exhibition Street Price: $160.20 million (50% interest) Date: June 2013 NLA: 44,929m²
Yield: 6.80% core market (6.40% initial) Rate/m² of NLA : $7,131/m²
Vendor: Cbus Property Purchaser: Keppel REIT Comment: The transaction was initiated through Commonwealth Property Office Fund (CPA), which acquired a call option as part of an earlier deal when Cbus bought into 5 Martin Place in Sydney.
MELBOURNE CBD MELBOURNE CBD OFFICE MELBOURNE CBD OFFICE MARKET

KnightFrank.com.au
5
7. 8 Exhibition Street Price: $160.05 million (50% interest) Date: April 2013 NLA: 44,929m² Yield: 6.52% core market (6.45% initial) Rate/m² of NLA: $7,125/m² Vendor: Cbus Property Purchaser: GPT Wholesale (GWOF) Comment: Completed in 2006, the 40 level A-grade office building was sold with a WALE of 4.5 years. While fully leased, the EY expiry in 2017 reflects 56% of the gross passing income.
8. 313 Spencer Street # Price: $114.60 million (50% interest) Date: February 2013 NLA: 28,679m² Yield: 6.40% core market (6.39% initial) Rate/m² of NLA: $7,992/m² Vendor: Cbus Property Purchaser: Invesco (Korea Post) Comment: 15 level A-grade office tower under construction, due to complete in mid-2015. The project is fully pre-committed by Victoria Police on a 20-year lease. # fund through
9. 380 La Trobe Street Price: $113.60 million Date: November 2013 NLA: 21,981m² Yield: 7.67% core market (7.70% initial) Rate/m² of NLA : $5,168/m² Vendor: Cromwell Group Purchaser: Invesco Comment: 23 storey A-grade office building completed in 2003 sold with a WALE of 5.1 years. Agrium (formerly the Australian Wheat Board) occupies 50% of the building.
10. 447 Collins Street Price: $91.00 million Date: November 2013 NLA: 30,737m² Yield: VP Rate/m² of NLA: $2,961/m² Vendor: ISPT Purchaser: Cbus Property Comment: As part of the transaction, the vendor, ISPT has a first right of refusal to buy back into a potential redevelopment of the property, left vacant by Suncorp.
MELBOURNE CBD MAP
Source of Map: Knight Frank

JANUARY 2014
AUSTRALIAN CBD OFFICE Top Sales Transactions 2013 Calendar Year
6
Transaction activity within the Brisbane CBD accelerated during 2013 as the breadth of purchasers and weight of money impacted on the investment landscape. In line with the other major investment markets, the Brisbane CBD has seen interest and activity from AREITs, wholesale funds and offshore investors. This has resulted in $2.468 billion worth of transactions by value in 2013, with a further circa $150 million understood to be in due diligence. This exceeds the previous record from CY 2007 of $1.95 billion.
Figure 3 Brisbane CBD Transactions $10million+ $ million total transaction value
Source Knight Frank
Market activity was dominated by three transactions in excess of $400 million. The largest of these was the pre-sale of 480 Queen Street for an estimated $543.9 million (subject to final leasing parameters), acquired by DEXUS Property Group and DWPF in equal shares. The Qld State Government divested seven office assets off market, in two tranches to QIC funds, for a total of $526.5 million. Most recently ISPT has acquired a 50% interest in 1 William Street for a total consideration of circa $400 million on completion. Unlisted funds clearly dominated purchasing activity with 69% of transactions by value, followed by AREITs with 19% ($457.75m) and offshore investors with 10% ($248.50m).
1. 480 Queen Street # Price: $543.90 million
Date: March 2013
NLA: 55,561m²
Yield: 7.25% core market estimated
Rate/m² of NLA: $9,789/m² # fund through
Vendor: Grocon Purchaser: DEXUS (50%)/DWPF (50%) Comment: Pre-sale and fund through of a premium building to be completed 2016. Sold with 39% pre-commitment to BHP, Herbert Smith Freehills. Grocon to provide rent guarantee over vacant space on completion.
2. State Govt Portfolio 1 Price: $414.50 million
Date: April 2013
NLA: 104,807m²
Yield: n/a
Rate/m² of NLA : $3,955/m²
Vendor: Qld State Government Purchaser: QIC Private Capital & QIC Infrastructure Management 2 Comment: Sale of six assets: a)81 George St, b)30 Mary St, c)61 Mary St, d)111 George St & e)33 Charlotte St. Buildings leased back by the State Govt on a variety of terms. Not offered to open market.
3. 1 William Street ^ Price: circa $400.00 million (50% interest)
Date: December 2013
NLA: 76,853m²
Yield: circa 6.50% core market (reported)
Rate/m² of NLA : $10,409/m² ^ Site purchase of $40-$50 million with balloon payment on completion, total consideration circa $400 million
Vendor: Cbus Property Purchaser: ISPT Comment: 43 level A-grade tower, with ground floor retail, under construction. The office component (39 levels) has been pre-leased to the Queensland Government for 15 years. Vendor is the developer and retains 50% ownership. Expected completion October 2016.
4. 400 George Street Price: $195.80 million (50% interest)
Date: February 2013
NLA: 43,493m²
Yield: 6.99% core market (7.06% initial)
Rate/m² of NLA : $9,004/m²
Vendor: Grosvenor Freehold Purchaser: South Australia Motor Accident Commission Comment: 35 Level A-grade tower completed in 2009, mix of State, Federal and private sector tenants. WALE of 7.1 years. Part of the withdrawal of Grosvenor Freehold from Brisbane.
5. 259 Queen Street Price: $173.00 million
Date: June 2013
NLA: 24,789m²
Yield: 7.54% core market (8.65% initial)
Rate/m² of NLA : $6,979/m²
Vendor: Grovenor Freehold Purchaser: Investa (ICPF) Comment: A-grade building completed in 2004 with floor plates of circa 1,500m². WALE of 3.4 years. Some short term leasing risk with Peabody Coal (2014) and Bank of QLD (2015) to relocate.
6. 179 Turbot Street Price: $172.29 million
Date: November 2013
NLA: 24,975m²
Yield: 8.13% core market (9.03% initial)
Rate/m² of NLA : $6,899/m²
Vendor: Morris Property Group Purchaser: Kumpulan Wang Persaraan Comment: A-Grade tower completed in 2009 with 187 car bays. Typical floors approx 1,260m². WALE of 5.7 years. Transaction undertaken and asset managed by Investa on behalf of the Malaysian superannuation fund.
BRISBANE CBD OFFICE MARKET
0
500
1,000
1,500
2,000
2,500
3,000
2007 2008 2009 2010 2011 2012 2013

KnightFrank.com.au
7
7. 307 Queen Street Price: $120.80 million Date: Dec 2013
NLA: 19,650m² Yield: 8.09% core market (8.51% initial) Rate/m² of NLA : $6,147/m² Vendor: Westlawn Property Trust Purchaser: GDI Property Group Comment: B-grade building of 25 levels with two basement parking levels for 91 cars. Centrally located and leased to multiple tenants. One of four assets to form the foundation of the listed GDI Group.
8. State Govt Portfolio 2 Price: $112.00 million Date: Apr 2013 NLA: 43,794m² Yield: n/a Rate/m² of NLA : $2,557/m² Vendor: Qld State Government Purchaser: QIC Investments No 3 & QIC Infrastructure Management 2 Comment: Sale of two assets a) 41 George St & b) 80 Ann St +67 Turbot St as part of portfolio sale. Relatively land rich assets.
9. 127 Creek Street Price: $71.00 million Date: Aug 2013 NLA: 18,407m² Yield: n/a Rate/m² of NLA : $3,857 Vendor: GE Real Estate Purchaser: Blackstone Group Comment: B-grade building constructed in 1974 and refurbished in 1995. 26 levels with typical floors of 800m² and parking for 125 cars. Purchased with 40 Tank Street off market.
10. 147 Charlotte St & 146 Mary St Price: $65.00 million Date: May 2013 NLA: 26,651m² Yield: 20.77% initial Rate/m² of NLA : $2,439/m² Vendor: Suncorp Securitisation Purchaser: Cromwell Group Comment: Two adjoining buildings leased to the State Govt until 2015 & 2017. Floorplates average 778m².
BRISBANE CBD MAP
Source of Map: Knight Frank

JANUARY 2014
AUSTRALIAN CBD OFFICE Top Sales Transactions 2013 Calendar Year
8
Considerable transaction activity totalling $1.26 billion occurred within the Perth CBD in the 2013 year to date, a figure substantially higher than the $589.1 million that was recorded in 2012. The historically high value of sales in 2013 consists of just six transactions (albeit includes KS1, 2 and 3 in one line), two of which are the highest Perth CBD sales on record.
Figure 4
Perth CBD Transactions $10million+ $ million total transaction value
Source: Knight Frank
Domestic groups have been the dominant purchasers during the year, accounting for 86.8% of total acquisitions with Mirvac, DEXUS and Charter Hall acquiring more than $1.12 billion worth of property over three transactions. Large spreads between the cost of debt and property yields have provided favourable conditions for domestic investors seeking acquisition opportunities that will increase total returns. Off-shore investment has been just over 13% of total purchases by value, which consists of Canadian pension fund, PSP’s, 33% share in the acquisition of Raine Square and Bankwest Place at 300 Murray Street, as well as Blackstone’s purchase of 8 St Georges Terrace in July this year. Significant transactional volumes in 2013 can be predominantly attributed to the timing of prime stock coming to market, in particular, 300 Murray Street, KS1-3 Wellington Street and 77 St Georges Terrace.
1. 300 Murray Street Price: $458.0 million
Date: April 2013
NLA: 61,490m²
Yield: 7.60% core market (6.40% initial)
Rate/m² of NLA : $7,448/m² # receivers & managers appointed
Vendor: Westgem Investments Pty Ltd # Purchaser: Charter Hall (CPOF), Telstra Super & PSP (Canada) - 33.3% shares Comment: 22 level premium office tower which is fully leased to the Bank of Western Australia Ltd for an initial term of 12 years. The asset sold with a 9.6 year WALE (income).
2. KS1-3 Wellington Street Price: $434.8 million Date: February 2013 NLA: KS1 (23,156m²), KS2 (20,440m²), KS3 (9,185m²) Yield: 8.0% core market Rate/m² of NLA : $8,238/m² (total)
Vendor: Seven Entertainment Pty Ltd Purchaser: DEXUS & DWFP Comment: Forming part of Kings Square, KS1, 2 & 3 are to be constructed as three standalone A-grade office buildings. Completion is expected in Q4 2015. Major tenants John Holland and Shell have pre-committed to 45% of NLA.
3. 77 St Georges Terrace Price: $231.0 million Date: June 2013 NLA: 28,123m² Yield: 8.20% core market (8.30% initial) Rate/m² of NLA : $8,214/m²
Vendor: GE Real Estate Purchaser: Mirvac Group Comment: 34 level A-grade office tower completed in 1975/76. The asset, which sold as part of a GE portfolio sale, had 4.6% vacancy and WALE of 6.6 years.
4. KS4 Wellington Street Price: $97.886 million Date: February 2013 NLA: 13,305m² Yield: 7.9% core market Rate/m² of NLA $7,357/m²
Vendor: Seven Entertainment Pty Ltd Purchaser: HBF House Pty Ltd Comment: Forming part of Kings Square, KS4 is to be constructed as a 13 level, A-grade office building which is being developed by Leighton Properties Pty Ltd. Owner Occupiers, HBF, will occupy 9,000m2 of NLA.
5. 80 Stirling Street ^ Price: $72.15 million Date: June 2013 NLA: 19,775m² Yield: 11.47% core market (12.43% initial) Rate/m² of NLA : $3,649/m²
Vendor: Australian Unity Purchaser: CorVal Partners Comment: Eight level office building completed in 1982 sold with nil vacancy and a WALE by income of 3.9 years. CorVal intend to undertake a major staged refurbishment of the building at a cost in the order of $14 million.
6. 8 St Georges Terrace Price: $24.0 million Date: July 2013 NLA: 4,554m² Yield: 9.75% core market (9.8% initial) Rate/m² of NLA : $5,270/m²
~ part of a national portfolio of seven assets
Vendor: GE Real Estate~ Purchaser: Blackstone Group Comment: Eight level B-grade office development which is fully leased to RSM Bird Cameron for 10 years, lease expires in late 2018. Net passing income is $2,352,147 per annum. Sold as part of a national portfolio of seven assets.
PERTH CBD OFFICE MARKET
0
200
400
600
800
1,000
1,200
1,400
2007 2008 2009 2010 2011 2012 2013
KnightFrank.com.au
9
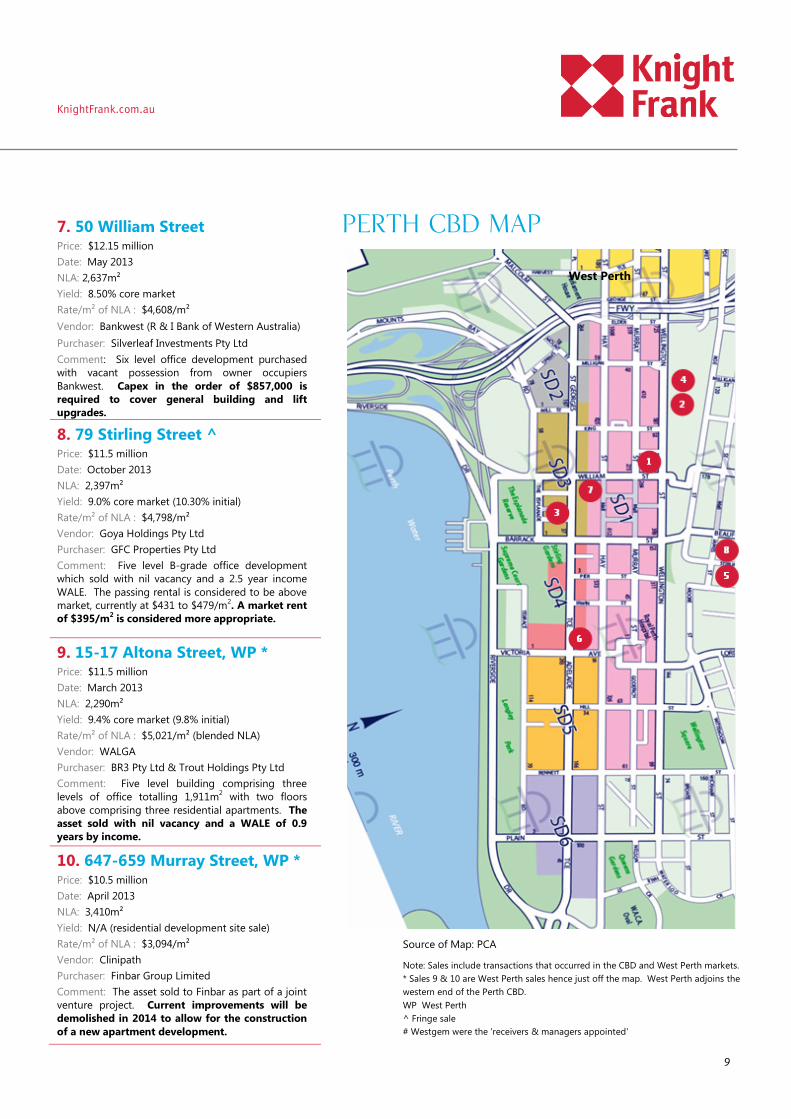
7. 50 William Street Price: $12.15 million Date: May 2013 NLA: 2,637m² Yield: 8.50% core market Rate/m² of NLA : $4,608/m² Vendor: Bankwest (R & I Bank of Western Australia) Purchaser: Silverleaf Investments Pty Ltd Comment: Six level office development purchased with vacant possession from owner occupiers Bankwest. Capex in the order of $857,000 is required to cover general building and lift upgrades.
8. 79 Stirling Street ^ Price: $11.5 million Date: October 2013 NLA: 2,397m² Yield: 9.0% core market (10.30% initial) Rate/m² of NLA : $4,798/m² Vendor: Goya Holdings Pty Ltd Purchaser: GFC Properties Pty Ltd Comment: Five level B-grade office development which sold with nil vacancy and a 2.5 year income WALE. The passing rental is considered to be above market, currently at $431 to $479/m2. A market rent of $395/m2 is considered more appropriate.
9. 15-17 Altona Street, WP * Price: $11.5 million Date: March 2013 NLA: 2,290m² Yield: 9.4% core market (9.8% initial) Rate/m² of NLA : $5,021/m² (blended NLA) Vendor: WALGA Purchaser: BR3 Pty Ltd & Trout Holdings Pty Ltd Comment: Five level building comprising three levels of office totalling 1,911m2 with two floors above comprising three residential apartments. The asset sold with nil vacancy and a WALE of 0.9 years by income.
10. 647-659 Murray Street, WP * Price: $10.5 million Date: April 2013 NLA: 3,410m² Yield: N/A (residential development site sale) Rate/m² of NLA : $3,094/m² Vendor: Clinipath Purchaser: Finbar Group Limited Comment: The asset sold to Finbar as part of a joint venture project. Current improvements will be demolished in 2014 to allow for the construction of a new apartment development.
PERTH CBD MAP
West Perth
Source of Map: PCA
Note: Sales include transactions that occurred in the CBD and West Perth markets. * Sales 9 & 10 are West Perth sales hence just off the map. West Perth adjoins the western end of the Perth CBD. WP West Perth ^ Fringe sale # Westgem were the 'receivers & managers appointed'

JANUARY 2014
AUSTRALIAN CBD OFFICE Top Sales Transactions 2013 Calendar Year
10
1. 50 Flinders Street * Price: Circa $140 million Date: Apr 2013 NLA: 21,431m2 Yield: Confidential Rate/m² NLA: $6,533/m2
Vendor: Commercial & General Purchaser: Cbus Property Comment: Development project - 74% pre-committed to People’s Choice C.U. & Santos. The building will comprise a 14 level A-Grade office tower with a 5 star NABERS energy rating.
2. 45 Pirie Street Price: $87.00 million Date: June 2013 NLA: 19,855m2 Yield: 8.76% core market (8.69% initial) Rate/m² NLA: $4,382/m2
Vendor: Colonial (CPA) Purchaser: CorVal Partners Comment: The 19 level A-Grade office tower sold with a WALE of 4.3 years. Major tenant, SA Government, occupies 76% of the total building NLA, with lease expiry at end of 2017.
3. 101 Grenfell Street ^ Price: $42.95 million Date: Jan 2013 NLA: 13,196m2 Yield: 9.10% core market Rate/m² NLA: $3,255/m2
Vendor: Cromwell Group Purchaser: Private Syndicate Comment: The 14 level B-Grade office tower sold with the SA Government occupying approximately 90%. Capital expenditure ($150k) was negotiated for a lift upgrade and was taken as capital contribution from the vendor back to the purchaser.
4. 196 O G Road, Felixstow # Price: $15.35 million Date: Sept 2013 NLA: 6,192m2 Yield: VP Rate/m² NLA: $2,479/m2
Vendor: Urban Renewal Authority Purchaser: Commercial & General Comment: A modern, two level suburban office building, originally purpose built for JP Morgan as a data centre, sold conditional on securing a specific tenant. The property is located approximately 6 kilometres north east of the Adelaide CBD.
6. 101 Pirie Street Price: $12.00 million Date: February 2013 NLA: 6,788m² Yield: VP Rate/m² of NLA: $1,768/m² Vendor: Cascadale Holdings Purchaser: Health Partners Ltd Comment: The 10 level, lower B-Grade office building sold subject to two ground floor retail tenants being leased on a monthly basis only. The purchaser seeks to owner occupy.
5. 70 Light Square Price: $14.50 million Date: August 2013 NLA: 3,348m² Yield: 8.47% core market (8.73% initial) Rate/m² of NLA: $4,331/m² Vendor: Ambitio Pty Ltd Purchaser: Luna & Valk Pty Ltd Comment: Situated on the western edge of the CBD Core office precinct. The six level refurbished B-Grade office building is 100% leased with a 4 star NABERS energy rating.
1
5
2
3 6
4
FelixstowNorth East
2
8
3
ADELAIDE OFFICE MARKET
Source of Map: PCA
Note. Sales include transactions that occurred in the Core, Frame, Fringe and suburban markets, hence not all dots are on the map. # Sale 4 is a suburban location. Felixstow is around 6kms north east of the CBD ^ Off Market Transaction * As If Complete Sale (completion 2015) C.U. Credit Union VP Vacant Possession
ADELAIDE CBD MAP

KnightFrank.com.au
11
1. Industry House, 10 Binara Street, Civic Price: $151.70 million Date: Aug 2013 NLA: 24,979 m2 Yield: 7.01% core market (7.37% initial) Rate/m² NLA: $6,073/m2
Vendor: CorVal Partners Purchaser: Brompton Asset Management Comment: A modern 14 level office building purpose built for DIISRTE in 2006. Office component fully leased to DIISRTE until 2021 (8.4 year WALE) – off market transaction.
2. Campbell Park Offices, Majura Price: $100.40 million Date: June 2013 NLA: 41,671m2 Yield: 10.61% core market (10.92% initial) Rate/m² NLA: $2,409/m2
Vendor: GE Real Estate Purchaser: PAG (Pacific Alliance Group) ^ Comment: Campus style office complex comprising a series of seven level interconnected wings in a bushland setting between the Airport and CBD. Sold to a Hong Kong investor as part of a nine property national portfolio. WALE of 9 years.
3. 40 Marcus Clarke Street, Civic# Price: $35.80 million Date: June 2013 NLA: 12,248m2 (includes retail & Canberra Club) Yield: 9.20% core market (6.26% initial) Rate/m² NLA: $2,923/m2
Vendor: PrimeSpace Property Investment Purchaser: Morris Property Group Comment: A 12 level office building with ground floor retail sold to local developer. Premium for surplus development rights - DA for residential conversion was lodged in November 2013.
4. 11 Farrer Place, Queanbeyan Price: $22.60 million Date: July 2013 NLA: 6,300m2 Yield: 8.72% core market Rate/m² NLA: $3,587/m2
Vendor: NSW Government Purchaser: Cromwell Group Comment: Purchased as part of a portfolio of seven office assets from the NSW Government. The overall WALE of the portfolio was 10 years, however this asset was subject to a 15 year leaseback by Government Property NSW.
5. 4 Mort Street, Civic Price: $14.75 million Date: March 2013 NLA: 5,465m² Yield: 11.50% core market (11.10% initial) Rate/m² of NLA: $2,699/m² Vendor: Trafalgar Corporate Group Purchaser: Gladiator Investments Comment: Six level office building located in Civic. A major refurbishment was undertaken in 2009. NABERS energy rating of 4.5 Stars and WALE of 3.7 years (two Commonwealth agencies).
6. Churches Centre 205 Anketell St, Greenway Price: $10.25 million Date: Aug 2013 NLA: 6,832m² Yield: 11.10% core market (1.10% initial) Rate/m² of NLA: $1,500/m² Vendor: GE Real Estate ~ Purchaser: Blackstone Group Comment: Five level office/retail building occupying a prominent corner site in Tuggeranong Town Centre. Entire office component (4,960m²) was vacant at time of sale, hence low initial yield.
Source of Map: ACT Planning and Land Authority (ACTMAPi)
CANBERRA OFFICE MARKET
Note . Sales include transactions that occurred in all major Canberra office precincts DIISRTE Dept. of Innovation, Industry, Science, Research and Tertiary Education ~ sold as part of a national portfolio of seven assets ^ CC Nominees – Hong Kong based investor # building known as Canberra House
Way
1
2 3
4
5
6
CANBERRA CIVIC MAP
South West
South East
East

12
RESEARCH
Americas USA Bermuda Brazil Canada Caribbean Chile
Australasia Australia New Zealand
Europe UK Belgium Czech Republic France Germany Hungary Ireland Italy Monaco Poland Portugal Romania Russia Spain The Netherlands Ukraine
Africa Botswana Kenya Malawi Nigeria South Africa Tanzania Uganda Zambia Zimbabwe
Asia Cambodia China Hong Kong India Indonesia Macau Malaysia Singapore South Korea Thailand Vietnam
The Gulf Bahrain Abu Dhabi, UAE
Knight Frank Research
Matt Whitby National Director Head of Research & Consulting +61 2 9036 6616 [email protected] Jennelle Wilson Director - Research Queensland +61 7 3246 8830 [email protected] Richard Jenkins Director - Research Victoria +61 3 9604 4713 [email protected] Nick Hoskins Assoc. Director - Research NSW +61 3 9036 6766 [email protected] Vanessa Rader Director - Consulting & Research Services +612 9036 6715 [email protected]
Capital Markets - Asia Pacific
AUSTRALIA James Parry Managing Director - Capital Markets +61 2 9036 6758 [email protected] SINGAPORE (ASIA PACIFIC) Neil Brookes Head of Capital Markets – Asia Pacific +65 8309 4985 [email protected]
Knight Frank Key Contacts
SYDNEY Richard Horne Managing Director - NSW +61 2 9036 6622 [email protected]
MELBOURNE Paul Henley Managing Director - Commercial Sales +61 3 9604 4760 [email protected]
Stephen Imrie Director - Capital Markets +61 3 9604 4634 [email protected]
BRISBANE Ed Sutton Director - Capital Markets +61 7 3246 8814 [email protected]
PERTH John Corbett Managing Director - WA +61 8 9225 2561 [email protected]
ADELAIDE Guy Bennett Associate Director – Capital Markets +61 8 8233 5204 [email protected]
CANBERRA Terry Daly Managing Director - ACT +61 2 6221 7869 [email protected]
Knight Frank Research provides strategic advice, consultancy services and forecasting to a wide range of clients worldwide including developers, investors, financial and corporate institutions. All recognise the need for the provision of expert independent advice customised
to their specific needs. Knight Frank Research reports are also available at KnightFrank.com.au
© Knight Frank 2014 This report is published for general information only. Although high standards have been used in the preparation of the information, analysis, views and projections presented in this report, no legal responsibility can be accepted by Knight Frank Research or Knight Frank for any loss or damage resultant from the contents of this document. As a general report, this material does not necessarily represent the view of Knight Frank in relation to particular properties or projects. Reproduction of this report in whole or in part is not permitted without prior consent of, and proper reference to Knight Frank Research.