australian and new zealand hotel development register hhg anz development... · july 2014 | hotels...
TRANSCRIPT

Australian and New Zealand Hotel Development Register
Hotels & Hospitality Group | July 2014

Quest King William, Adelaide. Under construction, due to open June 2014

Table of Contents4
26
5
31
Contributors
Highlights – AustraliaOpening gains pacePipeline has moderated over the past yearMooted projects indicate Australia is on the precipice of the next hotel development cycleAccommodation building approvals surge but challenges remainOutlook
City SnapshotsAdelaide CityBrisbane CityCairns RegionCanberra Tourism RegionDarwin Tourism RegionGold Coast Tourism RegionHobart Tourism RegionMelbourne CityMelbourne MetropolitanPerth CitySydney CitySydney Metropolitan
Highlights – New ZealandChristchurch dominates hotel openingsHotel development moderates as reconstruction projects have opened Accommodation pipeline points to greater product differentiation over the coming yearsMooted projects increase ahead of the Reserve Bank’s shift to a rate tightening cycleAccommodation building consents reach new low in 2013Riding the waveNew Zealand’s recent trading performance
MethodologyJLL Accommodation Supply TrackingJLL Hotel Development Barometer
Cover: Proposed Ritz Carlton Perth, due to open January 2018.
JLL’s Hotels & Hospitality Group serves as the hospitality industry’s global leader in real estate services for luxury, upscale, select service and budget hotels; management rights; convention centers; mixed-use developments and other hospitality properties. The firm’s 300 dedicated hotel and hospitality experts partner with investors and owner/operators around the globe to support and shape investment strategies that deliver maximum value throughout the entire lifecycle of an asset.
In the last five years, the team completed more transactions than any other hotels and hospitality real estate advisor in the world totaling nearly US$36 billion, while also completing approximately 4,000 advisory and valuation assignments. The group’s hotels and hospitality specialists provide independent and expert advice to clients, backed by industry-leading research.
For more news, videos and research from JLL’s Hotels & Hospitality Group, please visit: www.jll.com/hospitality or download the Hotels & Hospitality Group’s iPhone app or iPad app from the App Store.

Karen WalesExecutive Vice President – Research and ConsultingKaren is responsible for the firm’s hotel investment research in the Asia Pacific region and has been involved in several major global research assignments and the provision of strategic advisory services including market demand studies, financial feasibilities and consultancy in the hotel and tourism sector. Karen has an in-depth understanding of the hotel and tourism industry, with previous experience in advisory and asset management, as well as strong operational experience.
Julian WhistonExecutive Vice President – Strategic AdvisoryJulian has been in practice for 24 years as a valuer and property consultant. His experience within the hotels sector spans three continents having completed assignments across Asia, Europe, Australia and the South Pacific. Based in Brisbane, Julian oversees the Queensland strategic advisory division. Julian and his team have completed assignments for all the major banking institutions active in the State as well as numerous hotel accommodation and pub owners, investors and developers.
Stephen DoyleExecutive Vice President – Strategic AdvisoryStephen joined JLL in 2013 with over 13 years’ experience in all manner of commercial valuations, including five and a half years specialising in hotel and tourism property advisory assignments. Stephen has valued many of the leading hotels and resorts across NZ and the Pacific Island. He regularly acts in either a valuation or consultancy capacity, providing advice where properties are of a multi-faceted or highly specialist nature requiring a lateral application of fundamental property principles.
Anthony CorbettExecutive Vice President – Strategic AdvisoryAnthony has over 20 years’ international experience in the property industry across all asset classes however 16 years specialising in hotel, tourism and leisure. Anthony is a leading hotel investment advisor to major owners, institutions, operators and lenders and has particular expertise and experience in the appraisal of new hotel development projects, existing hotels, market demand studies, feasibility analysis, operating structures, investment market and land valuation.
Troy CraigManaging Director, Asia Pacific – Strategic AdvisoryTroy has over two decades worth of international experience in the property industry, the majority of which has been spent as a hospitality specialist. Troy assumed responsibility for the Asia Pacific Hotels & Hospitality Strategic Advisory business in 2014, following 12 years leading the Australasian business, overseeing an extensive and diverse team of specialist advisors. Troy has carried out numerous valuation, consultancy and feasibility studies for many of the region’s leading hotels.
Contributors
4 Hotels & Hospitality Group | July 2014

July 2014 | Hotels & Hospitality Group 5
Highlights – Australia• Australia’shoteldevelopmentpipelinehasincreasedby234roomsoverthepastyearwithafairlyequalproportionofroomsnowcurrentlyunderconstructionandproposed.
• Currentlythereare7,588roomsinthedevelopmentpipeline(underconstructionandproposed)whichrepresentsthehighestlevelformorethanadecade.
• Roomsunderconstructionhaveincreased13.3%(413rooms)withfive(1,039rooms)majornewconstructionstarts.Thiswaspartiallyoffsetbytheopeningof18establishments(1,631rooms).ConstructionactivityismostprevalentinSydney(1,008rooms),Brisbane(765rooms)andAdelaide(614rooms).
• Thenumberofproposedroomshasreduced4.2%(-179rooms).ProposedprojectsaregreatestinPerthandBrisbanewithanumberofprojectshavingbeenslatedforanextendedperiodoftime.Changingmarketconditionsforbothhasresultedinfewerprojectsadvancing.
• Mootedaccommodationroomshaveincreasedconsiderablyoverthepastyearwith16,374roomsnowbeingconsidered.Whilstindicatingthattheaccommodationpipelineisbuilding,wenotethisalsoincludestheproposedAquismega-developmentinCairnswhichaccountsforalmosthalfofmootedrooms.Notwithstanding,Melbourne,BrisbaneandSydneycontinuetoreceivethemostdeveloperattention.
• Nationalaccommodationbuildingapprovalsalsoindicatehigherlevelsofdevelopmentactivityoverthemediumterm.ThevalueofapprovedworkovertheyeartoMay2014averaged$161millionpermonth.Alevelwhichisjust8.6%belowthepeakmonthlylevelrecordedinAugust2008.
• Onthebasisofknownprojects,roomnightsupplyacrossAustralia’stenmajoraccommodationmarketsisforecasttoincreaseonaverageby1.6%perannumbytheendof2018.JLLaccommodationforecastsassumeaslightlyhigherrateofgrowthof2.6%perannum,havingallowedforanelementofunanticipatedsupplyand/orthatsomemootedprojectswillinevitablyadvance.Thisequatestotheadditionof12,400newroomsbytheendof2018acrossthetenmajormarkets.
Quest King William, Adelaide. Under construction, due to open June 2014

6 Hotels & Hospitality Group | July 2014
Openings gain pace
There has been a spate of hotel openings in Australia’s major accommodation markets over the past year. JLL has identified 18 new accommodation establishments comprising a total of 1,631 rooms. This represents an increase of 1.8% on the existing base stock. Activity has been concentrated in Melbourne (786 rooms), Canberra (252 rooms), Brisbane (250 rooms) and Darwin (186 rooms).
New projects include the return of international operator, Starwood Hotels & Resorts, to the Brisbane hotel market with the opening of the Four Points by Sheraton (246 rooms) in March 2014. Located in Mary Street in the heart of the CBD, the hotel offers over 300 square metres of function space and is self-rated 4.5-star.
Starwood also opened the Sheraton Melbourne in the same month which saw the return of the Sheraton brand to the Melbourne market, having been absent for almost a decade. Located at the Paris end of Little Collins Street, the 174-room hotel is part of a mixed use development which also incorporates residential and retail components.
Approximately 1,778 rooms are projected to open in the balance of the year with the majority of activity in Adelaide (614 rooms), Brisbane (449 rooms), Darwin (389 rooms) and Melbourne (250 rooms). Adelaide’s accommodation market is likely to be most significantly impacted. Openings in the balance of the year will represent an increase of 13.5% on the existing base stock. Projects are across a variety of segments and grades and therefore the impact will likely be reduced. Projects include Quest King William (105 keys), Ibis Adelaide (311 rooms) and The Mayfair (174 rooms).
New supply is also expected to impact Brisbane’s accommodation market as hotels rush to open ahead of the G20 summit in November 2014. Whilst it is likely that this event will provide a near term demand uplift (as seen in Perth in October 2011 for the Commonwealth Heads of Government Meeting), supply increases will likely result in occupancy levels moderating in early 2015 albeit with the impact spread across the city locale. New openings over the coming year include three projects in Fortitude Valley and four projects in the CBD.
Occupancy levels in Brisbane are stabilising after a year of decline. Occupancy levels peaked in August 2012 at 81.0% before reducing 3.5 points over the ensuing year as the mining and government sectors contracted. Occupancy levels averaged a lower but still respectable 78.2% to May 2014, just 0.7 points above the September 2013 low and highlighting a degree of weakness relative to the historic highs in the Brisbane accommodation market.
Australian Major Accommodation Markets – Development Snapshot June 2014
Summary Projects Net Rooms
% Increase
Years
Existing rooms (Jun-13)
90,770
Recently opened 18 1,631 1.8% H2 2013 & YTD 2014
Under construction 25 3,524 3.8% 2014-15Likely proposed 26 4,064 4.2% 2015-19Mooted 75 16,374 12.6% 2016-18Total 144 25,593 24.1%
Source: JLL
Four Points by Sheraton Brisbane. Recently opened, March 2014

July 2014 | Hotels & Hospitality Group 7
Mixed use developments
Mixed use developments, in which a single building or site accommodates two or more uses are becoming more common in Australia with many property groups extolling them as the way of the future for urban Australia. Few vacant sites in most state capitals, is expected to result in more mixed use developments as new buildings are developed on obsolete or underutilised buildings/sites to support the future growth of the city.
Hotels have a long tradition of incorporating a mix of different uses within the one building, particularly larger high-end product, as they have sought to diversify income streams from a reliance on the provision of accommodation rooms. A recent trend has been for hoteliers to lease these spaces to third party operators, recognising that their expertise does not necessarily extend to the provision of these additional services. The trend for leasing restaurants to “celebrity” chefs, particularly in five star hotels, has become commonplace globally given the economic benefits it can bring to the hotel, whilst also adding value from a positive brand association. In a built city, the opportunity for complementary brands to integrate vertically to reduce marketing costs and increase foot traffic could provide additional scope for new accommodation development.
The growing commonality of mixed use developments is also placing greater emphasis on ‘getting the right brand’ in order to add value to the rest of the scheme, for example branded residences or premium grade commercial office. In these instances, owners have exhibited a greater willingness to accept higher base fees and agree to less palatable commercial terms in order to secure ‘signature brands’ to enhance the overall development profit.
Whilst mixed use developments can bring higher yields, spread risks, generate synergies between complementary tenants and attract potential purchasers from a wider variety of market sectors, their appeal to equity investors has been mixed. Australian institutions have shown less appetite for mixed use developments with the industry promoting sector specialists. On the contrary, Chinese and South East Asian investors are more familiar with mixed use schemes as the ‘modus operandi’ for development across the region and thus appear more accepting of the composite return rather focussing on the individual asset returns within any given scheme.
Pipeline has moderated over the past year
Rooms under construction have increased 13.3% (413 rooms) whereas the number of proposed rooms has declined 4.2% (-179 rooms) to 4,064 rooms as shown in the chart following.
Whilst the accommodation development pipeline remains above the long term average, only 26 projects are expected to advance in the near term. High occupancy levels and capacity constraints are therefore expected to remain a feature of the Australian hotel investment landscape over the next few years.
Proposed Under construction Average Pipeline
0
1,000
2,000
3,000
4,000
5,000
6,000
7,000
8,000
0
1,000
2,000
3,000
4,000
5,000
6,000
7,000
8,000
Sep-
03
Mar-0
4
Sep-
04
Mar-0
5
Sep-
05
Mar-0
6
Nov-0
6
Mar-0
7
Nov-0
7
Mar-0
8
Dec-0
8
Aug-
09
Mar-1
0
Jan-
11
Aug-
11
Jun-
12
Apr-1
3
May-1
4
Acco
mmod
ation
Pipe
line (
Room
s)
Source: JLL
Australian Hotel Development Trends 2003 to 2014
Major construction starts include the International Convention Centre Hotel Sydney (590 rooms), Treasury Building Perth (48 rooms), Hotel Alex Perth (74 rooms), Capri by Fraser in Brisbane (239 rooms) and Quest Berrimah (88 rooms) and D105 on Mitchell (133 rooms) in Darwin.
The commencement of works on the International Convention Centre Sydney marks an important milestone for the industry. A lack of internationally competitive facilities is believed to have held back the Sydney hotel and tourism market for more than a decade. Demolition of the existing facility is expected to be completed in May 2014 and with the new facility scheduled for completion in late 2016. Planning consent was granted in December 2013 for the Development Application (DA) for a Concept Proposal for the new urban neighbourhood in Darling Harbour and the hotel was granted planning approval in May 2014. The hotel will be of a luxury standard with up to 616 rooms to support the special event and tourist functions of Darling Harbour as well as ancillary bar, restaurant, ballroom and meeting/function centre. The hotel will also have a club-lounge within a sculpted roof feature and be of a unique architectural design marking the northern end of the ICC Sydney and western side of Cockle Bay.

8 Hotels & Hospitality Group | July 2014
Construction works have also commenced at the Old Treasury Buildings in Perth. Representing one of the most significant heritage precincts in Western Australia, FJM property will restore the collection of buildings into a mix of hotel, hospitality and retail uses with works scheduled for completion early 2015. FJM is involved in the hospitality operations of some of Perth’s most popular establishments and will operate both hotels which are currently under construction in Perth, the second being another conversion project in Northbridge. Hotel Alex will be built at the 1921-built premises of a previous National Bank branch.
Work has also started on another conversion project at 80 Albert Street Brisbane. The property is being developed by Frasers Hospitality and will be the first Capri branded property in Australia. Capri is targeted at meeting the 24/7 lifestyle needs of today’s e-generation of business travellers, often referred to as the Millennials. Capri offers the facilities of an upscale hotel but with an apartment-styled product. This represents the further maturation of the serviced apartment sector with greater segmentation evident with brands targeting the luxury, upscale and midscale markets.
Of those 26 proposed projects, the majority are slated for Perth (1,232 rooms), Brisbane (809 rooms) and Melbourne (376 rooms).
Likely proposed Under construction Recently opened Annual Average Increase to 2018
0.0% 0.5% 1.0% 1.5% 2.0% 2.5% 3.0% 3.5% 4.0% 4.5%
0
500
1,000
1,500
2,000
2,500
Adela
ide
Brisb
ane
Cairn
s
Canb
erra
Darw
in
Gold
Coas
t
Hoba
rt
Melbo
urne
Melbo
urne
Metr
o
Perth
Sydn
ey
Sydn
ey M
etro Pe
rcenta
ge In
creas
e on E
xistin
g Stoc
k
Acco
mmod
ation
Dev
elopm
ent P
ipelin
e (Ro
oms)
Source: JLL
Australia’s Major Accommodation Markets – Development Snapshot May 2014
Projects in Perth are dominated by the luxury segment including Crown Perth (500 rooms), Ritz Carlton Perth (204 rooms) and The Westin Perth (300 rooms) whereas Accor have recently been announced as the operator, under the Ibis Styles brand, of a new development in East Perth. Projects are slated to open between 2016 and 2018 which should allow time for the Perth hotel market to stabilise.
Similar to Brisbane, trading in Perth moderated through 2013 with the slowdown in the mining sector and with a number of projects having moved into the production phase. Occupancy levels reached a low of 82.7% in August 2013 but have recorded monthly gains over the past seven months to average 84.5% to May 2014. Notwithstanding, rates have continued to decline and are currently 5.2% lower than the February 2013 peak.
The Treasury Building, Perth. Under construction, due to open January 2015
The Treasury Building, Perth. Under construction, due to open January 2015

July 2014 | Hotels & Hospitality Group 9 Subhead
Xereperspit prehenis earia dolorepro corum eatquiatur aritiur, a atium aut ipienihilia ex est, velluptatur magnatur, que volore nos mintio. Lut latibusam, iliquossitia dendunt.
Reptaquas aut aut qui assiminctur as molupta tectatur, il ea veni anis atur andios estio. Henihictia de nobis pa peritas veratessin coreribus quaestius, ut essin non et, seceate nus il moditaqui repudan imenimi, sam exeris ne pore necto expero dendi ut pe volut volora essecatur solupta tibust, occae voloresequis venim faccus esequid emoluptatum fugitis id ulla dionseque voluptas dolores ipient facera pa aut inimper spiciis event, con cum ium, to blanis nonsequunt aut latiate voluptatur? Ihillaboreic te dolor as as etur?
Mooted projects indicate Australia is on the precipice of the next hotel development cycle
JLL has identified a further 75 mooted projects across the ten major accommodation markets comprising 16,374 rooms. Mooted projects include those where a Development Application (DA) for accommodation rooms has recently been submitted or is under review, although there is no guarantee that such projects will progress. This differs to proposed projects where the DA has been approved and JLL has determined that construction is imminent.
Mooted projects have recorded a significant increase over the past year, albeit boosted by the Aquis mega-development north of Cairns. The proponents of the $8.15 billion Aquis mega-resort at Yorkeys Knob have been awarded one of two regional integrated resort developments in Queensland. Aquis had made it clear that the project – which includes eight hotels (7,500 rooms), a convention centre, aquarium, retail shopping, theatres and a 18-hole golf course – is not financially viable without a casino. If proceeding, the project would represent an increase of 69% on the existing accommodation rooms in Tropical North Queensland which includes Cairns, Palm Cove and Port Douglas. Needless to say the impact would be material although such a large parcel of newly constructed tourism infrastructure would also likely trigger a demand surge.
The other casino licence was awarded to ASF Consortium’s $7.5 billion Broadwater Marine project, on the northern end of the Gold Coast. The ASF proposed project also includes a cruise ship terminal but remains to be fully defined and has yet to submit its environmental impact statement. This project is therefore omitted from our mooted projects at this time.
Outside of these projects, mooted developments are greatest in Melbourne (2,363 rooms), Brisbane (1,943 rooms), Sydney (1,087 rooms), Darwin (914 rooms) and Adelaide (700 rooms). While more projects are likely to be proposed in the coming years, the probability of all existing mooted and new projects advancing is low as feasibility hurdles will become more challenging as construction and proposed projects advance.
The current strength of the residential sector is also likely to hold back new accommodation development as both land and construction costs continue to increase. We do note however that some developers are including a short term accommodation component in residential developments as they believe such projects are viewed more favourably by local planning authorities. We note however that projects which have not been designed to meet an identified accommodation need or properly assessed against local market conditions may struggle to achieve the desired level of operational viability.
International construction cost comparison
Turner and Townsend’s International construction cost survey 2013, provides an interesting insight into global hotel construction costs. This report compares 23 nations using purchasing power parity; a methodology which was developed in conjunction with Bond University’s Centre for Comparative Construction Research. This replaces the previously used USD comparison which failed to take account of local living standards and the volatility of exchange rates.
Purchasing power parity uses a standard basket of equally weighted construction items (material, labour and plant) to calculate purchasing power parity values in each country. The average price of items in the basket for a particular country is then divided by the average price for a ‘base country’ to calculate relative purchasing power parity.
The higher the purchasing power parity-adjusted cost, the higher are the relative costs of building in one country over another.
Contrary to previous surveys and reflecting the changed environment over the past year, this identifies that Australia is ranked 18th for luxury construction costs and with a lower relative cost than for all other countries in Asia Pacific included the survey. For midscale hotels, Australia ranks 15th with lower relative costs in Asia Pacific in China and India.
Australia is one of the most transparent real estate markets in the world with a wealth of available information and data upon which to base investment decisions. This construction cost comparison highlights why offshore developers are attracted to Australia’s hotel sector with development capital increasingly sourced offshore, particularly from Asia. Current construction projects are being funded with capital from China, Malaysia, Hong Kong and Singapore, often with a local partner.
0
1000
2000
3000
4000
5000
6000
Cana
daBr
azil
USCh
inaSo
uth A
frica
Ugan
daInd
iaGe
rman
yAu
strali
a UKRu
ssia
Nethe
rland
sIre
land
Malay
siaPo
land
Sing
apor
eSo
uth K
orea
Qatar
Vietn
amHo
ng K
ong
Oman
Japa
nUA
E
Midscale
0
2000
4000
6000
8000
10000
Braz
ilSo
uth A
frica
Ugan
da USCa
nada
Austr
alia
India
Russ
iaCh
inaNe
therla
nds
Sing
apor
e UKGe
rman
yVi
etnam
Irelan
dPo
land
Hong
Kon
gMa
laysia
Qatar
Oman
UAE
Japa
nSo
uth K
orea
Luxury

Ibis Hotel, Adelaide. Under construction, due to open July 2014
July 2014 | Hotels & Hospitality Group 11
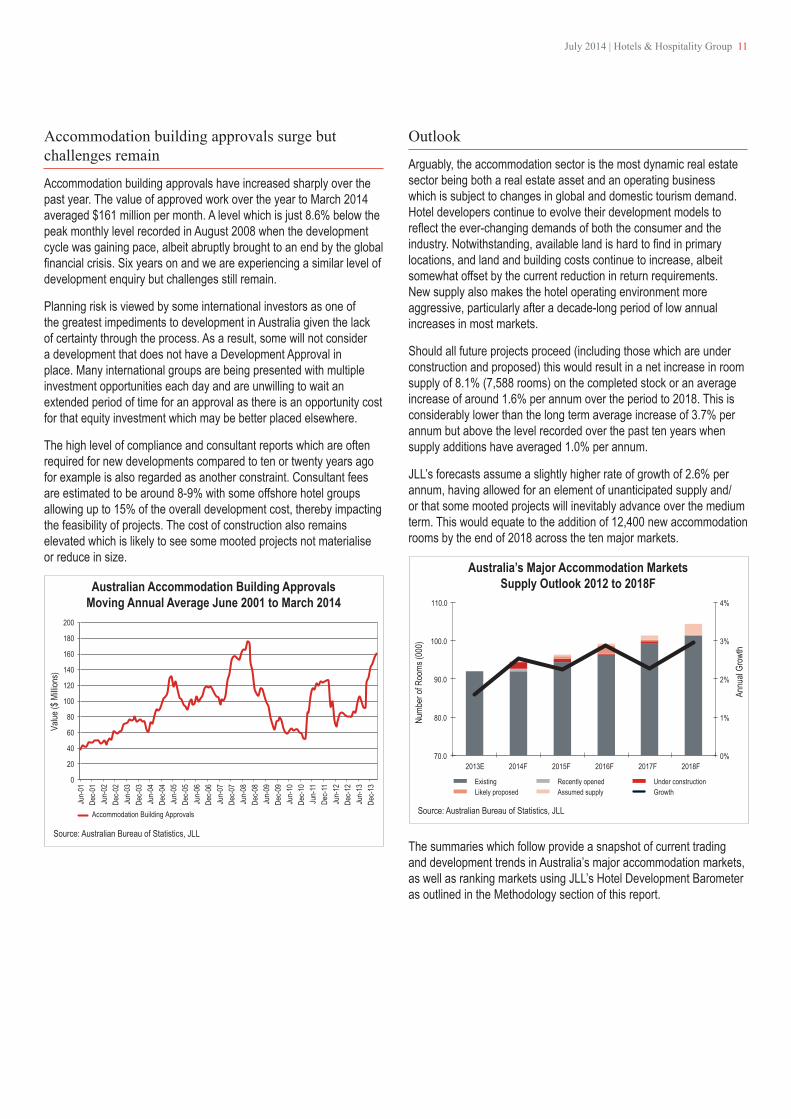
Accommodation building approvals surge but challenges remain
Accommodation building approvals have increased sharply over the past year. The value of approved work over the year to March 2014 averaged $161 million per month. A level which is just 8.6% below the peak monthly level recorded in August 2008 when the development cycle was gaining pace, albeit abruptly brought to an end by the global financial crisis. Six years on and we are experiencing a similar level of development enquiry but challenges still remain.
Planning risk is viewed by some international investors as one of the greatest impediments to development in Australia given the lack of certainty through the process. As a result, some will not consider a development that does not have a Development Approval in place. Many international groups are being presented with multiple investment opportunities each day and are unwilling to wait an extended period of time for an approval as there is an opportunity cost for that equity investment which may be better placed elsewhere.
The high level of compliance and consultant reports which are often required for new developments compared to ten or twenty years ago for example is also regarded as another constraint. Consultant fees are estimated to be around 8-9% with some offshore hotel groups allowing up to 15% of the overall development cost, thereby impacting the feasibility of projects. The cost of construction also remains elevated which is likely to see some mooted projects not materialise or reduce in size.
Accommodation Building Approvals
0
20
40
60
80
100
120
140
160
180
200
Jun-
01
Dec-0
1 Ju
n-02
De
c-02
Jun-
03
Dec-0
3 Ju
n-04
De
c-04
Jun-
05
Dec-0
5 Ju
n-06
De
c-06
Jun-
07
Dec-0
7 Ju
n-08
De
c-08
Jun-
09
Dec-0
9 Ju
n-10
De
c-10
Jun-
11
Dec-1
1 Ju
n-12
De
c-12
Jun-
13
Dec-1
3
Value
($ M
illion
s)
Source: Australian Bureau of Statistics, JLL
Australian Accommodation Building Approvals Moving Annual Average June 2001 to March 2014
Outlook
Arguably, the accommodation sector is the most dynamic real estate sector being both a real estate asset and an operating business which is subject to changes in global and domestic tourism demand. Hotel developers continue to evolve their development models to reflect the ever-changing demands of both the consumer and the industry. Notwithstanding, available land is hard to find in primary locations, and land and building costs continue to increase, albeit somewhat offset by the current reduction in return requirements. New supply also makes the hotel operating environment more aggressive, particularly after a decade-long period of low annual increases in most markets.
Should all future projects proceed (including those which are under construction and proposed) this would result in a net increase in room supply of 8.1% (7,588 rooms) on the completed stock or an average increase of around 1.6% per annum over the period to 2018. This is considerably lower than the long term average increase of 3.7% per annum but above the level recorded over the past ten years when supply additions have averaged 1.0% per annum.
JLL’s forecasts assume a slightly higher rate of growth of 2.6% per annum, having allowed for an element of unanticipated supply and/or that some mooted projects will inevitably advance over the medium term. This would equate to the addition of 12,400 new accommodation rooms by the end of 2018 across the ten major markets.
Assumed supply Likely proposed Under construction Recently openedExisting Growth
0%
1%
2%
3%
4%
70.0
80.0
90.0
100.0
110.0
2013E 2014F 2015F 2016F 2017F 2018F
Annu
al Gr
owth
Numb
er of
Roo
ms (0
00)
Source: Australian Bureau of Statistics, JLL
Australia’s Major Accommodation Markets Supply Outlook 2012 to 2018F
The summaries which follow provide a snapshot of current trading and development trends in Australia’s major accommodation markets, as well as ranking markets using JLL’s Hotel Development Barometer as outlined in the Methodology section of this report.

12 Hotels & Hospitality Group | July 2014
Australian Hotel Development Register – May 2014
Likelihood of hotel development
35%55%
20% 35%55%
35% 40%
75%50%
70%
3.4%
4.3%
0.8%
2.4%
4.6%
0.7%
2.1%2.6%
4.5%
1.9%
ADELAIDE
BRISBANE
CAIRNS
CANBERRA
DARWIN
GOLD COAST
HOBART
MELBOURNEPERTH
SYDNEY
Source: JLL
Average supply increases expected per annum to 2018

July 2014 | Hotels & Hospitality Group 13
Australia’s Recent Trading PerformanceRevPAR is a performance metric in the hotel industry, which is calculated by multiplying a hotel’s average daily room rate (ADR) by its occupancy rate. RevPAR is provided for the year to May 2014, calculating as a moving annual average and compared to the most recent high.
ADELAIDE
$126DEC 2008
$122MAY 2014
3.4%
CAIRNS
$106DEC 2007
$100MAY 2014
5.9%
HOBART*
$121APR 11
$133MAY 2014
10.2%
DARWIN
$145NOV 2013
$141MAY 2014
2.6%
PERTH
$194SEP 2012
$180MAY 2014
7.4%
BRISBANE
$160AUG 2012
$149MAY 2014
6.5%
CANBERRA
$137SEP 2012
$125MAY 2014
8.8%
GOLD COAST
$121DEC 2007
$112MAY 2014
7.1%
MELBOURNE*
$152DEC 08
$168MAY 2014
10.7%
SYDNEY*
$168AUG 08
$198MAY 2014
17.6%
* Highest level ever recorded

14 Hotels & Hospitality Group | July 2014In
dex
(Bas
e Ye
ar 1
995)
Building Price Index RevPAR Index
60
80
100
120
140
160
180
200
220
1995
19
96
1997
19
98
1999
20
00
2001
20
02
2003
20
04
2005
20
06
2007
20
08
2009
20
10
2011
20
12
2013
20
14F
Occu
panc
y (%
)
ADR
/ Rev
PAR
($)
RevPAR (MAA)ADR (MAA)Occupancy
65% 67% 69% 71% 73% 75% 77% 79% 81% 83% 85%
$100 $110 $120 $130 $140 $150 $160 $170 $180 $190 $200
Dec-0
7 Ma
r-08
Jun-
08
Sep-
08
Dec-0
8 Ma
r-09
Jun-
09
Sep-
09
Dec-0
9 Ma
r-10
Jun-
10
Sep-
10
Dec-1
0 Ma
r-11
Jun-
11
Sep-
11
Dec-1
1 Ma
r-12
Jun-
12
Sep-
12
Dec-1
2 Ma
r-13
Jun-
13
Sep-
13
Dec-1
3 Ma
y-14
Source: Rawlinsons 2013, JLL Note: June Year End
Source: STR Global, JLL Note: Moving Annual Average
Development activity snapshot
% INCREASE
1 recently opened 3 under construction due 2014
105 recently opened509 under construction due 2014
2.3% recently opened10.9% under construction due 2014
ExISTING ROOMS (JUN-13)
4,551 NET ROOMS614 13.2%TOTAL
PROJECTS4
SUMM
ARY
Assumed supplyLikely proposedUnder constructionRecently completedExistingGrowth
2017F 2013E 2014F 2015F 2016F 2018F
13.2% 1.0% 1.0% 0.5% 2.0%
Future supply: impact on market Upcoming projects
Construction cost comparison Trading performance
RECENTLY OPENED
Quest King William 105 rooms | Serviced Apartments | Jun-14Quest Apartments
UNDER CONSTRUCTION
Ibis Hotel 311 rooms | Budget/Mid-Market MidscaleJul-14 | Accor
The Watson 24 rooms | Serviced Apartments | Aug-14Art Series Hotels
The Mayfair 174 rooms | Boutique Hotel | Oct-14Adabco Properties & CML Hotels
Adelaide CityJLL ranks the likelihood of additional hotel development in Adelaide City at around 35% with three projects (509 rooms) scheduled for completion over the balance of 2014. Projects are across a variety of segments and grades and therefore we expect the impact to be reduced. Notwithstanding, increases are expected to result in downward pressure on occupancy levels through 2015, ahead of the opening of new infrastructure. This will likely delay the advancement of any proposed projects. Supply increases are projected to average 3.4% per annum to end 2018. Nominal RevPAR in Adelaide has averaged $122 over the year to May 2014, which is 3.4% lower than the December 2008 market peak of $126.
JLL is aware of six mooted accommodation projects with 700 rooms although we consider it unlikely that these will proceed in the current environment.
Hotel development barometer
Source: JLL
%35

July 2014 | Hotels & Hospitality Group 15In
dex
(Bas
e Ye
ar 1
995)
Building Price Index RevPAR Index
60
80
100
120
140
160
180
200
220
240
1995
19
96
1997
19
98
1999
20
00
2001
20
02
2003
20
04
2005
20
06
2007
20
08
2009
20
10
2011
20
12
2013
20
14F
Occu
panc
y (%
)
ADR
/ Rev
PAR
($) 70%
72% 74% 76% 78% 80% 82% 84% 86% 88% 90%
$100 $110 $120 $130 $140 $150 $160 $170 $180 $190 $200
Dec-0
4Ju
n-05
Dec-0
5Ju
n-06
Dec-0
6Ju
n-07
Dec-0
7Ju
n-08
Dec-0
8Ju
n-09
Dec-0
9Ju
n-10
Dec-1
0Ju
n-11
Dec-1
1Ju
n-12
Dec-1
2Ju
n-13
Dec-1
3Ma
r-14
RevPAR (MAA)ADR (MAA)Occupancy
Source: Rawlinsons 2013, JLL Note: June Year End
Source: STR Global, JLL Note: Moving Annual Average
Development activity snapshot
% INCREASE
6 recently opened5 under construction due 2014-155 likely proposed due 2015-16
480 recently opened667 under construction due 2014-15973 likely proposed due 2015-16
5.3% recently opened6.9% under construction due 20149.5% likely proposed due 2015-16
ExISTING ROOMS (JUN-13)
9,122 NET ROOMS2,120 21.7%TOTAL
PROJECTS16
SUMM
ARY
Hotel development barometer
Assumed supplyLikely proposedUnder constructionRecently completedExistingGrowth
2013E 2014F 2015F 2016F 2017F 2018F
8.4% 2.4% 5.7% 3.1% 2.1%
Future supply: impact on the market
Construction cost comparison Trading performance
Brisbane CityJLL ranks the likelihood for hotel development in Brisbane at around 55% as the near term outlook remains weak and with five new accommodation projects scheduled to open in the second half of 2014, ahead of the G20 summit in November. Whilst trading is likely to experience a near term demand uplift from hosting this event, supply increases will likely result in occupancy levels moderating in early 2015 given the current trading characteristics. Nominal RevPAR in Brisbane has averaged around $149 over the year to May 2014, which is 6.5% below the August 2012 peak of $160. Supply increases are expected to average 4.3% per annum to end 2018 which represents the highest rate of growth of the major accommodation markets.
JLL is aware of 13 mooted projects with 1,943 rooms, although we consider it unlikely that all will proceed in the current environment. This includes the proposed Integrated Resort Development at Queens Wharf Brisbane for which a proponent and development scheme has yet to be selected.Source: JLL
%55
RECENTLY OPENEDMeriton Apartments Herschel St – Stage One 90 rooms | Serviced Apartments | Jun-13 | Meriton Serviced Apartments
Chifley at Lennons -154 rooms | Full Service Upscale | Jul-13 | SilverNeedle Hospitality
Four Points by Sheraton Brisbane 246 rooms | Full Service Upscale | Mar-14 | Starwood Hotels & Resorts
The Gambaro Hotel 68 rooms | Boutique Hotel | May-14 | Owner Operator
Meriton Apartments Herschel St –Stage Two and Three
179 rooms | Serviced Apartments | Jun-14 | Meriton Serviced Apartments
UNDER CONSTRUCTIONAlpha Mosaic Brisbane 51 rooms | Serviced Apartments | Jun-14 | Owner Operator
TRYP by Wyndham Hotels Fortitude Valley 65 rooms | Serviced Apartments | Sep-14 | Wyndham Hospitality
The Inchcolm Hotel Extension 14 rooms | Full Service Luxury | Sep-14 | Accor
Next Hotel (Lennons Hotel Conversion) 272 rooms | Full Service Upscale | Sep-14 | SilverNeedle Hospitality
Capri by Fraser 239 rooms | Full Service Upscale | Mar-15 | Frasers Hospitality
Alex Perry Serviced Apartments 77 rooms | Serviced Apartments | Apr-15 | Owner Operator
Upcoming projects

16 Hotels & Hospitality Group | July 2014
Cairns RegionJLL ranks the likelihood for hotel development in Cairns City at around 20% with little impetus for new accommodation development projects. RevPAR in Cairns has averaged $100 over the year to May 2014 and while having shown some improvement, it remains 5.9% below the December 2007 market peak of $106. Supply increases are projected to average 0.8% per annum to end 2018. At this stage this does not reflect the mooted Aquis integrated resort development project with preliminary approval for a Casino operator. This proposed project in its current form would double the existing rooms stock in the Cairns Region and needless to say, would have a material impact on the local accommodation and likely defer any additional projects for an extended period of time.
Development activity snapshot
ExISTING ROOMS (JUN-13)
7,209 NET ROOMS0TOTAL
PROJECTS0
SUMM
ARY
Assumed supplyLikely proposedUnder constructionRecently completedExistingGrowth
2013E 2014F 2015F 2016F 2017F 2018F
0.5% 0.5% 1.0% 1.0% 1.0%
% INCREASE0.0%
Future supply: impact on market
Construction cost comparison Trading performance
Source: Rawlinsons 2013, JLL Note: June Year End
Source: STR Global, JLL Note: Moving Annual Average
Inde
x (B
ase
Year
199
5)
Building Price Index RevPAR Index
60
80
100
120
140
160
180
200
220
240
1995
19
96
1997
19
98
1999
20
00
2001
20
02
2003
20
04
2005
20
06
2007
20
08
2009
20
10
2011
20
12
2013
20
14F
Occu
panc
y (%
)
ADR
/ Rev
PAR
($) 65%
70%
75%
80%
85%
$50 $60 $70 $80 $90
$100 $110 $120 $130 $140 $150
Dec-
07
Mar
-08
Jun-
08
Sep-
08
Dec-
08
Mar
-09
Jun-
09
Sep-
09
Dec-
09
Mar
-10
Jun-
10
Sep-
10
Dec-
10
Mar
-11
Jun-
11
Sep-
11
Dec-
11
Mar
-12
Jun-
12
Sep-
12
Dec-
12
Mar
-13
Jun-
13
Sep-
13
Dec-
13
Mar
-14
RevPAR (MAA)ADR (MAA)Occupancy JLL is aware of one major mooted project in Cairns with 3,750 rooms being the Aquis Integrated Resort development which has recently been granted preliminary casino approval.
Hotel development barometer
%20
Source: JLL
Upcoming projectsJLL is not aware of any upcoming projects in Cairns City.

July 2014 | Hotels & Hospitality Group 17
Canberra Tourism RegionJLL ranks the likelihood for hotel development in Canberra Tourism Region at around 35%. Nominal RevPAR in Canberra has averaged around $125 over the year to May 2014, which is 8.8% below the September 2012 high. Trading has declined over the past 18 months with the change to Federal Government travel bookings to one single agency, putting downward pressure on rates. Soft demand ahead of the September 2013 election and more recently following cuts to the public sector has seen government travel expenditure moderate. These changed market conditions are having a more pronounced impact on the upscale segment and are likely to persist while the current environment prevails. Supply increases in Canberra are expected to average 2.4% per annum to end 2018 with three projects currently under construction and two more proposed projects expected to advance in the short term.
Development activity snapshot
3 recently opened4 under construction due 2014-151 likely proposed due 2015-16
252 recently opened387 under construction due 2014-1596 likely proposed due 2015-16
ExISTING ROOMS (JUN-13)
4,998 NET ROOMS735TOTAL
PROJECTS8
SUMM
ARY
Assumed supplyLikely proposedUnder constructionRecently completedExistingGrowth
2013E 2014F 2015F 2016F 2017F 2018F
2.1% 6.0% 1.8% 1.0% 1.0%
% INCREASE
5.0% recently opened7.4% under construction due 2014-151.7% likely proposed due 2015-16
14.1%
Future supply: impact on the market
Construction cost comparison Trading performance
Source: Rawlinsons 2013, JLL Note: June Year End
Source: STR Global, JLL Note: Moving Annual Average
Inde
x (B
ase
Year
199
5)
Building Price Index RevPAR Index
60
80
100
120
140
160
180
200
220
1995
19
96
1997
19
98
1999
20
00
2001
20
02
2003
20
04
2005
20
06
2007
20
08
2009
20
10
2011
20
12
2013
20
14F
Occu
panc
y (%
)
ADR
/ Rev
PAR
($)
65%
70%
75%
80%
85%
$100 $110 $120 $130 $140 $150 $160 $170 $180 $190 $200
Dec-
07
Mar
-08
Jun-
08
Sep-
08
Dec-
08
Mar
-09
Jun-
09
Sep-
09
Dec-
09
Mar
-10
Jun-
10
Sep-
10
Dec-
10
Mar
-11
Jun-
11
Sep-
11
Dec-
11
Mar
-12
Jun-
12
Sep-
12
Dec-
12
Mar
-13
Jun-
13
Sep-
13
Dec-
13
Mar
-14
RevPAR (MAA)ADR (MAA)Occupancy
Hotel development barometer
JLL is aware of six mooted projects with 397 rooms, although we think it unlikely that all will proceed in the current environment.
%35
Source: JLL
RECENTLY OPENED
Abode Woden 153 rooms | Full Service Upscale | Aug-13Abode Apartment Hotels
Hotel Hotel – Stage 1 68 rooms | Full Service Upscale | Nov-13 | Owner Operator
Hotel Hotel – Stage 2 – Design Icon Apartments
31 rooms | Full Service Upscale | Apr-14 | Owner Operator
UNDER CONSTRUCTIONKurrajong Hotel 30 rooms | Full Service Midscale | Oct-14 | Toga Far East
Realm Serviced Apartments 46 rooms | Budget/Mid-Market Midscale | Dec-14 Doma Group
The Little National (Barton Hotel & Carpark)
120 rooms | Budget/Mid-Market Midscale | Jun-15Doma Group
Vibe Hotel Canberra Airport 191 rooms | Full Service Upscale | Nov-15 | Toga Far East
Upcoming projects

18 Hotels & Hospitality Group | July 2014
Darwin Tourism RegionJLL ranks the likelihood for hotel development in Darwin at around 55%. Trading in Darwin has exhibited a downward trend over the past five months as the mining segment has softened and is likely to continue to decline through the mid part of the year with the opening of 300 new serviced apartment rooms in July 2014. Nominal RevPAR has averaged $141 over the year to May 2014 which is 2.6% below November 2013 high. Supply increases are expected to average 4.6% per annum to end 2018 with three projects currently under construction due to open in 2014 and one proposed for 2015.
Development activity snapshot
1 recently opened3 under construction due 2014
186 recently opened577 under construction due 2014
ExISTING ROOMS (JUN-13)
3,639 NET ROOMS755TOTAL
PROJECTS4
SUMM
ARY
Assumed supplyLikely proposedUnder constructionRecently completedExistingGrowth
2013E 2014F 2015F 2016F 2017F 2018F
10.2%5.1% 5.3% 1.9% 2.9% 2.9%
% INCREASE
5.1% recently opened13.6% under construction due 2014
19.6%
Future supply: impact on market
Construction cost comparison Trading performance
Source: Rawlinsons 2013, JLL Note: June Year End
Source: STR Global, JLL Note: Moving Annual Average
Inde
x (B
ase
Year
199
8)
Building Price Index RevPAR Index
60
80
100
120
140
160
180
200
220
240
1999
2000
2001
2002
2003
2004
2005
2006
2007
2008
2009
2010
2011
2012
2013
2014
F
Occu
panc
y (%
)
ADR
/ Rev
PAR
($) 65%
70%
75%
80%
85%
$100 $110 $120 $130 $140 $150 $160 $170 $180 $190 $200
Dec-
07
Mar
-08
Jun-
08
Sep-
08
Dec-
08
Mar
-09
Jun-
09
Sep-
09
Dec-
09
Mar
-10
Jun-
10
Sep-
10
Dec-
10
Mar
-11
Jun-
11
Sep-
11
Dec-
11
Mar
-12
Jun-
12
Sep-
12
Dec-
12
Mar
-13
Jun-
13
Sep-
13
Dec-
13
Mar
-14
RevPAR (MAA)ADR (MAA)Occupancy
Upcoming projects
RECENTLY OPENED
H Hotel 186 rooms | Full Service Upscale | Jun-13Owner Operator
UNDER CONSTRUCTION
Elan Soho Suites 301 rooms | Full Service Upscale | Jul-14Owner Operator
Quest Berrimah 88 rooms | Serviced Apartments | Sep-14Quest Apartments
D105 on Mitchell 133 rooms | Full Service Upscale | Jun-16Owner Operator
JLL is aware of ten mooted projects with 914 rooms in Darwin, although we think it unlikely that all will proceed in the current environment.
Hotel development barometer
%55
Source: JLL

July 2014 | Hotels & Hospitality Group 19
Gold Coast Tourism RegionJLL ranks the likelihood for new hotel development on the Gold Coast at around 35%. Gold Coast RevPAR has averaged $112 over the year to May 2014 with stronger growth evident over the past four months. This is still 7.1% below the December 2007 high of $121. Supply increases are expected to average 0.7% per annum to end 2018 with only one proposed project (239 rooms) expected to advance over the near term. Investment in infrastructure ahead of the Commonwealth Games in 2018 will likely see some mooted projects progress, but overall the supply outlook remains relatively benign.
Development activity snapshot
1 likely proposed due 2016 239 likely proposed due 2016ExISTING ROOMS (JUN-13)
13,501 NET ROOMS239TOTAL
PROJECTS1
SUMM
ARY
Assumed supplyLikely proposedUnder constructionRecently completedExistingGrowth
2014F 2015F 2016F 2017F 2018F 2013E
0.5%0.0% 0.5% 0.0% 0.0% 2.6%
% INCREASE
1.8% likely proposed due 2016
1.8%
Future supply: impact on the market
Construction cost comparison Trading performance
Source: Rawlinsons 2013, JLL Note: June Year End
Source: STR Global, JLL Note: Moving Annual Average
Inde
x (B
ase
Year
199
5)
Building Price Index RevPAR Index
60
80
100
120
140
160
180
200
220
240
1995
19
96
1997
19
98
1999
20
00
2001
20
02
2003
20
04
2005
20
06
2007
20
08
2009
20
10
2011
20
12
2013
20
14F
Occu
panc
y (%
)
ADR
/ Rev
PAR
($)
65%
70%
75%
80%
85%
$100
$120
$140
$160
$180
$200
Dec-0
7 Ma
r-08
Jun-
08
Sep-
08
Dec-0
8 Ma
r-09
Jun-
09
Sep-
09
Dec-0
9 Ma
r-10
Jun-
10
Sep-
10
Dec-1
0 Ma
r-11
Jun-
11
Sep-
11
Dec-1
1 Ma
r-12
Jun-
12
Sep-
12
Dec-1
2 Ma
r-13
Jun-
13
Sep-
13
Dec-1
3 Ma
r-14
RevPAR (MAA)ADR (MAA)Occupancy
Hotel development barometer
JLL is aware of a further three mooted projects with 570 rooms, although we think it unlikely that all will proceed in the current environment.
%35
Source: JLL
Upcoming projects
JLL is not aware of any upcoming projects in the Gold Coast Tourism Region.

20 Hotels & Hospitality Group | July 2014
Hobart Tourism RegionJLL ranks the likelihood for hotel development in Hobart Tourism Region at around 40%. Trading has continued to record strong growth with RevPAR over the year to May 2014 averaging $133 – to be at the highest level ever recorded. Developer appetite for accommodation construction in Hobart remains fairly low although we aware of two proposed projects (233 rooms) thought likely to progress in the near term. Supply increases are expected to average 2.1% per annum to end 2018 which assumes that some mooted projects will also advance.
Development activity snapshot
1 recently opened 5 likely proposed due 2015
17 recently opened120 likely proposed due 2015
ExISTING ROOMS (JUN-13)
2,687 NET ROOMS137TOTAL
PROJECTS6
SUMM
ARY %
INCREASE
0.6% recently opened4.4% likely proposed due 2015
5.1%
Construction cost comparison Trading performance
Source: Rawlinsons 2013, JLL Note: June Year End
Source: STR Global, JLL Note: Moving Annual Average
Inde
x (B
ase
Year
199
5)
Building Price Index RevPAR Index
60
80
100
120
140
160
180
200
1995
19
96
1997
19
98
1999
20
00
2001
20
02
2003
20
04
2005
20
06
2007
20
08
2009
20
10
2011
20
12
2013
20
14F
Occu
panc
y (%
)
ADR
/ Rev
PAR
($)
RevPAR (MAA)ADR (MAA)Occupancy (MAA)
65%
70%
75%
80%
85%
$100
$120
$140
$160
$180
$200
Dec-
07
Mar
-08
Jun-
08
Sep-
08
Dec-
08
Mar
-09
Jun-
09
Sep-
09
Dec-
09
Mar
-10
Jun-
10
Sep-
10
Dec-
10
Mar
-11
Jun-
11
Sep-
11
Dec-
11
Mar
-12
Jun-
12
Sep-
12
Dec-
12
Mar
-13
Jun-
13
Sep-
13
Dec-
13
Mar
-14
Assumed supplyLikely proposedUnder constructionRecently completedExistingGrowth
2013E 2014F 2015F 2016F 2017F 2018F
3.1%5.5% 0.0% 2.0%0.0%-2.0%
Future supply: impact on marketRECENTLY OPENED
Alabama Hotel Hobart 17 rooms | Budget/Mid-Market UpscaleSep-13 | Owner Operator
JLL is aware of four proposed projects with 264 rooms in Hobart.
Hotel development barometer
%40
Source: JLL
Upcoming projects

July 2014 | Hotels & Hospitality Group 21
Melbourne CityJLL ranks the likelihood for hotel development in Melbourne City at around 75%. Feasibility challenges are less pronounced in Melbourne with inherently cheaper land cost, greater site availability or choice, lower construction costs and more liberal planning regulations. Investor and operator confidence in the Victorian tourism industry also further underpins new accommodation development and the city has an excellent track record of absorbing significant new supply. Nominal RevPAR in Melbourne has averaged around $168 over the year to May 2014 to be at the highest level ever recorded. Growth is projected to remain robust over the coming years although the accommodation pipeline is building again. Supply increases are expected to average 2.6% per annum to end 2018 with two projects currently under construction and five proposed projects expected to advance over the near term. Proposed projects are mostly located in Docklands.
Development activity snapshot
6 recently opened2 under construction due 2014-176 likely proposed due 2015-18
786 recently opened250 under construction due 2014-17376 likely proposed due 2015-18
ExISTING ROOMS (JUN-13)
18,840 NET ROOMS1,412TOTAL
PROJECTS14
SUMM
ARY %
INCREASE4.2% recently opened1.3% under construction due 2014-171.9% likely proposed due 2015-18
7.3%
Construction cost comparison Trading performance
Source: Rawlinsons 2013, JLL Note: June Year End
Source: STR Global, JLL Note: Moving Annual Average
Inde
x (B
ase
Year
199
5)
Building Price Index RevPAR Index
80
100
120
140
160
180
200
220
240
1995
19
96
1997
19
98
1999
20
00
2001
20
02
2003
20
04
2005
20
06
2007
20
08
2009
20
10
2011
20
12
2013
20
14F
Occu
panc
y (%
)
ADR
/ Rev
PAR
($) 70%
72% 74% 76% 78% 80% 82% 84% 86% 88% 90%
$100 $110 $120 $130 $140 $150 $160 $170 $180 $190 $200
Dec-
04
Jun-
05
Dec-
05
Jun-
06
Dec-
06
Jun-
07
Dec-
07
Jun-
08
Dec-
08
Jun-
09
Dec-
09
Jun-
10
Dec-
10
Jun-
11
Dec-
11
Jun-
12
Dec-
12
Jun-
13
Dec-
13
Mar
-14
RevPAR (MAA)ADR (MAA)Occupancy
1.4%1.1% 0.5% 3.9% 3.2% 4.0%
2013F 2014F 2015F 2016F 2017F 2018F
Assumed supplyLikely proposedUnder constructionRecently completedExistingGrowth
Future supply: impact on the marketRECENTLY OPENED
Oaks on Williams 220 rooms | Serviced Apartments | Jul-13 | Oaks Hotels & Resorts
Adelphi Hotel 34 rooms | Boutique Hotel | Sep-13 | Owner Operator
Sebel The Quays Docklands 96 rooms | Serviced Apartments | Oct-13 | Accor
Tune Hotel – Melbourne 225 rooms | Budget/Mid-Market Midscale | Nov-13 | Tune Hotels
Sheraton Melbourne Hotel 174 rooms | Full Service Upscale | Mar-14 | Starwood Hotels & Resorts
Oaks Pinnacle 37 rooms | Serviced Apartments | Mar-14 | Oaks Hotels & Resorts
UNDER CONSTRUCTIONHotel Sophia (Extension) 50 rooms | Budget/Mid-Market Economy | Dec-14 | Owner Operator
Wyndham on William 200 rooms | Serviced Apartments | Q1-15 | Wyndham Hospitality
Hotel development barometer
JLL is aware of a further 14 mooted projects with 2,363 rooms and with a strong likelihood that some will advance over the medium term.
%75
Source: JLL
Upcoming projects

22 Hotels & Hospitality Group | July 2014
Melbourne MetropolitanMelbourne Metropolitan is defined as the Melbourne Tourism Region less Melbourne City and encompasses the broader city metropolitan. Major accommodation sub-markets in Melbourne Metropolitan include Hume, St Kilda, Monash, Stonnington and the Airport precinct. Melbourne Metropolitan’s accommodation market recorded slight RevPAR growth over the year to June 2013 (latest statistics available) of 0.8% with occupancies averaging 66.3% and ADR of $136. Supply increases are expected to average 0.9% per annum to end 2018 with two projects due to open in the balance of 2014. JLL ranks the likelihood for hotel development in Melbourne Metropolitan at around 55% as developers are more likely to direct their attention to the city given the availability of sites in Melbourne CBD.
Development activity snapshot
15 recently opened197 under construction due 2014223 likely proposed due 2016
ExISTING ROOMS (JUN-13)
8,705 NET ROOMS435TOTAL
PROJECTS4
SUMM
ARY %
INCREASE
0.2% recently opened2.3% under construction due 20142.5% likely proposed due 2016
4.9%
Construction cost comparison
Source: Rawlinsons 2013, JLL Note: June Year End
Inde
x (B
ase
Year
199
5)
Building Price Index RevPAR Index
80
100
120
140
160
180
200
220
240
1995
19
96
1997
19
98
1999
20
00
2001
20
02
2003
20
04
2005
20
06
2007
20
08
2009
20
10
2011
20
12
2013
20
14F
Assumed supplyLikely proposedUnder constructionRecently completedExistingGrowth
2.3%0.0% 0.0% 2.5% 0.0% 0.0%
2012 2013F 2014F 2015F 2016F 2017F
Future supply: impact on the market Upcoming projects
RECENTLY OPENEDCoppersmith Boutique Hotel 15 rooms | Full Service Upscale | Jul-14 | Independent
UNDER CONSTRUCTIONQuest Melbourne Airport 97 rooms | Serviced Apartments | Nov-14
Art Series Studio – The Larwill 100 rooms | Full Service Upscale | Dec-14
Hotel development barometer
JLL is aware of eight mooted projects with 584 rooms which are likely to advance over the medium term.
%55
Source: JLL
1 recently opened2 under construction due 20141 likely proposed due 2016

July 2014 | Hotels & Hospitality Group 23
Perth CityJLL ranks the likelihood for hotel development in Perth City at around 50% with RevPAR having softened 7.4% compared to the September 2012 high as the mining segment moderated to average $180. Trading has shown signs of stabilisation over the past seven months with occupancy gains evident each month although this is yet to translate into ADR growth. Trading is expected to continue to improve over the balance of 2014 as demand conditions normalise and whilst supply increases remain benign. Supply increases are expected to average 4.5% per annum to end 2018, but with few significant additions before 2016. New supply is predominantly government-incentivised and/or larger mixed use developments with stand-alone hotel development difficult to stack up.
Development activity snapshot
3 under construction due 20154 likely proposed due 2016-18
194 under construction due 20151,232 likely proposed due 2016-18
ExISTING ROOMS (JUN-13)
5,931 NET ROOMS1,426TOTAL
PROJECTS7
SUMM
ARY %
INCREASE
3.3% under construction due 201520.1% likely proposed due 2016-18
23.4%
Construction cost comparison Trading performance
Source: Rawlinsons 2013, JLL Note: June Year End
Source: STR Global, JLL Note: Moving Annual Average
Inde
x (B
ase
Year
199
5)
Building Price Index RevPAR Index
80
100
120
140
160
180
200
220
240
260
1995
19
96
1997
19
98
1999
20
00
2001
20
02
2003
20
04
2005
20
06
2007
20
08
2009
20
10
2011
20
12
2013
20
14F
Occu
panc
y (%
)
ADR
/ Rev
PAR
($)
RevPAR (MAA)ADR (MAA)Occupancy (MAA)
70% 72% 74% 76% 78% 80% 82% 84% 86% 88% 90%
$85 $95
$105 $115 $125 $135 $145 $155 $165 $175 $185 $195 $205 $215 $225 $235
Dec-
04
Jun-
05
Dec-
05
Jun-
06
Dec-
06
Jun-
07
Dec-
07
Jun-
08
Dec-
08
Jun-
09
Dec-
09
Jun-
10
Dec-
10
Jun-
11
Dec-
11
Jun-
12
Dec-
12
Jun-
13
Dec-
13
May
-14
Assumed supplyLikely proposedUnder constructionRecently completedExistingGrowth
1.0%0.2% 3.1% 11.8% 4.3% 2.8%
2013E 2014F 2015F 2016F 2017F 2018F
Future supply: impact on market Upcoming projectsUNDER CONSTRUCTION
The Treasury Building 48 rooms | Full Service Luxury Jan-15 | FJM Property
Hotel Alex Perth 74 rooms | Budget/Mid-Market Upscale Jun-15 | FJM Property
Quest West Perth 72 rooms | Serviced Apartments Oct-15 | Quest Apartments
JLL is aware of a further four mooted projects with 636 rooms, some of which may advance over the medium term.
Hotel development barometer
%50
Source: JLL

24 Hotels & Hospitality Group | July 2014
Sydney CityJLL ranks the likelihood for hotel development in Sydney City at around 70% with strong RevPAR growth evident over the past year. Nominal RevPAR is currently at the highest level ever recorded having averaged $198 over the year to May 2014 with growth led by the 5-star segment. Supply increases are expected to average 1.9% per annum to end 2018 with five projects currently under construction and five proposed projects expected to advance over the near term (including the closure of two hotels). The Langham Hotel in Sydney will close on July 24, 2014 for four months to undergo a $30 million refurbishment. The renovation will include a complete redevelopment of the lobby, dining areas, guest rooms and a residential style ballroom. The plans are to bring the hotel in line with international sister properties such as those in Guangzhou, xiamen and soon Dubai. The Chuan Spa and Palm Court will also be introduced. The backdrop for doing business in NSW is looking better than it has for some time with record low interest rates underpinning the city’s dominant finance sector which coupled with significant investment in tourism infrastructure is likely to underpin continued growth over the medium term.
Development activity snapshot
3 recently opened5 under construction due 2014-175 likely proposed due 2016-19
140 recently opened1,008 under construction due 2015-17203 likely proposed due 2016-19
ExISTING ROOMS (JUN-13)
20,292 NET ROOMS1,351TOTAL
PROJECTS13
SUMM
ARY %
INCREASE
0.7% recently opened4.9% under construction due 2015-170.9% likely proposed due 2016-19
6.6%
Construction cost comparison Trading performance
Source: Rawlinsons 2013, JLL Note: June Year End
Source: STR Global, JLL Note: Moving Annual Average
Inde
x (B
ase
Year
199
5)
Building Price Index RevPAR Index
80
100
120
140
160
180
200
220
240
1995
19
96
1997
19
98
1999
20
00
2001
20
02
2003
20
04
2005
20
06
2007
20
08
2009
20
10
2011
20
12
2013
20
14E
Occu
panc
y (%
)
ADR
/ Rev
PAR
($)
RevPAR (MAA)ADR (MAA)Occupancy (MAA)
70% 72% 74% 76% 78% 80% 82% 84% 86% 88% 90%
$120 $130 $140 $150 $160 $170 $180 $190 $200 $210 $220 $230
Dec-
04
Jun-
05
Dec-
05
Jun-
06
Dec-
06
Jun-
07
Dec-
07
Jun-
08
Dec-
08
Jun-
09
Dec-
09
Jun-
10
Dec-
10
Jun-
11
Dec-
11
Jun-
12
Dec-
12
Jun-
13
Dec-
13
May
-14
Assumed supplyLikely proposedUnder constructionRecently completedExistingGrowth
2013E 2014F 2015F 2016F 2017F 2018F
0.0%0.3% 2.2% 1.5% 2.5% 3.5%
Future supply: impact on the marketRECENTLY OPENED
Adge Apartment Hotel 12 rooms | Serviced Apartments | Jun-13 | Independent
Hotel 1888 90 rooms | Full Service Upscale | Jul-13 | Eight Hotels
Zara Apartments 38 rooms | Budget/Mid-Market Midscale | Jul-13Independent
UNDER CONSTRUCTIONThe Langham Sydney -96 rooms | Full Service Luxury | Jul-14 | Langham Hospitality
The Langham Sydney 96 rooms | Full Service Luxury | Nov-14 | Langham Hospitality
Central Park – Kensington Lane Hotel
60 rooms | Full Service Midscale | Mar-15 | Independent
Tankstream Hotel 282 rooms | Budget/Mid-Market Economy | Mar-15 | Cititel Hotels
The Spanish Club 76 rooms | Budget/Mid-Market Midscale | Mar-16 | TBC
ICC Hotel 590 rooms | Full Service Luxury | Jan-17 | TBC
Hotel development barometer
JLL is aware of 17 mooted projects including the potential closure of three hotels which would result in a net addition of 1,087 rooms.
%70
Source: JLL
Upcoming projects

July 2014 | Hotels & Hospitality Group 25
Sydney MetropolitanSydney Metropolitan is defined as the Sydney Tourism Region less Sydney City and encompasses the broader city metropolitan. Major accommodation sub-markets include Parramatta, Ryde, Botany and the Airport precinct. Sydney Metropolitan’s accommodation market recorded strong RevPAR growth over the year to June 2013 (latest statistics available) averaging 10.5% with occupancies averaging 71.2% and ADR of $160. Supply increases are expected to average 2.7% per annum to end 2018 with nine projects currently under construction due for completion over the next two years. JLL has also identified a further nine proposed projects thought likely to commence over the short term. JLL ranks the likelihood for hotel development in Sydney Metropolitan at around 75% with new development more likely to occur in Sydney Metropolitan than Sydney City as there are more sites available. Whilst the Airport precinct currently dominates activity, we expect developer attention to shift to the western suburbs in line with recent strong economic growth and the planned investments in infrastructure with a particular focus on the key transport nodes.
Development activity snapshot
3 recently opened9 under construction due 2014-169 likely proposed due 2014-18
432 recently opened1,414 under construction due 2014-16552 likely proposed due 2014-18
ExISTING ROOMS (JUN-13)
13,432 NET ROOMS2,398TOTAL
PROJECTS21
SUMM
ARY
3.2% recently opened10.2% under construction due 2014-163.6% likely proposed due 2014-18
% INCREASE17.0%
Construction cost comparison
Source: Rawlinsons 2013, JLL Note: June Year End
Inde
x (B
ase
Year
199
5)
Building Price Index RevPAR Index
80
100
120
140
160
180
200
220
240
1995
19
96
1997
19
98
1999
20
00
2001
20
02
2003
20
04
2005
20
06
2007
20
08
2009
20
10
2011
20
12
2013
20
14F
2016F
-0.7%7.3% 9.8% 4.2% 0.0% 0.6%
2013E 2014F 2015F 2017F 2018F
Assumed supplyLikely proposedUnder constructionRecently completedExistingGrowth
Future supply: impact on marketRECENTLY OPENED
Adina Apartment Hotel Bondi Beach 111 rooms | Budget/Mid-Market Midscale | Jun-13
Atura by Rydges Blacktown 122 rooms | Full Service Midscale | Oct-13
Meriton North Ryde 199 rooms | Budget/Mid-Market Midscale | Dec-13
UNDER CONSTRUCTIONInterContinental Double Bay 140 rooms | Full Service Luxury | Sep-14
Quest Liverpool 88 rooms | Full Service Midscale | Jan-15
Adina Apartment Hotel Mascot 123 rooms | Budget/Mid-Market Midscale | Jun-15
QT Bondi 84 rooms | Full Service Upscale | Jun-15
Victoria St Mixed Development – Victoria Tower 40 rooms | Budget/Mid-Market Midscale | Aug-15
Meriton Chatswood 302 rooms | Budget/Mid-Market Midscale | Dec-15
Meriton Mascot 290 rooms | Serviced Apartments | Jan-16
Meriton Parramatta 266 rooms | Budget/Mid-Market Midscale | Jun-16
V by Crown 81 rooms | Serviced Apartments | Dec-16
JLL is aware of 21 mooted projects including the closure of one hotel which would result in a net increase of 2,236 rooms, although we think it highly unlikely that all of these will advance.
Hotel development barometer
%75
Source: JLL
Upcoming projects

26 Hotels & Hospitality Group | July 2014
Sofitel So Auckland. Under construction, due to open March 2015
Highlights – New Zealand• TherearesevenhotelprojectscurrentlyunderconstructioninNewZealand’smaincentres,comprising836rooms.Thisrepresentsanincreaseof5.4%totheexistingroomsupply.Theseprojectscompriseofficeconversions,hotelexpansionsorreconstructionprojects.
• JLLhasidentifiedafurther21proposed/mootedaccommodationprojects(inNewZealandmaincentres),comprising2,632rooms,althoughwedonotexpectallprojectstoadvance.Airportandconventioncentrehotelsareattractingthemostdeveloperattention.
• Aucklandisthefocusofdevelopmentactivity(1,091rooms),aswellasreconstructionprojectsinChristchurch(1,180rooms).Togetherthesetwomarketsaccountfor66%ofroomsinthepipeline.
• Theaccommodationpipelinestillremainslowbyhistoricalstandards.AccommodationbuildingconsentstotalledNZ$90millionin2013,down22.0%on2012.Thisrepresentsthelowestannuallevelrecordedoverthepasttenyears.TherearesignshoweverofaslightuptickinactivityinQ12014.

July 2014 | Hotels & Hospitality Group 27
New Zealand’s Major Accommodation Markets – Development Snapshot June 2014
Summary Projects Net Rooms
% Increase
Years
Existing rooms (May-13)
15,277
Recently completed 3 198 1.3% H2 2013 & YTD 2014
Under construction 7 836 5.4% 2014-15Proposed / Mooted 21 2,631 16.1% 2015-20Total 31 3,665 24.0%
Source: JLL
Christchurch dominates hotel openings
JLL is aware of seven accommodation establishments (502 rooms) which have opened in the five major centres across New Zealand over the past year. The majority of these (five) were reconstruction projects in Christchurch and two new-build Quest serviced apartment projects in Auckland, with no additions to supply in the other four markets.
We are aware of approximately 1,180 rooms which have been proposed/ mooted and are awaiting confirmation to proceed. This includes both new build hotels and those hotels which owners continue to assess the extent, cost and potential commencement of remedial work. We are also aware of a number of new projects which are currently being investigated to confirm their feasibility, but note that this is an ever-changing situation, as new projects are proposed or begin construction.
The near term outlook for Christchurch’s accommodation market remains difficult to gauge as there has been unprecedented levels of new supply re-entering the market over the past 24 months, contrasting against a landscape of uncertain demand as the Christchurch rebuild begins in earnest.
Over the next three to five years we anticipate that further supply will be dictated by the pace of the city rebuild and by the many proposed infrastructure projects including the anticipated completion of the convention centre in mid-2017.
Hotel development moderates as reconstruction projects have opened
New Zealand’s accommodation development pipeline has moderated over the past year, largely the result of a number of reconstruction projects opening in Christchurch. There are seven hotel projects currently under construction in New Zealand’s main centres, comprising 836 rooms and 3,468 rooms in the development pipeline with the majority of projects at the proposed/ mooted phase. The projects under construction will increase the existing supply base across the five markets by 5.4%.
The feasibility of new hotel development in New Zealand has marginally improved with projects slated for Auckland, Wellington, Queenstown and Provincial areas such as New Plymouth, Havelock North and Whangarei.
Hotel assets in New Zealand were historically perceived as risky assets by comparison to other CBD investments, but as the yield spread between hotels and these other asset types has narrowed, hotels have become a more viable option for diversifying investment portfolios.
Investors are challenged however by a lack of prime stock being available for sale with only one prime city hotel transacting in 2013 and only one thus far in 2014. This has led to many active investors, particularly those with existing hospitality properties in the Asia Pacific region, seeking to secure sites for new hotel development.
0
1,000
2,000
3,000
Aug-
09
Mar-1
0
Jan-
11
Aug-
11
Jun-
12
Apr-1
3
May-1
4
Room
s
Likely proposed Under construction Recently opened
Source: JLL
New Zealand Hotel Development Trends 2009 to 2014
Accommodation pipeline points to greater product differentiation over the coming years
Where serviced apartment rooms dominated supply additions in New Zealand in the lead up to the global financial crisis, the current pipeline points to greater product differentiation in the accommodation market over the coming years.
Auckland and Wellington will both see their first new luxury hotels for more than seven years with the opening of the Sofitel Wellington (130 rooms) in late 2014 / early 2015 and Sofitel So Auckland (134 rooms) in mid-2015. Both are office conversion projects and will be operated by Accor. Another conversion project was recently completed in Auckland with the conversion of 401 Queen Street into a 3.5-star serviced apartment property operated by VR Hotels.
Proposed projects also include a number of conversion projects. These projects have shorter timeframes for completion than other more ambitious new-build projects and offer much greater certainty of cashflow performance.

28 Hotels & Hospitality Group | July 2014
Convention centre hotels
Convention centres rarely generate profits and even if they do these profits are usually insufficient to provide a reasonable return on investment. Consequently, private sector convention centre development is quite rare. Instead, the public sector – federal, state and local governments – justify investment in convention centres by recognising the significant external benefits convention activity creates in their communities. Convention centres support a variety of tourist-related industries including accommodation demand, food, beverage, catering, transportation, retail and other industries.
There are a number of convention centres currently proposed or planned in the major centres across New Zealand. If proceeding, these venues will compete with Australian and Asian venues for international tradeshows and conventions which rotate throughout the Asia Pacific region. Government investment in tourism infrastructure across Asia over the past decade has resulted in an increasingly competitive environment with new and expanded facilities across the region. China has experienced the most growth as a number of government sponsored projects have come on line, whereas the development of Integrated Resorts in Singapore, as well as a number of large casino/convention centre hotels in Macau, has also increased competition in the sector.
Most Asian convention centres offer direct access to upscale hotel accommodation but with a range of accommodation options located nearby. Integrated hotels include a mix of independent and internationally branded product including Hilton, Pan Pacific, Grand Hyatt, Renaissance and Westin. Interestingly, similarly branded product in North America is often rated Four-star, reflecting the vagaries of international hotel brands.
Whilst accommodation is a factor in deciding which Centre to use, it is by no means the determining factor with most event organisers simply expecting that there will be a sufficient range of accommodation options located nearby ranging between 3.5-star and 4.5-star as this would meet the needs of most delegates.
Fundamental to the hotel development decision, however, is a complete and comprehensive understanding of the site location process and the paradigm that this is directly dependent on the proximity to demand generators. Airport and convention centre hotels are another focus in New Zealand with convention centres/hotels at various stages of planning in Auckland, Christchurch, Queenstown and Wellington. Airport hotels are currently planned or being extended in Auckland, Christchurch and Wellington.
Mooted projects increase ahead of the Reserve Bank’s shift to a rate tightening cycle
JLL has identified a further 21 proposed/ mooted accommodation projects (in New Zealand main centres), comprising 2,632 rooms, although we do not expect all projects to advance. Airport and convention centre hotels are attracting the most developer attention.
Mooted accommodation rooms have increased considerably over the past year which indicates that the accommodation pipeline is building.
This is in spite of the Reserve Bank increasing the Official Cash Rate (OCR) on three occasions by 25 basis points to 3.25% since mid-March 2014 – the first increase in nearly four years – amidst rising inflation and signs of a spreading house-price boom.
The OCR is forecast to rise by a further 1 percentage point over the next one to two years (depending on the economic outlook) to keep future average inflation between a range of 1% and 3%, with a target to keep inflation near the mid-point near the 2% target mid-point.
Accommodation building consents reach new low in 2013
Short term accommodation building approvals data from Statistics New Zealand highlights that the current level of activity remains low by historical standards with monthly approvals still at a very low level.
Value
($ M
illion
s)
0
5,000
10,000
15,000
20,000
25,000
30,000
Dec-0
0Ju
n-01
Dec-0
1Ju
n-02
Dec-0
2Ju
n-03
Dec-0
3Ju
n-04
Dec-0
4Ju
n-05
Dec-0
5Ju
n-06
Dec-0
6Ju
n-07
Dec-0
7Ju
n-08
Dec-0
8Ju
n-09
Dec-0
9Ju
n-10
Dec-1
0Ju
n-11
Dec-1
1Ju
n-12
Dec-1
2Ju
n-13
Dec-1
3
Accommodation Building Approvals
Source: Statistics NZ, JLL
New Zealand Accommodation Building Approvals Moving Annual Average 2000 to May 2014

July 2014 | Hotels & Hospitality Group 29
New Zealand Accommodation Development Pipeline: Projects under construction as at June 2014
Project City Due Date Rooms Grade Type Operator
Recently CompletedVR Queen Street Auckland May-14 80 3.5-star Serviced Apartments VR GroupRydges Latimer Hotel * Christchurch Mar-14 88 4.5-star Hotel Rydges Hotels & ResortsHotel 115 (Former Hotel Off the Square) Christchurch Apr-14 30 3-star Hotel IndependentTotal Number Recently Opened 198
Under ConstructionSofitel So Auckland Auckland Mar-15 133 5-star Full Service Luxury AccorIbis Budget Auckland Airport Extension Auckland Mar-15 75 2.5-star Budget / Select
ServiceAccor
Lakewood Court Hotel Auckland Suburban
Jun-15 152 3.5-star Full Service Midscale Independent
All Seasons Christchurch Oct-14 280 4-star Budget / Select Service
Independent
Sudima Airport Hotel Extension Christchurch Sep-14 39 4-star Full Service Upscale Sudima HotelsHotel Montreal Christchurch Mar-15 27 5-star Serviced Apartment Lily CooperSofitel Wellington Wellington Mar-15 130 5-star Hotel AccorTotal Number of Rooms Under Construction 836
Source: Industry Sources, JLL*Note: re-opening
Accommodation building consents totalled NZ$90 million in 2013, down 22.0% on 2012 to be at the lowest annual level recorded since the dataset began in 2001. Notwithstanding, approvals over the five months to May 2014 have shown some improvement with the total value of work approved more than double that for the same period in 2013. Annual approvals over the year to May 2014 have averaged $8.8 million per month which is 32% above the June 2012 low.
Riding the wave
The New Zealand tourism sector is currently riding on a wave of optimism and growth, with several new hotel developments planned, international and domestic investors actively seeking to secure properties in new markets and operational indicators on the improve.
For many new-build projects, however, timing will be the key to success, with the market potentially entering into a period of supply imbalance if all speculated projects proceed, particularly if each hotel is targeting a similar guest market.
Sofitel Wellington. Under construction, due to open December 2014

30 Hotels & Hospitality Group | July 2014
Source: JLL
New Zealand’s Recent Trading Performance
QueenstownNominal RevPAR in Queenstown has averaged around NZ$103 over the year to May 2014 to be at the highest level ever recorded. RevPAR has trended upwards since bottoming in March 2012 at $85.
NZ$85MAR 2012
NZ$103MAY 2014
21.2%
WellingtonNominal RevPAR in Wellington has averaged around NZ$107 over the year to May 2014 to be around 3.5% below the March 2012 high. RevPAR has trended upwards since bottoming in October 2012 at $102.
NZ$111MAR 2012
NZ$107MAY 2014
3.5%
ChristchurchNominal RevPAR in Christchurch has averaged around NZ$109 over the year to May 2014 to be 15.2% below the June 13 high. RevPAR has moderated over the past year as reconstruction projects have opened.
NZ$123JUN 2013
NZ$109MAY 2014
15.2%
AucklandNominal RevPAR in Auckland has averaged around NZ$115 over the year to May 2014 to be around 6.3% below the October 2011 Rugby World Cup high. RevPAR has trended upwards since bottoming in October 2012 at $102.
NZ$122OCT 2011
NZ$114MAY 2014
6.3%
RotoruaNominal RevPAR in Rotorua has averaged around NZ$70 over the year to May 2014 to be around 7.4% below the February 2008 high. RevPAR has trended upwards since bottoming in January 2013 at $65.
NZ$75FEB 2008
NZ$70MAY 2014
7.4%
RevPAR is a performance metric in the hotel industry, which is calculated by multiplying a hotel’s average daily room rate (ADR) by its occupancy rate. RevPAR is provided for the year to May 2014, calculating as a moving annual average and compared to the most recent high.

July 2014 | Hotels & Hospitality Group 31
METHODOLOGYJLL Accommodation Supply Tracking
Our Australian and New Zealand Hotel Development Register tracks accommodation projects as they are mooted, proposed, under construction, completed or taken out of the market.
We obtain information from press, local councils, Cordells construction database, Cityscope, tourism organisations, hotel operators and developers, as well as from local JLL offices. Where the proposed number of rooms has not been made publically available or where our investigations have not been able to confirm the proposed room count, JLL will estimate the likely number of rooms.
Serviced Apartment projects include our current best estimate of the number of apartments which will be included in rental letting pools and offered for short term accommodation stays. Furthermore, some projects originally approved as residential apartments can occasionally evolve to become serviced apartment projects and in light of these factors, this is therefore subject to change.
Accommodation projects are graded in accordance with their current stage in the development process and our opinion about the likelihood that they will progress owing to factors such as the quality of the sponsor and/or project (e.g. mixed use or government mandated), as well as the current and projected trading conditions in the local accommodation market at that time. Broadly we categorise projects into five stages including:
• Site speculation – aware a site has been bought and a hotel development is being considered;
• Mooted – includes those projects where a Development Application (DA) for accommodation rooms has recently been submitted or is under review. We note that there is no guarantee that these projects will progress;
• Proposed – projects where the DA has been approved and JLL expects construction to commence within two years;
• Under construction – projects where site works or full construction have commenced; and
• Recently opened.
Typically we only include proposed projects (and above) in our five year forecasts, as well as an element of unanticipated supply. This accepts that despite our best efforts we do not have complete visibility of the all development projects which are being considered at any one time and that some mooted projects will inevitably advance over the medium term.
JLL Hotel Development Barometer
To assess the likelihood for new hotel development in Australia’s major hotel markets, JLL has ranked markets using our HotelDevelopmentBarometer. This gauge assesses driving forces such as the strength of the local economy, trading performance, demand generators, investor and operator appetite and accessibility against key impediments including cost of construction, site availability, competition from alternate uses, as well as the cost versus value equation.
Our assessment excludes the availability and cost of hotel development finance but we note that this is a key factor in hotel development and investment, affecting both the number of buyers in the market and their ability to pay.

COPYRIGHT © Jones Lang LaSalle IP, INC. 2014
All rights reserved. No part of this publication may be reproduced or transmitted in any form or by any means without prior written consent of Jones Lang LaSalle. It is based on material that we believe to be reliable. Whilst every effort has been made to ensure its accuracy, we cannot offer any warranty that it contains no factual errors. We would like to be told of any such errors in order to correct them.
Atlanta tel: +1 404 995 2100
Auckland tel: +64 9 366 1666
Bangkok tel: +66 2 624 6400
Barcelona tel: +34 93 318 53 53
Beijing tel: +86 10 5922 1300
Brisbane tel: +61 7 3231 1311
Buenos Aires tel: +54 11 4893 2600
Chengdu tel: +86 28 6680 5000
Chicago tel: +1 312 782 5800
Dallas tel: +1 214 438 6100
Delhi tel: +91 11 4331 7070
Denver tel: +1 303 260 6500
Dubai tel: +971 4 426 6999
Dublin tel: +353 1 673 1600
Düsseldorf tel: +49 211 13006 0
Exeter tel: +44 1392 423696
Frankfurt tel: +49 69 2003 0
Glasgow tel: +44 141 248 6040
Istanbul tel: +90 212 350 0800
Jakarta tel: +62 21 2922 3888
Leeds tel: +44 113 244 6440
London tel: +44 20 7493 4933
Los Angeles tel: +1 213 239 6000
Lyon tel: +33 4 78 89 26 26
Madrid tel: +34 91 789 11 00
Manchester tel: +44 161 828 6440
Marseille tel: +33 4 95 09 1313
Melbourne tel: +61 3 9672 6666
Mexico City tel: +52 55 5980 8003
Miami tel: +1 305 529 6345
Milan tel: +39 2 85 86 861
Moscow tel: +7 495 737 8000
Munich tel: +49 89 2900 88 0
New York tel: +1 212 812 5700
Paris tel: +33 1 40 55 15 15
Perth tel: +61 8 9322 5111
Rome tel: +39 06 4200671
San Francisco tel: +1 415 395 4900
São Paulo tel: +55 11 3043 6900
Shanghai tel: +86 21 6393 3333
Singapore tel: +65 6220 3888
Sydney tel: +61 2 9220 8500
Tokyo tel: +81 3 5501 9200
Washington D.C. tel: +1 202 719 5000
JLL’s Hotels & Hospitality Group offices
www.jll.com.au/hospitality