australia livestock and products annual 2015 · average produced daily by mla's national...
TRANSCRIPT
THIS REPORT CONTAINS ASSESSMENTS OF COMMODITY AND TRADE ISSUES MADE BY USDA STAFF AND NOT NECESSARILY STATEMENTS OF OFFICIAL U.S. GOVERNMENT POLICY
Date:
GAIN Report Number:
Approved By:
Prepared By:
Report Highlights:
Livestock and livestock products is a significant industry in Australia and accounts for one fifth of farm production while beef farms manage three quarters of all agricultural land. The industry has seen high cattle turn-off and live cattle exports. Beef production and exports are at record levels, with the United States the main market ahead of Japan. Current turn-off levels appear unsustainable as cattle herd numbers will fall to 26.3 million in 2016. The pig and pork meat sector has been stable with the domestic industry focused on fresh pork products and imports supplying most of the market for processed products, although these are prepared in Australia.
Roger Farrell, Agricultural Specialist
Hugh Maginnis, Agricultural Counselor
2015
Livestock and Products Annual
Australia
AS1524
9/18/2015
Required Report - public distribution

SEASONAL OVERVIEW
Australia is the seventh largest beef producer, third largest beef exporter and accounts for around four percent of world supply. Livestock numbers and beef production vary with seasonal changes, regional production and market demand. Beef cattle farms in Queensland and northern NSW focus mainly on beef exports while those in the Northern Territory and northern Western Australia have specialized in the live cattle export trade. About half of the cattle herd is located in northern Australia and the remainder in southern Australia. Beef production in the southern States supplies both the domestic and overseas beef markets.
In recent years, dry seasonal conditions have significantly affected beef production and cattle turn-off rates in most regions, but especially in northern Australia. Over 2014, rainfall in northern Australia was up to 40 percent below average, leading to herd rationalization. Sixty percent of beef farms in Queensland and north-west NSW have been affected by drought with over 75 percent of Queensland drought-declared since 2012. As a result, cattle turn-off has risen as producers take advantage of high export prices for both livestock and livestock products.
Chart 1: Recent rainfall, May to July 2015
Source: Australian Bureau of Meteorology
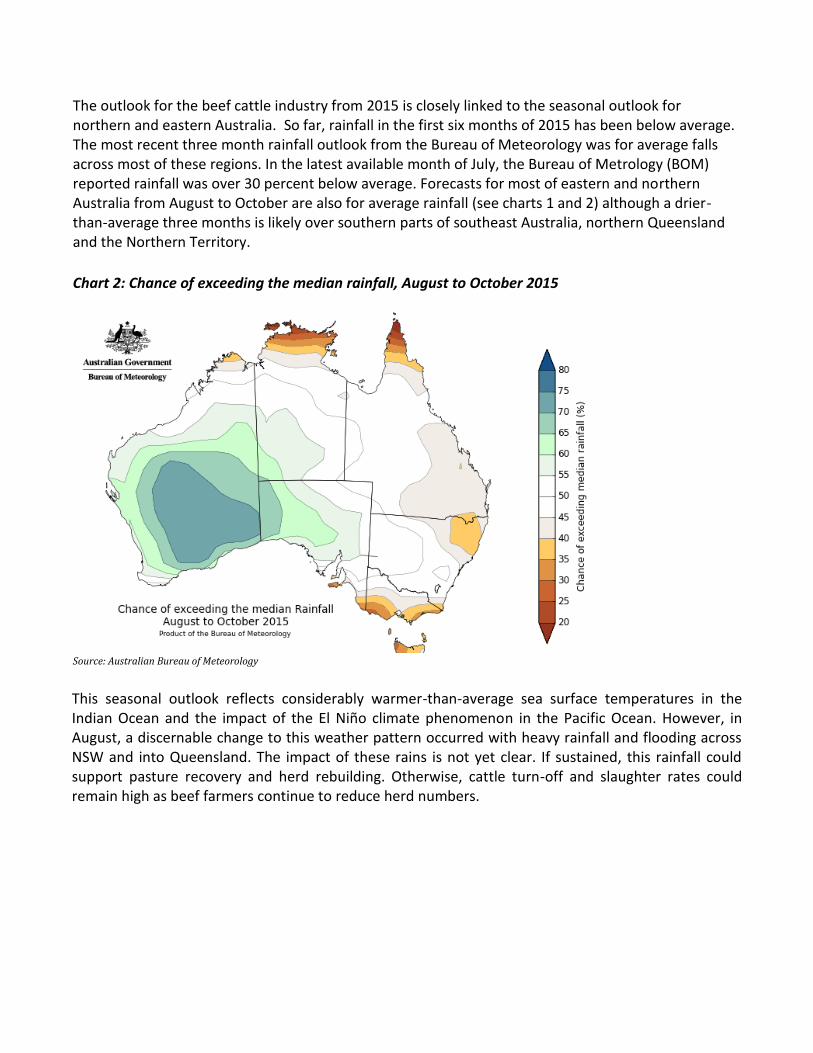
The outlook for the beef cattle industry from 2015 is closely linked to the seasonal outlook for northern and eastern Australia. So far, rainfall in the first six months of 2015 has been below average. The most recent three month rainfall outlook from the Bureau of Meteorology was for average falls across most of these regions. In the latest available month of July, the Bureau of Metrology (BOM) reported rainfall was over 30 percent below average. Forecasts for most of eastern and northern Australia from August to October are also for average rainfall (see charts 1 and 2) although a drier-than-average three months is likely over southern parts of southeast Australia, northern Queensland and the Northern Territory.
Chart 2: Chance of exceeding the median rainfall, August to October 2015
Source: Australian Bureau of Meteorology
This seasonal outlook reflects considerably warmer-than-average sea surface temperatures in the Indian Ocean and the impact of the El Niño climate phenomenon in the Pacific Ocean. However, in August, a discernable change to this weather pattern occurred with heavy rainfall and flooding across NSW and into Queensland. The impact of these rains is not yet clear. If sustained, this rainfall could support pasture recovery and herd rebuilding. Otherwise, cattle turn-off and slaughter rates could remain high as beef farmers continue to reduce herd numbers.

Commodities:
CATTLE
In 2015, beef cattle numbers in Australia are likely to fall by over five percent as a result of the high level of slaughter rates and live cattle exports. A continuation of adverse seasonal conditions and high export prices has also supported this trend. As a result, the Australian cattle herd is expected to decline to 26.3 million head by 2016 with further declines possible in subsequent years. The rate of rebuilding of the cattle herd is dependent upon seasonal conditions, especially in Queensland and northern NSW where drought conditions caused accelerated turn-off in recent years due to the lack of pasture feed. Currently, however, it is difficult to pinpoint when herd rebuilding will become a greater priority for producers.
Slaughter
In 2015, total beef cattle slaughter is forecast to decline to around 9.5 million after exceeding 9.9 million the previous year. This involves a revision to the previous official forecast of around 8.7 million, which was premised on a recovery in seasonal conditions and a slowdown in cattle-turn-off from the unsustainable highs recorded in 2014. In 2016, cattle slaughter numbers are expected to decline further to around 9.2 million, assuming average seasonal conditions and adequately timed rainfall for pasture and other feed crops.
By 2016, the national herd is forecast to decline to a two decade low of 26.3 million head, down five percent on the previous year. Total cattle turnoff (live cattle exports plus slaughter) is expected to exceed 35 percent in 2015, one of the highest rates since the 1970s. Herd rebuilding, when it occurs, will be more difficult as the female cattle slaughter rate since 2014 has been considerably above the long-term average (see chart 3).
Meat, Swine
Meat, Beef and Veal
Animal Numbers, Swine
Animal Numbers, Cattle
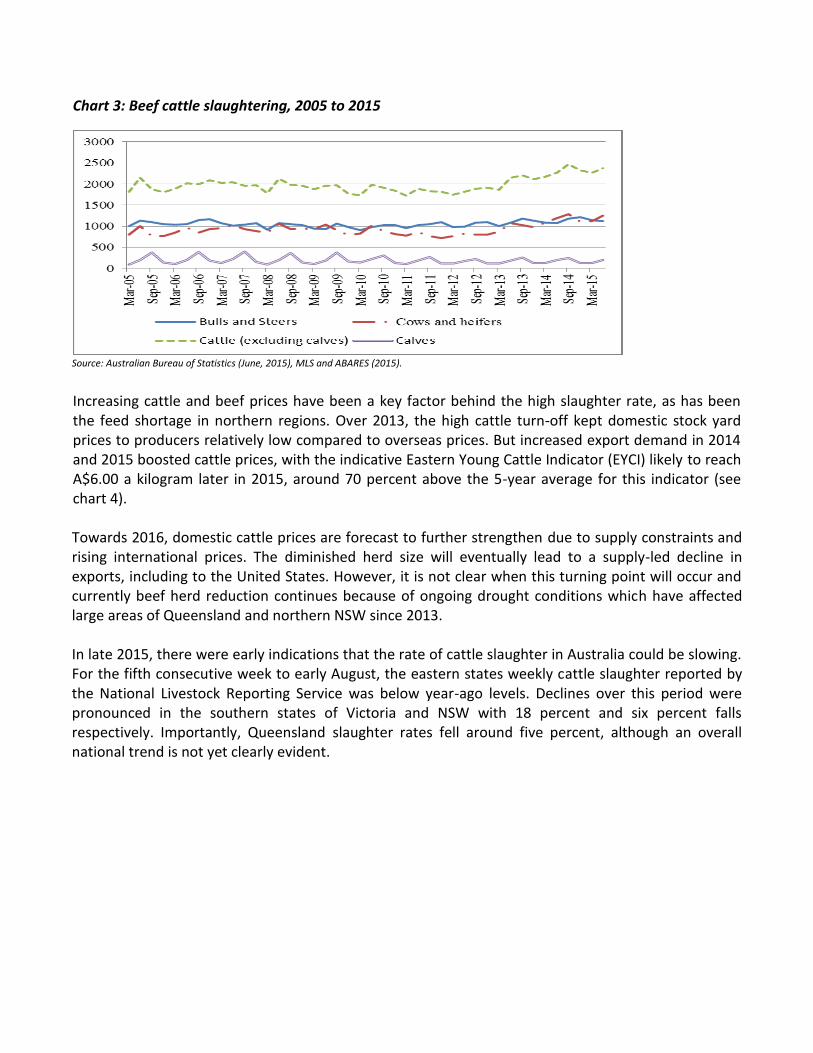
Chart 3: Beef cattle slaughtering, 2005 to 2015
Source: Australian Bureau of Statistics (June, 2015), MLS and ABARES (2015).
Increasing cattle and beef prices have been a key factor behind the high slaughter rate, as has been the feed shortage in northern regions. Over 2013, the high cattle turn-off kept domestic stock yard prices to producers relatively low compared to overseas prices. But increased export demand in 2014 and 2015 boosted cattle prices, with the indicative Eastern Young Cattle Indicator (EYCI) likely to reach A$6.00 a kilogram later in 2015, around 70 percent above the 5-year average for this indicator (see chart 4). Towards 2016, domestic cattle prices are forecast to further strengthen due to supply constraints and rising international prices. The diminished herd size will eventually lead to a supply-led decline in exports, including to the United States. However, it is not clear when this turning point will occur and currently beef herd reduction continues because of ongoing drought conditions which have affected large areas of Queensland and northern NSW since 2013. In late 2015, there were early indications that the rate of cattle slaughter in Australia could be slowing. For the fifth consecutive week to early August, the eastern states weekly cattle slaughter reported by the National Livestock Reporting Service was below year-ago levels. Declines over this period were pronounced in the southern states of Victoria and NSW with 18 percent and six percent falls respectively. Importantly, Queensland slaughter rates fell around five percent, although an overall national trend is not yet clearly evident.

Chart 4: Eastern Cattle Indicator, 2014-2015 (Australian cents/kilogram cwt)
Note: The Eastern Young Cattle Indicator (EYCI) is the general benchmark of Australian cattle prices. The indicator is a seven-day rolling average produced daily by MLA's National Livestock Reporting Service (NLRS). The EYCI includes vealer and yearling heifers and steers, grade score C2 or C3, 200kg+ liveweight from saleyards in NSW, QLD and VIC. The results include cattle purchased for slaughter, restocking or lotfeeding and are expressed in cents per kilogram carcass (dressed) weight (c/kg cwt). Source: Meat and Livestock Australia (2015).
The current rate of turn-off is generally recognized to be unsustainable if Australia’s beef cattle herd numbers are not to decline rapidly. It is probable that the annual slaughter rate needs to decline to around 7-7.5 million, which would imply beef production of two to 2.2 million tonnes. Slaughter rates in NSW and Queensland have been the highest for a decade because of the feed shortage, especially in western regions of the State. Therefore improved seasonal conditions would need to occur in these regions to arrest the current trend towards greater cattle turn-off. Production The surprisingly high rate of cattle slaughter over 2014 and 2015 has meant beef production has exceeded previous estimates. In 2015, Australia is expected to produce around 2.5 million tonnes, up around nine percent on the previous official forecast. A slight decline in beef production of 2.4 million tonnes is expected in 2016 as producers are likely to hold back stock for weight gain or breeding purposes. As noted in the previous report, the uncertain outlook for rainfall over 2015 could affect predictions as continuing drought and higher turnoff would boost slaughter rates and production volumes. This was evident in the first part of 2015 as average rainfall failed to boost pasture growth and prospects for herd rebuilding. Chart 5 illustrates how seasonal conditions have affected beef cattle saleyard prices in recent decades. Chart 6 provides a schematic of the meat processing industry in Australia.

Chart 5: Impact of supply shocks on Australian saleyard prices and export values
Source: ABARES (2015).
Chart 6: The meat processing industry in Australia
Source: Australian Competition and Consumer Commission.

Consumption Over the last few decades, Australian domestic per capita consumption of red meat has declined because of shifts in taste, diet and demography. Another important factor has been the price competitiveness of white meats, especially chicken. In 2015, domestic per capita beef consumption is expected to be around 33 kilograms, the same as in the previous year.
Chart 7: Australian domestic retail beef prices, 1998 to 2015 (A cents/kilogram retail weight)
Source: MLA (2015)
Average unit prices for beef fell five percent over the year to mid-2014 due to the rise in domestic supplies. From 2015, consumption is expected to decrease on a per capita basis due to supply shortages and higher exports and retail prices in Australia. However, some sectors such as organic, grass-fed and high-value meat are expected to grow in value. Supermarkets account for 80 percent of red meat sold at a retail level, a share that has increased in recent years. Chart 8: Per capita consumption of red and white meats in Australia, 1970-2020
Source: ABARES, ABS and Rural Bank (2015).

Trade The red meat processing industry exports around 70 percent of production by volume. Australian beef exports in 2014 increased by ten percent to reach 1.75 million tonnes (cwe) above the previous official forecast, which assumed herd re-building would have been given higher priority by beef producers. In 2016, beef exports are expected to fall back slightly to around 1.7 million tonnes as supply constraints begin to impact. Continued high slaughter rates and high overseas prices have maintained exports at a high level, but this is unsustainable in the medium term. Exports are becoming more focused on markets in the United States, Japan and Korea, which will account for around three quarters of total exports in 2015.
Table 1: Australian beef exports by country, 2009-2015 (‘000 tonnes)
2009 2010 2011 2012 2013 2014 2015 (a)
United States 253 186 170 227 212 396 228 Japan 366 366 352 313 294 289 138 South Korea 129 141 162 142 155 157 84 China 7 10 14 35 153 128 71 Indonesia 53 50 43 27 40 58 19 Other 167 224 266 261 284 294 122 World 975 977 1,007 1,005 1,138 1,322 662 Note: (a) First six months (January to June). Source: World Trade Atlas.
In recent months, the Eastern Young Cattle Indicator has risen continually towards A$6.00 per kilogram for producers and is expected to be supported at this level over 2016. Increased demand for beef and live cattle in Australia’s key export markets is likely to lead to higher domestic beef prices and lower domestic consumption. Increased scarcity of beef cattle may support a move towards production and export of more premium beef products, such as the Wagyu and Angus Beef brands, which attract a significantly higher price for producers. Market Access to the Japanese and Korean Beef Markets
In 2014, Australia signed trade agreements with Japan and Korea to increase market access and both of these agreements have been ratified. Under the Korea-Australia FTA (KAFTA), a 40 percent tariff on Australian exports of beef and edible offal is being lowered over 15 years and a 72 percent tariff on processed beef is being phased down. Details of the agreement are here: link Under the Japan-Australia economic partnership agreement (JAEPA) a phased reduction of beef tariffs has commenced. The 38.5 percent tariff on frozen and chilled beef will be phased down to 19.5 percent and 23.5 percent respectively over 15 years. Japan’s 50 percent global snapback tariff no longer applies to imports of beef from Australia, which provides an advantage over other suppliers to this market. Under JAEPA, Japan reduced the tariff on live cattle imports from Australia by 20 percent with no volume restrictions. The schedule is here: link

Beef Exports to the US Market In 2014, the United States became Australia’s most important beef export market, with volumes of around 400,000 MT worth over A$2.4 billion. Around 70 percent of Australian beef exported to the US market is manufacturing beef, which is used in ground beef products or other further processing. In 2014, chilled grass-fed exports increased 90 percent to over 63,000 MT. In the US market, Australia has access to a tariff free calendar year beef quota of 418,214 metric tonnes shipped weight (swt) in 2015, made up of 378,214 tonnes allocated under the 1995 multilateral Uruguay Round Agreement on Agriculture and a further 40,000 tonnes under the Australia/US Free Trade Agreement (AUSFTA). The annual quota is increasing progressively to 448,214 tonnes in 2023. From 2024, all Australian beef will be free to enter the US market without tariff or quota restrictions. Chart 9: Australian beef exports to the US market, 2009 to 2015
Note: (a) 2015 is estimated as twice the first six months of the calendar year, but exports could slow in late 2015.
Note: (b) The Australia-United States Free Trade Agreement (AUSFTA) of 2005 eliminated all US beef tariffs over time, with the previous
in-quota tariff of 4.4 US cents/kg eliminated from 1 January 2005 and the 26.4 percent over-quota tariff falling to zero over 18 years. Out-
of-quota shipments are subject to an ad valorem tariff of 21.12% which will be phased out by 2021 effectively terminating the tariff quota
arrangement. See: link Source: World Trade Atlas, Australian Department of Agriculture, AUSFTA text and US Tariff.
In 2015, Australian beef exports are likely to exceed the import quota limit into the US market for the first time since the quota allocation system was established. Out-of-quota imports into the US market are expected to attract a tariff duty of 21 percent on volumes above 418,200 tonnes, shipped weight. At the end of August 2015, around 15 percent of the US beef quota limit had been reached by Australian exporters. Consequently, the Australian Department of Agriculture, which administers the quota access arrangements, is expected to allocate the final 15 percent of Australia’s country specific annual US beef quota to exporters. This allocation will be based on the beef shipments of eligible exporters over the period from 2012 to 2014. Australian Beef Exports to China

China is the fastest growing market for Australian beef exports and is now the third largest beef market overall. Access to the Chinese market is likely to be expanded once the bilateral FTA is signed in late 2015 as the agreement will eliminate the current 12-25 percent range of tariffs on beef products over nine years. However, the scope for higher exports will depend upon the rate of accreditation of beef processing plants by both Australian and Chinese authorities. Australia’s beef exports into the Chinese market have been focused on supplying high-value restaurants and the food services industry. The industry considers that these outlets allow more product control for True Aussie branded beef although there has reportedly been some substitution for Australian beef into the Chinese market. Exports of Live Cattle
Live cattle exports are forecast to be 1.2 million in 2015 because of strong demand from a range of markets such as Indonesia, Vietnam and China. This forecast is a significant revision to the earlier official forecast of 900,000 head which was based on expectations of lower cattle turn-off as seasonal conditions improved over the year. The continuation of lower-than-expected rainfall over much of Australia and especially in northwest NSW and most of Queensland has meant that slaughter rates continued at almost record levels as beef producers responded to poor pasture feed availability. However, the live cattle trade is difficult to predict because of recurring changes in market access for Australian exporters. Table 2: Australian live cattle exports by country, 2009-2015 (‘000)
Note: (a) First six months (January to June). Source: World Trade Atlas.
2009 2010 2011 2012 2013 2014 2015 (a)
Indonesia 773 521 414 279 452 728 366 Vietnam 0 1 1 3 67 185 205 China 33 57 54 56 67 118 20 Israel 37 43 54 50 98 78 40 Malaysia 14 17 12 33 48 53 26 Russia 2 13 31 39 35 48 23 Other 95 223 129 160 84 87 35 World 954 875 695 620 851 1,297 715

A major sector of the live cattle industry is in northern Australia, which accounts for 45 percent of the national herd and comprises mainly Bos indicus cattle breeds suited to tropical climates. Cattle in southern Australia are mainly Bos taurus breeds such as Angus and Hereford, which are more suited to the temperate southern climate. Northern cattle producers have unique seasonal conditions and need to produce cattle during the wet season and export significant numbers before the dry season when feed is much less available. Indonesia has always been the major market for live cattle exporters because of its proximity and preference for lower weight feeder cattle which can be finished in that country. However political factors often affect the trade, which is regulated by the issuance of short-term import quotas by the Indonesian government. In mid-2011, for example, the Australian Minister for Agriculture banned the export of live cattle to Indonesia in response to allegations of animal cruelty in Indonesian slaughter facilities. Chart 10: Live cattle exports from Australia, 2005 to 2015 (‘000)
Source: Australian Bureau of Statistics (June, 2015).
The bilateral live cattle trade was subsequently restored based when various safeguard regimes were implemented, but Indonesia’s moves towards greater national food self-sufficiency have also disrupted exports. There was a major reduction in quotas for the September quarter of 2015, which led to higher beef prices in Indonesia. This event caused considerable concern for cattle producers in northern Australia which rely heavily on the live export trade with Indonesia. In mid-August 2015, Indonesian authorities issued new import permits for an extra 50,000 head of live cattle ready for slaughter. This quota expansion doubled the number of cattle Indonesian processors could buy from Australia and partly reversed the cut in permits for the September quarter. However, it remains unclear whether Australian cattle producers can meet Indonesia's new quota as s numbers of slaughter cattle were exported to other overseas markets in the first half of the year. In addition, continued dry conditions in Queensland and a lack of suitable freight vessels could make it difficult to export a further 50,000 cattle to the Indonesian market. In 2014, Australia supplied about 40 percent of beef consumed in Indonesia.

The Australian government has made a number of proposals and agreements to increase the certainty of the live cattle trade with Indonesia. In August 2014, Australian cattle producers signed the Indonesia-Australia Partnership on Food Security which sets collaborative ways to strengthen bilateral business, investment and trade ties across the red meat and cattle sector: link. In late August 2015, Australia announced US$10 million in funding for the Indonesia-Australia Partnership on Food Security in Red Meat and Cattle Sector. This will be used for projects to promote sustainable commercial-scale beef cattle breeding in Indonesia; the continuation of the Indonesian Skills Development Program for 2016 and 2017 and further beef processing training. The Chinese Market for Live Cattle China is already a significant market for Australian exports of live cattle for breeding purposes. The as yet unratified bilateral China-Australia FTA (ChAFTA) will also ease imports of other types of live cattle. In August 2015, Australia and China finalized a signed an import protocol for feeder and slaughter cattle which will allow exports to the Chinese market. At the time, the Australian Agriculture Minister suggested that live exports to China would start off slowly through air shipments, but could reach one million head per year in a decade. China will now begin to issue import permits to Australian exporters under the Exporter Supply Chain Assurance System (ESCAS). However, a significant expansion of this trade would require the creation of an extensive infrastructure to support exports of live feeder and slaughter cattle to China. Note on Beef Cattle Feedlots in Australia Lot feeding is the process of fattening cattle, sheep or lambs on grain in yards or lots for slaughter. Operators control feeding regimes to give greater certainty of weight gain than is possible with grass finishing which depends on seasonal conditions. Strong demand for premium-grade grain-fed beef in Australia and overseas markets such as Japan and Korea has led to a significant expansion in feedlot operations in some regions. Around 40 percent of Australia’s total beef supply and 80 percent of beef sold in domestic supermarkets has been processed through the feedlot sector. Cattle numbers in Australian feedlots in the June 2015 quarter accounted for around 957,000 head, one of the highest totals on record. There are around 400 accredited feedlots in Australia which are typically located in close proximity to cattle, grain, water and beef processing facilities (see chart 11). Most feedlots are located in Queensland followed by NSW, WA, Victoria and South Australia. Poor seasonal conditions in Queensland and NSW contributed to the rising level of feedlot processing in these States in recent years (chart 12).

Chart 11: The location and size of feedlots in Australia, 2015
Source: Australian Lot Feeders Association (2015).
Chart 12: Proportion of beef cattle slaughter turned-off via feedlots, 2001-2013 (percent)
Source: Australian Department of Agriculture, the Australian Bureau of Statistics and Australian Lot Feeders Association (2015).
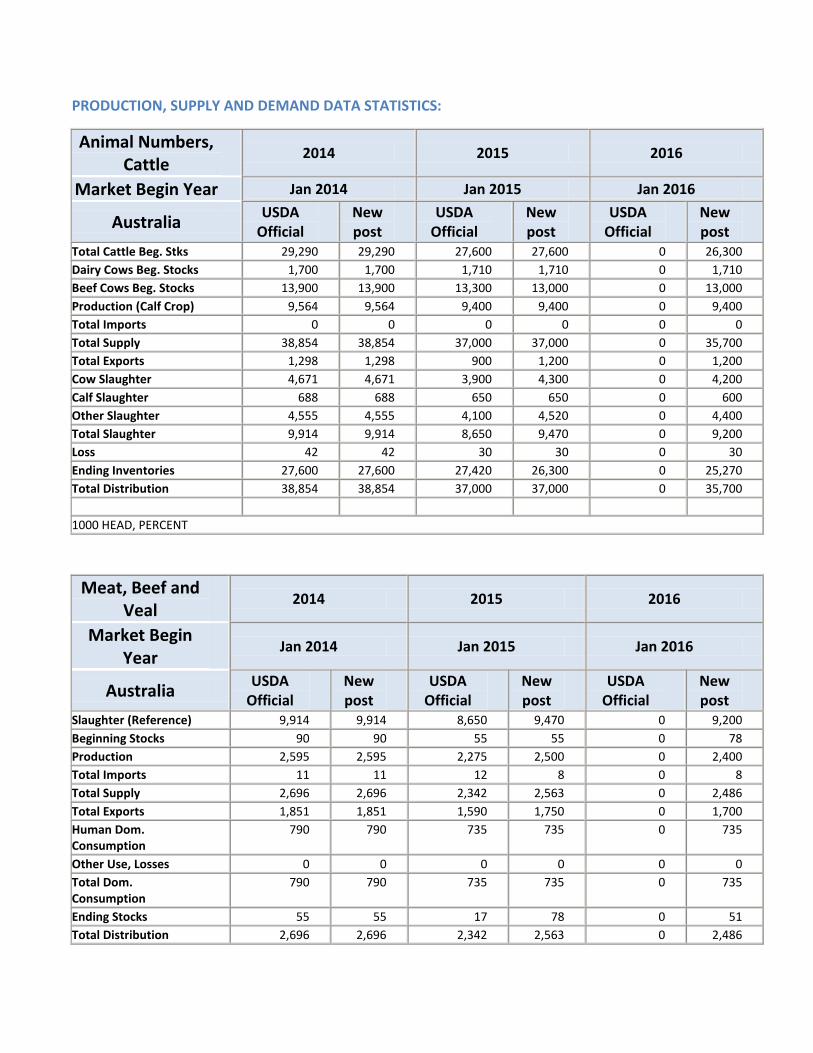
PRODUCTION, SUPPLY AND DEMAND DATA STATISTICS:
Animal Numbers, Cattle
2014 2015 2016
Market Begin Year Jan 2014 Jan 2015 Jan 2016
Australia USDA
Official New post
USDA Official
New post
USDA Official
New post
Total Cattle Beg. Stks 29,290 29,290 27,600 27,600 0 26,300
Dairy Cows Beg. Stocks 1,700 1,700 1,710 1,710 0 1,710
Beef Cows Beg. Stocks 13,900 13,900 13,300 13,000 0 13,000
Production (Calf Crop) 9,564 9,564 9,400 9,400 0 9,400
Total Imports 0 0 0 0 0 0
Total Supply 38,854 38,854 37,000 37,000 0 35,700
Total Exports 1,298 1,298 900 1,200 0 1,200
Cow Slaughter 4,671 4,671 3,900 4,300 0 4,200
Calf Slaughter 688 688 650 650 0 600
Other Slaughter 4,555 4,555 4,100 4,520 0 4,400
Total Slaughter 9,914 9,914 8,650 9,470 0 9,200
Loss 42 42 30 30 0 30
Ending Inventories 27,600 27,600 27,420 26,300 0 25,270
Total Distribution 38,854 38,854 37,000 37,000 0 35,700
1000 HEAD, PERCENT
Meat, Beef and Veal
2014 2015 2016
Market Begin Year
Jan 2014 Jan 2015 Jan 2016
Australia USDA
Official New post
USDA Official
New post
USDA Official
New post
Slaughter (Reference) 9,914 9,914 8,650 9,470 0 9,200
Beginning Stocks 90 90 55 55 0 78
Production 2,595 2,595 2,275 2,500 0 2,400
Total Imports 11 11 12 8 0 8
Total Supply 2,696 2,696 2,342 2,563 0 2,486
Total Exports 1,851 1,851 1,590 1,750 0 1,700
Human Dom. Consumption
790 790 735 735 0 735
Other Use, Losses 0 0 0 0 0 0
Total Dom. Consumption
790 790 735 735 0 735
Ending Stocks 55 55 17 78 0 51
Total Distribution 2,696 2,696 2,342 2,563 0 2,486

1000 HEAD, 1000 MT CWE, PERCENT, PEOPLE, KG
SWINE AND PORK Production Total pig slaughter for 2016 is forecast at 4.9 million while pig meat production is expected to increase slightly to 370,000 MT. Overall, there are 1,500 pork producers in Australia producing from a sow herd of 255,000. In 2016, the number of breeding sows in the Australian pig herd is expected to remain stable. The feed component (mainly grains such as wheat, barley and sorghum) makes up 60 percent of the total cost of producing pork and farm profitability varies with the cost of feed grain which has increased due to the drought. Prices to pork producers in Australia have increased from around $US2.00 a kilogram carcaseweight in 2011 to US$2.70 in 2015 while feed grain prices have been stable. The pork processing sector consists of around 45 abattoirs, of which seven are export accredited. The latter plants are comparatively large and account for over 80 percent of pigs produced in Australia. In March 2015, JBS of Brazil acquired the Primo Smallgoods Group, the leading producer of ham, bacon and smallgoods in Australia and New Zealand. Primo Smallgoods has five plants, seven distribution centers and 30 retail outlets in these countries. The US$1.25 billion purchase aimed to increase JBS’s presence in South Korea, Singapore and China.
Consumption Australians consume around 23.5 kg of pork per person annually, made up of 9.8 kg of fresh pork and 15 kg of processed ham products such as bacon and small goods. Pork products account for ten percent of total fresh meat retail consumption. Fresh pork sold in Australia is locally grown while around two thirds of processed pork products (ham, bacon and small goods products) are made from frozen boneless pork imported from Denmark, Canada and the United States. Consumption generally peaks during Christmas but is stable over the rest of the year. In coming years, high domestic prices for beef are expected as a result of the declining Australian cattle herd and rising exports, which could make pork more attractive to consumers. Most pork products are traced from paddock to plate through traceability systems such as the ‘PigPass’ National Vendor Declaration (NVD). This system provides key information that can be used to trace pigs or pork back to the property of origin in the event of an emergency, such as an animal disease outbreak or a food safety incident. Australian pork producers voluntarily agreed to phase out the use of gestation stalls by 2017, the first national pork industry to take this step. Australia is free of diseases such as Porcine Reproductive and Respiratory Syndrome (PRRS). Trade In 2015, exports of pork products are expected to increase slightly to 40,000 MT. Australia typically exports pork to a range of countries including Singapore, Japan and New Zealand. In 2015, pork imports are forecast at 250,000 MT with the United States and Denmark the largest sources. The Australian market is not currently open to imports of fresh, chilled or bone-in pork products on
biosecurity grounds. However, over 70 percent of ham, bacon and smallgoods consumed in Australia are made from imported frozen pork.
Future trade could also be affected by a number of bilateral trade agreements which have now been implemented. The Korea-Australia Free Trade Agreement (KAFTA) signed in April 2014 provides that tariffs on pork products will be phased out over 5-15 years. This increased market access is expected to allow Australian pork exporters to compete more equally with exporters from the United States which have benefited from provisions of the earlier Korea-United States free trade agreement. Further details of the agreement are here. Australia has been a successful though small-scale exporter to Japan where the disease-free production status of pork has created market opportunities. Under the Japan-Australia Economic Partnership Agreement (JAEPA), Australia will gain preferential access for a large volume of pork (more than ten times current trade) via an Australia-only quota. Australian pork exports to Japan are expected to increase due to the FTA measures and in response to the lower value of the Australian dollar against the yen. The full schedule of tariff concessions is available here. Note on Statistics Detailed statistics on the Australian pork industry are not readily available. The Australian Bureau of Agricultural and Resource Economics and Sciences (ABARES) are currently undertaking a project with the industry body Australian Pork to provide a comprehensive database on the operations of the industry.
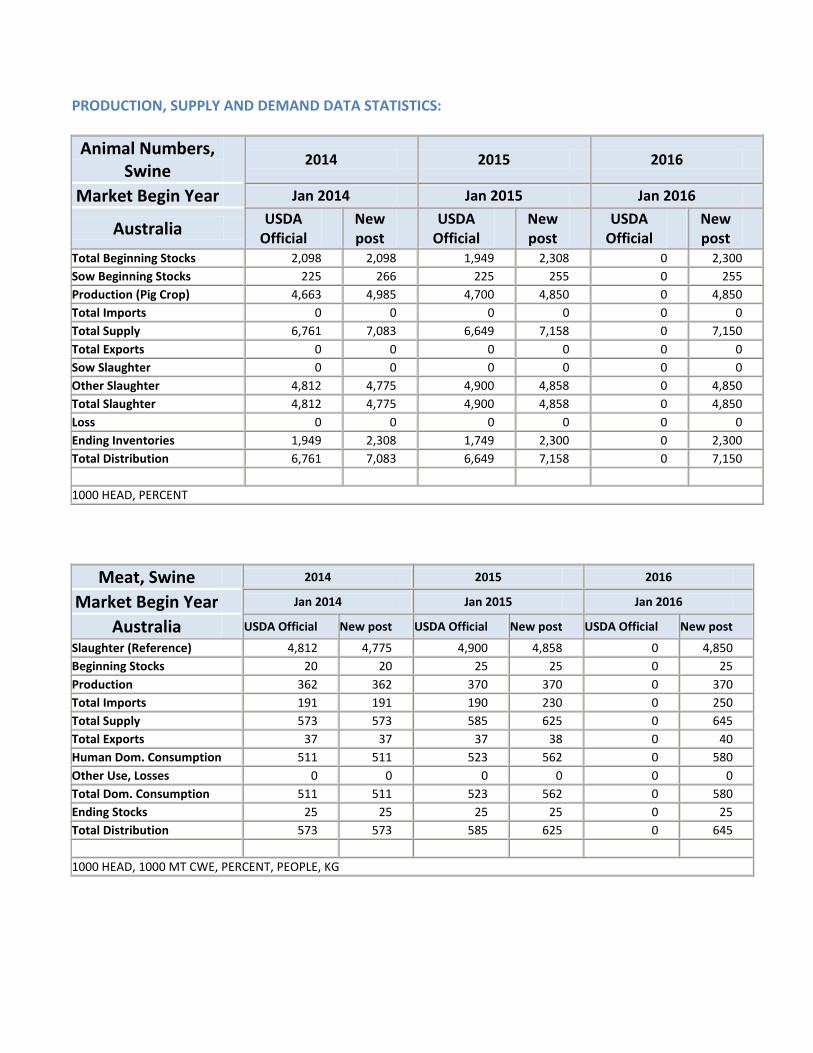
PRODUCTION, SUPPLY AND DEMAND DATA STATISTICS:
Animal Numbers, Swine
2014 2015 2016
Market Begin Year Jan 2014 Jan 2015 Jan 2016
Australia USDA
Official New post
USDA Official
New post
USDA Official
New post
Total Beginning Stocks 2,098 2,098 1,949 2,308 0 2,300
Sow Beginning Stocks 225 266 225 255 0 255
Production (Pig Crop) 4,663 4,985 4,700 4,850 0 4,850
Total Imports 0 0 0 0 0 0
Total Supply 6,761 7,083 6,649 7,158 0 7,150
Total Exports 0 0 0 0 0 0
Sow Slaughter 0 0 0 0 0 0
Other Slaughter 4,812 4,775 4,900 4,858 0 4,850
Total Slaughter 4,812 4,775 4,900 4,858 0 4,850
Loss 0 0 0 0 0 0
Ending Inventories 1,949 2,308 1,749 2,300 0 2,300
Total Distribution 6,761 7,083 6,649 7,158 0 7,150
1000 HEAD, PERCENT
Meat, Swine 2014 2015 2016
Market Begin Year Jan 2014 Jan 2015 Jan 2016
Australia USDA Official New post USDA Official New post USDA Official New post
Slaughter (Reference) 4,812 4,775 4,900 4,858 0 4,850
Beginning Stocks 20 20 25 25 0 25
Production 362 362 370 370 0 370
Total Imports 191 191 190 230 0 250
Total Supply 573 573 585 625 0 645
Total Exports 37 37 37 38 0 40
Human Dom. Consumption 511 511 523 562 0 580
Other Use, Losses 0 0 0 0 0 0
Total Dom. Consumption 511 511 523 562 0 580
Ending Stocks 25 25 25 25 0 25
Total Distribution 573 573 585 625 0 645
1000 HEAD, 1000 MT CWE, PERCENT, PEOPLE, KG