aurore: a platform for ultrafast sciences
TRANSCRIPT

HAL Id: hal-02985546https://hal.archives-ouvertes.fr/hal-02985546
Submitted on 2 Nov 2020
HAL is a multi-disciplinary open accessarchive for the deposit and dissemination of sci-entific research documents, whether they are pub-lished or not. The documents may come fromteaching and research institutions in France orabroad, or from public or private research centers.
L’archive ouverte pluridisciplinaire HAL, estdestinée au dépôt et à la diffusion de documentsscientifiques de niveau recherche, publiés ou non,émanant des établissements d’enseignement et derecherche français ou étrangers, des laboratoirespublics ou privés.
Aurore: A platform for ultrafast sciencesN. Fedorov, S. Beaulieu, A. Belsky, V. Blanchet, R. Bouillaud, M. de Anda
Villa, A. Filippov, C. Fourment, J. Gaudin, R. Grisenti, et al.
To cite this version:N. Fedorov, S. Beaulieu, A. Belsky, V. Blanchet, R. Bouillaud, et al.. Aurore: A platform for ultrafastsciences. Review of Scientific Instruments, American Institute of Physics, 2020, 91 (10), pp.105104.�10.1063/5.0012485�. �hal-02985546�

Aurore
Aurore: A platform for ultrafast sciencesN. Fedorov,1 S. Beaulieu,1, a) A. Belsky,1 V. Blanchet,1, b) R. Bouillaud,1 M. De Anda Villa,2 A. Filippov,1 C.Fourment,1 J. Gaudin,1, c) R.E. Grisenti,3 E. Lamour,2 A. Levy,2 S. Mace,2 Y. Mairesse,1, d) P. Martin,1 P.Martinez,1 P. Noe,4 I. Papagiannouli,1, e) M. Patanen,5 S. Petit,1 D. Vernhet,2 K. Veyrinas,1 and D. Descamps1, f)1)Universite de Bordeaux - CNRS - CEA, CELIA, UMR5107, F-33405 Talence,France2)Sorbonne Universite, CNRS, UMR 7588, Institut des Nanosciences de Paris, INSP, Campus Pierre et Marie Curie,F-75252 Paris Cedex 05, France3)Institut fur Kernphysik, J. W. Goethe Universitat, Max von Laue str. 1, 60438 Frankfurt am Main,Germany4)Universite Grenoble Alpes, CEA-LETI, 17 rue des Martyrs, F-38054 Grenoble Cedex 9,France5)Nano and Molecular Systems Research Unit, Faculty of Science, University of Oulu, P.O. Box 3000, FI-90014 Oulu,Finland
(Dated: 2 November 2020)
We present the Aurore platform for ultrafast sciences. This platform is based on a unique 20W, 1 kHz, 26 fs Ti:Sapphire laser system designed for reliable operation and high intensitytemporal contrast. The specific design ensures a high stability in terms of pulse duration,energy and beam pointing necessary for extended experimental campaigns. The laser supplies5 different beamlines, all dedicated to a specific field: attosecond science (Aurore 1), ultrafastphase transitions in solids (Aurore 2 and 3), ultrafast luminescence in solids (Aurore 4),femtochemistry (Aurore 5). The technical specifications of these five beamlines are describedin details and examples of recent results are given.
PACS numbers: Valid PACS appear hereKeywords: Suggested keywords
I. INTRODUCTION
Since the first demonstrations of laser with titanium-sapphire (Ti:Sapphire, Ti3+:Al2O3) in the earlyeighties1–3, this material has been one of the majorbuilding brick of the ultrafast science. Taking ad-vantage of the chirped pulse amplification technique,4
Ti:Sapphire lasers nowadays span pulses duration vs en-ergy space ranging from few femtosecond5 with carrierenvelop phase (CEP) stabilization and mJ up to kJpulse reaching several PW peak intensities. This ver-satility makes Ti:Sapphire lasers particularly suitablefor secondary sources ranging from THz to x-ray wave-lengths, extending the field of science that can be ex-plored and notably to the attosecond timescale thanksto high-harmonics generation. In a nutshell: Ti:Sapphirelasers are the swiss knives of the ultrafast science com-munity.As a result, femtosecond lasers enable the investigation ofultrafast dynamics in matter, and have led to important
a)Now at: Fritz Haber Institute of the Max Planck Society, De-partment of Physical Chemistry, 14195 Berlin, Germanyb)Electronic mail: Author to whom correspondence should be ad-dressed: [email protected])Electronic mail: Author to whom correspondence should be ad-dressed: [email protected])Electronic mail: Author to whom correspondence should be ad-dressed: [email protected])Now at: Laboratoire de Physique des Gaz et des Plasmas, Univer-site Paris-Saclay, CNRS, UMR8578, F-91405 Orsay Cedex, Francef)Electronic mail: Author to whom correspondence should be ad-dressed: [email protected]
breakthroughs in the past decades. The broad range ofapplications leads to a variety of requirements, dependingon the nature of the target (solid, liquid, gaseous), theexcitation and/or the probe wavelengths (from the mid-IR to the extreme ultraviolet), and the timescale of thedynamics (picoseconds, femtoseconds, attoseconds). TheAurore platform at the CEntre Lasers Intenses et Appli-cations (CELIA) was designed to fulfill all these require-ments used in numerous experiments ranging from solidstate physics6, warm-dense matter7, femtochemistry8
and attosecond science9 as will be shown later on. Itscore is a 20 W Ti:Sapphire laser delivering 26 fs pulses at1 kHz that can supply up to three experiments in parallel.Other similar platforms driven by a kHz and multi-mJclass femtosecond laser exist in the world, for instance,the Artemis facility at the Central Laser Facility (UK),the Attolab kHz laser of the Lund Laser Center (Swe-den), the ATTOLab platform of Paris-Saclay university(France), the Allegra ELI beamlines (Cezch Republic)Only Allegra laser facility is based on optical parametricamplification (OPA) while the three others laser facili-ties use the Ti:Sapphire technology. To portray a pictureof what is currently available with this kind of laser fa-cilities, we describe in Table 1 the characteristics of theprimary and secondary sources as well as the end-stationequipment for the four platforms mentioned above.
Five beamlines are devoted to different applications,using various frequency conversion schemes and opticalor photoelectrons / photoions diagnostics. In this paper,we present the Aurore Platform dedicated to ultrafastdynamics of matter. The first part of the manuscript de-scribes the Aurore laser system. The following parts fo-cus on each beamline, discussing their peculiarities, eachillustrated by one recent application.

Aurore 2
TABLE I. Compilation of kHz/mJ laser class facilities, i.e. open to external users. Data are extracted from web sites andreferences. List of used acronyms: OPA: optical parametric amplifier, ARPES: angle-resolved photoelectron spectroscopy, HHG:high-harmonic generation, VMI: velocity map imaging, TOF: time of flight, PES: photolectron spectroscopy, TR-SR-PES: timeand spin-resolved photoelectron spectroscopy, CEP: carrier envelope phase, CDI: coherent diffractive imaging, TR-SE: time-resolved spectroscopic ellipsometry, TR: time-resolved, XRD: x-ray diffraction, XAS: x-ray absorption spectroscopy, XES: x-rayemission spectroscopy
Facility Laser parameters Secondary light sources beamlines and/or end-stations
ArtemisCentral Laser Facility
30 fs - 2 x 8 mJ780 nm - 1 kHz
OPA (235 nm to 15 µm)7 fs post compressed 780 nm
12 fs post compressed 1500 nmHHG (10-100 eV)
Condensed matter: ARPES + TR-SR-PESGas Phase: VMI/TOF
XUV Imagingliquid microjet
Attolab kHz laserLund Laser Centre
20 fs - 5 mJ800 nm - 1 kHz
CEP stable
OPA (1100-1800 nm)HHG (17-150 eV)
Gas Phase: TOF, VMI
ATTOLabLaboratoire Interactions,
Dynamique et Lasers
24 fs - 15 mJ800 nm - 1 kHz
CEP stable
OPA (1200-2000 nm)HHG (15-100 eV)
Gas Phase: TOF, VMI
Laser 1 AllegraELI beamlines
15 fs - 20 mJ835 nm - 1 kHz
plasma x-ray (1-77 keV)HHG (10 - 120 eV)
AMO VMI/TOF and CDISolid state: NIR to NUV TR-SE
TR-XAS/XES, TR-XRDRaman, optical absorption spectroscopy
II. THE AURORE LASER FACILITY
The Aurore laser is based on chirped pulse amplifica-tion (CPA) scheme in Ti:Sapphire amplifiers (cf. Fig.1). The first brick of the laser is a Kerr-lens mode-locked Ti:Sapphire oscillator (Femtolasers, Fusion Pro)which delivers 420 mW, 12 fs pulses at 75 MHz. Tocounteract spectral gain-narrowing in Ti:Sapphire am-plifiers without reducing the available seed energy, in-tracavity spectral shaping is achieved in the oscillatorresulting in a M-shaped output spectrum with 30 % am-plitude modulation and a bandwidth of 84 nm (FWHM).The oscillator pulses are then stretched to 510 ps byan all-reflective stretcher design based on an aberrationfree Offner triplet10 with 1200 grooves/mm grating. Asthe amplified bandwidth gets broader, significant spec-tral phase distortions are present (group velocity disper-sion of mirrors, polarizers, Pockels cells and Ti:Sapphireamplifiers) and need to be corrected to provide cleanrecompressed pulses. To do so, an acousto-optic pro-grammable dispersive filter (Dazzler, FASTLITE) is in-serted at the stretcher output and coupled with a tem-poral pulse characterization (Self-Referenced Spectral In-terferometry, Wizzler, FASTLITE) performed at the Au-rore compressor output with microjoule pulse energy. Inaddition, the Dazzler device enables fine spectral shap-ing of the seed pulse to provide day after day identicalcharacteristics of the amplified pulse spectrum.
At the Dazzler output, a potassium dihydrogen phos-phate (KDP) Pockels cell (PC piker) is used to reducethe repetition rate down to 1 kHz with an extinctionratio higher than 104. The chirped pulses are first ampli-fied in a regenerative Ti:Sapphire amplifier pumped bya Q-switched frequency-doubled neodymium-doped yt-trium lithium fluoride (Nd:YLF) laser (1 kHz, 18 W at527 nm, Jade2 - Thales) up to 1.8 mJ/pulse. To re-move parasitic reflections from the intracavity broadbandpolarizer of the regenerative amplifier and then improvepulse intensity contrast in nanosecond time scale, a sec-
ond KDP Pockels cell (PC cleaner) is used before furtheramplification. The second and last Ti:sapphire ampli-fier is cooled by a high power pulse tube cryorefrigerator(PT90, Cryomech) to reduce the thermal lensing11 in-duced by the heat load of the pump power provided by4 Q-switched frequency-doubled Nd:YLF lasers (1 kHz,28 W at 527 nm, Jade2 - Thales). By keeping the tem-perature as low as -170oC, the thermal focal lens in theTi:Sapphire crystal reaches a dozen meters, enabling amulti-pass amplifier architecture without using focusingoptics, i.e. with free beam propagation. At each passin the Ti:Sapphire crystal, the spatial overlap betweenpump and signal beams is ensured by the combinationof the natural beam divergence of the IR (increase beamsize with length of the amplifier arms) and the radialoptical gain of the Ti:Sapphire amplifier (Gaussian dis-tribution) reshaping the beam waist size. After 4 passesin the cryo-cooled Ti:sapphire crystal, the pulse energy isamplified up to 22 mJ/pulse with a spectral bandwidthof 54 nm (FWHM) and a central wavelength of 800 nm(Fig.2 (c)). At the output of this last amplifier, the beampointing is stabilized (to mainly compensate slow drifts) by an active device (Aligna, Messtechnik).
Finally, the laser beam diameter is expanded to 25mm (at Imax/e2) and distributed among five beamlineswith up to 3 simultaneously, each of these dedicatedto a specific field of research. The main characteristicsof these beamlines are summarized in Table 1. As abeamline can be up to 15 m long, the pulses propagatestretched and are recompressed close to each experi-mental set-ups by a double-pass Treacy compressor12
using 1480 grooves/mm gratings and ensuring a totaltransmission of 70%. The use of mismatched gratingstrecher/compressor (1200 grooves/mm versus 1480grooves/mm) results in a better compensation of thematerial dispersion of amplifier optics13. The temporalpulse profile at the compressor output is characterizedby a Second-Harmonic Frequency-Resolved OpticalGating (SHG-FROG) device. Figure 2 shows the FROG

Aurore 3
FIG. 1. Schematic view of the Aurore laser system with its main constituting blocks
FIG. 2. Retrieved intensity profile of the output pulses fromSHG-FROG device. (a) Measured SHG-FROG trace. (b) Re-trieved SHG-FROG trace. (c) Retrieved SHG-FROG spec-trum (black curve) and phase (dashed blue curve) super-imposed with the experimental output pulse spectrum (redcurve). (d) Retrieved intensity profile (red curve) superim-posed with the Fourier-transform of the experimental spec-trum (black curve).
FIG. 3. Long-term stability of the Aurore laser. Measure-ments of the average power and the beam pointing (insertedgraph) of the laser during 8 hours.
traces and the retrieved spectrum and intensity profileat the compressor output of the Aurore beamline 3.A pulse duration of 26.5 fs (FWHM) is achieved veryclose to the Fourier-transform limitation of the outputpulse spectrum (Fig.2 (d)). As many experiments usesecondary sources and require acquisition time of up toseveral hours, the long-term stability of the Aurore lasercharacteristics is prime of importance. Particular carehas therefore been taken to i) reduce the mechanicalvibration level on or near the optical tables ii) choose themost stable optical mounts with a laser beam height notexceeding 50 mm iii) stabilize the ambient temperatureof the laser room at ± 0.5◦ C iv) avoid or water-coolheat sources on the optical tables. Thus, after one hourof warm-up, the long term stability (measurements over8 hours) of the Aurore laser facility is typically of 1.1%(RMS) in average power and 3.6 µrad (RMS) in beampointing (Fig. 3).
A very important parameter while performing con-densed matter experiments with ultra-short lasers isthe temporal pulse contrast. Indeed a low contrastresults in a pre-heating effect of the sample which canstrongly disturb the experiment, especially for material

Aurore 4
FIG. 4. High dynamic range temporal contrast measurementof the compressed pulses carried out with a third-order auto-correlator.
with very low temperature of fusion. In Fig. 4 weshow a typical third-order autocorrelator measurement(SEQUOIA system, Amplitude Technologies). Thetwo visible peaks at -24 ps and 12 ps are replicas fromthe third-order autocorrelator apparatus, while thefeature at -44 ps obtained without the beam shows thebackground level of the measurement. The pedestal ofthe compressed pulse in the 10 ps time window exists inall CPA laser systems using large pulse stretching factor(grating-based stretcher) and results from the scatteringlight induced by the grating of the stretcher14,15. Thesignal at 10−7 is the amplified spontaneous emission(ASE) level which lasts around 3 ns and corresponds tonearly 1.5% of the fs pulse in energy. The high contrastof Aurore makes this source highly suitable to avoidpre-heating in condensed phase.
III. BEAMLINE 1: ATTOSCIENCE
One of the greatest advantages of the Aurore 1 beam-line is versatility. Indeed, the different building blocksavailable in the experimental hall (XUV beamline andspectrometers, Velocity Map Imaging spectrometer, few-cycle pulse generation module, various molecular beamsources) can be reconfigured on demand for different ap-plications.
A. High-order harmonic generation in gas phase
The Aurore 1 beamline is mostly dedicated to attosec-ond science and molecular spectroscopy using high-orderharmonic generation (HHG). The HHG process occurswhen laser pulses are focused at intensities around 1014
W·cm−2 in an atomic or molecular gas. The strong laserfield lowers the Coulomb potential of the target, enablingelectrons to tunnel out in the continuum. The freed elec-tron wavepacket is then accelerated by the laser field,gaining a high amount of kinetic energy. When the laser
field reverses, the electrons can be driven back to theirparent ion and radiatively recombine, emitting an at-tosecond burst of extreme ultraviolet light. This processrepeats every half laser period, creating a spectrum madeof odd harmonics of the fundamental laser frequency.
Since its discovery in 198716,17, HHG has been usedin many experiments as a source of coherent femtosec-ond and attosecond light pulses in the extreme ultravio-let. Indeed, HHG sources possess a number of propertiesthat make them ideal for many applications: excellentspatial coherence18, high brightness (above 1010 photonsper pulse using energetic Ti:Sapphire laser pulses19,20,above 1013 photons per second using high-repetitionrate Ytterbium fiber lasers21,22), and ultrashort du-ration (femtosecond23,24 and attosecond25–27 pulses).These properties make HHG sources appealing for time-resolved measurements in atomic, molecular, and solid-state physics, but also as a simple alternative VacuumUltraViolet source of irradiation to investigate labora-tory astrochemistry, for instance28.
In parallel to these XUV source developments, a newroute for applications of HHG emerged in the early2000’s, once it was realized that the high-harmonic emis-sion encodes structural and dynamical information on thegenerating medium29,30. This resulted in a new class ofmeasurements, referred to as high-harmonic spectroscopyor in-situ measurements, in which strong-field driven at-tosecond electron wavepackets are used to probe the sys-tem under investigation. The structural and dynami-cal informations are encoded in the spectrum, spectralphase, and polarization state of the emitted XUV radia-tion.
B. General features of the experimental set-up
The Aurore 1 beamline is a versatile set-up, whichcan be reconfigured on demand for different applications.The main ingredients are the following:Postcompression: The 26 fs pulse duration of the Au-rore laser is shortened down to 7 fs (FWHM) in a post-compression module based on the self-phase modulationin a noble gas-filled hollow core fiber. To reach millijouleouput energy level, a stretched fiber with a 500 µm in-ner diameter and 1.5 m length is used and filled with apressure gradient of neon31,32. At the fiber output, thebeam is collimated in vacuum chamber to a diameter of6 mm (Imax/e
2) and sent to six pairs of chirped mirrors(-50 fs2 per bounce) and silica plates (thickness ∼ 5 mm)to compensate the group delay dispersion. In this con-figuration, we are able to daily produce pulses of 7 fs -1.2 mJ when 1.1 bar of neon pressure is used.Optical frequency conversion: The spectral tunabil-ity of the laser pulses is rather limited in Aurore 1, withbasic nonlinear frequency conversion set-ups available toproduce second (400 nm) and third (267 nm) harmonicradiation.High-order harmonic generation: Different HHGschemes can be implemented. For applications requiringhigh XUV flux, the laser or its second harmonic is looselyfocused in a gas cell filled with krypton, acetylene, argon

Aurore 5
TABLE II. Summary of the different Aurore beamlines.List of used acronyms: NOPA: non-colinear optical parametric amplifier, UPS: ultraviolet photoelectron spectroscopy, XPS:x-ray photoelectron spectroscopy
Beamline TopicsNumber of
compressorsSecondary light sources Experimental end-stations
BL 1 Attoscience 1HHG (20-100 eV)
7 fs 1.2 mJ post-compressed pulsesXUV spectroscopy and polarimetry
Velocity map imaging
BL 2 Solid state 2 NOPA 380 - 680 nm 80 fs - 3-4 µJ pulseFrequency domain interferometry
on bulk/thin film samples up to 9 ps
BL 3 Solid state 2HHG monochromatized (75-95 eV)multi-layer based monochromator
Hemisperical analyzer UPS and XPS
BL 4 Solid state 2HHG monochromatized (20-50 eV)
grating based monochromatorPhoto-luminescence
BL 5Small
quantumsystems
1UV NOPA, tunable from
750 nm to 200 nm, at few µJ/p,with duration varying from 50 to 130fs
Velocity map imaging of charged particles8% energy resolution up to 17 eV
ion mass spectroscopy with ∆m/m = 0.7%
or neon depending on the target spectral range (from 15eV to 100 eV). The typical photon flux produced in the15-30 eV range is 1011 photons/s per harmonic. Quasi-circularly polarized XUV radiation can be produced inspecific spectral ranges, by using resonant high-order har-monic generation in SF6 or argon33,34 gas jet.
For high-harmonic spectroscopy, a 100 Hz pulsed Gen-eral Valve or a 1 kHz pulsed Even-Lavie valve can beused to produce harmonics in cold molecular beams35 orclusters36. Liquid or solid samples can be introduced in-side the Even-Lavie valve, heated, and pushed by a back-ing pressure of rare gas to produce a seeded gas jet. Al-ternatively, they can be placed in an oven connected to astatic cell under vacuum. This scheme was, for instance,used to investigate high-harmonic emission from chiralfenchone molecules37. Sophisticated pump-probe geome-tries can be implemented with any relative polarizationsbetween the laser beams. Transient grating spectroscopyuses two non-colinear pumps and one probe beam, en-abling high-contrast measurements. We used this schemeto follow the photodissociation of NO2 molecules38. In-serting a phase mask in the generating laser beams pro-duces two spatially separated harmonic sources, whichinterfere in the far field, enabling phase-resolved mea-surements of the XUV emission35,39. It is even possibleto combine transient gratings and two-sources interfer-ometry to obtain information on the vectorial propertiesof the high-harmonic emission, e.g. when generating fromaligned molecules35.XUV optics: High-order harmonic generation in gasphase produces broad spectra constituted of odd har-monics of the fundamental frequency (separated by 3.1eV when using a 800 nm pulse). The spectral splittingbetween two consecutive harmonics can be broadened bydecreasing the driving wavelength, to reach 6.2 eV whenusing a 400 nm driver. Many applications require a spec-tral selection. In Aurore 1, this is achieved by usingmetallic foils, which play the role of bandpass filters (Zraround 26 eV, Al: 20-70 eV, In around 15 eV and Snaround 22 eV, Luxel filters). The XUV radiation can berefocused by gold-coated toroidal mirror with 500 mmfocal distance under 85o grazing incidence (Winlight) tofocus this HHG emission into a velocity map imaging(VMI) for instance. The alignment of this toroidal mir-
ror is motorized to properly minimize the astigmatismat the focus, while maintaining a spatial overlap with amolecular beam and a second laser pulse for instance40.Detectors:The XUV radiation is analyzed by a flat-field XUV spec-trometer, consisting of a 1200 mm−1 variable groovespacing spherical grating used under grazing incidenceand a set of dual microchannel plates with a rapid phos-phor screen (P46, decay time of 99 % within ∼ 1 µs)which allows to measure single-shot HHG spectra at 1kHz. A 12-bit cooled CCD camera is used to image thephosphor screen and to record the spatially resolved har-monic spectra, enabling for instance to resolve subtle ef-fects such as spectro-spatial rings in the HHG process41.The XUV polarization state can be partially analyzed bya rotating polarizer consisting of bare gold mirrors, whichprovides the polarization direction and an upper boundof the ellipticity.
Moreover, photoionization experiments can be carriedout in a VMI Spectrometer, consisting of a gas jet pro-duced by a continuous jet or 1 kHz pulsed Even Lavievalve followed by a skimmer, a set of high-voltage elec-trodes which image the projection of the 3D photo-electron or photoion angular distribution onto a set ofdual microchannel plates associated with a P43 phos-phor screen and 12-bit SCMOS camera. This set-up wasrecently used to investigate photoelectron circular dichro-ism from chiral molecules42 and to track attosecond de-lays in chiral photoionization43.
C. Single-shot CEP-tagging using the Attosecondlighthouse
One of the great challenges in attosecond science is tobe able to gate the HHG emission in order to producean Isolated Attosecond Pulse (IAP) out of an Attosec-ond Pulse Train (APT), which naturally emerges fromHHG driven by multicycle laser pulse. Different gat-ing schemes have been developed in the past few yearsto temporally confine the high-harmonic emission to asingle optical half-cycle, resulting in the production ofan IAP-ionization gating44, amplitude gating45, polar-ization gating46 and double optical gating47. In 2012,

Aurore 6
FIG. 5. Attosecond lighthouse technique using CEP-unlockedlaser. (a) Spatially-resolved harmonic spectrum driven by aspatially chirped laser pulse of 7 fs. (b) Spectrally integratedharmonics spatial profile. (c) Spatially integrated harmonicsspectrum.
Vincenti and Quere48 proposed a new idea based on theuse of space-time couplings in ultrashort light beams: theattosecond lighthouse.
The attosecond lighthouse effect results of a controlledspace-time coupling on the wavefront of the fundamentalbeam, such that consecutive attosecond bursts from thetrain are emitted in different directions48. By insertinga pair of well-misaligned wedges in a collimated beam,an angular dispersion is introduced in the fundamentalbeam, which gives rise to a spatial chirp at the focus: theblue and red edges of the laser spectrum are focused intodifferent places, e.g. vertically shifted. This spatial chirpinduces an ultrafast wavefront rotation, meaning that thewavefronts for different consecutive laser half-cycles arenot parallel. Because XUV bursts are emitted perpendic-ular to the laser wavefront, consecutive attosecond burstspropagate in different directions. In combination withspatial filtering in the far-field, the attosecond lighthouseeffect can thus be used to produce a source of multipleIAP. Recently, Hammond et al.49 performed a tempo-ral characterization (streaking measurement) of the threemost intense beamlets generated by the attosecond light-house, and confirmed that they were isolated attosecondpulses.
In an attosecond lighthouse experiment, the propa-gation direction of the beamlets depends also on thecarrier-envelop phase (CEP) of the laser pulse. Thus,one needs to have a CEP-stabilized laser in order to sendthe beamlets in the same direction from pulse-to-pulse.On the others hand, in their seminal paper, Vincentiand Quere formulated the idea of using the single-shotfar-field profile of the XUV emitted from the attosecondlighthouse to perform an in situ tagging of the CEP ofthe laser48. Such a tagging releases the constraints on thelaser source, enabling CEP-resolved experiments withoutCEP stabilization.
In order to illustrate the possibility of CEP-resolvedexperiments without CEP stabilization, we used post-compressed pulses from Aurore down to 7 fs and intro-duced a pair of wedges in the few-cycle laser beam toproduce high-order harmonics in a gas jet of argon.
A spatially-resolved high-order harmonic spectrum in-tegrated over 100 laser pulses is shown in Fig. 5(a). The
harmonics exhibit large divergence because they are gen-erated from a vertically spatially chirped beam. This isthe signature of the angular spreading of the XUV usingthe attosecond lighthouse. However, the discrete hori-zontal fringes which result from the angular separationof the different attosecond beamlets along the verticalaxis are not visible in this measurement (see Fig. 5(b)).Indeed, the Aurore laser being not CEP-stabilized, thepulse-to-pulse CEP variation leads to the generation ofbeamlets emitted in different directions. The randomCEP fluctuations of the laser thus completely wash outthe discrete spatial fringes which are expected to emergewhen driving HHG using the attosecond lighthouse set-up.
Despite the unstabilized nature of the CEP, it isstill possible to perform CEP-resolved measurement ifthe detector used is able to acquire single-shot spectra.An example of single-shot high-order harmonics spectrarecorded for 9 laser pulses is shown in Fig. 6. Theyshow the emergence of horizontal spatial fringes, whichare characteristics of angularly spread attosecond burstsof 7 fs pulse. The phase of these spatial fringes is directlyrelated to the CEP of the driving pulse in the generatingmedium.
Figure 7 presents the single-shot extraction of thephase of the spatial fringes, using Fourier analysis. Onecan see that over 100 laser pulses, the CEP fluctuationsseem to be pretty random. This tagging of the relativein situ CEP in a pulse-to-pulse manner, allows to a pos-teriori sort the different spectra according to the phaseof their spatial fringes (Φ) and to sum them together toincrease the signal-to-noise ratio. In the following, wewill sum all the spectra with -300 mrad< Φ <300 mrad(green area in Fig. 7).
The spatially-resolved HHG spectrum of argon gener-ated from the attosecond lighthouse, after CEP sorting,is presented in Fig. 8(a). As explained previously, thisspatially-resolved spectrum provides a spatio-temporalmapping of the XUV emission, since the spatial posi-tion of the signal on the detector encodes its emissiontime, with sub-laser-cycle resolution. Well separated hor-izontal fringes are visible. Since we know that each ofthese fringes is separated by 1.3 fs (half-cycle of the 800nm driving wavelength), they can be used to calibratethe spatio-temporal mapping provided by the attosecondlighthouse effect.
In a recent study, we have demonstrated that thespatio-temporal mapping provided by the attosecondlighthouse enables to investigate near-threshold resonanteffects in HHG from Argon50. Indeed, using single-shotCEP tagging from a CEP unstable few-cycle laser in theattosecond lighthouse configuration allowed us to demon-strate that HHG coming from the ionization from excitedstates and recombination to the ground state are delayedby few femtoseconds with respect to non-resonant har-monics. Moreover, we have demonstrated that the ab-sence of spatial fringes on the below threshold free induc-tion decay indicates that this narrowband XUV emissionis not confined on the attosecond time-scale. Similarly tothe work of Kim et al.51, which used the attosecond light-house to probe the ionization gating process directly inthe time-domain, these measurements extend the scope

Aurore 7
FIG. 6. Nine single-shot measurement of the vertically spatially-resolved high-order harmonics spectrum, when driven byspatially chirped pulses.
FIG. 7. Phase of the spatial fringes extracted using Fourieranalysis, for each laser pulse. The green area represents thewindow used for CEP sorting the data in order to increasethe signal-to-noise ratio as it is in Fig. 8.
of the attosecond lighthouse technique, from a way togenerate isolated attosecond pulses to a metrology toolthat enables the measurement of ultrafast electronic dy-namics during HHG.
IV. BEAMLINE 2: FREQUENCY DOMAININTERFEROMETRY FOR PHASE TRANSITIONDYNAMICS IN SOLIDS.
The interaction of sub-picosecond laser pulses withsolids leads to the creation of a transient out-of-thermodynamical equilibrium state. In the sub- to fewpicoseconds following the interaction, the electronictemperature, Te, is higher than the atomic one, Ti. ForTe in the order of 1 eV, state transition occurs fromsolid to solid or liquid without reaching the ablationthreshold. The fact that Te 6= Ti leads to specific phase
FIG. 8. Time-frequency mapping of HHG using the attosec-ond lighthouse technique, with a CEP unstable laser, af-ter CEP tagging. (a) Spatially-resolved harmonic spectrumdriven by a spatially chirped laser pulse. (b) Spectrally in-tegrated harmonic spatial profile for e-HHG (in red) and forH13 (in blue). The fringe spacing was used to transform thespatial axis into a time axis. (one fringer spacing = 1.3 fs) (c)Spatially integrated harmonic spectrum (black) and contrastof the spatial fringes (blue). This figure is adapted from50.
transition processes often denominated as non-thermal.In covalent materials, non-thermal melting has beenpredicted and described theoretically while in metallicmaterial, bond hardening process seems at play52.The Aurore 2 beamline is dedicated to pump-probeexperiments on these phase transitions in solids usingthe frequency domain interferometry (FDI) technique53.The principal advantage of this beamline is the sampleholder which allows us to perform experiments at akHz repetition rate with an adjustable pump fluencehigher than the single-shot laser damage threshold of

Aurore 8
any material.One of the challenges of this field is to be able to mea-sure microscopic observables (atomic and/or electronicstructures) in well characterized macroscopic conditionswhich require the measurement of Ti and Te. Thereis no single experimental technique that can provideall these observables at a time. The strength of ourset-up is that hydrodynamics of the sample can beretrieved via the β parameters, which we will definefurther on, while the variations of the reflectivity allowsus to retrieve the complex dielectric constant ε. Thehydrodynamics evolution can be related to Te and Tiusing for suitable simulations code54, while ε is relatedto microscopic observable which can be compared toab-initio simulations performed at the deduced Te andTi. In this sense we can access, even though indirectly,to the microscopic and macroscopic observables in asingle experiment.
A. Two-color, polarization resolved FDI
Frequency domain interferometry was first demon-strated by Froehly and coworkers55 and furtherdeveloped in the context of time-resolved diagnostics forplasmas by Geindre et al.56. Here we briefly remind thebasic principle of the FDI technique. The idea is to splitthe probe pulse in two pulses delayed by a fixed ∆t. Ifthese two probe pulses are reflected on the sample andsent to a spectrometer, the diffraction grating temporallystretches the 2 pulses allowing them to interfere on thespectrometer detector. We now consider the case whenthe pump impinges the sample in between the two probepulses. The complex reflectivity coefficient of the secondprobe pulse will be then changed by an amount writtenas R = reiφ, r being the modulus and φ the phase of R.The intensity on the spectrometer detector can then bewritten as:
I(ω) = I0(ω)(1 + r2 + 2r cos(−ω∆t+ φ)) (1)
where φ is the absolute phase, ω the radial frequency,I0 the intensity of each pulse of the probe beam, and
I0(ω)= |E0(ω − ω0)| where E0 is the electric field, ω0 isthe central radial frequency of the probe pulse.In our specific set-up, the measurement for the S andP probe polarizations is performed simultaneously. Thisgives access to the complex dielectric constant of the ma-terial and provides a diagnostic of the hydrodynamics ofthe surface. Measuring RS and RP , the respective com-plex reflectivities in S and P polarizations can give accessto the complex refractive index, N , using the followingexpression:
N2 =
(1−RS1 +RS
)·(
1 +RP1−RP
)(2)
where N is the complex refractive index expressed asN=n-iκ. Measuring RS and RP allows us to access toN2. The complex dielectric constant during the phase
transition, ε, can then be deduced from the relation N2=ε.Furthermore, the interesting equality RP = R2
S arises bychoosing the incident angle of the probe beam on thesample, θ, equal to 45o and that leads to:
φP = 2 · φS and rP = r2S (3)
These relations that are independent of the N indexare only valid for probe beams interacting with sharp sur-faces, i.e. where the refractive index change happens ona length scale much smaller than the probe wavelength.It is convenient to define the two parameters57, βr andβφ as follows:
βr = rP /r2S , βφ = φP − 2 · φS (4)
These parameters turn out to be an efficient way tocharacterize the transition states of the sample. One candistinguish three main cases:
1. βr = 1, βφ = 0. This is the canonical case whenFresnel equations are valid: a sharp and immobileinterface between vacuum and the sample. Thiscorresponds to an isochoric heating, characterizedby a constant volume.
2. βr = 1, βφ 6= 0. The interface is still sharp butmoving. The difference in phase results then fromthe difference in the optical path between the firstand the second probe pulse. The amount by whichthe surface moved, noted d, is then related to βφby the relation:
βφ =4π
λcos θ.d (5)
3. βr 6= 1, βφ 6= 0. A plasma expands toward the vac-uum at the sample interface and the second probepulse interacts with this plasma. If the free elec-tron density, Ne, is higher than the critical density(Ncr
e = 1021(1.06/λ)2 cm−3), the beam will be re-flected by the plasma surface defined as Ne > N cr
e .
B. Experimental set-up
The FDI set-up, shown in Fig. 9, is made of 3 mainblocks: the two stages non-collinear optical parametricamplifier (NOPA) producing the probe pulse, theinteraction chamber with the investigated sample andthe spectrometer. The Aurore laser beam is firstly splitin two: the pump and the probe arms. Each beam isthen re-compressed down to 26 fs.The NOPA is built on a well-established scheme shownin Fig. 9. The two stages NOPA can be wavelengthtuned between 380 to 680 nm. For practical reasons wechoose to run it at 530.89 ± 0.02 nm. The 1st and 2nd
amplification stages deliver pulse energies of nearly 1µJ and 10 µJ respectively. As the beam goes throughseveral optical components (focusing lens, SF10 rod,

Aurore 9
FIG. 9. FDI set-up including the NOPA (BS : beamsplitter, BBO : Beta-Barium Borate crystal, S: sapphire plate, F: 800nm Notch-filter, SM: spherical mirror, L: Lens, SF10: heavy-flint glass, CaCo3: calcite crystal, TFP: thin film polarizer, PP:P polarized beam, SP: S polarized beam, C1, C2: double pass grating compressor, C3: prisms compressor, PD: photo-diode,ADL: achromatic doublet lens, DL: delay line, HWP: zero order half wave plate)
BBO crystals), the amplified pulse is then recompressedusing double-pass configuration in a F2 equilateralprism compressor (C3 in Fig.9). The NOPA centeredat 530.89 ± 0.02 nm has a FHWM of 11.28 ± 0.02 nmcorresponding to a Fourier-transform limited durationof 37 fs. To measure the pulse duration we have builta wavefront-splitting autocorrelator based on frequencydoubling in BBO crystal (60 µm thick). The pulseduration (FWHM) is then measured to be 36.9 ± 1.7 fsfrom the Gaussian fit.As stated in Part IV A, FDI requires two delayed probepulses. That is achieved by inserting a birefringentcalcite single crystal. The ordinary and extraordinaryrefractive indexes that are quite different (no = 1.66, ne= 1.49 at 532 nm) provide two delayed pulses by 8.5 pswith perpendicular polarizations. This delay fixes thetime window of the pump-probe investigation. In orderto have both probe pulses with the same polarization onthe sample a thin film polarizer is used. The polarizationstate of the probe beam is then fine tuned by a zero orderhalf waveplate. This is needed to adjust the intensityof the S and P reflection on the sample. The beampolarization must not be changed while steered by thedifferent optics. Practically this means that reflectionon mirrors must deflect the beam only in one direction(horizontally or vertically) at a time. If this is not thecase, S and P polarization are mixed, introducing a biasin the interpretation of the data.The pump and probe beams are then focused ontothe sample and overlapped spatially and temporally inthe interaction chamber. The pump spot size, whichdetermines the fluence, is measured directly by animagery set-up based on a 12 bit CCD camera. The200 mm plano-convex lens focuses the pump down to50 µm (FWHM) with a quasi perfect Gaussian shape.The 500 mm focal length mirror of the probe pulsescombined with a 0.5 mm pinhole is aligned to obtain ahomogeneous intensity on the sample. The pressure inthe chamber can be decreased down to 10−5 mbar with
a turbo-molecular pump. Due to the stability requiredfor such interferometric measurement, no measurementis achieved with running vacuum pumps.Most of our experiments deals with non-reversible phasetransitions, it is then mandatory to refresh the samplein-between two laser pulses. With a 1 kHz laser, themost convenient solution is a rotating target. Wedeveloped a specific sample holder which rotates at aspeed of 120 RPM. This challenging design is madesuch that the surface of the sample is always keptin the same plane within 10 µm. In fact, each datapoint, i.e. corresponding to a single pump-probe delay,is the average over 1000 laser pulses. If the surfaceof the sample moves while rotating, this leads to amisalignment on the entrance slit of the spectrometer.To achieve such high accurate positioning over the 100mm diameter samples, the sample support is mountedon 3 picomotors which are themselves assembled on therotating stage. Tuning the picomotors while monitoringthe surface with a laser displacement detector (KeyenceLKG500, 2 µm resolution) allows us to achieve a sub-10µm displacement. The flatness of the sample itself hasto be less than 4 µm over the radius.Finally, the probe beams are steered out of the chamberdown to the imaging spectrometer. The interaction pointis imaged by an achromatic doublet lenses (f = 200 mm)on the 200 µm entrance slit of the spectrometer. Thespectrometer is build on a Fastie-Ebert scheme usinga 1 m focal length spherical mirror and a 2400 l/mmgrating. The 1st order is diffracted back to the sphericalmirror so that the slit is re-imaged at the location of theback-illuminated CCD detector (Princeton InstrumentPixis 1024 eXcelon). Slightly before the CCD, the P andS polarization components of the probe beam are pulledapart by a Wollaston prism. The CCD is a 16 bit cooledcamera with pixels size of 13 µm. Given the dispersionof the grating and the CCD chip size (1024x1024 pixels),the recorded spectral bandwidth is not broader than 2nm. Such narrow bandwidth also presents the advantage
Aurore 10
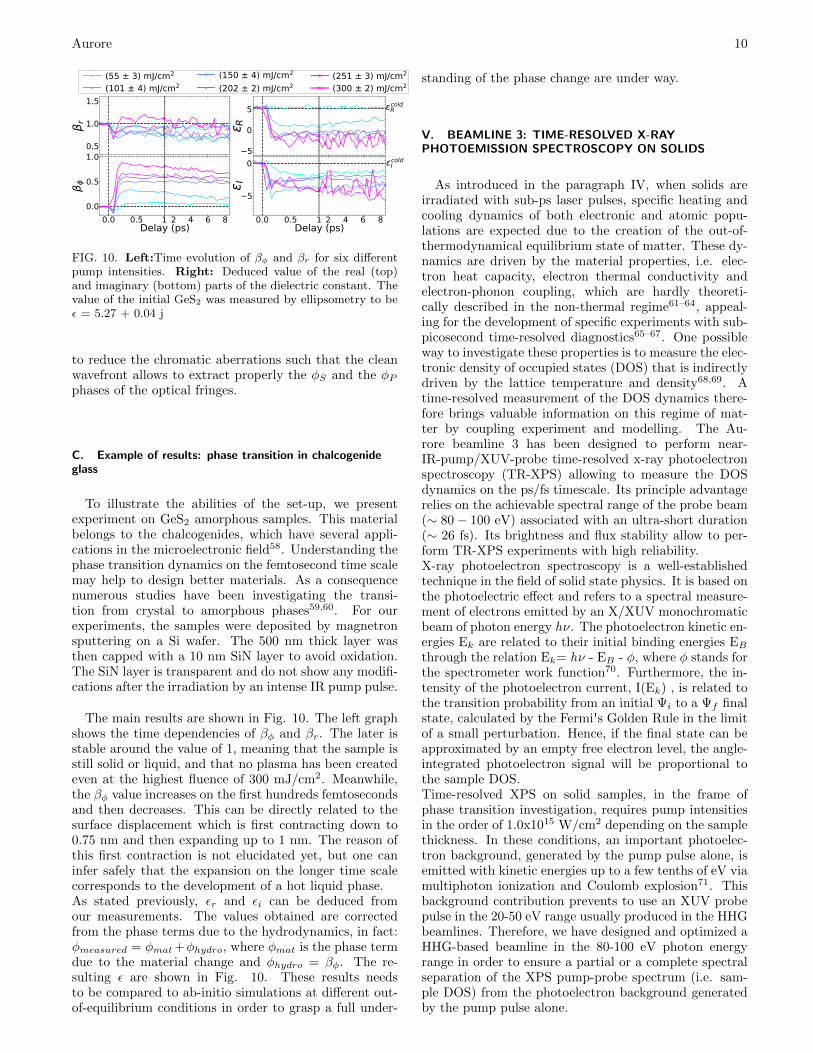
FIG. 10. Left:Time evolution of βφ and βr for six differentpump intensities. Right: Deduced value of the real (top)and imaginary (bottom) parts of the dielectric constant. Thevalue of the initial GeS2 was measured by ellipsometry to beε = 5.27 + 0.04 j
to reduce the chromatic aberrations such that the cleanwavefront allows to extract properly the φS and the φPphases of the optical fringes.
C. Example of results: phase transition in chalcogenideglass
To illustrate the abilities of the set-up, we presentexperiment on GeS2 amorphous samples. This materialbelongs to the chalcogenides, which have several appli-cations in the microelectronic field58. Understanding thephase transition dynamics on the femtosecond time scalemay help to design better materials. As a consequencenumerous studies have been investigating the transi-tion from crystal to amorphous phases59,60. For ourexperiments, the samples were deposited by magnetronsputtering on a Si wafer. The 500 nm thick layer wasthen capped with a 10 nm SiN layer to avoid oxidation.The SiN layer is transparent and do not show any modifi-cations after the irradiation by an intense IR pump pulse.
The main results are shown in Fig. 10. The left graphshows the time dependencies of βφ and βr. The later isstable around the value of 1, meaning that the sample isstill solid or liquid, and that no plasma has been createdeven at the highest fluence of 300 mJ/cm2. Meanwhile,the βφ value increases on the first hundreds femtosecondsand then decreases. This can be directly related to thesurface displacement which is first contracting down to0.75 nm and then expanding up to 1 nm. The reason ofthis first contraction is not elucidated yet, but one caninfer safely that the expansion on the longer time scalecorresponds to the development of a hot liquid phase.As stated previously, εr and εi can be deduced fromour measurements. The values obtained are correctedfrom the phase terms due to the hydrodynamics, in fact:φmeasured = φmat+φhydro, where φmat is the phase termdue to the material change and φhydro = βφ. The re-sulting ε are shown in Fig. 10. These results needsto be compared to ab-initio simulations at different out-of-equilibrium conditions in order to grasp a full under-
standing of the phase change are under way.
V. BEAMLINE 3: TIME-RESOLVED X-RAYPHOTOEMISSION SPECTROSCOPY ON SOLIDS
As introduced in the paragraph IV, when solids areirradiated with sub-ps laser pulses, specific heating andcooling dynamics of both electronic and atomic popu-lations are expected due to the creation of the out-of-thermodynamical equilibrium state of matter. These dy-namics are driven by the material properties, i.e. elec-tron heat capacity, electron thermal conductivity andelectron-phonon coupling, which are hardly theoreti-cally described in the non-thermal regime61–64, appeal-ing for the development of specific experiments with sub-picosecond time-resolved diagnostics65–67. One possibleway to investigate these properties is to measure the elec-tronic density of occupied states (DOS) that is indirectlydriven by the lattice temperature and density68,69. Atime-resolved measurement of the DOS dynamics there-fore brings valuable information on this regime of mat-ter by coupling experiment and modelling. The Au-rore beamline 3 has been designed to perform near-IR-pump/XUV-probe time-resolved x-ray photoelectronspectroscopy (TR-XPS) allowing to measure the DOSdynamics on the ps/fs timescale. Its principle advantagerelies on the achievable spectral range of the probe beam(∼ 80− 100 eV) associated with an ultra-short duration(∼ 26 fs). Its brightness and flux stability allow to per-form TR-XPS experiments with high reliability.X-ray photoelectron spectroscopy is a well-establishedtechnique in the field of solid state physics. It is based onthe photoelectric effect and refers to a spectral measure-ment of electrons emitted by an X/XUV monochromaticbeam of photon energy hν. The photoelectron kinetic en-ergies Ek are related to their initial binding energies EBthrough the relation Ek= hν - EB - φ, where φ stands forthe spectrometer work function70. Furthermore, the in-tensity of the photoelectron current, I(Ek) , is related tothe transition probability from an initial Ψi to a Ψf finalstate, calculated by the Fermi's Golden Rule in the limitof a small perturbation. Hence, if the final state can beapproximated by an empty free electron level, the angle-integrated photoelectron signal will be proportional tothe sample DOS.Time-resolved XPS on solid samples, in the frame ofphase transition investigation, requires pump intensitiesin the order of 1.0x10¹⁵ W/cm2 depending on the samplethickness. In these conditions, an important photoelec-tron background, generated by the pump pulse alone, isemitted with kinetic energies up to a few tenths of eV viamultiphoton ionization and Coulomb explosion71. Thisbackground contribution prevents to use an XUV probepulse in the 20-50 eV range usually produced in the HHGbeamlines. Therefore, we have designed and optimized aHHG-based beamline in the 80-100 eV photon energyrange in order to ensure a partial or a complete spectralseparation of the XPS pump-probe spectrum (i.e. sam-ple DOS) from the photoelectron background generatedby the pump pulse alone.

Aurore 11
A. Experimental set-up: general description
The TR-XPS beamline is schematized in Fig. 11. Thechirped pulse (320 ps) from Aurore laser beam is thensplit in two parts (60%/40%) in order to operate boththe HHG probe branch and the near-IR femtosecondpump one respectively. Each arm is independent interms of pulse duration and energy control thanks totwo independent compressors, each equipped with anenergy beam attenuator (half-wave plate + polarizingcube).The pump beam is directly focused by a 2 m focallength lens onto the sample surface forming an angle of∼ 3◦ with respect to the probe axis. The focused focalspot size of the pump beam is controlled using a beamaperture before the lens, allowing to have an irradiatedpump zone on the sample that is nearly 5 times largerthan the probe focal spot. Under these conditions, usinga focal spot size of 350 µm (FWHM), typical fluences of5. 103 J/m2 can be reached. The pump/probe relativedelay is controlled through a translation stage installedon the pump optical path. The probe beam is steeredinto the vacuum set-up right after compression in orderto produce XUV photons by HHG. As highlighted inFig. 11, this HHG beamline branch can be divided inthree parts: (1) generation, (2) monochromatization andfocusing, and (3) characterization.
The first part consists in the Aurore laser beamfocused in a variable-length gas cell using a sphericalmirror of 1 m focal length. The XUV generation isoptimized in the range of 80 − 100 eV photon energiesusing neon as generating gas. Typically, gas pressure inthe cell is around 200 mbar. A differential pumping stageis installed at the output of the generation cell chamberin order to reduce the surrounding pressure from 10−2
to 10−5 that is necessary to avoid gas absorption of theXUV radiation and to reach UHV conditions required inthe XPS interaction chamber.The HHG selection is achieved through a pair of multi-layer mirrors (ML) (OptiX fab GmbH, Jena, Germany)based monochromator. This choice, compared to agrating-based monochromator, has been made in orderto avoid the pulse stretching and preserve the nominalduration of the high-order harmonics driven by the 26fs IR pulses. For that purpose, the MLs have beendesigned to present a single peak of reflectivity in thespectral range of interest (∼ 80 - 100 eV) where thecentral energy is a function of the incidence angle.As such, changing the angle of incidence on the MLsallows us to select a single harmonic. In addition, thesecond ML is mounted on a translation stage to keepconstant the output axis for any incident angles (allselected harmonics). These motorizations are remotelycontrolled through a LabVIEW program that adjuststhe two MLs angles of incidence and 2nd ML translationposition. The residual laser radiation is filtered outusing a 110 nm thick Zr film (Luxel Corp.) with atransmission of 0.52 ± 0.06 (measured for H 55, 85.27eV), after the monochromator. The selected harmonicbeam is then focused onto the sample surface in the
UHV interaction chamber using a 1 m grazing incidencegold-coated toroidal mirror. These monochromatizatingand focusing parts of the probe branch are installedin independent vacuum chambers where the pressurereaches 10−7 mbar and 10−8 mbar respectively.The HHG beamline ends with a characterization stage,including a retractable avalanche photodiode and anXUV spectrometer. The latter is composed of an XUVdiffraction grating and a microchannel plate/phosphorscreen detector system that is coupled with a CCDcamera (12 bit). It is located after the interactionchamber in a dedicated vacuum set-up. This final HHGcharacterization is required for the XUV photon fluxdaily optimization that is highly sensitive on the laserbeam characteristics and gas cell parameters.The probe and pump beams are recombined in theso-called interaction chamber where UHV conditionsare reached (10−9 mbar). It is equipped with alltypical instruments required for sample preparation andXPS experiments: a (x,y,z,Θ) manual sample holder,cooling (−70◦C) and annealing (up to 370◦C) samplesystems, an Ar ion sputtering gun for sample surfacecleaning, an electron gun for charge compensationwhen working with low conductivity materials anda classic twin anode Al/Mg X-ray source for samplesurface chemical characterization by XPS (RS40B1 fromPrevac). Finally, XPS and TR-XPS electron spectra arerecorded at an angle of 45◦ (with respect to the laseraxis) with an Electron Energy Analyzer (Thermo VG-Scientific Clam IV) with a 9 channeltrons detection head.
B. HHG beamline characterization
As mentioned above, the highly non-linear HHG mech-anism is sensitive to numerous parameters of the drivinglaser pulse (duration, temporal chirp, spatial profile ofthe focused beam, intensity and focusing configuration)and of the gas cell (interaction length, pressure and gasnature). In addition, photoionization cross sections arelow enough to forbid single pulse acquisition and requirelong accumulation time. For those reasons, the HHGgeneration must be precisely controlled and adjusted inorder to ensure an optimal quality and intensity. It alsorequires a stable monochromatized photon flux and a fo-cusing diameter smaller that the pump spot. Therefore,the beamline optimization has been performed during adedicated experimental commissioning which resulted inthe following technical choices.The precise optimization of the HHG has been made pos-sible mainly through a home-made gas cell design ad-justable in length from 1 to 20 mm. The maximum XUVphoton flux has been obtained in the range of 3 to 12mm length of the cell with a corresponding gas pres-sure around 100 to 200 mbar. The XUV photons fluxstability has been evaluated to be around 8% during 10operating hours. It is mainly driven by: (1) a remotepressure stabilizer; (2) a heat-dissipating adjustable di-aphragm located before the spherical mirror used to con-trol the laser beam focusing conditions (intensity, focal

Aurore 12
FIG. 11. TR-XPS beamline set-up (BS: beamsplitter, HWP: half-wave plate, PC: polarizing cube, C1(2): pump (probe)compressor, SM: spherical mirror, DL: delay line, FL: focusing lens, GC: gas cell, DP: differential pumping, ZF: zirconiumfilter, MC: monochromator, TM: toroidal mirror, EA: electron energy analyzer, S: sample, APD: avalanche photodiode, DG:XUV diffraction grating, MCP: microchannel plate, CCD camera).
spot size and Rayleigh length); (3) pre-drilled cell wallsmade of 200 µm thick brass foils. An upper value of 85×60 µm2 was found for the XUV focal spot diameter onthe sample plane. It has been estimated by imaging theresidual near-IR beam impinging on sample surface. Oneshould underline that this residual beam is also useful todetermine the pump-probe 0 fs delay by imaging the ap-pearance of an interference pattern on the sample surfacewhile both beam are synchronized.
FIG. 12. a) Single harmonic selection with wavelength de-pendence of the absolute reflectivity of the monochromator.b) Spectral bandwidth of the XUV monochromator at 45o
incidence angle and spectral selection of H59.
The spectral selection of one harmonic, illustratedin Fig. 12, is achieved by the ML monochromatordescribed above. The monochromator reflectivity iscentered at an adjustable photon energy depending onthe incidence angle and yields a total measured peakreflectivity ranging from 20% to 32% depending on theselected order of the harmonic. The spectral bandwidthof the XUV monochromator ranges from 2.25 eV to 2.37eV (FWHM), which is larger than the natural spectralwidth of generated high-order harmonics reported inTable 1. Therefore and as we experimentally confirmed,the monochromator only selects a single harmonic(see Fig. 12) with no further monochromatization,ensuring a maximization of the XUV photon flux on
the sample surface. The overall spectral resolutionof HHG beamline is thus given by the high-order har-monic bandwidth ranging from 0.91 to 1.23 eV (FWHM).
The XUV photon flux impinging on the sample surfacehas been optimized by a precise adjustment of the abovementioned parameters. It has been measured using acalibrated APD photodiode72 (XUV-100 from OSI Op-toelectronics) located at the interaction chamber exit fora selected photon energy range from H51 to H61. TheXUV photon flux NXUV ranges from 0.21 to 2.59x10⁷
photons/s at 1 kHz repetition rate. The correspondingvalues for each harmonic are reported in Table III.
Harmonic Central energy NXUV Bandwidthorder eV 107 photons/s eV (FWHM)
51 79.00 1.20±0.30 0.91±0.1753 82.15 2.05±0.30 0.94±0.1855 85.27 2.59±0.26 1.13±0.2257 88.40 1.95±0.24 1.20±0.2559 91.69 0.76±0.22 1.23±0.2661 94.50 0.21±0.20 1.17±0.26
TABLE III. Characteristics of XUV beamline after spectralselection of a single generated harmonic at the sample loca-tion.
C. Example of results: space charge effect in TR-XPSexperiments
In order to illustrate the beamline capabilities, wepresent the measurements of probe XPS spectra (Fig.13) recorded on two different samples: 1 mm thick Auand Cu polished (roughness <0.01µm) commercial sin-gle crystals with a (111) surface orientation (Mateck),and pump/probe (Fig. 14) XPS spectra recorded on theAu sample. This preliminary experimental campaign hasbeen performed to test the new designed HHG beamlineperformance and to investigate the expected so-calledspace charge effect73–75 occurring in pulsed XPS experi-ments.

Aurore 13
The samples were cleaned applying a procedure of con-secutive sputtering and annealing cycles. Their respec-tive PES spectra were recorded in the valence band en-ergy range corresponding to 5d/6s and 3d/4s bands ofAu and Cu samples respectively. Using a 20 eV pass en-ergy on the electron analyzer and the H53 (82.15 eV), theoverall spectral resolution is estimated to be around 1.54eV (FWHM). The resulting spectra, reported in Fig. 13have been acquired in 7 minutes each.
FIG. 13. Probe measurements: PES spectra from (a) Au and(b) Cu single crystals recorded using the harmonic H53.
In TR-XPS experiments, the space charge effect re-sults from the electrons generated by the high intensitypump pulse. The high density electron cloud ejected bythe pump pulse influences the central peak energy andthe structure of the probe electron spectrum (i.e. the va-lence band in our case) via Coulomb interactions whiletraveling in vacuum towards the detector. This inherentdrawback of TR-XPS experiments has thus been exten-sively studied in various contributions76–78 aiming at itsminimization/suppression. It can also be addressed usingthe presented instrument.
In Fig. 14, we present a set of measurements of theAu XPS spectra recorded at different pump/probe de-lays illustrating the space charge-induced modificationstriggered by the pump near-IR laser pulse. At negativedelay, photoelectron emitted by the XUV pulse are en-ergy shifted by the IR- pulse. As clearly evidenced here,the delay-dependent changes with a maximum at zerodelay time not only shifts the Au valence band spectrumbut also induces an important broadening and distortionof the initial energy distribution of photoelectron. It isof prime importance to reduce this effect in order to dis-entangle this artifact from the investigated physical phe-nomenon such as an ultrafast phase transition. This partof the study is under development and will be the subjectof a future dedicated publication.
VI. BEAMLINE 4: TIME-RESOLVEDPHOTO-LUMINESCENCE SPECTROSCOPY
The AURORE beamline 4 is dedicated to lumi-nescence measurements in condensed matter. Theluminescence of dielectrics, wide gap semi-conductorscrystals and nano-particles solids is studied to obtainnew information on the dynamics of excitons and
FIG. 14. Pump-Probe measurements: PES spectra from Ausingle crystal as a function of the pump/probe delay. A ver-tical shift is applied for clarity reasons. Pump: τ = 1 ps,F= 655 J/m2, Polar P and Θ=45o. Probe: Harmonic H53(82.15 eV), τ = 26 fs. As a reference, the probe-only spec-trum (unpumped sample) is reported in blue. The dashedlines indicate the 5d doublet peak positions of the unpumpedsample. The delay 0 ps corresponds to the time overlap ofpump and probe pulses while the negative delays are relatedto sample probing before the pump pulse irradiation.
electron relaxation. Depending on different experi-mental parameters (temperature, excitation energy,excitation density,...), the luminescence emissions arespectrally and temporally resolved in order to revealthe fundamental processes which govern the energyrelaxation in solids. The experimental studies on con-densed matter need photons pulses in the VUV domain(wavelength selection of a single harmonic) and theIR-UV range (up to 6.2 eV). As it is shown on figure15, this beamline is well adapted for these measurements.
A. Experimental set-up: general description
This beamline and the experimental set-up areschematized in Fig. 15. The 800 nm, 26 fs, 1 kHz laserbeam ( < 9 mJ/pulse) can be split and used to generatehigh-order harmonics pulses and/or first harmonics (400nm, 266 nm, 200 nm). High-order harmonic generation(HHG) is performed by the interaction of focused 800nm laser pulses with a rare gas in an interaction cell(GC). The output VUV and laser beams are steered into

Aurore 14
a VUV monochromator without entrance slit. A planemirror (DM) removes the zero order of the grating outof the beam line by adjusting its translation positionin function of the incident angle. The combinationof a plane XUV grating (DG) (470 lines/mm) and atoroidal gold mirror (TM) allows to focus and selectthrough an exit slit (ES) one single VUV harmonic. Thewavelength selected VUV radiation is then focused in theexperimental chamber by a second toroidal gold mirror(TM). In these conditions, depending on the nature ofthe generating gas, the available VUV radiation coversthe spectral range from 10 nm (H79) to 73 nm (H11).On the sample, the VUV beam size is around 250 µmwith 104-105 photons/pulse in one harmonic at 35 nm(H23 in argon). Due to the temporal stretching of thethe monochromator (pulse-front tilt induced by thediffraction grating), the VUV pulse duration on thesample increases to reach 500-600 fs. The sample isplaced in the vacuum chamber (10−8 mbar) where it canbe translated in the x, y, and z directions and cooledfrom room temperature to around 13 K by a liquid he-lium cryostat. When using the fundamental, the second,third or fourth harmonics of the laser pulses to excitethe sample, the beam is directly transported to theexperimental chamber via a table top set-up with BBOcrystals able to generate the frequency up-conversion toHG-2,3,4. Two MgF2 prisms select the wavelength. TheIR-UV beam can be focused on the sample by a lensmounted on a translation stage to monitor the spot size(Z-scan measurements). The photo-luminescence (PL) iscollected by a lens and steered to a spectrometer throughan optical fiber. The time-integrated PL spectrum ismeasured with a spectrometer (TRIAX Jobin-Yvon190) equipped with 3 gratings (1200 lines/mm and 300lines/mm high and low range) and a charged-coupledevice (ANDOR iCCD) camera. This spectrometer canalso be used as monochromator with a photomultiplier(MCP-Hamamatsu R3809U-58) working in the photon-counting mode to record the PL kinetics decay with50 ps time resolution (FWHM). In order to access toshorter time resolution, in the sub-ps range, a set-upof frequency mixing (FM) between the luminescenceemission and the 800 nm laser pulse has been developedwith time resolution down to 400 fs.
B. Example of results
We performed experiments on ZnO crystal sample aspresented in Fig. 16. Numerous studies have been inves-tigating about this wide band gap semi-conductor andcontroversial results still remain, particularly about thedynamics properties of the DX bounded exciton. In fig-ure 16, the radiative decay of the DX exciton lumines-cence measured at 369 nm wavelength emission are shownat 14 K for three excitation wavelengths. In red color,the crystal was excited by 26 fs pulses of 800 nm pho-tons (focused beam with 2 µJ/pulse) leading to three-photons absorption process to promote an electron fromthe top of the valence band to the conduction band. In
blue color, the excitation photon energy is 4.7 eV (thirdharmonic of 800 nm, 2 mm spot size diameter with 5nJ/pulse) and in green color, the ZnO crystal excitationis triggered by VUV pulses at 48 eV (H31, ∼ 104 pho-tons/pulse). Excitation by UV and VUV photons leadsto a direct transition (one absorption photon) from va-lence band to conduction band. These PL transients oc-cur with very different decay times (τl) through whichinformation about the DX formation primary processesand dynamics depending on its environment can be ob-tained.It is also well known that density of excitations controlsthe process of energy transfer, localization of excitations,scintillation yield and decay, storage of energy, etc. Athigh excitation densities, above 1017 cm−3, one usuallyobserves effects of interaction between electronic excita-tions and could result not only in quenching of emissioncenters (excitons), but also can stimulate different pro-cesses of creation of new excited states with super-lineardependence of excitation density.Time-resolved luminescence Z-scan technique (transla-tion of the focusing lens along the axis of the laser beam)gives the opportunity to obtain consistent data for de-pendence of the luminescence yield, spectrum and decaykinetics on excitation density. Figure 17 shows the varia-tion of the excitonic luminescence of CsPbCl3 crystal at200 K excited by 266 nm photons (50 nJ/pulse) duringthe Z-scan. ” The insert gives the maximal density ofexcitations obtained at different lens positions. The cal-culations of the created excitations density at differentlens positions can be found in reference79.
VII. BEAMLINE 5: PHOTOCHEMISTRYSPECTROSCOPY ON SMALL QUANTUM SYSTEMS
The Aurore beamline 5 is dedicated to investiga-tion of relaxation dynamics in small quantum systems:molecules and nano-particles. The long-term stabilityof the laser pointing and intensity of Aurore allow torecord static80 or time-resolved photoelectron8,43,81–84 orion imaging85–87 for more than 12 hours without any re-alignment.
A. Experimental set-up
The experimental set-up consists of a molecular beamchamber, coupled to a velocity-map imaging (VMI) spec-trometer by a long-neck or short-neck skimmer with di-ameters of 0.7 to 1.5 mm. One particularity of this set-upis the pumping capacity of 3200 l/s, that allows to usedifferent molecular beams depending on the sample:
• a 1-kHz pulsed Even-Lavie valve88, synchronizedwith optical pulses from the Aurore laser. Themolecules of interest can be inserted close to thenozzle in a large cartridge container and the tem-perature can reach up to 250◦C. The typical con-sumption for this valve when running at 1 kHz rep-etition rate, is ∼ 3 mL/day. The 350 mm3 cartridge

Aurore 15
FIG. 15. AURORE VUV-beamline 4 and luminescence experimental set-up: FL focusing lens, GC: gas cell, TM: toroidal mirror,DG: diffraction grating, DM: deviation mirror, ES: exit slit, TM: toroidal mirror, FM: frequency mixing set up, HG-2,3,4: 2nd,3rd and 4th harmonic generation set-up.
FIG. 16. Luminescence decay measured at 369 nm wavelengthemission of the DX exciton in ZnO crystal at 14K: Wavelengthexcitation at 800nm (red), 266 nm (blue) and VUV 25.8 nm(green) femtosecond pulses. The characteristic rise times anddecay times are given for each case.
volume is in general large enough to run the exper-iment for two consecutive weeks. The molecularbeam is generally seeded with high pressure helium(above 7 bars), which enables efficient cooling inthe supersonic expansion, leaving the molecules inthe low rotational and vibrational levels of the elec-tronic ground state. Depending on the diameterand shape of the nozzle (trumpet/conical), Van derWaals complexes can be also formed in the expan-sion, in particular when N2 or Ar argon are used asseed gas.
• a 100 µm nozzle coupled to a bubbler tank withliquid sample. This creates an effusive molecularbeam. In the example shown further, the liquidsamples were made of NHS or NHS-C-Dots withtypical concentration of 5g/L and 5.8g/L, respec-tively. There is no heating element in this contin-uous molecular source, which is running using N2
as seeding gas at a typical pressure of 600 mbar.This allows for aerosolisation without decomposi-tion. As there is no drying stage in the system, the
FIG. 17. Variation of the excitonic luminescence of CsPbCl3crystal excited by 266 nm photons (50 nJ/pulse) during Z-scan. Insert: dependence of the maximal density of excita-tions near the surface at the spot center.
bubbler creates a wet aerosol of the aqueous sampleand the carrier gas.
• the set-up of an aerodynamical lens is currently un-der construction. This system will provide a colli-mated jet of nano-particles as the ones routinelyused in synchrotron facilities89,90.
• a simple oven that can be heated up to ∼500◦Cwith a set of different nozzle diameters.
The nozzle-skimmer distance can be varied with a mini-mum distance nozzle-to-VMI center of 120 mm.From the optical point of view, tunable pump or probepulses can be produced from 750 nm down to 200 nm in athree-stages NOPA. The other probe/pump pulse is sim-ply one of the harmonics (first to fourth) of 800 nm Au-rore laser beam. Note that the polarization states of thepump and probe pulses can be fully controlled (variableS3 Stokes parameter) over the whole UV-IR bandwidthand fully characterized by polarimetry. This is crucialfor time-resolved circular dichroism experiments8,43.Following photoionization, the ionic fragments or photo-electrons are extracted in a direction perpendicular to theplane defined by the laser and the molecular beam, and
Aurore 16
detected at the end of a 40 cm time-of-flight (TOF) tubeusing an imaging detector (7 cm in diameter) consistingof two micro-channel plates (MCP) coupled to a phos-phor screen and a CMOS camera. The electrostatic lensis magnetically protected by a Mu-metal tube. To obtainsufficient mass resolution, while retaining a short TOF toavoid dissociation during the flight time and as well toimprove the detection efficiency on the MCP, a 4 kV volt-age is applied to the repeller plate of the VMI. The pre-amplified signal (factor 200) extracted directly from thephosphor screen by a 100 pF capacitor is recorded to cap-ture the TOF mass spectrum of the species produced byphotoionization. To illustrate the potential of this beam-line, we will present two experiments: mass-spectrometryof complex systems as carbon dots (C-Dots) as well asfemtosecond pump-probe spectroscopy of CH3I predisso-ciation by REMPI- velocity map ion imaging.
B. Example of mass Spectroscopy of Carbon Nanodotsand their Building Block N-hydroxysuccinimide (NHS)
The characterization of the surface ligands of carbonnanodots is of outmost importance for the understand-ing of the photo-luminescence of C-Dots. We there-fore used ultraviolet (UV) and infrared (IR) fs laserpulses to induce photoionization and detachment in free-standing NHS- C-Dots91. The obtained photofragmentmass spectra were compared to the fragmentation of NHS(C4H5NO3, 115 amu) aqueous solution at the same exci-tation energies. These NHS give us important referencedata for the study of C-Dots and allows us to disentan-gle purely molecular processes from solvated or quantumdot induced processes. More specifically, one-color fem-tosecond multiphoton ionization was carried out at 270nm (4.6 eV) and 800 nm (1.55 eV) wavelengths for thefree-standing C-Dots and NHS (starting from the aque-ous solution). A NIR fs laser multiphoton ionization canbe in general compared to a very soft electron ionization,while UV-fs laser radiation favors fragmentation beforemultiphoton ionization. The UV fs-induced ionization isknown to provide useful structural information on largemolecular systems due to the saturation of the ionizationrate that provides an equal efficiency for the differentcompounds.92
The third-harmonic pulse (THG) at 270 nm with a typi-cal bandwidth of 2 nm-33 meV (Fourier limited durationof 55 fs but measured at 90 fs) is used for multiphotonionization at intensities around 1013 W/cm2 (30 µJ/pulsefocused by a 250 mm thin lens). The fundamental pulseat 800 nm has a typical pulse duration of 26 fs and is fo-cused with a 300 mm thin lens to reach intensities around1014 W/cm2 (140 µJ/pulse). In the fs regime, these IRand UV intensities allow us to reach the saturation ofionization.92 The polarization of the UV and IR pulseswere linear and set parallel to the detector plane.Each mass spectrum shown here was recorded over 104
laser pulses by a 4 GHz oscilloscope. The mass calibra-tion was done with xenon.The femtosecond photoionization mass spectrum at 800nm shown in Fig.18 displays a moderate degree of frag-mentation compared to the one recorded at 270 nm exci-
tation wavelength. The 18 amu photoionization of water(IP=12.62 eV-NIST value) is significant, implying thatthe 13 eV range is energetically reached with NIR. The18 amu peak is stronger at 270 nm due to Rydberg res-onances encountered around 9 eV in water. This peakwas even saturating the detector for NHS-water sample.We stress the fact that ionized C-Dots are too heavy to flythe 40 cm TOF and only its ligands or fragments can bedetected with the heaviest masses observed (not shownhere) at 130, 145 and 149 amu. In both samples, proto-nated NHS at 116 amu is revealed by the soft ionizationat 800 nm. At 270 nm multiphoton ionization, the NHSpeak with or without a hydrogen loss is more importantin the C-Dots sample compared to the NHS bare ones.At 800 nm excitation wavelength the dominant peak ofthe mass spectra is the 58 amu that is not seen in the bareNHS ionization89. It corresponds to a [ONCO]+ radicalfragment of NHS. The fragment [C2H3NOH]+ would alsogive a signal at 58 amu, but its formation requires bothproton transfer and cleavage of the CO or NO bonds,which is considered less likely. The relative intensity ofthe [ONCO]+ fragment is higher in C-dots than in NHS-water sample, which may be an indication of the ringopening during the synthesis of the C-dots. In a waterenvironment, once the NHS chromophore photodissoci-ates, the solvation is in play to form more stable specieswith paired electrons. As seen on Fig. 18, such efficientrearrangement are involved to produce the strong signalsat 76 and 94 amu corresponding to [ONCO(H2O)n=1,2]+.This same progression is also observed upon ionization at270 nm, but with a double peak structure correspondingto one proton mass difference between the peaks. Thesepeaks are greatly enhanced using 270-nm ionization, es-pecially in the C-Dots sample. Finally, the main peakthat appears on all mass spectra is at 43 amu, whichcan be an acetyl group (CH3CO), formed after a protontransfer within a pristine NHS molecule, or CNOH, withhydroxyl group bound either in N or C, which requires aproton transfer as well. Such strong rearrangement pro-cesses can easily be at play during the dissociation thatfollows ionization. This type of rearrangement explainsas well the presence of methyl (peak at 15 amu) or eitherthe proton progressions built on 29 amu (COH) and 28amu (C2H2). It is quite surprising to not detect largercarbon species in the C-Dots sample as expected fromthe graphitic planes observed on the TEM images89. Wediscard the possibility that our carrier gas transportationfrom the bubbler to the nozzle is not efficient enough toprovide a significant proportion of C-Dots in the laserinteraction zone. Indeed, with similar pressure and dis-tances, we have been able to record photoelectron spectrafrom the same C-Dots sample in the soft X-ray regime89.This absence of large carbon fragments and the weak pro-portion of C3X is certainly due to the large proportion ofsurface ligands as well as water solvation that both pre-vent fragmentation of the carbon core of the C-Dots asconcluded by depth profiling using X-ray PhotoelectronSpectroscopy (XPS)89.As a conclusion, whatever the ionization regime, the massspectra obtained from the two samples are quite simi-lar at lower mass (<58 amu). However, for the highermasses, the strong differences as a function of the ioniza-
Aurore 17
tion regime (UV or IR) allows to appreciate the signifi-cant solvation and clusterization that can easily proceedfrom NHS core. The similarities between the initiallyaqueous samples, NHS/C-Dots and NHS, indicate thattheir surfaces- from where the fragments originate- arerather similar. An especially important observation is thepresence of the protonated parent ion in both samples,suggesting that the graphitic core is effectively coveredwith NHS molecules, i.e. the free-standing NHS-C-Dotsaerosol prepared from aqueous solution does not seem tocontain only parts or fragments of NHS molecule, but thebare molecules as well. However, we have to emphasizethat this method studies the whole aerosol produced bybubbling nitrogen gas through aqueous solution with aNHS molecule also present in the solution itself. Thusthe signal does not come from only solvated C-Dots, butrather from a mixture of solvated NHS molecules andC-Dots. The conclusion of the NHS-C-Dots surface com-position remains preliminary, requiring similar study ofdry C-Dots.
C. Balance in energy of the predissociation of CH3I: aREMPI Probe
The ideal way to investigate a fast molecular dissocia-tion process is to measure the appearance of the momentaof fragments relative to the center of mass of the parent,for each internal energy of each fragment. Generally, thedecisive step is to get an appropriate resonant enhancedmultiphoton ionisation (REMPI) pathway. Quite often,the vibrational levels of light molecular fragments areseparated enough to enable selective photoionization bya UV probe pulse, even if it is ultrashort and thus pos-sess a broad bandwidth. Figure 19(a) illustrates this forthe REMPI-umbrella mode spectra of the CH3 radicalthrough the 3p2
zA”2 state. A selective photoionization ofthe fragment as a function of its internal energy basedon these resonances can then be done in the femtosecondregime. It is also worth noting that a 200 cm−1 (25 meV)probe bandwidth is sufficiently broad to overlap the en-tire Q rotational branch within each umbrella band, andthat the 75 fs probe pulse duration is short enough tocompete efficiently with the predissociation of the inter-mediate 3p2
zA”2 state Rydberg state into CH2 + H. Thefs-REMPI of the fragments provides valuable insight intothe predissociation. As a proof-of-concept case study, wehave studied the predissociation of the vibrationless levelof the B-6s[2] state by using time-resolved photoion ve-locity map imaging86. The energy diagram of this predis-sociation as well as the different UV probe wavelengthsrequired to state-selectively ionized CH3 produced in sev-eral quanta in the umbrella mode are shown in figure19(b).The UV tunability required for the probe pulse is ob-tained by frequency mixing the NOPA output (com-pressed pulses with 25 µJ of energy tunable between 510and 700 nm), with the 800 nm fundamental beam toproduce 7 µJ/pulse in the UV range. This UV resonantprobe is focused on the molecular beam with a 200 mmfused silica lens, leading to an intensity of < 5× 10⁻¹¹
W/cm2. The vibrational branching fractions of the CH3
are recovered for each pump-probe delay by fitting the ki-netic energy distribution recorded by using nonresonant(403 nm probe wavelength) multiphoton ionization of ei-ther the I or the CH3 photofragment with the individualvibrationally state-selected CH3 distributions. Fig 19(d)illustrates the quality of the fit for a 8 ps pump-probedelay when the predissociation dynamics is terminated.The fs-REMPI allows a direct visualization of the com-plete evolution at the femtosecond scale of photodissoci-ation in small molecular systems.
VIII. CONCLUSION
In conclusion, the Aurore facility offers a wide rangeof scientific opportunities ranging from picosecond tofemtosecond solid state dynamics, down to attosecondtimescale in dilute matter. As most of the experimentsperformed are extremely demanding, the stability andreliability of the laser source is of crucial importance.This is achieved primarily by the careful characterisa-tion of the laser parameters online and a continuousimprovement process taking advantage of the lasttechnological developments and the users feedback.In this sense the platform is working as other lightsources like synchrotrons, where machines, beamlinesand experiments are designed and operated by dedicatedspecialized persons. As future improvement, the nextstep will be the implementation of an adaptive mirror,coupled with a Shack-Hartmann sensor, to enhance thewavefront quality of the Aurore laser beam.
DATA AVAILABILITY STATEMENTThe data that supports the findings of this study areeither available within the article or available from thecorresponding author upon reasonable request.
ACKNOWLEDGMENTS
All the authors are grateful to the ANR (CASTORSproject ANR-13-JS04-0002, HarMoDyn project ANR-08-JCJC-0029, MISFITS project ANR-14-CE32-0014,through the Program IdEx Bordeaux - LAPHIA (ANR-10-IDEX-03-02) and the Cluster of Excellence in PlasmasPhysics in Paris, PLAS@PAR, (ANR-11-IDEX-0004-02)and the Region Nouvelle Aquitaine (20091304003 ATTO-MOL and 2.1.3-09010502 COLA2 projects) for financialsupports. Experiment on C-Dots has also received fund-ing from the European Union’s Horizon 2020 researchand innovation programme under grant agreement no654148 Laserlab-Europe. S.B. acknowledges the NaturalSciences and Engineering Research Council of CanadaVanier Scholarship. M. de A.V. thanks the MexicanCouncil for Science and Technology (Grant 611509).
1G. F. Albrecht, J. M. Eggleston, and J. J. Ewing, Optics Com-munications 52, 401 (1985).
2P. Lacovara, L. Esterowitz, and R. Allen, Optics Letters 10, 273(1985).
3P. F. Moulton, JOSA B 3, 125 (1986).4D. Strickland and G. Mourou, Optics Communications 55, 447(1985).

Aurore 18
FIG. 18. Mass spectrum measured on C-Dots and NHS initiated by multiphoton ionization at 270 nm excitation wavelength(lower graphs) and at 800 nm excitation wavelength (upper graphs)
5G. Steinmeyer, D. H. Sutter, L. Gallmann, N. Matuschek, andU. Keller, Science 286, 1507 (1999).
6N. Fedorov, G. Geoffroy, G. Duchateau, L. Stolcova, J. Proska,F. Novotny, M. Domonkos, H. Jouin, P. Martin, and M. Ray-naud, J. Phys.: Condens. Matter 28, 315301 (2016).
7C. Fourment, F. Deneuville, D. Descamps, F. Dorchies, S. Petit,O. Peyrusse, B. Holst, and V. Recoules, Phys. Rev. B 89, 161110(2014).
8A. Comby, S. Beaulieu, M. Boggio-Pasqua, D. Descamps,F. Legare, L. Nahon, S. Petit, B. Pons, B. Fabre,Y. Mairesse, and V. Blanchet, The Journal of Phys-ical Chemistry Letters 7, 4514 (2016), pMID: 27786493,https://doi.org/10.1021/acs.jpclett.6b02065.
9S. Beaulieu, A. Comby, A. Clergerie, J. Caillat, D. Descamps,N. Dudovich, B. Fabre, R. Geneaux, F. Legare,S. Petit, B. Pons, G. Porat, T. Ruchon, R. Taıeb,V. Blanchet, and Y. Mairesse, Science 358, 1288 (2017),http://science.sciencemag.org/content/358/6368/1288.full.pdf.
10G. Cheriaux, P. Rousseau, F. Salin, J. P. Chambaret, B. Walker,and L. F. Dimauro, Opt. Lett. 21, 414 (1996).
11C. G. Durfee, S. Backus, M. M. Murnane, and H. C. Kapteyn,IEEE Journal of Selected Topics in Quantum Electronics 4, 395(1998).
12E. B. Treacy, IEEE J. Quantum Electronics 5, 454 (1969).13S. Kane and J. Squier, J. Opt. Soc. Am. B 14, 1237 (1997).14C. Hooker, Y. Tang, O. Chekhlov, J. Collier, E. Divall, K. Ertel,
S. Hawkes, B. Parry, and P. P. Rajeev, Opt. Express 19, 2193(2011).
15Z. Li, S. Tokita, S. Matsuo, K. Sueda, T. Kurita, T. Kawasima,and N. Miyanaga, Opt. Express 25, 21201 (2017).
16A. McPherson, G. Gibson, H. Jara, U. Johann, T. S. Luk,I. McIntyre, K. Boyer, and C. K. Rhodes, J. Opt. Soc. Am.B 4, 595 (1987).
17M. Ferray, A. L’Huillier, X. F. Li, L. A. Lompre, G. Mainfray,and C. Manus, Journal of Physics B: Atomic, Molecular and Op-tical Physics 21, L31 (1988).
18L. Le Deroff, P. Salieres, B. Carre, D. Joyeux, and D. Phalippou,Physical Review A 61, 043802 (2000).
19J.-F. Hergott, M. Kovacev, H. Merdji, C. Hubert, Y. Mairesse,E. Jean, P. Breger, P. Agostini, B. Carre, and P. Salieres, Phys-
ical Review A 66, 021801 (2002).20E. Takahashi, Y. Nabekawa, and K. Midorikawa, Opt. Lett. 27,
1920 (2002).21S. Hadrich, A. Klenke, J. Rothhardt, M. Krebs, A. Hoffmann,
O. Pronin, V. Pervak, J. Limpert, and A. Tunnermann, NaturePhotonics 8, 779 (2014).
22A. Comby, D. Descamps, S. Beauvarlet, A. Gonzalez,F. Guichard, S. Petit, Y. Zaouter, and Y. Mairesse, Opt. Express27, 20383 (2019).
23Y. Mairesse, O. Gobert, P. Breger, H. Merdji, P. Meynadier,P. Monchicourt, M. Perdrix, P. Salieres, and B. Carre, PhysicalReview Letters 94 (2005), 10.1103/PhysRevLett.94.173903.
24T. Sekikawa, T. Kanai, and S. Watanabe, Phys. Rev. Lett. 91,103902 (2003).
25P. M. Paul, E. S. Toma, P. Breger, G. Mullot, P. Balcou, H. G.Muller, and P. Agostini, Science 292, 1689 (2001).
26M. Hentschel, R. Kienberger, C. Spielmann, G. A. Reider,N. Milosevic, T. Brabec, P. Corkum, U. Heinzmann, M. Drescher,and F. Krausz, Nature 414, 509 (2001).
27F. Krausz and M. Ivanov, Reviews of Modern Physics 81, 163(2009).
28J. Bourgalais, N. Carrasco, L. Vettier, T. Gautier, V. Blanchet,S. Petit, D. Descamps, N. Fedorov, R. Delos, and J. Gaudin,10, 10009.
29M. Lein, N. Hay, R. Velotta, J. Marangos, and P. Knight, Phys-ical Review A 66, 023805 (2002).
30J. Itatani, J. Levesque, D. Zeidler, H. Niikura, H. Pepin, J. Ki-effer, P. Corkum, and D. Villeneuve, Nature 432, 867 (2004).
31S. Bohman, A. Suda, T. Kanai, S. Yamaguchi, and K. Mi-dorikawa, Opt. Lett. 35, 1887 (2010).
32V. Cardin, N. Thir, S. Beaulieu, V. Wanie, F. Lgar, andB. E. Schmidt, Applied Physics Letters 107, 181101 (2015),https://doi.org/10.1063/1.4934861.
33A. Ferre, A. E. Boguslavskiy, M. Dagan, V. Blanchet, B. D.Bruner, F. Burgy, A. Camper, D. Descamps, B. Fabre, N. Fe-dorov, J. Gaudin, G. Geoffroy, J. Mikosch, S. Patchkovskii,S. Petit, T. Ruchon, H. Soifer, D. Staedter, I. Wilkinson,A. Stolow, N. Dudovich, and Y. Mairesse, Nat. Commun. 6(2015), 10.1038/ncomms6952.
34A. Ferre, C. Handschin, M. Dumergue, F. Burgy, A. Comby,

Aurore 19
FIG. 19. CH3I predissociation from the origin band of the first Rydberg state. (a) Energy diagram of the CH3I predissociation.(b) The wavelength tunability of the NOPA allows to selectively photoionize the fragments CH3 as a function of its umbrellamode activity by a 2+1 REMPI93. The umbrella quantum (∼75 meV) is large enough to support a selective ionisation along thisvibrational mode, while the 25 meV bandwidth of the probe pulse is large enough to ionize all the rotational levels populatedby the predissociation.(c) Image of iodine, CH3 recorded off resonance, independently of their vibration and rotation and CH3
(v=0) produced by the predissociation and resonantly ionised at 333.5 nm through the 3p2zA”2 state. Since the dipole moment
of this electronic transition is perpendicular to the C-I bond and the predissociation in the picosecond range, the fragments aremainly produced perpendicular to the pump polarisation. (d) CH3 kinetic energy distribution recorded off resonance (scatterplot recorded 403 nm probe wavelength) and CH3 kinetic energy distribution recorded through 2+1 resonance by tuning theprobe wavelength along the REMPI spectra shown in (a), the internal energy distribution of CH3 fragments can be retrievedalong the predissociation dynamics. Here are shown the distributions at a pump-probe delay of 8 ps, once all the dynamics isfinished.

Aurore 20
D. Descamps, B. Fabre, G. A. Garcia, R. Geneaux, L. Merceron,E. Mevel, L. Nahon, S. Petit, B. Pons, D. Staedter, S. Weber,T. Ruchon, V. Blanchet, and Y. Mairesse, Nat. Photon. 9, 93(2015).
35A. Camper, A. Ferre, V. Blanchet, F. Burgy, D. Descamps, S. Pe-tit, T. Ruchon, and Y. Mairesse, Opt. Lett. 40, 5387 (2015).
36H. Ruf, C. Handschin, R. Cireasa, N. Thire, A. Ferre, S. Petit,D. Descamps, E. Mevel, E. Constant, V. Blanchet, B. Fabre, andY. Mairesse, Physical Review Letters 110, 083902 (2013).
37R. Cireasa, A. E. Boguslavskiy, B. Pons, M. C. H. Wong,D. Descamps, S. Petit, H. Ruf, N. Thire, A. Ferre, J. Suarez,J. Higuet, B. E. Schmidt, A. F. Alharbi, F. Legare, V. Blanchet,B. Fabre, S. Patchkovskii, O. Smirnova, Y. Mairesse, and V. R.Bhardwaj, Nature Physics 11, 654 (2015).
38H. Ruf, C. Handschin, A. Ferre, N. Thire, J. B. Bertrand, L. Bon-net, R. Cireasa, E. Constant, P. B. Corkum, D. Descamps,B. Fabre, P. Larregaray, E. Mevel, S. Petit, B. Pons, D. Staedter,H. J. Worner, D. M. Villeneuve, Y. Mairesse, P. Halvick, andV. Blanchet, Journal of Chemical Physics 137 (2012).
39S. Beaulieu, E. Bloch, L. Barreau, A. Comby, D. Descamps,R. Geneaux, F. Legare, S. Petit, and Y. Mairesse, Phys. Rev. A95, 041401 (2017).
40P. Carcabal, D. Descamps, S. Petit, Y. Mairesse, V. Blanchet,and R. Cireasa, Faraday Discuss. (2016), 10.1039/C6FD00129G.
41F. Catoire, A. Ferre, O. Hort, A. Dubrouil, L. Quintard,D. Descamps, S. Petit, F. Burgy, E. Mevel, Y. Mairesse, andE. Constant, Physical Review A 94 (2016).
42S. Beaulieu, A. Ferre, R. Geneaux, R. Canonge, D. Descamps,B. Fabre, N. Fedorov, F. Legare, S. Petit, T. Ruchon,V. Blanchet, Y. Mairesse, and B. Pons, New Journal of Physics18 (2016).
43S. Beaulieu, A. Comby, A. Clergerie, J. Caillat, D. Descamps,N. Dudovich, B. Fabre, R. Geneaux, F. Legare, S. Petit, B. Pons,G. Porat, T. Ruchon, R. Taıeb, V. Blanchet, and Y. Mairesse,Science 358, 1288 (2017).
44F. Ferrari, F. Calegari, M. Lucchini, C. Vozzi, S. Stagira, G. San-sone, and M. Nisoli, Nature Photonics 4, 875 (2010).
45E. Goulielmakis, M. Schultze, M. Hofstetter, V. Yakovlev,J. Gagnon, M. Uiberacker, A. Aquila, E. Gullikson, D. Attwood,R. Kienberger, F. Krausz, and U. Kleineberg, Science 320, 1614(2008).
46G. Sansone, E. Benedetti, F. Calegari, C. Vozzi, L. Avaldi,R. Flammini, L. Poletto, P. Villoresi, C. Altucci, R. Velotta,S. Stagira, S. De Silvestri, and M. Nisoli, Science 314, 443(2006).
47H. Mashiko, S. Gilbertson, C. Li, S. Khan, M. Shakya, E. Moon,and Z. Chang, Physical Review Letters 100, 103906 (2008).
48H. Vincenti and F. Quere, Phys. Rev. Lett. 108, 113904 (2012).49T. J. Hammond, G. G. Brown, K. T. Kim, D. M. Villeneuve,
and P. B. Corkum, Nature Photonics 10, 171 (2016).50S. Beaulieu, S. Camp, D. Descamps, A. Comby, V. Wanie, S. Pe-
tit, F. Legare, K. J. Schafer, M. B. Gaarde, F. Catoire, andY. Mairesse, Physical Review Letters 117 (2016).
51K. T. Kim, C. Zhang, T. Ruchon, J.-F. Hergott, T. Auguste,D. M. Villeneuve, P. B. Corkum, and F. Quere, Nature Photonics7, 651 (2013).
52K. Bennemann, Annalen der Physik 18, 480 (2009).53C. Fourment, B. Chimier, F. Deneuville, D. Descamps,
F. Dorchies, G. Duchateau, M.-C. Nadeau, and S. Petit, Phys.Rev. B 98, 155110 (2018).
54J. P. Colombier, P. Combis, F. Bonneau, R. Le Harzic, andE. Audouard, Phys. Rev. B 71, 165406 (2005).
55C. Froehly, A. Lacourt, and J. C. Vienot, OJ. Opt. (Paris) 4,183 (1973).
56J. P. Geindre, P. Audebert, A. Rousse, F. Fallies, J. C. Gauthier,A. Mysyrowicz, A. D. Santos, and G. Hamoniaux, Opt. Lett.19, 1997 (1994).
57F. Deneuville, B. Chimier, D. Descamps, F. Dorchies, S. Hulin,S. Petit, O. Peyrusse, J. J. Santos, and C. Fourment, AppliedPhysics Letters 102, 194104 (2013).
58P. Noe, C. Vallee, F. Hippert, F. Fillot, and J.-Y. Raty, Semi-conductor Science and Technology 33, 013002 (2018).
59L. Waldecker, T. A. Miller, M. Rude, R. Bertoni, J. Osmond,V. Pruneri, R. E. Simpson, R. Ernstorfer, and S. Wall, Nature
Materials 14, 991 (2015).60E. Matsubara, S. Okada, T. Ichitsubo, T. Kawaguchi, A. Hirata,
P. F. Guan, K. Tokuda, K. Tanimura, T. Matsunaga, M. W.Chen, and N. Yamada, Phys. Rev. Lett. 117, 135501 (2016).
61Z. Lin, L. V. Zhigilei, and V. Celli, Phys. Rev. B 77, 075133(2008).
62S. Anisimov and B. Rethfeld, inNonresonant Laser-Matter Interaction (NLMI-9), Proceed-ings of SPIE–the International Society for Optical Engineering,Vol. 3093 (Proceedings of SPIE, 1997) p. 192.
63Y. V. Petrov, K. P. Migdal, N. A. Inogamov, and V. V.Zhakhovsky, Applied Physics B 119, 401 (2015).
64J. Winter, S. Rapp, M. Schmidt, and H. P. Huber, AppliedSurface Science 417, 2 (2017), 10th International Conference onPhotoexcited Processes and Applications.
65M. Kandyla, T. Shih, and E. Mazur, Phys. Rev. B 75, 214107(2007).
66R. Li, K. Sundqvist, J. Chen, H. E. Elsayed-Ali, J. Zhang,and P. M. Rentzepis, Structural Dynamics 5, 044501 (2018),https://doi.org/10.1063/1.5029970.
67M. Z. Mo, Z. Chen, R. K. Li, M. Dunning, B. B. L.Witte, J. K. Baldwin, L. B. Fletcher, J. B. Kim, A. Ng,R. Redmer, A. H. Reid, P. Shekhar, X. Z. Shen, M. Shen,K. Sokolowski-Tinten, Y. Y. Tsui, Y. Q. Wang, Q. Zheng,X. J. Wang, and S. H. Glenzer, Science 360, 1451 (2018),http://science.sciencemag.org/content/360/6396/1451.full.pdf.
68E. Bevillon, J. P. Colombier, V. Recoules, and R. Stoian, Phys.Rev. B 89, 115117 (2014).
69C. A. Mack, Kinetic coefficients for d-band metals in two-temperature states created by femtosecond laser irradiation(Springer, London, 2013).
70S. Hofmann, Auger- and X-Ray Photoelectron Spectroscopy in Materials Science(Springer, London, 2013).
71M. Aeschlimann, C. A. Schmuttenmaer, H. E. ElsayedAli,R. J. D. Miller, J. Cao, Y. Gao, and D. A. Man-tell, The Journal of Chemical Physics 102, 8606 (1995),https://doi.org/10.1063/1.468962.
72The photodiode was calibrated at the Physikalisch-TechnischeBundesanstalt (PTB) using synchrotron radiation..
73S. Hellmann, K. Rossnagel, M. Marczynski-Buhlow, andL. Kipp, Phys. Rev. B 79, 035402 (2009).
74A. Fognini, G. Salvatella, T. U. Michlmayr, C. Wetli,U. Ramsperger, T. Bahler, F. Sorgenfrei, M. Beye, A. Eschen-lohr, N. Pontius, C. Stamm, F. Hieke, M. Dell’Angela, S. de Jong,R. Kukreja, N. Gerasimova, V. Rybnikov, H. Redlin, J. Raabe,A. Fohlisch, H. A. Drr, W. Wurth, D. Pescia, A. Vaterlaus, andY. Acremann, New Journal of Physics 16, 043031 (2014).
75X. Zhou, B. Wannberg, W. Yang, V. Brouet, Z. Sun, J. Douglas,D. Dessau, Z. Hussain, and Z.-X. Shen, Journal of ElectronSpectroscopy and Related Phenomena 142, 27 (2005).
76M. Dell’Angela, F. Hieke, F. Sorgenfrei, N. Gerken, M. Beye,N. Gerasimova, H. Redlin, and W. Wurth, Surface Science 643,197 (2016), present challenges in surface science, a special issuein honour of Dietrich Menzel.
77R. Al-Obaidi, M. Wilke, M. Borgwardt, J. Metje, A. Moguilevski,N. Engel, D. Tolksdorf, A. Raheem, T. Kampen, S. Mahl, I. Y.Kiyan, and E. F. Aziz, New Journal of Physics 17, 093016 (2015).
78L.-P. Oloff, M. Oura, K. Rossnagel, A. Chainani, M. Matsunami,R. Eguchi, T. Kiss, Y. Nakatani, T. Yamaguchi, J. Miyawaki,M. Taguchi, K. Yamagami, T. Togashi, T. Katayama, K. Ogawa,M. Yabashi, and T. Ishikawa, New Journal of Physics 16, 123045(2014).
79A. Belsky, N. Fedorov, S. Gridin, A. Gektin, P. Martin,D. Spassky, and A. Vasil’ev, Radiation Measurements 124, 1(2019).
80S. Beaulieu, A. Comby, D. Descamps, B. Fabre, G. Garcia,R. Geneaux, A. Harvey, F. Legare, Z. Man, L. Nahon, A. Or-donez, S. Petit, B. Pons, O. Mairesse, Y. Smirnova, andV. Blanchet, Nature Physics 14, 48489 (2018).
81N. Thire, R. Cireasa, V. Blanchet, and S. Pratt, Physical Chem-istry Chemical Physics 12, 15644 (2010).
82P. Piecuch, J. Hansen, D. Staedter, S. Faure, and V. Blanchet,The Journal of Chemical Physics 138, 201102 (2013).
83D. Staedter, N. Thire, L. Polizzi, Y. Mairesse, P. Mayer, andV. Blanchet, The Journal of Chemical Physics 142, 194306

Aurore 21
(2015).84J. A. Noble, C. Aupetit, D. Descamps, S. Petit, A. Simon, J. Ma-
scetti, N. Ben Amor, and V. Blanchet, Physical ChemistryChemical Physics (2019), 10.1039/C8CP06895J.
85R. Cireasa, J.-B. Hamard, C. Maury, and V. Blanchet, PhysicaScripta 80, 048106 (2009).
86N. Thire, D. Staedter, R. Cireasa, V. Blanchet, and S. Pratt,Physical Chemistry Chemical Physics 13, 18485 (2011).
87D. Staedter, N. Thire, E. Baynard, P. C. Samartzis, andV. Blanchet, Phys. Chem. Chem. Phys. 16, 540 (2014).
88K. Luria, W. Christen, and U. Even, The Journal of PhysicalChemistry A 115, 7362 (2011).
89I. Papagiannouli, M. Patanen, V. Blanchet, J. D. Bozek,M. de Anda Villa, M. Huttula, E. Kokkonen, E. Lamour,E. Mevel, E. Pelimanni, A. Scalabre, M. Trassinelli, D. M. Bas-
sani, A. Levy, and J. Gaudin, The Journal of Physical ChemistryC 122, 14889 (2018), https://doi.org/10.1021/acs.jpcc.8b03800.
90M. De Anda Villa, J. Gaudin, D. Amans, F. Boudjada, J. Bozek,R. Evaristo Grisenti, E. Lamour, G. Laurens, S. Mac, C. Nicolas,I. Papagiannouli, M. Patanen, C. Prigent, E. Robert, S. Steydli,M. Trassinelli, D. Vernhet, and A. Lvy, Langmuir 35, 11859(2019).
91C. S. Stan, C. Albu, A. Coroaba, M. Popa, and D. Sutiman, J.Mater. Chem. C 3, 789 (2015).
92R. Mota, R. Parafita, A. Giuliani, M.-J. Hubin-Franskin,J. Loureno, G. Garcia, S. Hoffmann, N. Mason, P. Ribeiro,M. Raposo, and P. Limo-Vieira, Chemical Physics Letters 416,152 (2005).
93R. Loo, H. Haerri, G. Hall, and P. Houston, The Journal ofChemical Physics 90, 4222 (1989).