auroral emissions of the giant planets - boston university · auroral emissions of the giant...
TRANSCRIPT

AURORAL EMISSIONS OF THE GIANT PLANETS
Anil BhardwajSpace Physics LaboratoryVikram Sarabhai Space CentreTrivandrum, India
G. Randall GladstoneSouthwest Research InstituteSan Antonio, Texas
Abstract. Auroras are (generally) high-latitude atmo-spheric emissions that result from the precipitation ofenergetic charged particles from a planet’s magneto-sphere. Auroral emissions from the giant planets havebeen observed from ground-based observatories, Earth-orbiting satellites (e.g., International Ultraviolet Ex-plorer (IUE), Hubble Space Telescope (HST), andRoentgensatellit (ROSAT)), flyby spacecraft (e.g., Voy-ager 1 and 2), and orbiting spacecraft platforms (e.g.,Galileo) at X-ray, ultraviolet (UV), visible, infrared(IR), and radio wavelengths. UV, visible, and IR aurorasare atmospheric emissions, produced or initiated when
ambient atmospheric species are excited through colli-sions with the precipitating particles, while radio andX-ray auroras are beam emissions, produced by theprecipitating species themselves. The emissions at dif-ferent wavelengths provide unique and complementaryinformation, accessible to remote sensing, about the keyphysical processes operating in the atmospheric andmagnetospheric regions where they originate. This pa-per reviews the development of our current understand-ing of auroral emissions from Jupiter, Saturn, Uranus,and Neptune, as revealed through multispectral obser-vations and supplemented by plasma measurements.
CONTENTS
1. Introduction . . . . . . . . . . . . . . . . . . . . . . . . . . . . . . . . . . . . . 2952. Auroral Processes on the Giant Planets. . . . . . . . 2963. Jupiter . . . . . . . . . . . . . . . . . . . . . . . . . . . . . . . . . . . . . . . . . . . 298
3.1. X-Ray Emissions. . . . . . . . . . . . . . . . . . . . . . . . . . 2993.2. Ultraviolet Emissions . . . . . . . . . . . . . . . . . . . . . 3023.3. Visible Emissions . . . . . . . . . . . . . . . . . . . . . . . . . 3193.4. Infrared Emissions . . . . . . . . . . . . . . . . . . . . . . . . 319
4. Saturn . . . . . . . . . . . . . . . . . . . . . . . . . . . . . . . . . . . . . . . . . . . 3284.1. X-Ray Emissions. . . . . . . . . . . . . . . . . . . . . . . . . . 3284.2. Ultraviolet Emissions . . . . . . . . . . . . . . . . . . . . . 3294.3. H3
1 Emissions . . . . . . . . . . . . . . . . . . . . . . . . . . . . . 3335. Uranus. . . . . . . . . . . . . . . . . . . . . . . . . . . . . . . . . . . . . . . . . . . 333
5.1. Ultraviolet Emissions . . . . . . . . . . . . . . . . . . . . . 3335.2. H3
1 Emissions . . . . . . . . . . . . . . . . . . . . . . . . . . . . . 3386. Neptune . . . . . . . . . . . . . . . . . . . . . . . . . . . . . . . . . . . . . . . . . 339
6.1. Early Work. . . . . . . . . . . . . . . . . . . . . . . . . . . . . . . . 3396.2. Ultraviolet Emissions . . . . . . . . . . . . . . . . . . . . . 3396.3. H3
1 Emissions . . . . . . . . . . . . . . . . . . . . . . . . . . . . . 3427. Summary . . . . . . . . . . . . . . . . . . . . . . . . . . . . . . . . . . . . . . . . 344
1. INTRODUCTION
Electromagnetic radiation emanating from the highlatitudes of a planet (also called auroral or polar lati-tudes) are generally referred to as “auroral emissions.”They are generated through the excitation of upperatmospheric atoms and molecules by energetic electronsand ions precipitating down from the planet’s magneto-
sphere along high-latitude magnetic field lines. Thusauroras are the observed signatures of electrodynamicalcoupling between a planet’s magnetosphere and iono-sphere. Auroral emissions can be produced at a widerange of wavelengths, from X-ray to radio wavelengths.Auroras play an important role in the energy balancebetween incoming solar radiation (both photons andsolar wind particles) and outgoing planetary radiationand can have important chemical and dynamical conse-quences for the entire atmosphere-ionosphere-thermo-sphere system, globally and especially locally. By observ-ing and modeling a planet’s auroral emissions atdifferent wavelengths, one can learn about composition,structure, temperature, energy budget, transport pro-cesses, and magnetospheric plasma properties all atonce.
Since the discovery of ultraviolet auroral emissionsfrom Jupiter in 1979 during the flyby of Voyager 1, therehas been a great deal of research on the nature of giantplanet auroras. (The planets Jupiter, Saturn, Uranus,and Neptune are often referred to as giant or outerplanets.) The Voyager flybys of Jupiter (in March andJuly, 1979), Saturn (in November 1980 and August1981), Uranus (in January 1986), and Neptune (in Au-gust 1989) provided the in situ measurements of mag-netic field strength and morphology, magnetosphericplasma populations, and local remote sensing requiredto make an initial characterization of the relevant au-roral physics at each planet. The Voyager results weregenerally supported by Earth-based observations (pri-marily far ultraviolet (FUV) observations made by the
Copyright 2000 by the American Geophysical Union. Reviews of Geophysics, 38, 3 / August 2000pages 295–353
8755-1209/00/1998RG000046$15.00 Paper number 1998RG000046● 295 ●
International Ultraviolet Explorer (IUE) satellite) untilthe Hubble Space Telescope (HST) era began, morespecifically, the post-COSTAR (corrective optics spacetelescope axial replacement) (i.e., “repaired”) HST era.The high spatial resolution of the FUV data from HST,supported by ground-based observations of H3
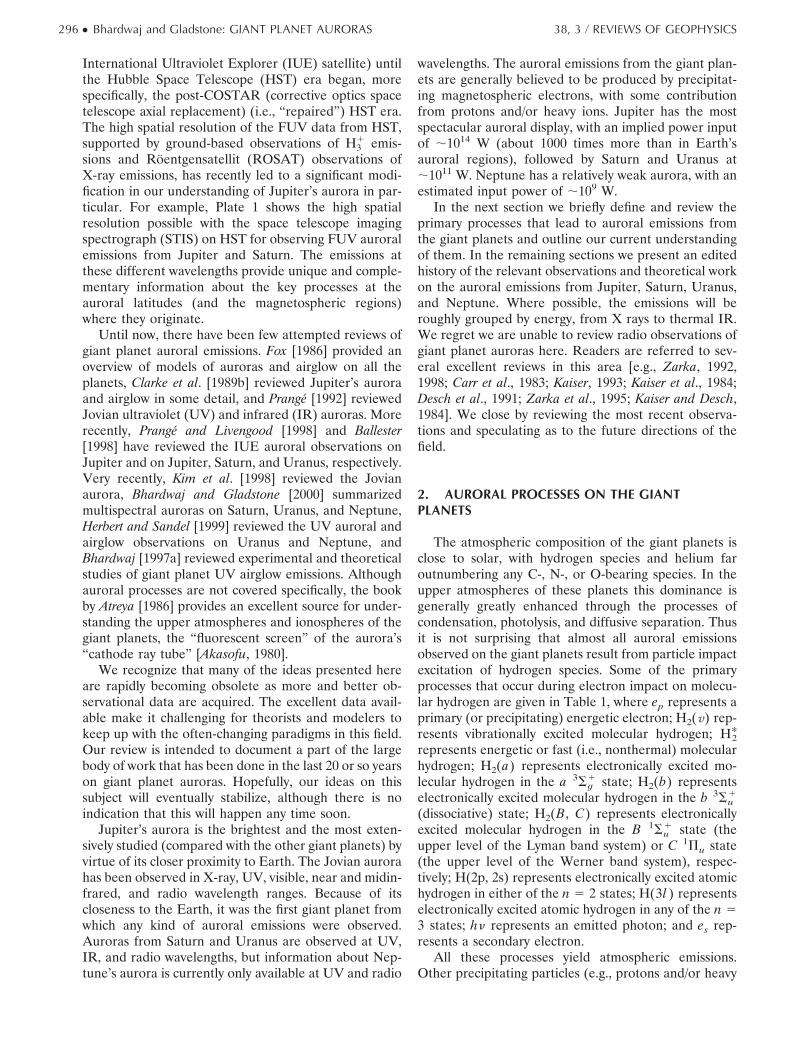
1 emis-sions and Roentgensatellit (ROSAT) observations ofX-ray emissions, has recently led to a significant modi-fication in our understanding of Jupiter’s aurora in par-ticular. For example, Plate 1 shows the high spatialresolution possible with the space telescope imagingspectrograph (STIS) on HST for observing FUV auroralemissions from Jupiter and Saturn. The emissions atthese different wavelengths provide unique and comple-mentary information about the key processes at theauroral latitudes (and the magnetospheric regions)where they originate.
Until now, there have been few attempted reviews ofgiant planet auroral emissions. Fox [1986] provided anoverview of models of auroras and airglow on all theplanets, Clarke et al. [1989b] reviewed Jupiter’s auroraand airglow in some detail, and Prange [1992] reviewedJovian ultraviolet (UV) and infrared (IR) auroras. Morerecently, Prange and Livengood [1998] and Ballester[1998] have reviewed the IUE auroral observations onJupiter and on Jupiter, Saturn, and Uranus, respectively.Very recently, Kim et al. [1998] reviewed the Jovianaurora, Bhardwaj and Gladstone [2000] summarizedmultispectral auroras on Saturn, Uranus, and Neptune,Herbert and Sandel [1999] reviewed the UV auroral andairglow observations on Uranus and Neptune, andBhardwaj [1997a] reviewed experimental and theoreticalstudies of giant planet UV airglow emissions. Althoughauroral processes are not covered specifically, the bookby Atreya [1986] provides an excellent source for under-standing the upper atmospheres and ionospheres of thegiant planets, the “fluorescent screen” of the aurora’s“cathode ray tube” [Akasofu, 1980].
We recognize that many of the ideas presented hereare rapidly becoming obsolete as more and better ob-servational data are acquired. The excellent data avail-able make it challenging for theorists and modelers tokeep up with the often-changing paradigms in this field.Our review is intended to document a part of the largebody of work that has been done in the last 20 or so yearson giant planet auroras. Hopefully, our ideas on thissubject will eventually stabilize, although there is noindication that this will happen any time soon.
Jupiter’s aurora is the brightest and the most exten-sively studied (compared with the other giant planets) byvirtue of its closer proximity to Earth. The Jovian aurorahas been observed in X-ray, UV, visible, near and midin-frared, and radio wavelength ranges. Because of itscloseness to the Earth, it was the first giant planet fromwhich any kind of auroral emissions were observed.Auroras from Saturn and Uranus are observed at UV,IR, and radio wavelengths, but information about Nep-tune’s aurora is currently only available at UV and radio
wavelengths. The auroral emissions from the giant plan-ets are generally believed to be produced by precipitat-ing magnetospheric electrons, with some contributionfrom protons and/or heavy ions. Jupiter has the mostspectacular auroral display, with an implied power inputof ;1014 W (about 1000 times more than in Earth’sauroral regions), followed by Saturn and Uranus at;1011 W. Neptune has a relatively weak aurora, with anestimated input power of ;109 W.
In the next section we briefly define and review theprimary processes that lead to auroral emissions fromthe giant planets and outline our current understandingof them. In the remaining sections we present an editedhistory of the relevant observations and theoretical workon the auroral emissions from Jupiter, Saturn, Uranus,and Neptune. Where possible, the emissions will beroughly grouped by energy, from X rays to thermal IR.We regret we are unable to review radio observations ofgiant planet auroras here. Readers are referred to sev-eral excellent reviews in this area [e.g., Zarka, 1992,1998; Carr et al., 1983; Kaiser, 1993; Kaiser et al., 1984;Desch et al., 1991; Zarka et al., 1995; Kaiser and Desch,1984]. We close by reviewing the most recent observa-tions and speculating as to the future directions of thefield.
2. AURORAL PROCESSES ON THE GIANTPLANETS
The atmospheric composition of the giant planets isclose to solar, with hydrogen species and helium faroutnumbering any C-, N-, or O-bearing species. In theupper atmospheres of these planets this dominance isgenerally greatly enhanced through the processes ofcondensation, photolysis, and diffusive separation. Thusit is not surprising that almost all auroral emissionsobserved on the giant planets result from particle impactexcitation of hydrogen species. Some of the primaryprocesses that occur during electron impact on molecu-lar hydrogen are given in Table 1, where ep represents aprimary (or precipitating) energetic electron; H2(v) rep-resents vibrationally excited molecular hydrogen; H*2represents energetic or fast (i.e., nonthermal) molecularhydrogen; H2(a) represents electronically excited mo-lecular hydrogen in the a 3Sg
1 state; H2(b) representselectronically excited molecular hydrogen in the b 3Su
1
(dissociative) state; H2(B, C) represents electronicallyexcited molecular hydrogen in the B 1Su
1 state (theupper level of the Lyman band system) or C 1Pu state(the upper level of the Werner band system), respec-tively; H(2p, 2s) represents electronically excited atomichydrogen in either of the n 5 2 states; H(3l ) representselectronically excited atomic hydrogen in any of the n 53 states; hn represents an emitted photon; and es rep-resents a secondary electron.
All these processes yield atmospheric emissions.Other precipitating particles (e.g., protons and/or heavy
296 ● Bhardwaj and Gladstone: GIANT PLANET AURORAS 38, 3 / REVIEWS OF GEOPHYSICS
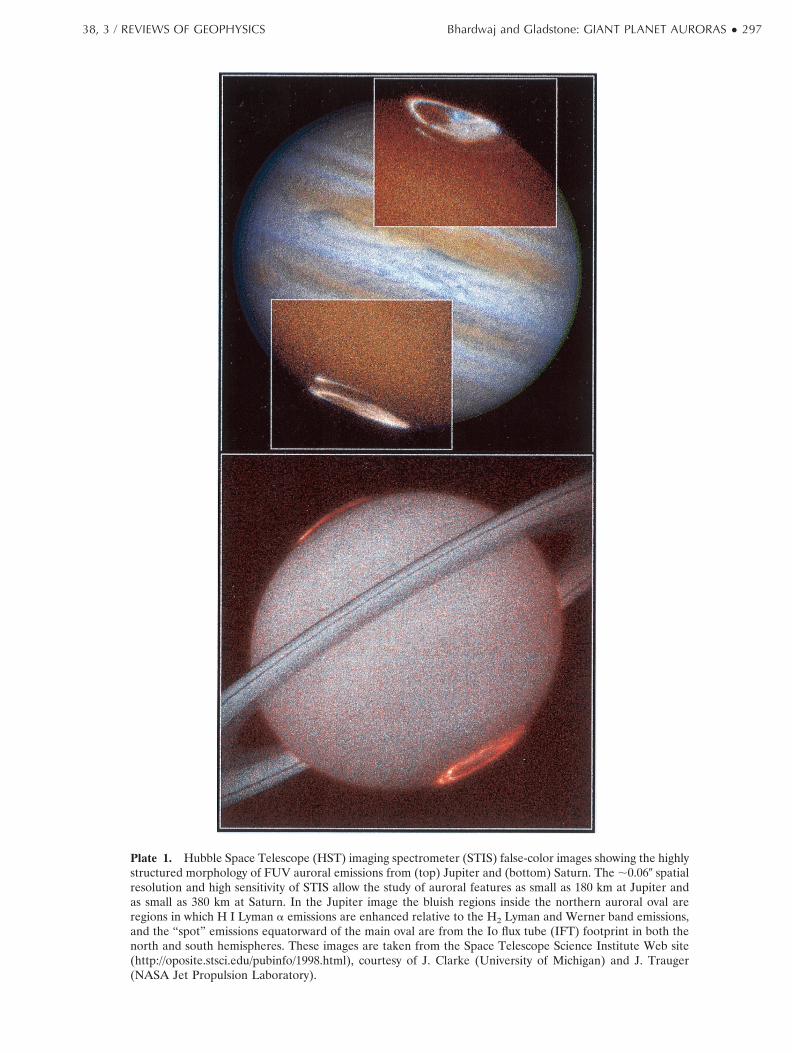
Plate 1. Hubble Space Telescope (HST) imaging spectrometer (STIS) false-color images showing the highlystructured morphology of FUV auroral emissions from (top) Jupiter and (bottom) Saturn. The ;0.060 spatialresolution and high sensitivity of STIS allow the study of auroral features as small as 180 km at Jupiter andas small as 380 km at Saturn. In the Jupiter image the bluish regions inside the northern auroral oval areregions in which H I Lyman a emissions are enhanced relative to the H2 Lyman and Werner band emissions,and the “spot” emissions equatorward of the main oval are from the Io flux tube (IFT) footprint in both thenorth and south hemispheres. These images are taken from the Space Telescope Science Institute Web site(http://oposite.stsci.edu/pubinfo/1998.html), courtesy of J. Clarke (University of Michigan) and J. Trauger(NASA Jet Propulsion Laboratory).
38, 3 / REVIEWS OF GEOPHYSICS Bhardwaj and Gladstone: GIANT PLANET AURORAS ● 297

ions) would excite somewhat similar emissions, bothdirectly and through the secondary electrons they pro-duce. By contrast, X-ray (and radio) auroras are emittedby the precipitating particles themselves. For example,precipitating sulfur ions would emit X rays by firstcharge stripping to a highly ionized state, followed bycharge exchange and excitation reactions as follows [cf.Cravens et al., 1995]:
Charge stripping S~q21!1 1 H23 Sq1 1 H2 1 es
Charge transfer Sq1 1 H23 S~q21!1* 1 H21
X-ray emission S~q21!1*3 S~q21!1 1 hn,
where Sq1 represents sulfur ions that are q electronsshort of being neutral atoms and Sq1* represents suchions that are in an electronically excited state.
Many bright auroral emission features are expected atvisible wavelengths (e.g., H I Balmer lines, He I 1083nm), but these are difficult to detect against reflectedsunlight when observing the giant planets from the vi-cinity of the Earth. For example, assuming a reflectivityof 30%, the backscattered sunlight at 656.3 nm (Ha)from Jupiter has a brightness of ;20 MR nm21 (arayleigh (R) is a unit of surface brightness equivalent to106 photons cm22 s21 4psr21), so that even a 0.01-nm-wide auroral emission line (e.g., the H I Lyman a linewidth is ;0.1 nm in the Jovian aurora, although mostother emissions are expected to be much narrower)would have to compete with a reflected signal of 200 kR.Thus most of our remote sensing of giant planet auroralemissions has been accomplished at other than visiblewavelengths. Important exceptions to this rule are theVoyager [e.g., Cook et al., 1981] and Galileo [e.g., Inger-soll et al., 1998] visible imagings of Jupiter’s nightsideaurora, which, because of their high spatial resolution,are providing strong new constraints on the width andaltitude of the aurora.
3. JUPITER
The probable existence of auroras on Jupiter waspredicted by Schwitters [1968] and Hunter [1969] when
they detected Ha line (656.3 nm) emissions, with inten-sities of a few kilorayleighs, from ground-based tele-scopes (although the results were ambiguous). Dulk et al.[1970], using improved resolution, found no emissionswith intensity greater than 10 kR from Jovian auroras.Further observations, with inconclusive evidence for au-roras on Jupiter, were undertaken by Rottman et al.[1973], Clary and Hunter [1975], Giles et al. [1976], andHolman and Hunter [1977]. Atreya et al. [1977] presentedevidence for the existence of auroral hot spots at the feetof the Io flux tube (IFT) using the Copernicus satellitespectrometer data. (The Io flux tube refers to a fewmillion ampere current of ions and electrons on mag-netic field lines that are short-circuited through theionospheres of Io and Jupiter.) A Lyman a intensityexceeding 100 kR, in addition to about 1 kR of Lyman aairglow, was measured.
Taking analogy from the processes occurring in theupper atmosphere of the Earth, Heaps et al. [1973, 1975]suggested that electron and proton auroras should bepresent on Jupiter. These authors computed H, He, andH2 emissions resulting from the precipitation of elec-trons and protons, degraded in energy by applying thecontinuous slowing down approximation (CSDA)method. Their results showed that for an electron aurora[Heaps et al., 1973], most of the Lyman a emission is dueto dissociative excitation of H2 rather than to directexcitation of H, while in the case of a proton aurora[Heaps et al., 1975], charge exchange and excitation ofthe precipitating H1 provides the most important sourceof Lyman a. From the ground-based measurements ofthe 656.3-nm line of atomic hydrogen, Heaps et al. [1973]placed an upper limit of 1011 el cm22 s21 on an electronflux peaked in the sub-keV range and 1010 el cm22 s21 ifthe differential electron flux peaked near 10 keV. As-suming the auroral regions cover 1/50 of Jupiter’s sur-face, this amounts to an input power of 200 GW, whichis a very good upper limit considering that our currentestimate of auroral input power is ;100 GW on Jupiter.Heaps [1976] explored the implications of electron pre-cipitation for heating of the neutral atmosphere. Cravens[1975] considered the effect of precipitating 20-keVelectrons on the atmosphere and ionosphere of Jupiter
TABLE 1. Primary Processes in the Impact of Electrons on H2
Process Reaction Sequence Result
Vibrational excitation ep 1 H2 3 H2(v) 1 ep; H2(v) 1 H2 3 H*2 1 H2 heat, quadrupole emission (IR)
Electronic excitation ep 1 H2 3 H2(b) 1 ep; H2(b) 3 H2(a) 1 hn a 2 b continuum (MUV)
Electronic excitation ep 1 H2 3 H2(B, C) 1 ep; H2(B, C) 3 H2 1 hn Lyman and Werner bands (FUV)
Dissociative excitation ep 1 H2 3 H(2p, 2s) 1 H 1 ep; H(2p, 2s) 3 H 1 hn Lyman a (FUV)
Dissociative excitation ep 1 H2 3 H(3l) 1 H 1 ep; H(3l) 3 H(2l) 1 hn Balmer series (visible)
Ionization ep 1 H2 3 H21 1 es 1 ep; H2
1 1 H2 3 H31 1 H H3
1 emission (IR)
Dissociative ionizationand excitation
ep 1 H2 3 H(2p, 2s) 1 H1 1 es 1 ep; H(2p, 2s) 3 H 1 hn Lyman a (FUV)
298 ● Bhardwaj and Gladstone: GIANT PLANET AURORAS 38, 3 / REVIEWS OF GEOPHYSICS
by calculating UV intensities, ionospheric densities, andneutral, electron, and vibrational temperatures. Huntenand Dessler [1977] suggested a mechanism for producingflux of soft electrons (50–300 eV), the precipitation ofwhich was indicated by the Pioneer-observed high tem-perature of Jupiter’s topside ionosphere [Nagy et al.,1976].
3.1. X-Ray EmissionsFollowing the discovery of a magnetosphere on Jupi-
ter by the ground-based detection of nonthermal radioemissions [Burke and Franklin, 1955; Bigg, 1964; Pidding-ton and Drake, 1968; cf. Berge and Gulkis, 1976], it wasreasonable to expect, based on terrestrial analogy, thatJupiter should be a source of X-ray emissions producedvia bremsstrahlung by the precipitation of energeticelectrons from the magnetosphere into the upper atmo-sphere of the planet. In planetary atmospheres, brems-strahlung X rays are produced when high-energy elec-trons are scattered by ambient atmospheric nuclei.
This expectation led to a series of searches, starting in1962, to detect the X-ray emissions from Jupiter byrocket [Fisher et al., 1964], balloons [Edwards and Mc-Cracken, 1967; Haymes et al., 1968; Hurley, 1972; Ma-honey, 1973], and satellites [Vesecky et al., 1975; Hurley,1975]. In all these instances the results of attempts todetect X rays from Jupiter, at various energy ranges,were negative; these studies only provided upper limitsto the X-ray fluxes in the energy range of their instru-ments (see Figure 1). There was also speculation thatbombardment of the Galilean satellites by energeticparticles within Jupiter’s magnetosphere would produce
substantial characteristic X-ray line emissions [Mihalov,1973].
Although the Voyager spacecraft did not carry anyX-ray detectors, the Low Energy Charged Particle(LECP) Experiment was somewhat sensitive to X rays inthe 14- to 31-keV and 31- to 63-keV ranges. This allowedKirsch et al. [1981a] to place an upper limit for JovianX-ray emission, based on count rate enhancements ob-served in the direction of Jupiter when Voyager 1 wasstill approaching from 100–230 RJ away. Their upperlimit corresponded to ,1.3 3 1024 photons cm22 s21
keV21 at Earth in the 14- to 31-keV range. Since toproduce this large an X-ray flux would require unrealis-tically large precipitating electron fluxes at Jupiter, andgiven the apparent hardness of the spectrum, Kirsch etal. concluded that the count rate enhancements weremore likely due to energetic neutrals, possibly originat-ing from the innermost Galilean satellite, Io, as a resultof charge exchange between energetic ions and ambientneutrals.
The first positive detection of X-ray emissions fromthe polar regions of Jupiter was made by the imagingproportional counter (IPC) and high-resolution imaging(HRI) detectors on board the Einstein (High EnergyAstronomical Observatory 2 (HEAO-2)) satellite[Metzger et al., 1983], finally ending a long frustratingsearch for them over a wide energy range. The emissionswere detected in the 0.2- to 3.0-keV energy range (softerthan the Voyager LECP range) from both auroral zones(north and south) of Jupiter. The observed energy spec-trum of the X rays was soft and was characterized by apower law with an exponent of ;2.3 (see Figure 1 forflux versus energy spectrum). The total flux was found tobe relatively constant in time, in contrast with the ob-servations in the UV, where substantial long- and short-term variabilities had been observed. The measuredX-ray flux at Earth of ;6 3 1024 cm22 s21 correspondedto an X-ray luminosity of ;4 3 109 W in the 0.2- to3.0-keV energy band. Metzger et al. [1983] were not ableto reconcile their data in terms of bremsstrahlung byprecipitating electrons due to an unreasonably high in-put power requirement (1015–1016 W) for this mecha-nism, about a factor of 100–1000 larger than the inputpower derived from Voyager and IUE observations asrequired for producing the UV aurora [Broadfoot et al.,1981a; Durrance et al., 1982; Yung et al., 1982]. ThereforeMetzger et al. argued for K-shell line emissions fromprecipitating S and O ions, with energies of 0.3–4.0 MeVnucleon21, as the most plausible source of the Jovianauroral X rays. The X-ray line emissions (at ;0.53 nmfor S ions and ;2.36 nm for O ions) arise as the ener-getic O and S ions are nearly stripped of electrons whileprecipitating, and then (through further collisions) areeither directly excited or charge exchanged into an ex-cited state, which emits an X-ray photon upon decayback to the ground state. The suggestion of energeticheavy ions as the source of auroral X-ray emissions fromJupiter was based in part on evidence from in situ
Figure 1. A comparison of the Einstein detection of JovianX-ray emissions with previous upper limits [Metzger et al., 1983,Figure 3]. Voyager data are from Kirsch et al. [1981a], Coper-nicus data are from Vesecky et al. [1975], Uhuru data are fromHurley [1975], and all other data are from Mahoney [1973].
38, 3 / REVIEWS OF GEOPHYSICS Bhardwaj and Gladstone: GIANT PLANET AURORAS ● 299

Voyager observations of a strong radial gradient in theenergetic heavy ion flux [Gehrels and Stone, 1983], indi-cating a planetward ion flow from the outer magneto-sphere [Gehrels et al., 1981]. The contrast between anapproximately constant flux measured between 17 and12 RJ and a sharp decrease between 12 and 6 RJ [Gehrelsand Stone, 1983] suggested strong pitch angle scatteringinto the loss cone, and subsequent precipitation of theseheavy ions into the auroral atmosphere, at a rate com-parable to the strong pitch angle diffusion limit. How-ever, the energy resolution of the IPC detector on theEinstein observatory was not sufficient to clearly distin-guish a line spectrum (emissions from excited states ofhighly stripped S and O ions) from a continuum (elec-tron bremsstrahlung).
The precipitating heavy ions should also produce lineemissions at UV wavelengths during collisions with H2.This was explored by Waite et al. [1988a] by observingJovian auroras with IUE and also modeled by Horanyi etal. [1988]. These studies showed that the theoreticallypredicted intensities of ultraviolet O and S emissionswere much larger than the upper limit values of inten-sities set by IUE. These authors suggested that the bulkof the auroral UV emissions are due to energetic (10–100 keV) electron precipitation which is deposited abovethe region of substantial methane absorption (i.e., at orabove the homopause), while the X rays are due to lineemissions produced by energetic (.300 keV nucleon21)heavy ion precipitation which is deposited considerablybelow the methane homopause level. (The homopause isthe altitude level above which atmospheric gases haveindividual scale heights according to their molecularweights, rather than share a common scale height, asbelow this level. Generally, the homopause level occursin the lower thermosphere.) As Jupiter’s upper atmo-sphere is considerably more transparent to X rays thanto FUV emissions, this scenario could satisfy both sets ofobservations since UV emissions associated with theheavy ion precipitation would be extinguished by theoverlying hydrocarbons.
Barbosa [1990a] reexamined the question of electronbremsstrahlung as the mechanism for producing X-rayphotons on Jupiter. He proposed that soft X rays ob-served by Metzger et al. [1983] are due to bremsstrahlungfrom the secondary electrons generated locally duringionization of H2 by precipitating primary electrons. Heshowed that a good agreement with the Einstein X-raymeasurements can be obtained (see Figure 2) with abeam of primary electrons (electrons assumed to beaccelerated by a field-aligned potential drop and precip-itated into the atmosphere) having a Maxwellian energydistribution with a characteristic energy of 30–100 keV,penetrating below the homopause with an energy flux of10–20 ergs cm22 s21, and ionization secondaries havinga power law with spectral index ;2.
The model of Barbosa [1990a], however, does notcomply with the theories of electron transport in theterrestrial auroral atmosphere [e.g., Banks et al., 1974;
Evans, 1974; Walt et al., 1979; Haider and Singhal, 1983],since the secondary electron energy distribution param-eters were chosen freely, independent of the primaryelectron beam parameters, to satisfy the observed X-rayspectrum of Metzger et al. [1983]. Essentially, in themodel of Barbosa [1990a] the electron distribution usedin the calculations consists of two components: (1) theprimary electron part, which is assumed to have a Max-wellian distribution with energy flux and characteristicenergy as the free parameters, and (2) the secondaryelectron part, which is assumed to have a power lawdistribution with spectral index and high-energy cutoff(together with the energy flux of secondary electrons) asthe free parameters. No comparison between Barbosa’smodel and theoretical Jovian models was possible at thattime since all the models focused on energies #10 keV[Gerard and Singh, 1982; Waite et al., 1983], whereas thecalculations of Barbosa suggested electron energies inthe range 30–100 keV.
Following this, two independent theoretical models,one based on the two-stream method [Waite, 1991] andthe other based on the continuous slowing down approx-imation (CSDA) [Singhal et al., 1992], performed self-consistent calculations of the electron energy flux distri-bution of the primary and secondary precipitatingelectrons in the atmosphere of Jupiter at energies of10–100 keV. Both models showed that the expectedX-ray photon flux is an order of magnitude or moresmaller than both the observations and Barbosa’s resultsin the spectral region sampled by Einstein (see Figure 3).This large discrepancy between the results of Barbosa[1990a] and those of Waite [1991] and Singhal et al.[1992] is due to the fact that the secondary electrondistribution assumed by Barbosa is over 3 orders ofmagnitude larger at the altitude of peak auroral energydissipation [cf. Waite, 1991, Figure 1; Singhal et al., 1992,Figure 4] than that predicted by the models. Thus the
Figure 2. Electron bremsstrahlung photon flux F(ε) forthree auroral electron precipitation models [Barbosa, 1990a,Figure 3b]. In this model the secondary electron spectrum isunconstrained by the primary electron spectrum.
300 ● Bhardwaj and Gladstone: GIANT PLANET AURORAS 38, 3 / REVIEWS OF GEOPHYSICS

most recent studies support the original work of Metzgeret al. [1983] in suggesting that electron bremsstrahlung isunlikely to be the source of Jovian auroral X rays.
Around this time, two papers were also published[Barbosa, 1990b; Waite et al., 1992] predicting the X-rayintensity at Jupiter during future planetary missions.Barbosa [1990b] predicted the X-ray energy spectrumexpected at observational distances of 10 and 100 RJ,based on his model of electron bremsstrahlung [Barbosa,1990a], while Waite et al. [1992] predicted the intensity ofelectron bremsstrahlung–produced X rays using the two-stream method [Waite et al., 1983; Waite, 1991]. Calcu-lations of Waite et al. [1992] predicted that precipitatingauroral electrons consistent with the constraints fromobserved UV auroral emissions would produce brems-strahlung X rays with sufficient energy and intensity tobe detected by the Ulysses spacecraft at 10 RJ during itsgravity-assisted flyby of Jupiter in February 1992. Themodel calculations [Waite, 1991; Singhal et al., 1992]predict a change in the slope of the X-ray emissionspectrum at higher energies (*5 keV), and this couldprovide an important discriminator between the heavyion and bremsstrahlung models, if Jovian X rays couldbe measured at these high energies. The ambiguity about the source of X-ray radiation
from Jupiter’s auroral latitudes, with arguments andcounterarguments for and against the electron brems-strahlung and K shell ion emissions, was resolved to acertain extent by the Ulysses Gamma Ray Burst (GRB)experiment observations made from a distance of 163–110 RJ, which detected no significant emissions in the27- to 48-keV energy range [Hurley et al., 1993]. Theseobservations placed a 3s upper limit of 1.1–5.6 3 108 Wfor hard X-ray emissions from Jupiter. The precipitatingelectron power required to explain the UV aurora leadsto estimates of bremsstrahlung X-ray power which arean order of magnitude below the Ulysses upper limit[Hurley et al., 1993], whereas the Barbosa [1990a, b]model predicts a bremsstrahlung X-ray power between9 3 107 and 2 3 108 W, which should have been detectedby the GRB experiment. The Ulysses observations didnot completely rule out the electron bremsstrahlunghypothesis but provided more support for the suggestionthat the X-ray radiation from Jupiter is mostly K shellline emissions of precipitating S and O ions.
The controversy was further resolved by ROSATHRI and position-sensitive proportional counter (PSPC)observations of Jupiter made in April 1991 and May1992, revealing soft (;80–2000 eV) X-ray emissionsfrom auroral latitudes [Waite et al., 1994]. Comparison ofthe observed X-ray photon flux versus energy spectrumwith the X-ray spectrum produced by electron brems-strahlung and recombination line emissions from S andO ions suggested (see Figure 4) that the line spectrumproduces a substantially better fit, both spectrally andstatistically, than does the best bremsstrahlung fit. Thetotal X-ray power inferred from analysis of the PSPC(0.1- to 2.1-keV energy passband) data was 1.3–2.1 3 109
W, which is within a factor of 3 of the 4 3 109 W (0.2–3.0
Figure 3. Electron bremsstrahlung photon flux F(ε) forthree similar auroral electron precipitation models [Singhal etal., 1992, Figure 5]. In this model the secondary electronspectrum is derived from the primary by the continuous slow-ing down approximation method.
Figure 4. Jovian X-ray spectrum obtained by the Roentgen-satellit (ROSAT) position-sensitive proportional counter(PSPC) instrument, with the best fitting two-line and brems-strahlung models overplotted [Waite et al., 1994, Figure 5].
38, 3 / REVIEWS OF GEOPHYSICS Bhardwaj and Gladstone: GIANT PLANET AURORAS ● 301

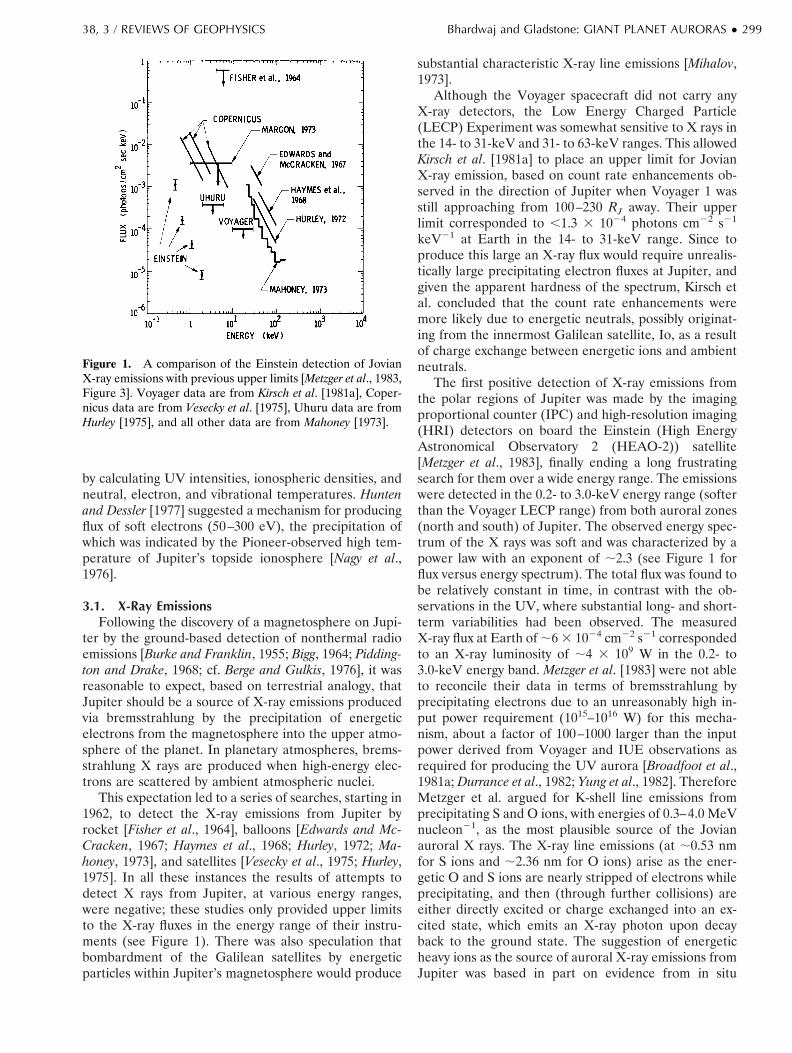
keV) emitted X-ray power reported by Metzger et al.[1983] from the Einstein measurements. The differencebetween the auroral X-ray power inferred from ROSATand Einstein data may be partly due to differences in theenergy passband of the two experiments and/or temporalvariations in auroral intensity. Waite et al. [1994] usedROSAT HRI observations to study the variation inauroral X-ray intensity as a function of Jupiter’s longi-tude in the northern polar region (see Plate 2); the dataset indicated a peak in the northern auroral zone near1808–2008 system III longitude. This longitudinal vari-ability observed by ROSAT at X-ray wavelengths isconsistent with the well-known variability in UV emis-sions in the northern auroral zone [e.g., Livengood et al.,1992]. Thus the ROSAT observations support the sug-gestion of Metzger et al. [1983] and model calculations[Waite et al., 1988a, 1994; Waite, 1991; Singhal et al.,1992] that precipitating energetic (.700 keV nucleon21)S and O ions are most probably responsible for the X-rayemissions from Jupiter. The presence of such energeticions in the Jovian magnetosphere, and probably theregion of their precipitation into the atmosphere (L 58–12), was demonstrated by the Voyager LECP data[Gehrels and Stone, 1983].
The conclusion of Waite et al. [1994] was furtherdeveloped by the detailed modeling of X-ray emissionproduction, assumed to be recombination line emissionsfrom heavy ion precipitation, carried out by Cravens etal. [1995]. The model of Cravens et al. was an extensionof the previous model of energetic oxygen precipitationat Jupiter developed by Horanyi et al. [1988] to includeall the charge states of the oxygen (instead of only thelowest four charge states considered by Horanyi et al.),from neutral oxygen up to fully stripped oxygen. Cravenset al. demonstrated that X-ray emissions in the energyregion of ROSAT observations occur mainly from highlycharged and excited states of the ions; these are q 5 5–7for oxygen ions (i.e., O VI, O VII, and O VIII) and q 56–13 for sulfur ions. Their modeled X-ray energy spec-trum showed a reasonably good resemblance to theROSAT observations, except at 250- to 400-eV energies.This discrepancy could be due to emissions from otherspecies, such as Na and C, that have not been consideredin the model but are observed by Ulysses to be presentin the Jovian magnetosphere at a few percent of theoxygen and sulfur fluxes [Lanzerotti et al., 1992]. It is alsoa result of their oversimplified consideration of thePSPC response function. A total auroral X-ray radiatedpower of ;2 3 108 W was estimated by these authors, afew times less than the ROSAT observations. The studyof Cravens et al. [1995] also showed that the X-rayemissions observed by ROSAT and Einstein could beexplained by heavy ion precipitation without extrapolat-ing the Voyager energetic ion spectrum [Gehrels andStone, 1983] to lower energies. Recently, Kharchenko etal. [1998] performed Monte Carlo calculations that sim-ulate the charge state histories of energetic oxygen ionsas they precipitate into Jupiter’s atmosphere. They find
that the ions are slow to reach the charge state equilib-rium assumed by Cravens et al. [1995] and previousstudies and that this can significantly alter the X-rayspectrum.
In summary, the current status of our understandingof Jovian auroral X rays is that these emissions aredominantly line emissions resulting from recombinationand charge exchange transitions in highly charged statesof S and O ions which are precipitating into the atmo-sphere of Jupiter with energies in excess of 300 keVnucleon21 from the L 5 8–12 region of the magneto-sphere, with at most a minor contribution from electronbremsstrahlung.
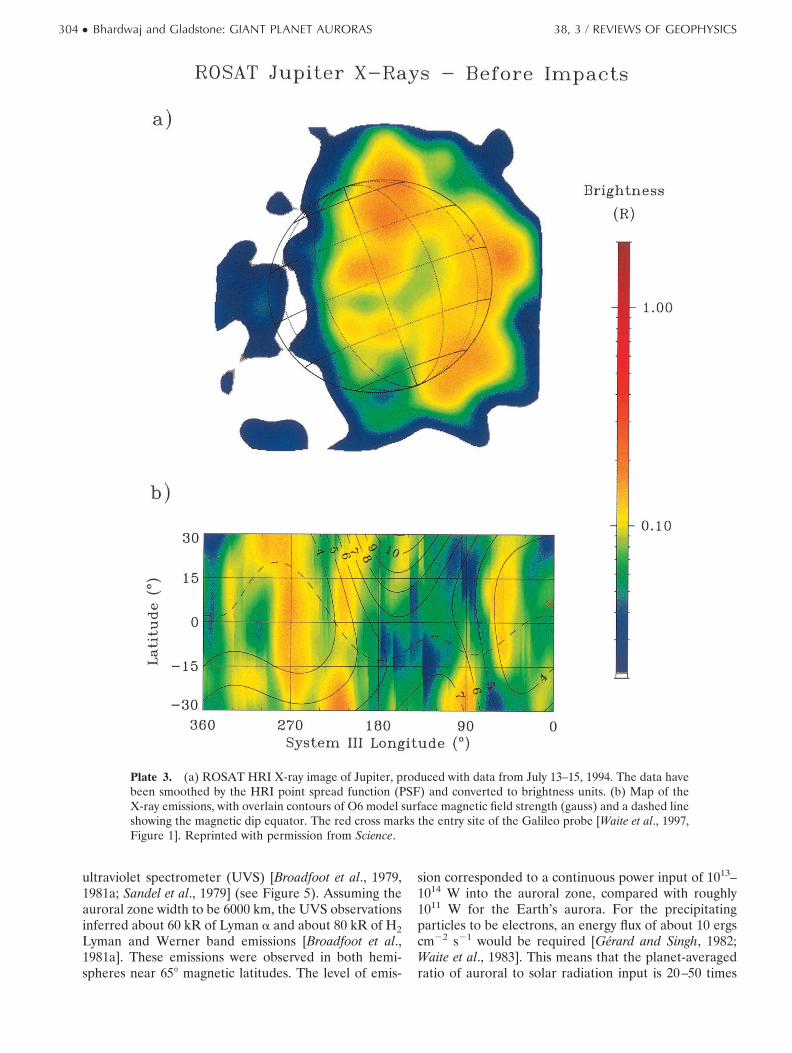
It is worth pointing out here that X-ray emissionshave also recently been observed by ROSAT from theequatorial latitudes of Jupiter (see Plate 3) which havebeen interpreted as line emissions from precipitatingheavy ions [Waite et al., 1997]. The precipitation of theseheavy ions at low latitudes can result from pitch anglescattering of ions by plasma waves [Thorne and Moses,1983], whose presence in the inner magnetosphere ofJupiter, with high intensity at lower latitudes, has beendetected by Ulysses [Rezeau et al., 1997]. These X-rayemissions seem to be organized in solar local time (oc-curring predominantly between local noon and dusk)and in longitude, and are found to emanate largely fromthe lIII 5 2108–608 region (a broad region of low mag-netic field strength along the Jovian magnetic dip equa-tor). Assuming that these equatorial X rays are causedby the precipitation of energetic (.300 keV nucleon21)S and O ions out of Jupiter’s inner radiation belt, Waiteet al. [1997] studied the implications of these precipitat-ing heavy ions for the heating of the atmosphere. Theirmodel calculations showed that a height-integrated heat-ing rate of 0.08–3 ergs cm22 s21, with a preferred valueof 0.2 ergs cm22 s21, can result in substantial heating ofthe atmosphere that may account for a large fraction ofthe upper atmosphere temperature structure observedby the Galileo probe’s atmospheric structure instrument[Seiff et al., 1996, 1997].
Most recently, Gladstone et al. [1998a] examined thespatial and temporal variations of the Jovian X raysusing several years of ROSAT observations. They foundthat the emitted X-ray power from Jupiter has decreasedwith time by about 50% from 1994 to 1996, roughly inparallel with solar activity. Also, the distribution of emis-sions across the disk of Jupiter has an intriguing corre-lation with the bright limb of the planet (i.e., the X-rayemissions are found to be brightest on the side of thesub-Earth location where the subsolar point resides).This may indicate that reflected or fluoresced solar Xrays may contribute to the disk emissions and that theyare not entirely the result of ion precipitation.
3.2. Ultraviolet Emissions
3.2.1. Early work. The first positive identificationof the aurora on Jupiter was provided by the Voyager
302 ● Bhardwaj and Gladstone: GIANT PLANET AURORAS 38, 3 / REVIEWS OF GEOPHYSICS
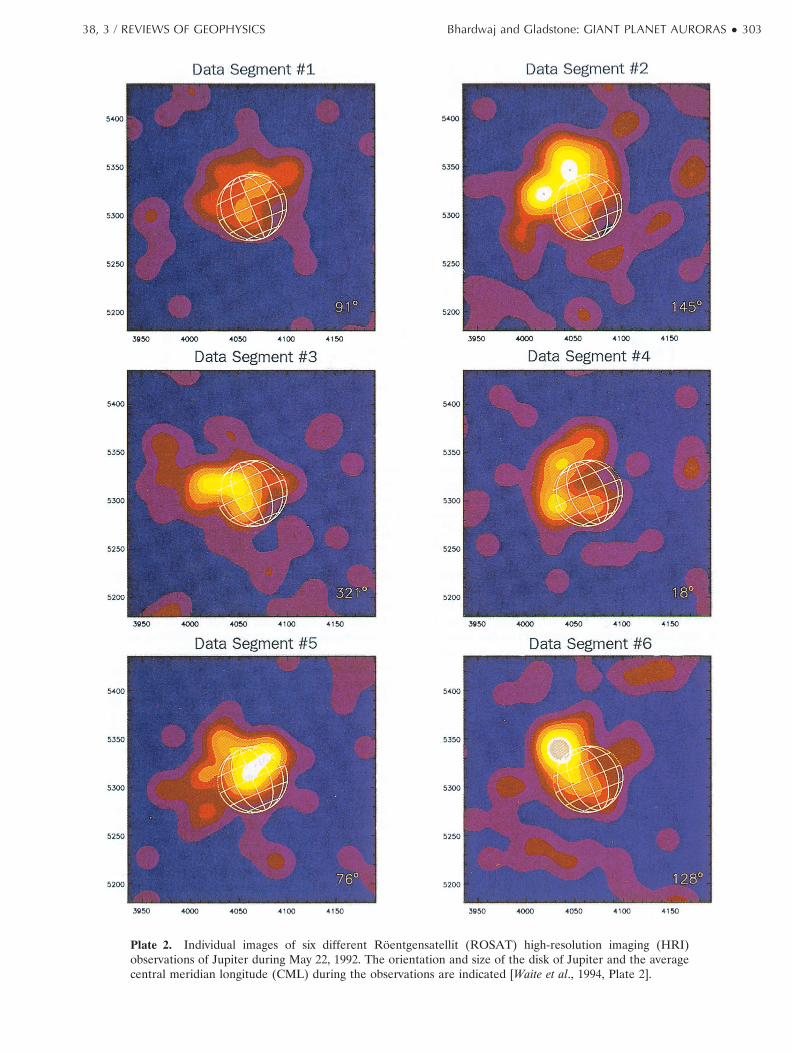
Plate 2. Individual images of six different Roentgensatellit (ROSAT) high-resolution imaging (HRI)observations of Jupiter during May 22, 1992. The orientation and size of the disk of Jupiter and the averagecentral meridian longitude (CML) during the observations are indicated [Waite et al., 1994, Plate 2].
38, 3 / REVIEWS OF GEOPHYSICS Bhardwaj and Gladstone: GIANT PLANET AURORAS ● 303
ultraviolet spectrometer (UVS) [Broadfoot et al., 1979,1981a; Sandel et al., 1979] (see Figure 5). Assuming theauroral zone width to be 6000 km, the UVS observationsinferred about 60 kR of Lyman a and about 80 kR of H2Lyman and Werner band emissions [Broadfoot et al.,1981a]. These emissions were observed in both hemi-spheres near 658 magnetic latitudes. The level of emis-
sion corresponded to a continuous power input of 1013–1014 W into the auroral zone, compared with roughly1011 W for the Earth’s aurora. For the precipitatingparticles to be electrons, an energy flux of about 10 ergscm22 s21 would be required [Gerard and Singh, 1982;Waite et al., 1983]. This means that the planet-averagedratio of auroral to solar radiation input is 20–50 times
Plate 3. (a) ROSAT HRI X-ray image of Jupiter, produced with data from July 13–15, 1994. The data havebeen smoothed by the HRI point spread function (PSF) and converted to brightness units. (b) Map of theX-ray emissions, with overlain contours of O6 model surface magnetic field strength (gauss) and a dashed lineshowing the magnetic dip equator. The red cross marks the entry site of the Galileo probe [Waite et al., 1997,Figure 1]. Reprinted with permission from Science.
304 ● Bhardwaj and Gladstone: GIANT PLANET AURORAS 38, 3 / REVIEWS OF GEOPHYSICS
more at Jupiter than at the Earth. In addition to elec-trons, the most commonly accepted primary precipitat-ing species, Goertz [1980] suggested proton precipitationmay be important, while Thorne [1982, 1983] and Thorneand Moses [1983] considered heavy ion precipitation,which is supported by observations of 1–20 MeV nucle-on21 oxygen, sulfur, and sodium ions in the Jovian innermagnetosphere [Gehrels and Stone, 1983] (see Mauk etal. [1996] and Anglin et al. [1997] for recent results on theanalysis of Voyager and Ulysses data). The question ofidentity of the precipitating particles, however, is stillvery much a debatable issue [e.g., Clarke et al., 1989b;Waite et al., 1988a, 1994; Barbosa, 1991; Singhal et al.,1992; Mauk et al., 1996] (see section 3.2.5 for moredetails).
Jovian auroras were also observed at FUV wave-lengths by IUE in the same time period of the Voyagerencounter, which gave an indication of a possible tem-poral variation in the brightness of the emissions [Clarkeet al., 1980]. Durrance et al. [1982] used IUE to observethe north pole of Jupiter during an almost completerotation of the planet. Skinner et al. [1984] modeled thebrightness distribution as a function of central meridianlongitude corresponding to IUE observations of thenorth aurora collected between January 1981 and Janu-ary 1982. (Central meridian longitude, or CML, refers tothe longitude on Jupiter (generally in the magnetic fieldrotational frame known as system III) which is mostdirectly underneath the Earth at a given time.) Skinnerand Moos [1984] extended this work to south auroralobservations from July 1983 to March 1984. The above
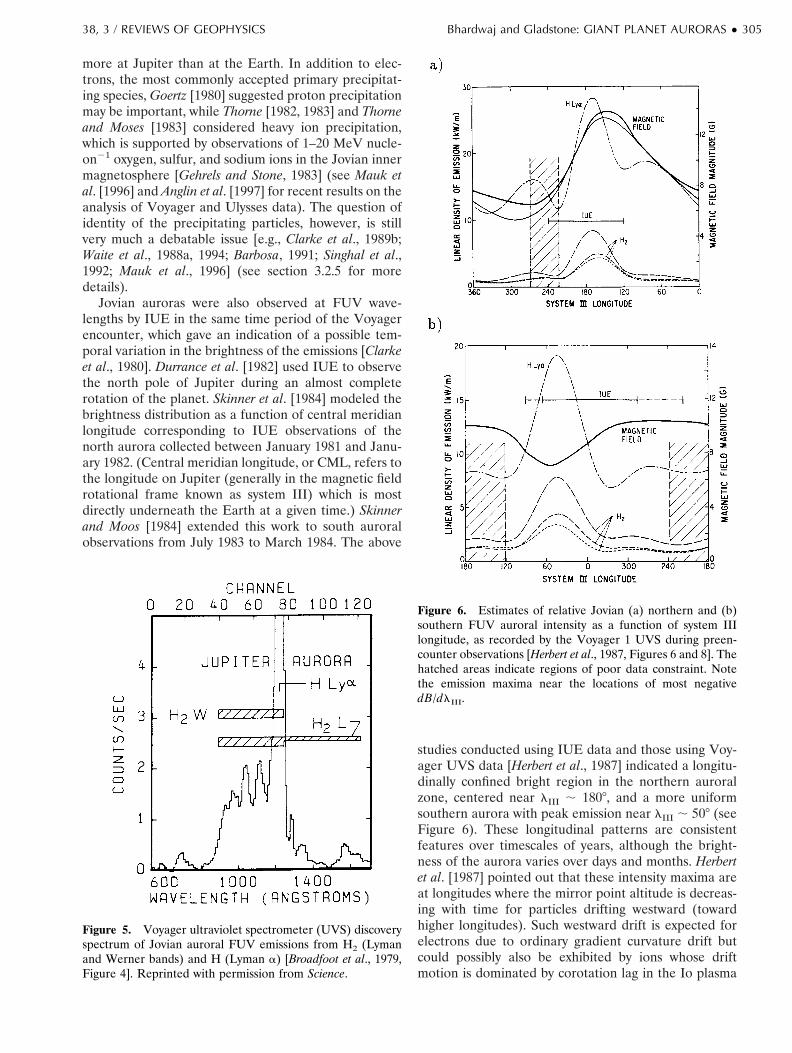
studies conducted using IUE data and those using Voy-ager UVS data [Herbert et al., 1987] indicated a longitu-dinally confined bright region in the northern auroralzone, centered near lIII ; 1808, and a more uniformsouthern aurora with peak emission near lIII ; 508 (seeFigure 6). These longitudinal patterns are consistentfeatures over timescales of years, although the bright-ness of the aurora varies over days and months. Herbertet al. [1987] pointed out that these intensity maxima areat longitudes where the mirror point altitude is decreas-ing with time for particles drifting westward (towardhigher longitudes). Such westward drift is expected forelectrons due to ordinary gradient curvature drift butcould possibly also be exhibited by ions whose driftmotion is dominated by corotation lag in the Io plasma
Figure 5. Voyager ultraviolet spectrometer (UVS) discoveryspectrum of Jovian auroral FUV emissions from H2 (Lymanand Werner bands) and H (Lyman a) [Broadfoot et al., 1979,Figure 4]. Reprinted with permission from Science.
Figure 6. Estimates of relative Jovian (a) northern and (b)southern FUV auroral intensity as a function of system IIIlongitude, as recorded by the Voyager 1 UVS during preen-counter observations [Herbert et al., 1987, Figures 6 and 8]. Thehatched areas indicate regions of poor data constraint. Notethe emission maxima near the locations of most negativedB/dlIII.
38, 3 / REVIEWS OF GEOPHYSICS Bhardwaj and Gladstone: GIANT PLANET AURORAS ● 305

torus. (The Io plasma torus is a doughnut of plasma,mostly electrons plus S and O ions, that encircles Jupiterat Io’s orbit. It is nearly self-generated, since torus par-ticles corotating with Jupiter’s magnetic field can impactIo’s atmosphere and sputter new material into thetorus.) The distribution of UV auroral brightness isapproximately fixed in magnetic longitude rather thanfixed with respect to local time as for the terrestrialaurora.
Long-term studies of Jovian auroras using IUE havebeen reported by Livengood et al. [1988, 1990, 1992] andLivengood and Moos [1990]. Livengood et al. [1990] an-alyzed the wavelength-dependent absorption apparentin IUE spectra of Jovian north polar emissions observedover the period of 1978–1989. They found that thehydrocarbon optical depth in front of the auroral emis-sion has a consistent dependence on magnetic longitude(see Figure 7). Livengood et al. [1992] used IUE datafrom 1981 to 1991 to rule out a correlation between theauroral brightness and extreme ultraviolet (EUV) solarcycle variability as predicted by Eviatar and Barbosa[1984] and also did not detect any long-term variation ineither auroral brightness or morphology. These long-term studies by IUE also confirmed the modulation ofemission intensity with central meridian longitude. TheUV emission peak at lIII ; 1808 CML in the northernauroral zone coincided well with the “IR hot spot”[Caldwell et al., 1988], indicating that the processes gen-erating the UV and IR emissions might be the same andthat the longitudinal brightness variations might reflectthe auroral precipitation pattern [Prange, 1991, 1992].Later, high-resolution FUV imaging from the Hubble
Space Telescope (HST) led to questioning of this con-clusion. Even the early (pre-COSTAR) HST imagesclearly showed that the FUV auroral emissions were oflowest brightness at the location where the IR emissionmaximized [Caldwell et al., 1992]. In retrospect, much ofthe auroral brightness variation with CML seen by Voy-ager UVS and IUE was likely due to their large fields ofview.
3.2.2. Modeling. Post-Voyager modeling of Jo-vian auroral and related process has been carried out byseveral researchers [e.g., Yung et al., 1982; Gerard andSingh, 1982; Waite et al., 1983, 1992; Gladstone, 1982;Horanyi et al., 1988; Cravens, 1987; Gladstone and Skin-ner, 1989; Barbosa, 1990a; Singh, 1991; Prange andElkhamsi, 1991; Kim et al., 1992; Singhal et al., 1992;Cravens and Eisenhower, 1992; Bhardwaj and Singhal,1993; Livengood et al., 1990; Rego et al., 1994; Prange etal., 1995, 1997a, b; Bisikalo et al., 1996; Liu and Dalgarno,1996; Achilleos et al., 1998; Gladstone et al., 1998b; Regoet al., 1999]. The study of Yung et al. [1982] concludedthat the precipitating auroral particles must penetratethe homopause in order to produce the observed ab-sorption of H2 emissions at wavelengths ,140 nm andthat electrons in the range of 1–30 keV with an energyflux of about 10 ergs cm22 s21 would suffice. Gerard andSingh [1982] computed the expected altitude profiles ofionization, excitation, and heating rates in the upperatmosphere, using the continuous slowing down approx-imation (CSDA), for 0.1- to 2-keV Maxwellian primaryelectron spectra. Waite et al. [1983] and Horanyi et al.[1988] have further studied the detailed aeronomicalconsequences of 1- to 10-keV monoenergetic electron
Figure 7. (a) Intensity (I1557–1619) and (b) color ratio (I1557–1619/I1230–1300) variation of Jovian northernauroral H2 emissions as observed by International Ultraviolet Explorer (IUE) during 1979–1989 [Livengoodet al., 1990, Figure 1]. The dashed line in Figure 7b shows the ratio expected for an unattenuated H2 spectrum,and IUE values lower than this have been plotted as asterisks.
306 ● Bhardwaj and Gladstone: GIANT PLANET AURORAS 38, 3 / REVIEWS OF GEOPHYSICS

precipitation and energetic oxygen and sulfur ion pre-cipitation, respectively, in the upper atmosphere of Ju-piter. Their studies showed that atmospheric and iono-spheric processes are not very sensitive to the identity ofthe precipitating particles (effects vary within a factor of;3) but depend mostly on the total energy input and theatmospheric level at which the energy is deposited.
The first theoretical model of vibrationally excited H2in the auroral upper atmosphere of Jupiter was pre-sented by Cravens [1987]. He calculated the density foreach of the 14 excited vibrational levels of the groundelectronic state of H2 as a function of altitude. Heshowed that significantly enhanced populations of vibra-tionally excited H2 could exist in the atmosphere andthat these would affect ionospheric densities by provid-ing an important chemical sink for H1 ions in the Jovianionosphere through the reaction
H1 1 H2~v $ 4!3 H21 1 H,
as originally suggested by McElroy [1973].Following the approach of Yung et al. [1982], Glad-
stone and Skinner [1989] and Livengood et al. [1990]analyzed the effect of the wavelength-dependent atmo-spheric extinction (due to hydrocarbons near or belowthe homopause) on the observed H2 FUV emissionspectrum. From a model-dependent analysis of IUE-observed Jupiter polar emission spectra, Gladstone andSkinner [1989] inferred equivalent incoming particle en-ergies of ;95 keV, 3.3 MeV, and 6 MeV nucleon21 forelectrons, protons, and heavy ions, respectively, whileLivengood et al. [1990] inferred energy from 10 to 17 keVfor electrons and approximately 200–500 keV nucleon21
for ions. Thus these latter studies suggested electrons inthe 10- to 100-keV range, while the earlier theoreticalstudies modeled electrons of &10 keV only.
The effect of Jupiter’s strong magnetic field asymme-try on the precipitation distribution of electrons and ionswas investigated by Prange and Elkhamsi [1991] for thecase of an isotropic and uniform injection mechanismalong constant L shells and for various pitch angledistributions. Their model suggested that depending onthe real-time precipitation rates of the species (electronsand ions), the longitudinal precipitation profile (andthus the brightness distribution) may have either a singleor double peak and that this could possibly explain thelongitudinal asymmetry observed in the auroral UVemissions by Voyager and IUE.
Singh [1991] developed a CSDA-based model to cal-culate the energy degradation of a proton-hydrogenbeam precipitating into a H2-H auroral atmosphere ofJupiter. He found that the overall efficiencies of mostexcitation processes due to proton and electron impactare fairly similar but that the relative contribution ofsecondary electrons to the excitation strongly dependson the energy of the primary proton. His calculationssuggested that protons carrying an energy flux of 7–10ergs cm22 s21 with characteristic energy &1 MeV wouldbe required to account for the observed UV intensities.
Extending the work of Horanyi et al. [1988], Cravensand Eisenhower [1992] studied the chemical effects ofenergetic oxygen ion precipitation on the auroral iono-sphere of Jupiter. They found that an auroral oxygen fluxof about 107 cm22 s21 would be required if all theobserved H2 Lyman and Werner band emissions weredue to ion precipitation rather than to energetic electronprecipitation. Their calculations further demonstratedthat the chemistry associated with the odd auroral oxy-gen species (i.e., O, OH, and H2O) could result in abouta factor of 4 reduction in the electron density in theauroral ionosphere. Cravens and Eisenhower also stud-ied the implications of O precipitation for CO formationin the atmosphere of Jupiter and noted the possiblebuildup of S1 ions above the homopause due to theirnonreactivity with hydrogen.
To study the implications of energetic (10–100 keV)electron precipitation in the high-latitude upper atmo-sphere of Jupiter, Singhal et al. [1992] developed a modelusing the CSDA method. They studied the production ofH2 bands, H I Lyman a, Ha, Hb emissions (see Figure8), and X rays via electron bremsstrahlung, as well asionization rates and subsequent ionospheric chemistry.Singhal et al. found that the Voyager-observed Lymanand Werner band emissions of H2 may be reconciledwith precipitating electrons of characteristic energies 10,30, and 100 keV having energy fluxes of 10, 18, and 45ergs cm22 s21, respectively. The model of Singhal et al.suggested that the most consistent picture, satisfying theVoyager UV observations and the Pioneer and Voyagerelectron density profiles, is for precipitating electronswith an energy flux of 14–18 ergs cm22 s21 havingcharacteristic energies of 30–50 keV.
Figure 8. Calculated volume excitation rates of the Lyman(curve B) and Werner (curve C) states of H2 and the Ha, Hb,and Lyman a lines of H in a model Jovian atmosphere, forinput Maxwellian precipitating electron spectra with charac-teristic energies of 100 keV (dashed lines) and 30 keV (solidlines) [Singhal et al., 1992, Figure 7].
38, 3 / REVIEWS OF GEOPHYSICS Bhardwaj and Gladstone: GIANT PLANET AURORAS ● 307

Rego et al. [1994] also developed a code, based onCSDA, for energy degradation of protons and electronsin the Jovian auroral atmosphere. These authors com-puted altitude profiles of ionization and excitation ratesof the H I Lyman a and H2 bands for electron andproton precipitation in the initial energy ranges of 10–50keV and 50 keV to 1 MeV, respectively. Rego et al.found that the 10-keV electrons and 300-keV protonsproduce similar energy degradation profiles (see Figure9). They pointed out that a beam of protons does notreach equilibrium with H atoms for initial proton ener-gies of 10 # E # 200 keV. The ionization process wasfound to be controlled mainly by the primary precipitat-ing species, with secondary electrons having a negligiblecontribution. However, in the case of excitation, thecontributions of secondary electrons are very importantand amount to ;58% for electron primaries and ;69%for a proton aurora. Prange et al. [1995], extending thework of Rego et al. [1994], showed that the penetrationdepth of auroral precipitating particles depends as sig-nificantly on their pitch angle distribution as on theirinitial energy. Therefore primary energies cannot beaccurately derived from the “color ratio” (the ratio ofauroral brightnesses at 156–162 and 123–130 nm) with-out taking into account the actual angular distribution ofthe incoming particles.
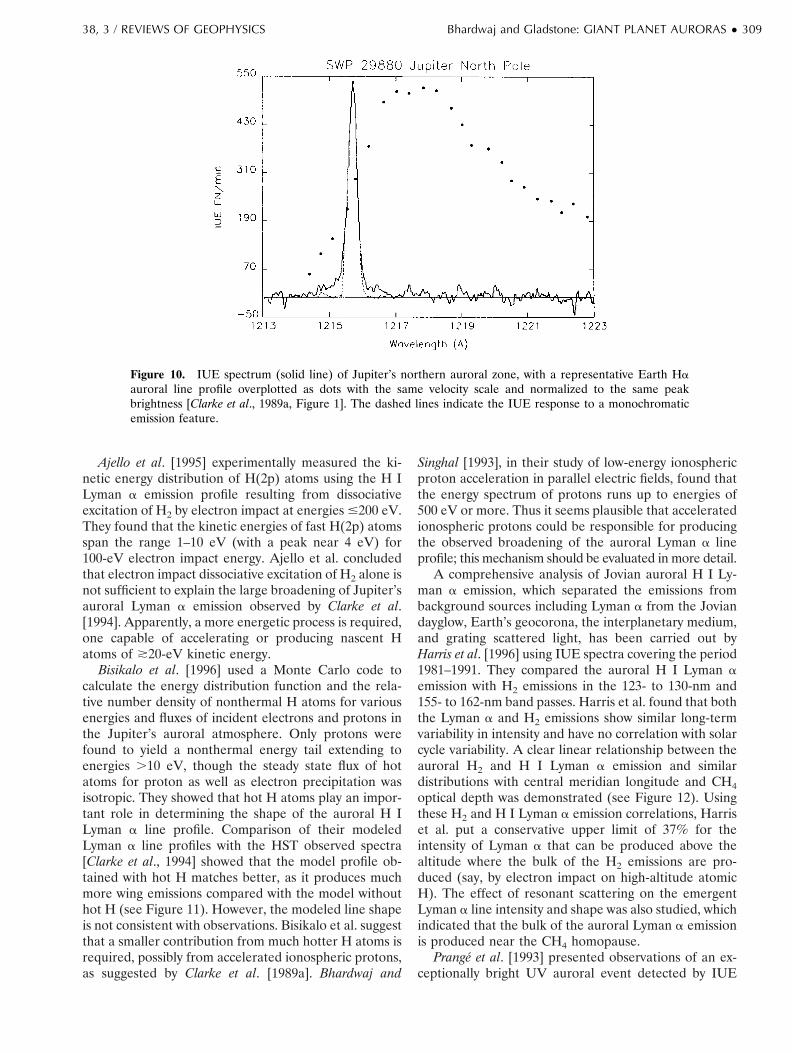
A very interesting result reported by Clarke et al.[1989a], obtained through high spectral resolution IUEobservations, is a pronounced lack of H I Lyman a lineemission having large (i.e., 1–2 nm) Doppler (red) shiftsin Jupiter’s aurora (see Figure 10). The small observedshifts of only about 30–60 km s21 (mainly toward theblue, corresponding to 10- to 20-eV protons and/or Hatoms, with higher-velocity wings extending out to amaximum energy of 200 eV) effectively ruled out asubstantial magnetospheric proton contribution to the
production of Jupiter’s aurora. Clarke et al. [1989b]suggested that the observed low-Doppler-shift emissionsmay result from local acceleration of protons by electricfields inside the Jovian ionosphere, analogous to plasmamotions observed in Earth’s ionosphere. The blue shiftindicated plasma motion up out of the atmosphere andraised the possibility that the atmospheric auroral zonessupply substantial amounts of protons and H atoms tothe magnetosphere. This upward movement and conse-quent escape of the plasma from the atmospheric au-roral zones was supported by the identification of 10- to100-eV secondary auroral electrons around L 5 7.5–10by Voyager [McNutt et al., 1990].
Using a modified version of the Singhal and Bhardwaj[1991] Monte Carlo model, Bhardwaj and Singhal [1993]examined the production of Doppler-shifted H I Lymana emissions in the auroral atmosphere of Jupiter due tothe acceleration of low-energy ionospheric protons inparallel electric fields. Their simulations indicated thatan electric field of ;0.5–2.0 mV m21 is required toaccount for the red-shifted Lyman a emissions and that;2–5 mV m21 is required to account for the blue-shiftedLyman a emissions of 1–10 kR on Jupiter, when aconstant electric field is applied in the neutral numberdensity region of 5 3 1012 to 2 3 108 cm23.
More recently, Jovian spectra obtained with the God-dard high-resolution spectrograph (GHRS) on boardthe HST in the 120.4- to 124.1-nm region with 0.057-nmspectral resolution [Clarke et al., 1994] showed highlybroadened Lyman a with wings extending symmetricallyto ;100 eV (140 km s21) to either side of line center.The strength of these wings appeared to be correlatedwith the brightness of H2 band emission lines alsopresent in the spectra. Consistent with earlier IUE re-sults, no signature of proton precipitation was seen inthe GHRS data.
Figure 9. Comparison of the calculated volume excitation rates of H Lyman a and H2 Lyman and Werneremissions by (a) a 10-keV beam of electrons and (b) a 300-keV beam of protons [Rego et al., 1994, Figure 14].
308 ● Bhardwaj and Gladstone: GIANT PLANET AURORAS 38, 3 / REVIEWS OF GEOPHYSICS
Ajello et al. [1995] experimentally measured the ki-netic energy distribution of H(2p) atoms using the H ILyman a emission profile resulting from dissociativeexcitation of H2 by electron impact at energies #200 eV.They found that the kinetic energies of fast H(2p) atomsspan the range 1–10 eV (with a peak near 4 eV) for100-eV electron impact energy. Ajello et al. concludedthat electron impact dissociative excitation of H2 alone isnot sufficient to explain the large broadening of Jupiter’sauroral Lyman a emission observed by Clarke et al.[1994]. Apparently, a more energetic process is required,one capable of accelerating or producing nascent Hatoms of *20-eV kinetic energy.
Bisikalo et al. [1996] used a Monte Carlo code tocalculate the energy distribution function and the rela-tive number density of nonthermal H atoms for variousenergies and fluxes of incident electrons and protons inthe Jupiter’s auroral atmosphere. Only protons werefound to yield a nonthermal energy tail extending toenergies .10 eV, though the steady state flux of hotatoms for proton as well as electron precipitation wasisotropic. They showed that hot H atoms play an impor-tant role in determining the shape of the auroral H ILyman a line profile. Comparison of their modeledLyman a line profiles with the HST observed spectra[Clarke et al., 1994] showed that the model profile ob-tained with hot H matches better, as it produces muchmore wing emissions compared with the model withouthot H (see Figure 11). However, the modeled line shapeis not consistent with observations. Bisikalo et al. suggestthat a smaller contribution from much hotter H atoms isrequired, possibly from accelerated ionospheric protons,as suggested by Clarke et al. [1989a]. Bhardwaj and
Singhal [1993], in their study of low-energy ionosphericproton acceleration in parallel electric fields, found thatthe energy spectrum of protons runs up to energies of500 eV or more. Thus it seems plausible that acceleratedionospheric protons could be responsible for producingthe observed broadening of the auroral Lyman a lineprofile; this mechanism should be evaluated in more detail.
A comprehensive analysis of Jovian auroral H I Ly-man a emission, which separated the emissions frombackground sources including Lyman a from the Joviandayglow, Earth’s geocorona, the interplanetary medium,and grating scattered light, has been carried out byHarris et al. [1996] using IUE spectra covering the period1981–1991. They compared the auroral H I Lyman aemission with H2 emissions in the 123- to 130-nm and155- to 162-nm band passes. Harris et al. found that boththe Lyman a and H2 emissions show similar long-termvariability in intensity and have no correlation with solarcycle variability. A clear linear relationship between theauroral H2 and H I Lyman a emission and similardistributions with central meridian longitude and CH4optical depth was demonstrated (see Figure 12). Usingthese H2 and H I Lyman a emission correlations, Harriset al. put a conservative upper limit of 37% for theintensity of Lyman a that can be produced above thealtitude where the bulk of the H2 emissions are pro-duced (say, by electron impact on high-altitude atomicH). The effect of resonant scattering on the emergentLyman a line intensity and shape was also studied, whichindicated that the bulk of the auroral Lyman a emissionis produced near the CH4 homopause.
Prange et al. [1993] presented observations of an ex-ceptionally bright UV auroral event detected by IUE
Figure 10. IUE spectrum (solid line) of Jupiter’s northern auroral zone, with a representative Earth Haauroral line profile overplotted as dots with the same velocity scale and normalized to the same peakbrightness [Clarke et al., 1989a, Figure 1]. The dashed lines indicate the IUE response to a monochromaticemission feature.
38, 3 / REVIEWS OF GEOPHYSICS Bhardwaj and Gladstone: GIANT PLANET AURORAS ● 309

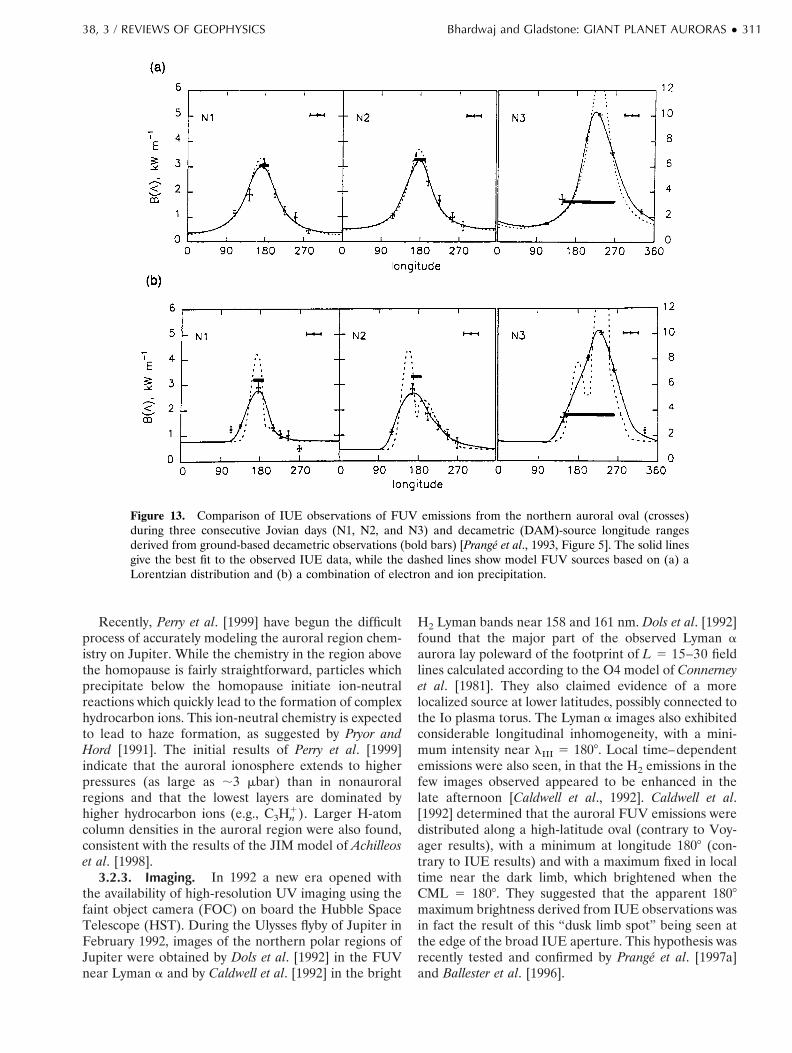
during December 20–21, 1990, whose signatures werealso detected simultaneously in auroral decameter radio(DAM) emissions. The DAM and UV emissions exhib-ited well-correlated variations in intensity and longitude,in particular, with a similar shift of the source regiontoward larger longitudes from one day to the next (seeFigure 13), suggesting that a common cause triggeredthe variation of the UV and radio emissions during thisevent. From analysis of Ulysses measurements in theupstream solar wind, Prange et al. [1993] suggested thata large disturbance reached Jupiter at about the time ofthe auroral event. The correlation between Jovian radioemissions and solar wind activity has already been wellestablished [e.g., Barrow et al., 1986; Barrow and Desch,1989; Zarka and Genova, 1989].
The effect of the aurora on global thermospheric
circulation was first considered by Sommeria et al. [1995],who showed that supersonic winds are a likely outcomeof such a large energy input. Achilleos et al. [1998] havedescribed an ambitious project to create a time-depen-dent global three-dimensional model of Jupiter’s ther-mosphere and ionosphere, called the Jovian ionosphericmodel, or JIM. The initial runs suggest that even modestauroral energy input (8 ergs cm22 s21) can drive largeoutflows (;0.6 km s21) by strong chemistry-inducedpressure gradients (these gradients are a simple result ofthe substantial local dissociation of H2 to 2H in theauroral atmosphere). While the model is still in a pre-liminary state, with fairly crude discretization and inputs,it is an excellent first step toward a better understandingof how Jupiter’s powerful aurora affects the upper at-mospheric dynamics and chemistry.
Figure 11. Comparison between Jovian au-roral Lyman a profiles observed with the HSTGoddard high-resolution spectrograph(GHRS) and model calculations that show theeffects of nonthermal H atoms on the width ofthe expected emission line [Bisikalo et al., 1996,Figure 12].
Figure 12. The integrated brightnesses of Jovianauroral H2 Lyman and Werner band and H Lyman aemissions observed by IUE are shown as a function ofcentral meridian longitude (CML). The H Lyman apattern is most similar to that of the H2 Werner bandemissions [Harris et al., 1996, Figure 8]. Reprintedwith permission from Academic Press.
310 ● Bhardwaj and Gladstone: GIANT PLANET AURORAS 38, 3 / REVIEWS OF GEOPHYSICS
Recently, Perry et al. [1999] have begun the difficultprocess of accurately modeling the auroral region chem-istry on Jupiter. While the chemistry in the region abovethe homopause is fairly straightforward, particles whichprecipitate below the homopause initiate ion-neutralreactions which quickly lead to the formation of complexhydrocarbon ions. This ion-neutral chemistry is expectedto lead to haze formation, as suggested by Pryor andHord [1991]. The initial results of Perry et al. [1999]indicate that the auroral ionosphere extends to higherpressures (as large as ;3 mbar) than in nonauroralregions and that the lowest layers are dominated byhigher hydrocarbon ions (e.g., C3Hn
1). Larger H-atomcolumn densities in the auroral region were also found,consistent with the results of the JIM model of Achilleoset al. [1998].
3.2.3. Imaging. In 1992 a new era opened withthe availability of high-resolution UV imaging using thefaint object camera (FOC) on board the Hubble SpaceTelescope (HST). During the Ulysses flyby of Jupiter inFebruary 1992, images of the northern polar regions ofJupiter were obtained by Dols et al. [1992] in the FUVnear Lyman a and by Caldwell et al. [1992] in the bright
H2 Lyman bands near 158 and 161 nm. Dols et al. [1992]found that the major part of the observed Lyman aaurora lay poleward of the footprint of L 5 15–30 fieldlines calculated according to the O4 model of Connerneyet al. [1981]. They also claimed evidence of a morelocalized source at lower latitudes, possibly connected tothe Io plasma torus. The Lyman a images also exhibitedconsiderable longitudinal inhomogeneity, with a mini-mum intensity near lIII 5 1808. Local time–dependentemissions were also seen, in that the H2 emissions in thefew images observed appeared to be enhanced in thelate afternoon [Caldwell et al., 1992]. Caldwell et al.[1992] determined that the auroral FUV emissions weredistributed along a high-latitude oval (contrary to Voy-ager results), with a minimum at longitude 1808 (con-trary to IUE results) and with a maximum fixed in localtime near the dark limb, which brightened when theCML 5 1808. They suggested that the apparent 1808maximum brightness derived from IUE observations wasin fact the result of this “dusk limb spot” being seen atthe edge of the broad IUE aperture. This hypothesis wasrecently tested and confirmed by Prange et al. [1997a]and Ballester et al. [1996].
Figure 13. Comparison of IUE observations of FUV emissions from the northern auroral oval (crosses)during three consecutive Jovian days (N1, N2, and N3) and decametric (DAM)-source longitude rangesderived from ground-based decametric observations (bold bars) [Prange et al., 1993, Figure 5]. The solid linesgive the best fit to the observed IUE data, while the dashed lines show model FUV sources based on (a) aLorentzian distribution and (b) a combination of electron and ion precipitation.
38, 3 / REVIEWS OF GEOPHYSICS Bhardwaj and Gladstone: GIANT PLANET AURORAS ● 311

Two images taken 3 days apart in June 1992 provideda good view of the lIII ; 1808–2008 sector of the auroralzone in a passband centered at 153 nm [Gerard et al.,1993]. The brighter portions of the aurora were esti-mated to comprise ;230–350 kR of H2 Lyman bandemissions. These observations basically confirmed theexistence of enhanced regions of UV emissions sur-rounding the north polar regions. The observationsshowed no indication of bright structured emissionswithin the polar cap. Their study also suggested that themain magnetospheric source region of the auroral pri-maries does not lie directly in the vicinity of the Ioplasma torus, but appears to originate from a moredistant region in the distant magnetosphere, close to thelimit of the corotation or even open field lines. The H2images exhibited a narrow bright arc in the morningsector, approximately fitting the L 5 30 magnetic fieldfootprint, and a broader diffuse aurora in the afternoonsector. The total power radiated in the H2 bands wasestimated to be ;2 3 1012 W, which is in agreement withearlier IUE and Voyager estimates. However, the highemission rates measured locally in the H2 arcs implylarge local fluxes (;50 ergs cm22 s21 of electron energyprecipitation).
In February 1993, Gerard et al. [1994a] obtained aseries of six UV images of Jupiter’s north polar region,covering a complete rotation of the planet, using theHST FOC centered near 153 nm, a region dominated byunabsorbed H2 Lyman bands and continuum. Theseimages were of better quality than the early HST FOCimages obtained in 1992 [Dols et al., 1992; Caldwell et al.,1992; Gerard et al., 1993], owing to the use of a differentfilter combination and the largest FOC field of view.Gerard et al. [1994a] found that the size of the northernauroral oval and its location agree best with the footprintof the L 5 30 field line in the O6 magnetic field modelof Connerney [1993], if a small shift were made in theposition of the O6 model oval by about 108 parallel tothe lIII ; 2708 meridian (see Plate 4). Such a conclusionwas also supported by another set of their observationsacquired with the same instrument in July 1993 [Gerardet al., 1994b]. Gerard et al. [1994a] observed a systematicvariation in emission morphology east and west of thelIII ; 1808 meridian; a narrow discrete arc is observed atlIII . 1808 (parallel but close to the L 5 30 oval, whilea more structured and diffuse emission zone was seeninside the L 5 30 oval for lIII , 1808). These morpho-logical features were also observed by Gerard et al.[1994b] in their UV images. Emission features similar tothose seen in the FUV have been observed in the H3
1
auroras [Satoh et al., 1996], suggesting a common origin.Gerard et al. [1994b] recorded an exceptionally bright
auroral event in July 1993 using the FOC. A local H2emission intensity of ;6 MR was observed, which cor-responds to a local electron precipitation flux of ;1000ergs cm22 s21 and a radiated power of ;1012 W, whichis about 3 3 104 times larger than the heating rate dueto solar EUV radiation. A decrease in the brightness of
the discrete arc by more than an order of magnitudewithin 20 hours, and its high-latitude location, led Ger-ard et al. to suggest field-aligned-current-driven auroralprecipitation at Jupiter as the cause (in analogy to theEarth’s discrete aurora) rather than the usual particleprecipitation by pitch angle diffusion [cf. Herbert et al.,1987]. Field-aligned currents were detected in the Jovianmagnetosphere during the Ulysses flyby of Jupiter[Dougherty et al., 1998].
Since the reflected FUV background is large justlongward of the 153-nm FOC passband, the equator-ward boundary of the aurora may not be correctly de-termined from the FOC observations at 153 nm, espe-cially in the lIII ; 1408–2008 region, where the effect ofthe center and the shape of the auroral oval shift theauroral emission to latitudes #508N. To resolve this,Grodent et al. [1996] carried out observations of theJovian aurora with FOC at 125, 130, and 153 nm. Mostof the emissions were found to be confined inside theL 5 6 oval (as defined by the O6 magnetic field model)and fill a large fraction of polar cap. However, theemissions at 125 and 130 nm extended to significantlylower latitudes, down to ;408N, between lIII ; 1408 and2008. Such equatorward extensions of the auroral zoneswere also reported in the IR mapping of the H3
1 auroraby Kim et al. [1994], who found that the H3
1 emissionsare observed down to ;508N between about lIII 5 1508and 1808.
Prange et al. [1996], using post-COSTAR FOC im-ages, showed that the lead angle between the emissionfeatures and the foot of the IFT seems to vary with time.Prange et al. suggested that this variability may resultfrom variations in the mass density of the Io plasmatorus. This separation between the magnetic footprint ofIo and its auroral footprint obtained by HST observa-tions is different from that obtained by IR observations[Connerney et al., 1993]. Analysis of the HST-obtainedFUV emissions also indicated that the Alfven wavescarrying the current between Io and Jupiter’s ionospheredeposit most of their energy rapidly when they firstencounter the ionosphere. This finding was inconsistentwith the hypothesis of multiply reflecting Alfven waves[e.g., Neubauer, 1980] that had been invoked successfullyto account for the structure observed in Jupiter’s deci-metric radio emissions, which are also driven by theIo-Jupiter interaction.
One of the more important results from the recentHST images is that the maximum emission along thenorthern auroral arc was not found at lIII 5 1808 [Cald-well et al., 1992; Dols et al., 1992; Gerard et al., 1993,1994a, b], as had been inferred from the large aperturespectroscopic studies by IUE [e.g., Livengood et al., 1990,1992; Skinner et al., 1984] and from Voyager observa-tions [Herbert et al., 1987]. As was mentioned above,recent studies have shown that the modulation of Jupi-ter’s auroral FUV emissions in longitude, with maximumnear 1808 in the north and near 208 in the south observedby IUE and Voyager, may be explained by viewing
312 ● Bhardwaj and Gladstone: GIANT PLANET AURORAS 38, 3 / REVIEWS OF GEOPHYSICS

Plate 4. False-color plots of six consecutive HST faint object camera (FOC) FUV images of the northernauroral region of Jupiter, obtained in February 1993. The CML of each exposure is indicated, and the elapsedtime between each exposure was about 90 min [Gerard et al., 1994a, Plate 4]. Reprinted with permission fromElsevier Science.
38, 3 / REVIEWS OF GEOPHYSICS Bhardwaj and Gladstone: GIANT PLANET AURORAS ● 313

geometry effects near the east and west ansa (observedextremities) of the auroral oval, combined with IUEpoint spread function effects [Ballester et al., 1996;Prange et al., 1997a]. These effects also affect the colorratio asymmetry, which had been found to exhibit alongitudinal variation very similar to the brightness vari-ation [Livengood et al., 1990]. However, the color ratiovariation with CML observed with IUE is not solved bygeometry considerations alone. Gerard et al. [1998]present model results in which a fit to the IUE datarequired assuming a methane column abundance abovethe aurora which varied strongly (by factors of 107) withlongitude: A nonvarying atmosphere produces an oppo-site dependence to the IUE results. Prange et al. [1997a]also identified an intrinsic brightness modulation due tothe transit of a bright possibly transpolar emissionaligned along the 1608 meridian across the IUE aper-ture, but with contributions generally smaller than thegeometrical effect (15–30% as much). The FOC imagestaken in a typically strong auroral event also showedsimilar results.
A comprehensive review of the FOC images waspresented very recently by Prange et al. [1998]. Theycharacterize several of the main morphological featuresof the Jovian aurora, including the IFT footprint and“transpolar emission” arc features that are often seen to
stretch from the main oval across the polar cap on itsdusk side, occasionally parallel to the noon-midnightmeridian (see Plate 1). The brightness of the transpolarfeature exhibits considerable variability unrelated tovariations in the brightness of the main oval. Surpris-ingly, these authors suggested that the width of the mainoval could be very narrow (80 6 50 km) with a very highbut variable brightness (up to ;2 MR), implying localparticle precipitation inputs of 10–200 ergs cm22 s21.
Clarke et al. [1996] and Ballester et al. [1996] presentexcellent summaries of our current understanding ofJovian FUV auroral morphology, based on numerousHST wide-field planetary camera 2 (WFPC2) observa-tions. From these data it has been determined that (1)the main north and south auroral ovals are robust fea-tures that are relatively constant in latitude and systemIII longitude, although they undergo large brightnessvariations (occasionally reaching brightnesses of severalmegarayleighs); (2) inside the polar cap there are patchyregions of emission, primarily on the dusk half of theoval; (3) there is a spot of emission equatorward of eachof the main ovals associated with the foot of the IFT;and (4) the north and south auroras exhibit conjugateemission features. The region 908 , lIII , 1508 of themain FUV oval in the north is observed to undergo acurious equatorward shift in latitude, as it rotates from
Plate 5. Plasma pressure with superimposed flow vectors in the equatorial plane at a model time of t 5 225hours. The dark blue region in the center of the plate is inside the inner magnetosphere boundary of thesimulation and is not included in the calculation [Ogino et al., 1998, Plate 2].
314 ● Bhardwaj and Gladstone: GIANT PLANET AURORAS 38, 3 / REVIEWS OF GEOPHYSICS
the morning to the afternoon side of the planet. TheHST images conclusively demonstrate that the mainJovian aurora is connected, not to the Io plasma torusregion as previously believed, but to the middle magne-tosphere L . 12. Much of the structure and variabilityof the aurora is thus likely to be governed by plasmacirculation in the middle and outer magnetospheres, andrecent modeling [e.g., Ogino et al., 1998] suggests thatcommon features of the aurora (e.g., single narrow arcsin the morning, multiple broad arcs in the afternoon)can be explained as the interaction between the regionsof corotation and solar wind–driven convection (seePlate 5).
WFPC2 observations in support of Galileo encoun-ters G1, G2, G7, G8, and C9 were presented recently byClarke et al. [1998]. These images confirm the equator-ward surge of the 1408–1808 region of the main oval as itcrosses local noon. Bright “dawn storms” were describedin which the main oval brightened significantly at a fixedlocal time near the dawn terminator and did not rotatewith system III. Such features indicate that Jupiter’saurora is not entirely driven by corotation in the mag-netosphere but that solar wind–driven convection likelyplays a part as well. Finally, several sightings were madeof a bright IFT footprint, and a few possible sightingswere made of analogous footprints associated with Eu-ropa and Ganymede. The imaging database will con-tinue to improve as more HST/STIS observations aremade (since STIS has much higher FUV sensitivity thanWFPC2), and we can expect that our understanding ofJupiter’s auroral morphology will continue to advancefor some time to come.
3.2.4. Spectroscopy. The first spectroscopic ob-servation of a Jovian aurora with GHRS aboard HSTwas made by Trafton et al. [1994], at the time of theUlysses flyby of Jupiter. The targeted region was Jupi-ter’s north polar region at lIII 5 1808 and latitude 678N,the region near the maximum brightness as derived fromthe IUE observations. The study concentrated on two3.5-nm wavelength intervals centered on 127 nm (125.3–128.7 nm) and 159 nm (157.3–160.7 nm), near emissionpeaks in the H2 Werner and Lyman bands, respectively.The emission spectra were well explained in terms ofexcitation of H2 by electrons except for features at158.07 and 158.37 nm, which were anomalously bright,and two weak features at 158.02 and 158.74 nm, whichwere not present in the synthetic spectrum. From themodel-dependent analysis of the data, Trafton et al.derived an H2 rotational-vibrational temperature of530 6 100 K, showing that the homopause level is hotter(but not necessarily higher) than observed at nonaurorallatitudes. These results, however, were determined for aregion of the aurora poleward of the L 5 30 oval whichwas only moderately bright, and results may differ inregions of stronger or more energetic auroras.
Clarke et al. [1994] also obtained the UV emissionspectrum from Jupiter’s north auroral atmosphere withGHRS/HST, but over the wavelength range 120.4–124.1
nm with 0.057-nm spectral resolution. From the fitting ofthe observed spectra with the synthetic H2 spectra theyderived temperatures from 400–450 to 700–750 K, in-dicating temporal and/or spatial variability in the tem-perature of the auroral emission layer. The emissionswere found to be emanating from the 508–608 latituderange at locations consistent with L 5 6–30 auroralovals.
Using the GHRS, Y. Kim et al. [1995] obtained FUVemission spectra from both polar regions of Jupiter inthe 158.6- to 162-nm wavelength range, which is domi-nated by H2 Lyman band emissions. Two bright spectrawere observed near the western (dusk) limb at latitudes568–588N and CMLs of 1908 and 2038. They derivedintensities and best fit temperatures of ;240 kR and300–400 K, respectively, for the bright regions and;30–120 kR and 200–700 K, respectively, for the fainterregions, with a median temperature of 500 K (i.e., con-sistent with the results of Trafton et al. [1994] and Clarkeet al. [1994] derived using the same type of experimentbut different wavelength ranges). Y. Kim et al. proposedthat the generally lower temperatures in the bright re-gions might indicate that the precipitating particles theremay be penetrating to lower altitudes (i.e., might bemore energetic), where lower temperatures are expecteddue to efficient cooling by hydrocarbons.
A theoretical model, developed by Liu and Dalgarno[1996] to calculate the detailed FUV emission spectra ofH2 due to electron impact in Jupiter’s auroral atmo-sphere, showed that nearly all the GHRS-observed spec-tral features of the Jovian aurora can be reproduced withthe use of accurate molecular parameters (e.g., the re-cent laboratory results of Abgrall et al. [1993a, b, 1997])and the inclusion of the effects of secondary electrons(see Figure 14). They found that the auroral UV spec-trum is not a sensitive indicator of auroral electronenergy because of the similar shape of excitation andionization cross sections of H2 at high energies ($1keV). Liu and Dalgarno derived a temperature for theJovian auroral emission region of 400–600 K and chal-lenged the suggestion of Y. Kim et al. [1995] that therewas a significant correlation between auroral brightnessand input energy flux.
Kim et al. [1997] presented GHRS observations of theJovian aurora in which both short (126–129 nm) andlong (159–162 nm) wavelength H2 emission spectra wereobtained in sequence during the same HST orbits. In-cluding short-wavelength spectra in the observations al-lowed the methane column abundance above the aurorato be determined, along with the ambient H2 rotationaltemperatures. Using updated H2 molecular parameters,Kim et al. confirmed their 1995 result suggesting that thebrightest auroras are indeed the coolest (and thus deep-est) auroras. This trend was supported by the derivedCH4 columns, which were generally larger for the coolerauroras, in keeping with a deeper source region. Therange of inferred temperatures was 400–850 K, and therange of methane column densities was 1–7 3 1016 cm22.
38, 3 / REVIEWS OF GEOPHYSICS Bhardwaj and Gladstone: GIANT PLANET AURORAS ● 315
Morrissey et al. [1997] made measurements of FUVflux and morphology of the north polar aurora of Jupitersimultaneously with the shuttle-based Hopkins Ultravi-olet Telescope (HUT) and WFPC2 on March 9, 1995.The HUT spectra span the wavelength range 90–165nm. The H2 FUV auroral emissions were found from theWFPC2 images to extend over (4.5 6 0.5) 3 10210 sr,resulting in an average brightness of 106 kR integratedover the 90- to 165-nm wavelength band (excludingLyman a) as measured by HUT. The ratio of the totalmean brightness for Lyman a to the 123- to 165-nm bandand for the 123–130 to 155.7–161.9 nm bands indicatedthe energy of (assumed) primary electrons to be 3–30keV, with higher values preferred. The average energydeposition rate was estimated to be 13 ergs cm22 s21,based on an energy conversion efficiency of 0.123 ergscm22 s21 kR21 for 10-keV electrons [Waite et al., 1983].Morrissey et al. also provided upper limits for the sulfuremissions caused by the precipitation of sulfur ions. Theupper limit for S II 125.6-nm brightness (,210 R) wasan order of magnitude lower than that placed by IUE[Waite et al., 1988a]. This implied that any heavy ionprecipitation must be deposited well below the hydro-carbon homopause. Further analysis of the HUT spectraby Wolven and Feldman [1998] demonstrated the pres-ence of strong H2 self-absorption signatures in the 100-to 110-nm region. These features, which are also seen inthe Galileo EUV data [Ajello et al., 1998], may be usedto determine the fraction of vibrationally excited H2 inthe auroral region.
Recently, observations of the Jovian northern auroraat a resolution of about 0.007 nm in the wavelengthrange 121.4–122 nm obtained by using the Goddardhigh-resolution spectrograph (GHRS) aboard the HST[Prange et al., 1997b] have revealed, for the first time, acore reversal of the Lyman a line profile (see Figure 15).This reversal is a common feature of solar and stellarLyman a emission profiles and has been predicted bymodels as a consequence of radiative transfer effects onthe photons produced deep in the auroral atmosphere[e.g., Gladstone, 1982; Prange et al., 1997b], but wasnever previously observed. Preliminary modeling of thewavelength separation between the line peaks of ;0.01and 0.015 nm indicated a vertical H column density ofabout 1.5 3 1016 cm22 above the auroral source, whichis much smaller than the low-latitude H column (;1017
cm22). This is a surprising result, since it is expected thatauroral particle precipitation yields a much larger Hproduction rate than in the nonauroral atmosphere.Another important result from these observations is thatthe lines are somewhat asymmetric (i.e., the two peaksare of different intensity). Either the blue or the redwing may be favored, with significant variation in thepeak intensity ratio (see Figure 15). The center of thereversal coincides with the Lyman a rest wavelength inthe planet’s frame, and the auroral Lyman a photons areshifted by about 0.001–0.002 nm (which corresponds toa few thermal Doppler widths) to either the blue or red
by multiple scattering. Similar to the IUE observationsof Clarke et al. [1989a], these Lyman a profiles alsoexhibited weak wings, which appear nearly symmetricand extend over about 60.15 nm, suggesting emissionfrom an unknown source of very hot H atoms. It seemslikely that the auroral Lyman a line profile asymmetriesare due to vertical gradients in the horizontal velocityfield in the auroral region atmosphere [Gladstone et al.,1998b].
Very recently, initial results from the Galileo EUVSand UVS instruments were presented by Ajello et al.[1998] and Pryor et al. [1998]. The EUVS data, althoughof low signal-to-noise ratio due to a low duty cycle,demonstrate that the precipitating particles must beexciting H2 emissions over a very wide range of altitudes(from 1016 to 1021 cm22 in H2 column density), butprimarily in the 700- to 250-km region (1018–1021 cm22
H2 column density). These results suggest that highspectral resolution observations of the aurora at wave-lengths ,110 nm (where the H2 can be self-absorbed),such as will be possible with the Far Ultraviolet Spec-trographic Explorer (FUSE) mission, will be very fruit-ful. The Galileo UVS data also clearly show C2H2 ab-sorption of the auroral emissions near 152 nm. Atmidultraviolet (MUV) wavelengths the nightside aurora,while very weak (about 8 times dimmer than the simul-taneously observed FUV aurora), was clearly detectedfrom the continuum emission of the H2 a-b dissociationtransition. This is the first detection of the H2 a-bcontinuum emission from any astronomical object. Thiscontinuum peaks in the 200- to 250-nm range, and itsstrength relative to the FUV emissions is consistent withexcitation by 27-eV secondary electrons (somewhatcooler than the 100-eV secondary electrons found toprovide good fits to the FUV auroral emissions).
3.2.5. Identity of precipitating particles. Elec-trons, protons, and heavy ions (oxygen and sulfur ions)or some combination of these have been suggested aspossible candidates for the precipitating particles in Ju-piter’s auroral regions. Electrons are the most com-monly cited primaries responsible to power the aurora.The primary mechanism considered for electron precip-itation is the scattering of electrons into the loss cone bywave-particle interactions [Thorne and Tsurutani, 1979;Coroniti et al., 1980], which is supported by the presenceof whistler mode waves in the Jovian magnetosphere[Gurnett and Scarf, 1983]. Yung et al. [1982] found that
Figure 14. (opposite) Comparisons of HST/GHRS spectraof the Jovian aurora over different FUV wavelength rangeswith best fit model H2 Lyman and Werner band emissionspectra resulting from 1-keV electron impact on H2 at varyingtemperatures [Liu and Dalgarno, 1996, Figures 4, 5, and 3]. (a)Clarke et al. [1994] data, H2 temperature of 500 K. (b) Traftonet al. [1994] data, H2 temperature of 690 K. (c) Y. Kim et al.[1995] data, H2 temperature of 430 K. Reprinted with permis-sion from the American Astronomical Society.
316 ● Bhardwaj and Gladstone: GIANT PLANET AURORAS 38, 3 / REVIEWS OF GEOPHYSICS

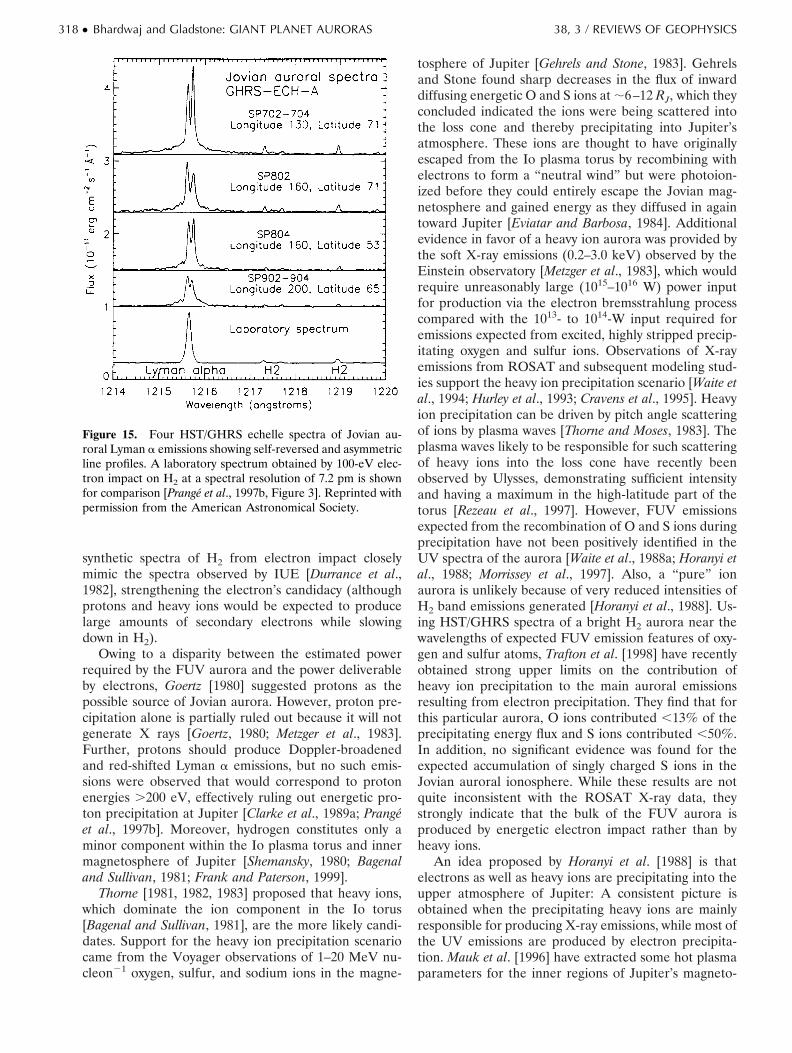
synthetic spectra of H2 from electron impact closelymimic the spectra observed by IUE [Durrance et al.,1982], strengthening the electron’s candidacy (althoughprotons and heavy ions would be expected to producelarge amounts of secondary electrons while slowingdown in H2).
Owing to a disparity between the estimated powerrequired by the FUV aurora and the power deliverableby electrons, Goertz [1980] suggested protons as thepossible source of Jovian aurora. However, proton pre-cipitation alone is partially ruled out because it will notgenerate X rays [Goertz, 1980; Metzger et al., 1983].Further, protons should produce Doppler-broadenedand red-shifted Lyman a emissions, but no such emis-sions were observed that would correspond to protonenergies .200 eV, effectively ruling out energetic pro-ton precipitation at Jupiter [Clarke et al., 1989a; Prangeet al., 1997b]. Moreover, hydrogen constitutes only aminor component within the Io plasma torus and innermagnetosphere of Jupiter [Shemansky, 1980; Bagenaland Sullivan, 1981; Frank and Paterson, 1999].
Thorne [1981, 1982, 1983] proposed that heavy ions,which dominate the ion component in the Io torus[Bagenal and Sullivan, 1981], are the more likely candi-dates. Support for the heavy ion precipitation scenariocame from the Voyager observations of 1–20 MeV nu-cleon21 oxygen, sulfur, and sodium ions in the magne-
tosphere of Jupiter [Gehrels and Stone, 1983]. Gehrelsand Stone found sharp decreases in the flux of inwarddiffusing energetic O and S ions at ;6–12 RJ, which theyconcluded indicated the ions were being scattered intothe loss cone and thereby precipitating into Jupiter’satmosphere. These ions are thought to have originallyescaped from the Io plasma torus by recombining withelectrons to form a “neutral wind” but were photoion-ized before they could entirely escape the Jovian mag-netosphere and gained energy as they diffused in againtoward Jupiter [Eviatar and Barbosa, 1984]. Additionalevidence in favor of a heavy ion aurora was provided bythe soft X-ray emissions (0.2–3.0 keV) observed by theEinstein observatory [Metzger et al., 1983], which wouldrequire unreasonably large (1015–1016 W) power inputfor production via the electron bremsstrahlung processcompared with the 1013- to 1014-W input required foremissions expected from excited, highly stripped precip-itating oxygen and sulfur ions. Observations of X-rayemissions from ROSAT and subsequent modeling stud-ies support the heavy ion precipitation scenario [Waite etal., 1994; Hurley et al., 1993; Cravens et al., 1995]. Heavyion precipitation can be driven by pitch angle scatteringof ions by plasma waves [Thorne and Moses, 1983]. Theplasma waves likely to be responsible for such scatteringof heavy ions into the loss cone have recently beenobserved by Ulysses, demonstrating sufficient intensityand having a maximum in the high-latitude part of thetorus [Rezeau et al., 1997]. However, FUV emissionsexpected from the recombination of O and S ions duringprecipitation have not been positively identified in theUV spectra of the aurora [Waite et al., 1988a; Horanyi etal., 1988; Morrissey et al., 1997]. Also, a “pure” ionaurora is unlikely because of very reduced intensities ofH2 band emissions generated [Horanyi et al., 1988]. Us-ing HST/GHRS spectra of a bright H2 aurora near thewavelengths of expected FUV emission features of oxy-gen and sulfur atoms, Trafton et al. [1998] have recentlyobtained strong upper limits on the contribution ofheavy ion precipitation to the main auroral emissionsresulting from electron precipitation. They find that forthis particular aurora, O ions contributed ,13% of theprecipitating energy flux and S ions contributed ,50%.In addition, no significant evidence was found for theexpected accumulation of singly charged S ions in theJovian auroral ionosphere. While these results are notquite inconsistent with the ROSAT X-ray data, theystrongly indicate that the bulk of the FUV aurora isproduced by energetic electron impact rather than byheavy ions.
An idea proposed by Horanyi et al. [1988] is thatelectrons as well as heavy ions are precipitating into theupper atmosphere of Jupiter: A consistent picture isobtained when the precipitating heavy ions are mainlyresponsible for producing X-ray emissions, while most ofthe UV emissions are produced by electron precipita-tion. Mauk et al. [1996] have extracted some hot plasmaparameters for the inner regions of Jupiter’s magneto-
Figure 15. Four HST/GHRS echelle spectra of Jovian au-roral Lyman a emissions showing self-reversed and asymmetricline profiles. A laboratory spectrum obtained by 100-eV elec-tron impact on H2 at a spectral resolution of 7.2 pm is shownfor comparison [Prange et al., 1997b, Figure 3]. Reprinted withpermission from the American Astronomical Society.
318 ● Bhardwaj and Gladstone: GIANT PLANET AURORAS 38, 3 / REVIEWS OF GEOPHYSICS

sphere from the data sampled by the overdriven LECPexperiment on Voyager 1. They concluded that there isa radial ordering to the different auroral sources atJupiter, with regions of L , 12 responsible principallyfor ion auroras (including X-ray emissions) and regionsof L . 12 responsible principally for electron auroras.This ordering translates into a latitudinal separation inthe auroral emission morphology, with the electron-generated H2 emissions generally at higher latitudes andthe ion-generated X-ray emissions at lower latitudes.Although X-ray observations made until now lack thespatial resolution to distinguish the different regions, theChandra X-ray facility, with 0.50 resolution, should pro-vide data to test this idea.
3.2.6. Auroral haze. The Voyager 2 photopola-rimeter subsystem (PPS) obtained photometric data onJupiter at 240 nm and found dark hazes in the polarregions [Hord et al., 1979]. An analysis of the PPS data byPryor and Hord [1991] found a good correlation in lati-tude between regions of strong auroral H2 band emis-sions and the UV-dark polar regions in both the northand south. It has been suggested by Pryor and Hord thatthe dark haze is formed as a result of auroral ionization,which leads to the breakdown of methane followed bypolymerizing hydrocarbon chemistry, resulting in theformation of UV-dark haze or soot. The model of Sin-ghal et al. [1992] suggested that higher-order hydrocar-bons are formed by homopause-penetrating high-energy(;50–100 keV) input electrons, which could promotethe formation of more complex hydrocarbons or poly-mers. The Singhal et al. [1992] study thus supported theanalysis of Pryor and Hord [1991] that auroral ionizationplays an important role in creating the UV-dark polarhaze on Jupiter. S. Kim et al. [1995] found that thereflected 4-mm continuum, like the reflected UV contin-uum, was also much darker in the polar regions than atequatorial latitudes and suggested condensed benzene(C6H6) and diacetylene (C4H2) as possible haze compo-nents. Gladstone et al. [1996] suggested that polyyne(polyynes are H™C§C™ z z z ™C§C™H polymers) formationinitiated by ion-neutral reactions in the auroral regionsis a likely source for the polar haze observed on Jupiter.
3.3. Visible EmissionsAuroras on Jupiter were also tentatively identified in
the visible region by the imaging experiment on Voyager[Smith et al., 1979]. Cook et al. [1981] concluded that atleast one of the limb emissions seen on the nightside bythe imaging experiment was most probably auroral emis-sion caused by particle precipitation from the Io torus.The total emission rate in the wavelength range 400–600nm was estimated to be ;5 kR (an estimated factor of 4limb enhancement combined with an observed slantintensity of about 20 kR). The double structure observedin the image was attributed by the authors to severalcauses, such as horizontal structure in the auroral emis-sion or the effects of airglow and twilight processes.
Recently, Ingersoll et al. [1998] have presented an
analysis of Galileo solid state imaging (SSI) cameraobservations of Jupiter’s nightside aurora. The very highspatial resolution of the SSI (;40 km pixel21) revealedmuch new information about the aurora, including (1) adirect measurement of the altitude of the aurora (;240km above the 1-bar pressure level), (2) apparent widthsof ,200 km in some cases, and (3) an estimated visibleemitted power of 10–100 GW. Most of the visible emis-sions are thought to be due to the Balmer series ofatomic hydrogen. Ingersoll et al. also report the firstdetection of the IFT footprint at visible wavelengths.They determined a size of about 300 3 500 km for theIFT footprint, with a total radiated power in the visibleof ;0.3 GW.
3.4. Infrared Emissions
3.4.1. Thermal emissions. At wavelengths in therange 3–6 mm, Jupiter’s spectrum changes from re-flected sunlight to thermal emission [Ridgway et al.,1976]. A strong absorption band of methane occurringnear 7.7 mm (the n4 fundamental) was used extensivelyin the pre-Voyager era to investigate the thermal struc-ture of the Jovian stratosphere as a function of latitude,since the weighting functions for this band peak at pres-sures of ;10 mbar [e.g., Orton, 1975]. Most work con-centrated on lower latitudes, where limb-darkeningcurves allowed the extraction of vertical information.However, observing from the NASA 3-m infrared tele-scope facility (IRTF) at Mauna Kea, Hawaii, in 1980,Caldwell et al. [1980] noticed strong and variable polarlimb brightening in meridional scans at 7.7 mm whichcorrelated with CML and suggested that auroral pro-cesses were the most likely explanation. In the northpolar region the methane emissions were brightest atCML ;1708 and were from a distinctly higher latitudethan the Io plasma torus footprint, which at the time wasthe expected location of the UV aurora. Also, no indi-cation of a dependence on Io’s orbital position or systemIII longitude was apparent. In the south the methaneemissions were brightest at CML ;508–608. The emittedflux in the brightened region was estimated to be ;9 ergscm22 s21. The authors noted that even very energeticauroral particle precipitation would be unlikely to reachas deep as the stratospheric regions where the main CH4band arises and that the auroral emissions are probablyexcited higher in the atmosphere. Further IRTF obser-vations in 1981 of the 7.7-mm polar brightenings werereported by Caldwell et al. [1983a]. In addition to con-firming the earlier results, evidence for rapid time vari-ability was found with two consecutive meridional scansthat showed a large change in the north polar emissionover a time interval of only 17 min.
Inspired by these results, Kim et al. [1985] investigatedthe 1979 Voyager 1 infrared interferometer spectrome-ter (IRIS) data for evidence of IR polar brightenings. Bybinning dozens of individual IRIS 7.1- to 16.7-mm spec-tra into four latitude/longitude groups, Kim et al. dis-
38, 3 / REVIEWS OF GEOPHYSICS Bhardwaj and Gladstone: GIANT PLANET AURORAS ● 319
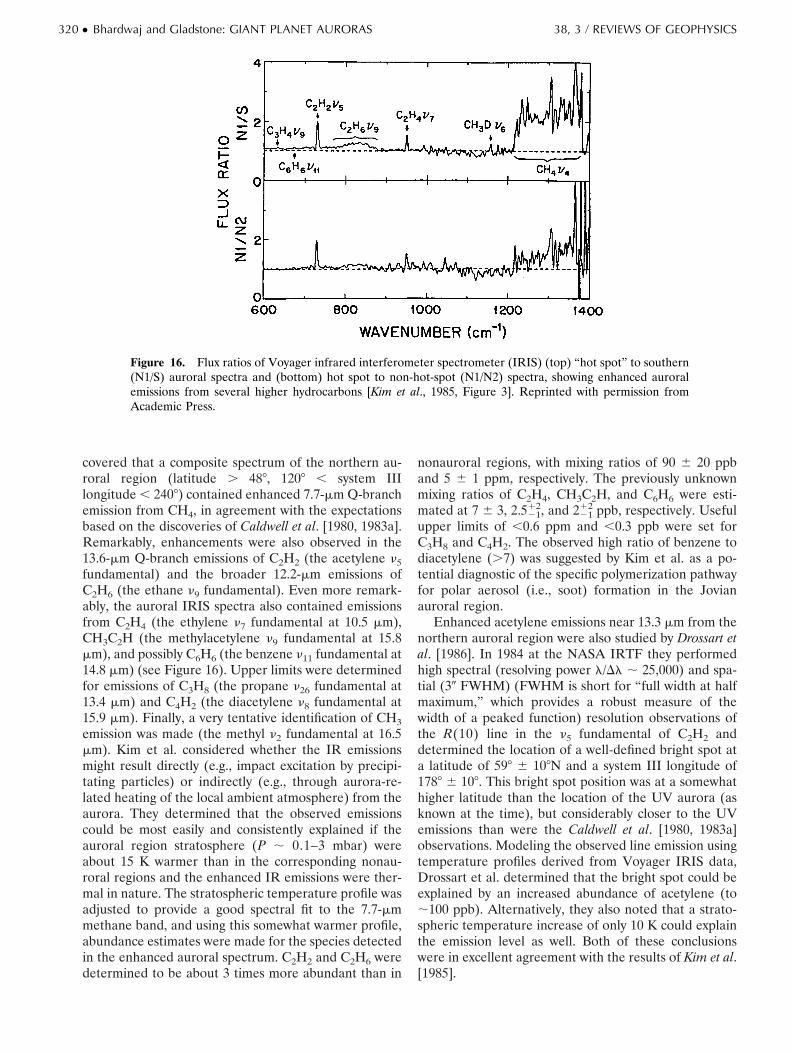
covered that a composite spectrum of the northern au-roral region (latitude . 488, 1208 , system IIIlongitude , 2408) contained enhanced 7.7-mm Q-branchemission from CH4, in agreement with the expectationsbased on the discoveries of Caldwell et al. [1980, 1983a].Remarkably, enhancements were also observed in the13.6-mm Q-branch emissions of C2H2 (the acetylene n5fundamental) and the broader 12.2-mm emissions ofC2H6 (the ethane n9 fundamental). Even more remark-ably, the auroral IRIS spectra also contained emissionsfrom C2H4 (the ethylene n7 fundamental at 10.5 mm),CH3C2H (the methylacetylene n9 fundamental at 15.8mm), and possibly C6H6 (the benzene n11 fundamental at14.8 mm) (see Figure 16). Upper limits were determinedfor emissions of C3H8 (the propane n26 fundamental at13.4 mm) and C4H2 (the diacetylene n8 fundamental at15.9 mm). Finally, a very tentative identification of CH3emission was made (the methyl n2 fundamental at 16.5mm). Kim et al. considered whether the IR emissionsmight result directly (e.g., impact excitation by precipi-tating particles) or indirectly (e.g., through aurora-re-lated heating of the local ambient atmosphere) from theaurora. They determined that the observed emissionscould be most easily and consistently explained if theauroral region stratosphere (P ; 0.1–3 mbar) wereabout 15 K warmer than in the corresponding nonau-roral regions and the enhanced IR emissions were ther-mal in nature. The stratospheric temperature profile wasadjusted to provide a good spectral fit to the 7.7-mmmethane band, and using this somewhat warmer profile,abundance estimates were made for the species detectedin the enhanced auroral spectrum. C2H2 and C2H6 weredetermined to be about 3 times more abundant than in
nonauroral regions, with mixing ratios of 90 6 20 ppband 5 6 1 ppm, respectively. The previously unknownmixing ratios of C2H4, CH3C2H, and C6H6 were esti-mated at 7 6 3, 2.521
12, and 22112 ppb, respectively. Useful
upper limits of ,0.6 ppm and ,0.3 ppb were set forC3H8 and C4H2. The observed high ratio of benzene todiacetylene (.7) was suggested by Kim et al. as a po-tential diagnostic of the specific polymerization pathwayfor polar aerosol (i.e., soot) formation in the Jovianauroral region.
Enhanced acetylene emissions near 13.3 mm from thenorthern auroral region were also studied by Drossart etal. [1986]. In 1984 at the NASA IRTF they performedhigh spectral (resolving power l/Dl ; 25,000) and spa-tial (30 FWHM) (FWHM is short for “full width at halfmaximum,” which provides a robust measure of thewidth of a peaked function) resolution observations ofthe R(10) line in the n5 fundamental of C2H2 anddetermined the location of a well-defined bright spot ata latitude of 598 6 108N and a system III longitude of1788 6 108. This bright spot position was at a somewhathigher latitude than the location of the UV aurora (asknown at the time), but considerably closer to the UVemissions than were the Caldwell et al. [1980, 1983a]observations. Modeling the observed line emission usingtemperature profiles derived from Voyager IRIS data,Drossart et al. determined that the bright spot could beexplained by an increased abundance of acetylene (to;100 ppb). Alternatively, they also noted that a strato-spheric temperature increase of only 10 K could explainthe emission level as well. Both of these conclusionswere in excellent agreement with the results of Kim et al.[1985].
Figure 16. Flux ratios of Voyager infrared interferometer spectrometer (IRIS) (top) “hot spot” to southern(N1/S) auroral spectra and (bottom) hot spot to non-hot-spot (N1/N2) spectra, showing enhanced auroralemissions from several higher hydrocarbons [Kim et al., 1985, Figure 3]. Reprinted with permission fromAcademic Press.
320 ● Bhardwaj and Gladstone: GIANT PLANET AURORAS 38, 3 / REVIEWS OF GEOPHYSICS

Continuing toward higher spectral and spatial resolu-tion, Kostiuk et al. [1987] presented results of an exten-sive survey of two individual C2H6 emission lines (theRR6(14) and RR8(11) lines of the n9 fundamental) overthe disk of Jupiter. These emissions were observed fromKitt Peak in 1982 and 1983 using an IR heterodynespectrometer with a spectral resolving power of 106 anda spatial resolution of 20 FWHM. As with the previousinvestigators, Kostiuk et al. used Voyager IRIS temper-ature profiles appropriate for the observed location onJupiter in simulating their observed line profiles, withthe derived result being C2H6 abundances (assumed tobe constant at P , 100 mbar and zero at higher pres-sures) of 3–5 ppm. (Previous heterodyne observation onthe south polar region [Kostiuk et al., 1983] had yieldeda lower C2H6 mole fraction using older molecular pa-rameters.) Also in agreement with the previous work wasthe fact that the data could be equally well explained bya slightly warmer temperature profile rather than anincrease in hydrocarbon abundance. To explore the au-roral IR variability in more detail, several experimentswere also performed in which the instrument field ofview was left on the CML at 608N while Jupiter rotatedfor about one half hour (;188 of longitude). Remark-ably, in contrast to the results of Caldwell et al. [1980,1983a] for methane and Drossart et al. [1986] for acety-lene, Kostiuk et al. found that the ethane emissions in1983 were observed at all system III longitudes except at1808. The brightest emission was seen at a CML longi-tude of 2348. With higher spatial resolution and betterviewing conditions, Kostiuk et al. [1989] also did notobserve any apparent longitudinal dependence in the1986 C2H6 12-mm emission data. The lack of C2H6emission in a region where both CH4 and C2H2 excessemission is observed led these authors to conclude thatethane must be strongly depleted in the bright spotregion, since any reasonable temperature profile re-sulted in a model amount of stratospheric emission thatwould have been measurable. This also suggested thattemperature increases alone might not be responsiblefor the observed enhancements in the CH4 and C2H2emissions. They suggested that chemical pathways in theauroral stratosphere might lead to the formation of extraC2H2 at the expense of C2H6, though no specific mech-anisms were put forward.
In an effort to learn the morphology of the IR auroral“hot spots” (as they came to be known), Caldwell et al.[1988] performed raster scans of Jupiter in the 7.7-mmmethane emission during 1984–1986. The instantaneousfield of view of the instrument was 20 FWHM, and 55 355 pixel images were obtained over a 42-min period. Thelocation of the northern auroral hot spot was found to beextremely stable, appearing consistently brightest at alatitude of 598N and a system III longitude of 1798,though at many different local times. A single nondetec-tion out of 19 observations occurred on September 5,1985, for unknown reasons. The northern hot spot di-mensions were about ;408 (25,000 km) in longitude and
;88 (9100 km) in latitude. The extended range in lon-gitude suggested that the hot spot was being smeared outby zonal winds. In marked contrast to the stable north-ern hot spot, the location of the brightest 7.7-mm emis-sion in the southern aurora constantly changed its loca-tion. In one pair of images taken 90 min apart thesouthern hot spot changed location by 278 in longitude.During three different observation epochs the southernhot spot was found to drift at various rates relative tosystem III, sometimes moving at the drift rate of thesubsolar point and other times drifting more slowly, atabout half the apparent solar rate. The southern polarhot spot was found at all possible locations of Io aroundJupiter, and its position was not directly correlated withIo’s position.
Halthore et al. [1988] used the Voyager 1 IRIS data tostudy longitudinal asymmetry in the emissions of thethree major hydrocarbons, CH4 (7.8 mm), C2H2 (13.6mm), and C2H6 (12.6 mm), near 608 north latitude.Considerably increased emission was observed for CH4and C2H2 around the hot spot (lIII ; 1808), but nosignificant increase was observed in ethane emission (seeFigure 17). They interpreted the longitudinal asymmetryof the emissions as a result of the relative motion be-tween the stratosphere and the location of energy dep-osition due to precipitating auroral particles. Using athermal equilibrium model, Halthore et al. estimated anauroral stratospheric zonal wind velocity of 0.6 km h21.An increase in the temperature of the auroral hot spotregion by 50 K was required to explain the intensity ofCH4 emission. However, this temperature enhancementcould not satisfy the measured C2H2 and C2H6 emis-
Figure 17. Voyager IRIS measurements (circles) of auroralemissions of CH4 (top curve), C2H2 (middle curve), and C2H6
(bottom curve), compared with best fit models based on atwo-parameter fit using a combination of zonal wind speed,radiative time constant, and auroral/nonauroral emissionstrength [Halthore et al., 1988, Figure 3]. Reprinted with per-mission from Academic Press.
38, 3 / REVIEWS OF GEOPHYSICS Bhardwaj and Gladstone: GIANT PLANET AURORAS ● 321
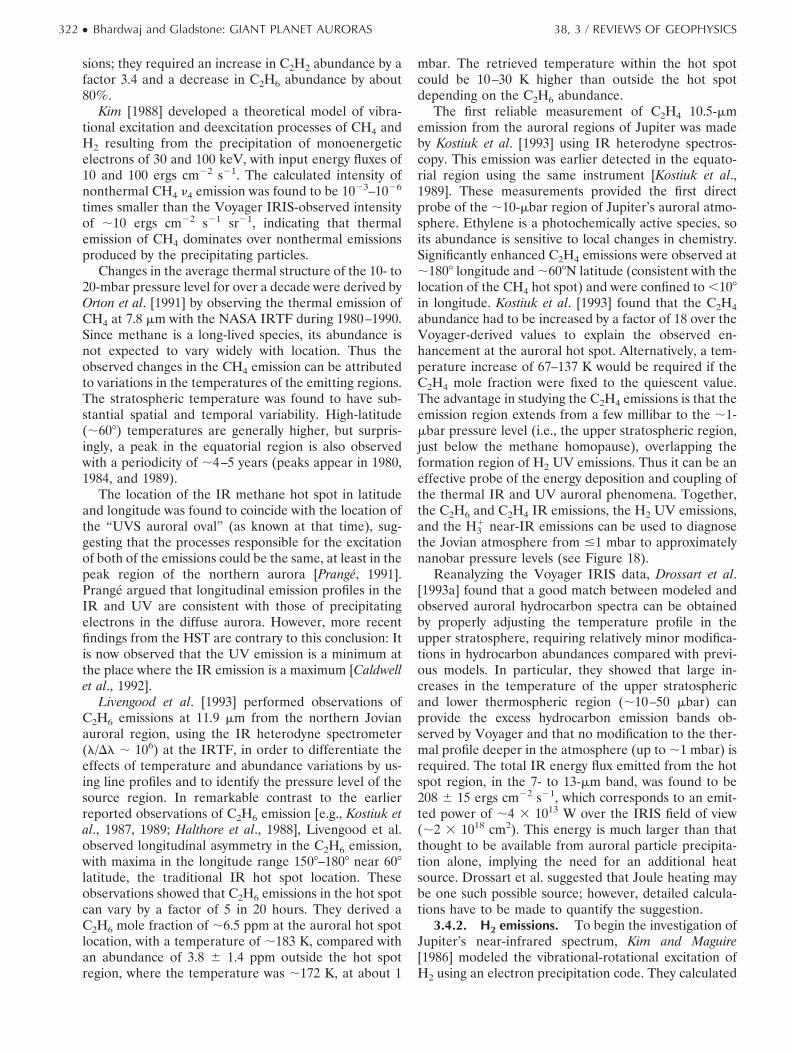
sions; they required an increase in C2H2 abundance by afactor 3.4 and a decrease in C2H6 abundance by about80%.
Kim [1988] developed a theoretical model of vibra-tional excitation and deexcitation processes of CH4 andH2 resulting from the precipitation of monoenergeticelectrons of 30 and 100 keV, with input energy fluxes of10 and 100 ergs cm22 s21. The calculated intensity ofnonthermal CH4 n4 emission was found to be 1023–1026
times smaller than the Voyager IRIS-observed intensityof ;10 ergs cm22 s21 sr21, indicating that thermalemission of CH4 dominates over nonthermal emissionsproduced by the precipitating particles.
Changes in the average thermal structure of the 10- to20-mbar pressure level for over a decade were derived byOrton et al. [1991] by observing the thermal emission ofCH4 at 7.8 mm with the NASA IRTF during 1980–1990.Since methane is a long-lived species, its abundance isnot expected to vary widely with location. Thus theobserved changes in the CH4 emission can be attributedto variations in the temperatures of the emitting regions.The stratospheric temperature was found to have sub-stantial spatial and temporal variability. High-latitude(;608) temperatures are generally higher, but surpris-ingly, a peak in the equatorial region is also observedwith a periodicity of ;4–5 years (peaks appear in 1980,1984, and 1989).
The location of the IR methane hot spot in latitudeand longitude was found to coincide with the location ofthe “UVS auroral oval” (as known at that time), sug-gesting that the processes responsible for the excitationof both of the emissions could be the same, at least in thepeak region of the northern aurora [Prange, 1991].Prange argued that longitudinal emission profiles in theIR and UV are consistent with those of precipitatingelectrons in the diffuse aurora. However, more recentfindings from the HST are contrary to this conclusion: Itis now observed that the UV emission is a minimum atthe place where the IR emission is a maximum [Caldwellet al., 1992].
Livengood et al. [1993] performed observations ofC2H6 emissions at 11.9 mm from the northern Jovianauroral region, using the IR heterodyne spectrometer(l/Dl ; 106) at the IRTF, in order to differentiate theeffects of temperature and abundance variations by us-ing line profiles and to identify the pressure level of thesource region. In remarkable contrast to the earlierreported observations of C2H6 emission [e.g., Kostiuk etal., 1987, 1989; Halthore et al., 1988], Livengood et al.observed longitudinal asymmetry in the C2H6 emission,with maxima in the longitude range 1508–1808 near 608latitude, the traditional IR hot spot location. Theseobservations showed that C2H6 emissions in the hot spotcan vary by a factor of 5 in 20 hours. They derived aC2H6 mole fraction of ;6.5 ppm at the auroral hot spotlocation, with a temperature of ;183 K, compared withan abundance of 3.8 6 1.4 ppm outside the hot spotregion, where the temperature was ;172 K, at about 1
mbar. The retrieved temperature within the hot spotcould be 10–30 K higher than outside the hot spotdepending on the C2H6 abundance.
The first reliable measurement of C2H4 10.5-mmemission from the auroral regions of Jupiter was madeby Kostiuk et al. [1993] using IR heterodyne spectros-copy. This emission was earlier detected in the equato-rial region using the same instrument [Kostiuk et al.,1989]. These measurements provided the first directprobe of the ;10-mbar region of Jupiter’s auroral atmo-sphere. Ethylene is a photochemically active species, soits abundance is sensitive to local changes in chemistry.Significantly enhanced C2H4 emissions were observed at;1808 longitude and ;608N latitude (consistent with thelocation of the CH4 hot spot) and were confined to ,108in longitude. Kostiuk et al. [1993] found that the C2H4abundance had to be increased by a factor of 18 over theVoyager-derived values to explain the observed en-hancement at the auroral hot spot. Alternatively, a tem-perature increase of 67–137 K would be required if theC2H4 mole fraction were fixed to the quiescent value.The advantage in studying the C2H4 emissions is that theemission region extends from a few millibar to the ;1-mbar pressure level (i.e., the upper stratospheric region,just below the methane homopause), overlapping theformation region of H2 UV emissions. Thus it can be aneffective probe of the energy deposition and coupling ofthe thermal IR and UV auroral phenomena. Together,the C2H6 and C2H4 IR emissions, the H2 UV emissions,and the H3
1 near-IR emissions can be used to diagnosethe Jovian atmosphere from #1 mbar to approximatelynanobar pressure levels (see Figure 18).
Reanalyzing the Voyager IRIS data, Drossart et al.[1993a] found that a good match between modeled andobserved auroral hydrocarbon spectra can be obtainedby properly adjusting the temperature profile in theupper stratosphere, requiring relatively minor modifica-tions in hydrocarbon abundances compared with previ-ous models. In particular, they showed that large in-creases in the temperature of the upper stratosphericand lower thermospheric region (;10–50 mbar) canprovide the excess hydrocarbon emission bands ob-served by Voyager and that no modification to the ther-mal profile deeper in the atmosphere (up to ;1 mbar) isrequired. The total IR energy flux emitted from the hotspot region, in the 7- to 13-mm band, was found to be208 6 15 ergs cm22 s21, which corresponds to an emit-ted power of ;4 3 1013 W over the IRIS field of view(;2 3 1018 cm2). This energy is much larger than thatthought to be available from auroral particle precipita-tion alone, implying the need for an additional heatsource. Drossart et al. suggested that Joule heating maybe one such possible source; however, detailed calcula-tions have to be made to quantify the suggestion.
3.4.2. H2 emissions. To begin the investigation ofJupiter’s near-infrared spectrum, Kim and Maguire[1986] modeled the vibrational-rotational excitation ofH2 using an electron precipitation code. They calculated
322 ● Bhardwaj and Gladstone: GIANT PLANET AURORAS 38, 3 / REVIEWS OF GEOPHYSICS

the line intensities of 2-mm quadrupole emissions fromH2 and suggested that they were strong enough to beobserved with ground-based telescopes. Following thesuccess of the thermal IR auroral observations of Jupi-ter, Trafton et al. [1988] followed the suggestion of Kimand Maguire [1986] and searched for H2 quadrupoleemission at 2.1 mm. They were only able to establish amarginal detection of the S1(1) line of H2 near the northpole around 1808 longitude. Further observations attwice the spectral resolution were obtained by Trafton etal. [1989b], which confirmed their earlier results, andalso showed the presence of H2 S1(1) emission at thesouthern pole, with intensities only ;3–12% of Kim andMaguire’s predicted value.
Observing at higher spectral resolution, Kim et al.[1990] detected the S1(0), S1(1), and S1(2) emissionlines of H2, the three quadrupole lines of the 1-0 vibra-tional-rotational band, from Jupiter’s southern auroralzone using the Canada-France-Hawaii Telescope(CFHT) Fourier transform spectrometer (FTS). Kim etal. derived a rotational temperature of 7302200
1490 K in thepressure range 1–0.01 mbar, using the observed 2-mmquadrupole line brightnesses, which were found to bemostly nonthermal in nature. Thus the detection of the2-mm quadrupole lines provided a new method of deriv-ing the temperature of the high stratosphere (#1 mbar)of the Jovian auroral zones. Kim et al. [1990] also usedthe 2-mm line emissions of H2 to study the distribution ofpolar haze on Jupiter. Using a model spectrum, theyfound the haze to be widely distributed in both the polarregions, with no particular association with auroral ac-tivity, and located mainly in the pressure range of 5–70mbar for optically thin haze models.
3.4.3. H31 emissions. While observing the 2.1-mm
H2 quadrupole emissions at very high spectral resolutionon September 24, 1988, Drossart et al. [1989] made theserendipitous discovery of H3
1 2n2 band emission fromJupiter’s aurora. The same emissions had also beenobserved at lower resolution, although they had not beenidentified, somewhat earlier by Trafton et al. [1989a]. Byfitting the intensities of the ;25 individual lines detectedwithin the 2.08- to 2.17-mm band pass of the Fouriertransform spectrometer (FTS) at the CFHT from theJovian southern auroral region, Drossart et al. [1989]determined a rotational temperature of 1100 6 100 Kfor the H3
1 emissions. It was not possible to determinewhether the emission process was thermal or nonther-mal (possibly due to either nascent (i.e., prompt) emis-sions during the formation of H3
1 or preferential excita-tion of the 2n2 level through a resonant exchange withH2(v 5 1)).
H31 emissions had been searched for in astronomical
sources for nearly 10 years prior to their discovery onJupiter, and interesting recountings of the Jovian iden-tification and early observations are given by Oka [1992]and Miller et al. [1994]. The H3
1 ion as an importantcomponent of the Jovian ionosphere has long been pre-dicted by models [e.g., Atreya and Donahue, 1976; Strobel
and Atreya, 1983; McConnell and Majeed, 1987], and itspresence in the Jovian magnetosphere was inferred byVoyager observations [Hamilton et al., 1980]. More re-cent observations (by the heliosphere instrument forspectra, composition, and anisotropy and low energies(HI-SCALE) and energetic particles composition(EPAC) instruments) from the Ulysses spacecraft haveconfirmed the presence of H3
1 ions in the magneto-sphere of Jupiter, especially at high magnetic latitudes,where they are being accelerated out of the topsideionosphere [Lanzerotti et al., 1993; Seidel et al., 1997].
After the 2n2 overtone band was discovered, it wasnatural to look for the fundamental n2 band emission at;4 mm, and it was very quickly discovered by Oka andGeballe [1990] and Miller et al. [1990]. The 4-mm emis-sions were observed to be much brighter than the2.1-mm emissions, and Miller et al. [1990] further deter-mined that the vibrational and rotational temperatureswere equal, making it seem that the H3
1 emissions wereprimarily thermal in origin. It was also clear from theseinitial studies that the H3
1 emissions were highly timevariable in brightness and derived temperature (Oka andGeballe [1990] derived a rotational temperature of 670K, while the Miller et al. [1990] result was identical to theDrossart et al. [1989] value of 1100 K). Maillard et al.[1990] presented FTS observations of both the north andsouth auroral regions and found the southern 4-mmaurora to be about twice as bright as in the north, withrotational temperatures of 1000 6 40 and 830 6 50 K,respectively. Their high-resolution spectrum showed
Figure 18. The pressure regions of origin for several impor-tant Jovian IR and UV auroral emissions [Kostiuk et al., 1993,Figure 11]. The dashed, dash-dotted, and solid lines show thederived temperature profiles for nonauroral emissions, C2H6
auroral emissions, and C2H4 emissions, respectively.
38, 3 / REVIEWS OF GEOPHYSICS Bhardwaj and Gladstone: GIANT PLANET AURORAS ● 323

that the 3.45- to 4.17-mm region was totally dominatedby H3
1 emission, with almost no background, which isdue to the fortuitous placement of a CH4 absorptionband in the colder stratosphere underneath the iono-sphere (see Figure 19). This study also, like that of Milleret al. [1990], suggested that the H3
1 emissions are ther-mally produced.
Not long after the spectrometer results were ob-tained, the infrared camera ProtoCAM was used atIRTF in early 1991 to produce the first images of the H3
1
4-mm emissions [Kim et al., 1991; Baron et al., 1991].Both studies found strong spatial and temporal variabil-ity, as expected for auroral emissions, but found nonorthern bright spot at the expected location (near 1808)expected from the previous ;10 years of 7.8-mm obser-
vations. This suggested that the precipitating particlesresponsible for the hot spot were depositing most oftheir energy below the homopause around the 1808longitude. These observations also showed that there areother background emissions at these wavelengths, par-ticularly the CH4 emissions, whose contributions may besubstantial. However, the effect of CH4 emission waslater estimated to be less than 10% [Kim et al., 1993].The reason is that at the temperatures normally prevail-ing in the Jovian stratosphere, the predicted intensity ofthe n3 band of CH4 is 1–3 orders of magnitude smallerthan could be detected by the IR spectrometers[Halthore et al., 1994].
A different followup study of the data reported byKim et al. [1991] was performed by Drossart et al. [1992].
Figure 19. High-resolution Fourier transform spectrometer (FTS) spectrum of Jovian auroral H31 emissions
obtained in November 1989 from the Canada-France-Hawaii Telescope (CFHT) [Maillard et al., 1990, Figure1]. A 5-inch-diameter aperture was used, centered on 608S and 408 CML. Reprinted with permission from theAmerican Astronomical Society.
324 ● Bhardwaj and Gladstone: GIANT PLANET AURORAS 38, 3 / REVIEWS OF GEOPHYSICS
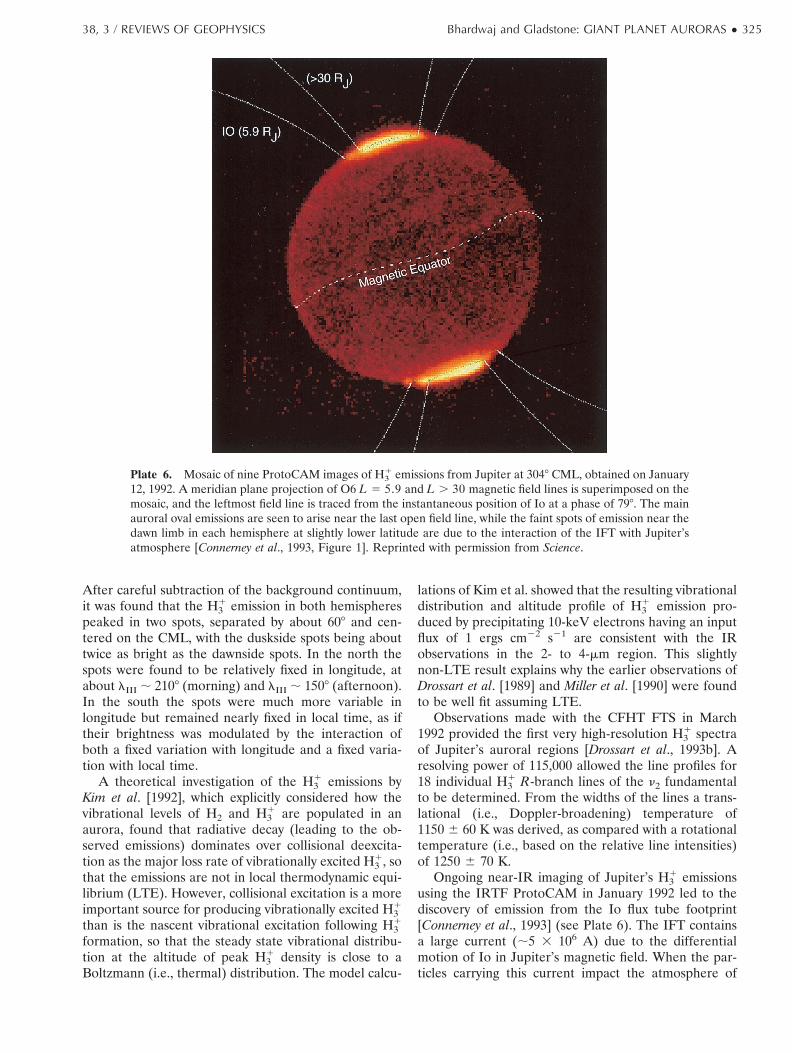
After careful subtraction of the background continuum,it was found that the H3
1 emission in both hemispherespeaked in two spots, separated by about 608 and cen-tered on the CML, with the duskside spots being abouttwice as bright as the dawnside spots. In the north thespots were found to be relatively fixed in longitude, atabout lIII ; 2108 (morning) and lIII ; 1508 (afternoon).In the south the spots were much more variable inlongitude but remained nearly fixed in local time, as iftheir brightness was modulated by the interaction ofboth a fixed variation with longitude and a fixed varia-tion with local time.
A theoretical investigation of the H31 emissions by
Kim et al. [1992], which explicitly considered how thevibrational levels of H2 and H3
1 are populated in anaurora, found that radiative decay (leading to the ob-served emissions) dominates over collisional deexcita-tion as the major loss rate of vibrationally excited H3
1, sothat the emissions are not in local thermodynamic equi-librium (LTE). However, collisional excitation is a moreimportant source for producing vibrationally excited H3
1
than is the nascent vibrational excitation following H31
formation, so that the steady state vibrational distribu-tion at the altitude of peak H3
1 density is close to aBoltzmann (i.e., thermal) distribution. The model calcu-
lations of Kim et al. showed that the resulting vibrationaldistribution and altitude profile of H3
1 emission pro-duced by precipitating 10-keV electrons having an inputflux of 1 ergs cm22 s21 are consistent with the IRobservations in the 2- to 4-mm region. This slightlynon-LTE result explains why the earlier observations ofDrossart et al. [1989] and Miller et al. [1990] were foundto be well fit assuming LTE.
Observations made with the CFHT FTS in March1992 provided the first very high-resolution H3
1 spectraof Jupiter’s auroral regions [Drossart et al., 1993b]. Aresolving power of 115,000 allowed the line profiles for18 individual H3
1 R-branch lines of the n2 fundamentalto be determined. From the widths of the lines a trans-lational (i.e., Doppler-broadening) temperature of1150 6 60 K was derived, as compared with a rotationaltemperature (i.e., based on the relative line intensities)of 1250 6 70 K.
Ongoing near-IR imaging of Jupiter’s H31 emissions
using the IRTF ProtoCAM in January 1992 led to thediscovery of emission from the Io flux tube footprint[Connerney et al., 1993] (see Plate 6). The IFT containsa large current (;5 3 106 A) due to the differentialmotion of Io in Jupiter’s magnetic field. When the par-ticles carrying this current impact the atmosphere of
Plate 6. Mosaic of nine ProtoCAM images of H31 emissions from Jupiter at 3048 CML, obtained on January
12, 1992. A meridian plane projection of O6 L 5 5.9 and L . 30 magnetic field lines is superimposed on themosaic, and the leftmost field line is traced from the instantaneous position of Io at a phase of 798. The mainauroral oval emissions are seen to arise near the last open field line, while the faint spots of emission near thedawn limb in each hemisphere at slightly lower latitude are due to the interaction of the IFT with Jupiter’satmosphere [Connerney et al., 1993, Figure 1]. Reprinted with permission from Science.
38, 3 / REVIEWS OF GEOPHYSICS Bhardwaj and Gladstone: GIANT PLANET AURORAS ● 325

Jupiter, an auroral-like spot of emission is produced.Connerney et al. found that the total H3
1 flux associatedwith the IFT footprint was about 4.3 3 10219 W cm22
mm21, or about 0.3–1% of the total auroral flux. Theemissions from the IFT footprint provide a very useful“fiducial mark” for magnetosphere models, since al-
though the longitude of the emission may vary accordingto the dynamics of the IFT, the latitude of the spot mapsout the L shell of Io at 5.9 RJ.
Kim et al. [1994] analyzed ProtoCAM observations ofthe Jovian aurora from March 1992 and determined thatthe emissions formed a continuous auroral oval near the
Plate 7. Map of (a) fitted temperature (kelvins) and (b) column density (1012 cm22) as a function of Jovianlatitude and longitude, based on CML scans of H3
1 emissions [Lam et al., 1997a, Figures 4 and 5]. Reprintedwith permission from Icarus.
326 ● Bhardwaj and Gladstone: GIANT PLANET AURORAS 38, 3 / REVIEWS OF GEOPHYSICS
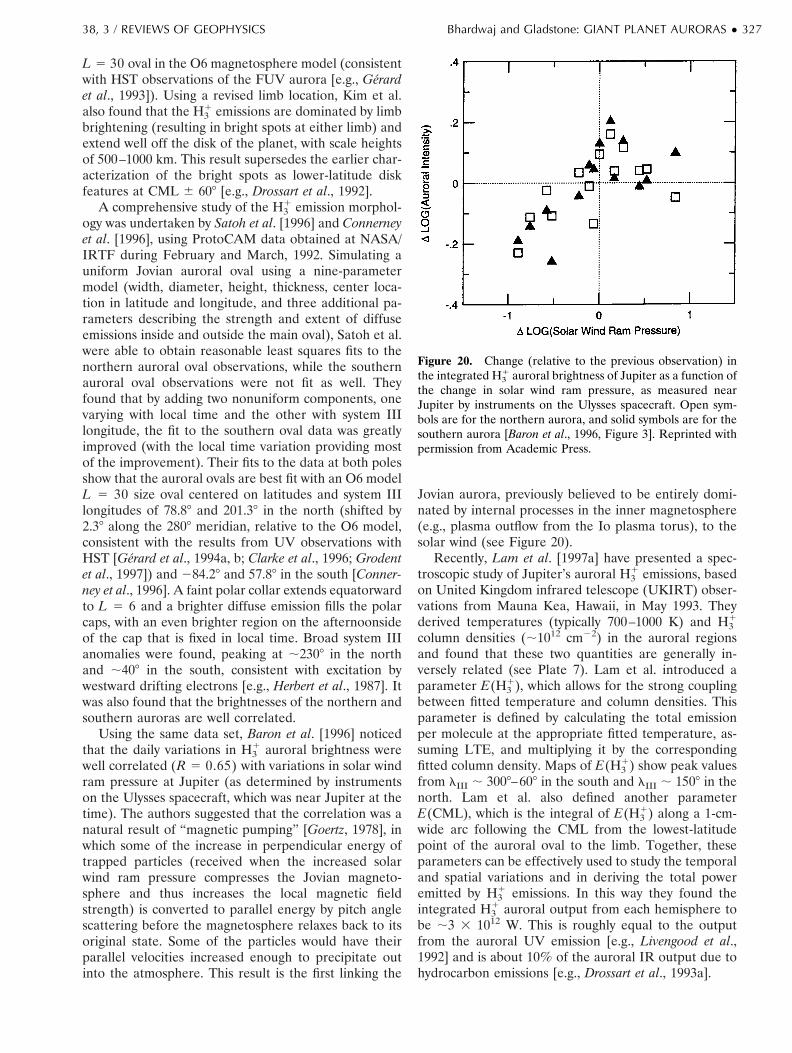
L 5 30 oval in the O6 magnetosphere model (consistentwith HST observations of the FUV aurora [e.g., Gerardet al., 1993]). Using a revised limb location, Kim et al.also found that the H3
1 emissions are dominated by limbbrightening (resulting in bright spots at either limb) andextend well off the disk of the planet, with scale heightsof 500–1000 km. This result supersedes the earlier char-acterization of the bright spots as lower-latitude diskfeatures at CML 6 608 [e.g., Drossart et al., 1992].
A comprehensive study of the H31 emission morphol-
ogy was undertaken by Satoh et al. [1996] and Connerneyet al. [1996], using ProtoCAM data obtained at NASA/IRTF during February and March, 1992. Simulating auniform Jovian auroral oval using a nine-parametermodel (width, diameter, height, thickness, center loca-tion in latitude and longitude, and three additional pa-rameters describing the strength and extent of diffuseemissions inside and outside the main oval), Satoh et al.were able to obtain reasonable least squares fits to thenorthern auroral oval observations, while the southernauroral oval observations were not fit as well. Theyfound that by adding two nonuniform components, onevarying with local time and the other with system IIIlongitude, the fit to the southern oval data was greatlyimproved (with the local time variation providing mostof the improvement). Their fits to the data at both polesshow that the auroral ovals are best fit with an O6 modelL 5 30 size oval centered on latitudes and system IIIlongitudes of 78.88 and 201.38 in the north (shifted by2.38 along the 2808 meridian, relative to the O6 model,consistent with the results from UV observations withHST [Gerard et al., 1994a, b; Clarke et al., 1996; Grodentet al., 1997]) and 284.28 and 57.88 in the south [Conner-ney et al., 1996]. A faint polar collar extends equatorwardto L 5 6 and a brighter diffuse emission fills the polarcaps, with an even brighter region on the afternoonsideof the cap that is fixed in local time. Broad system IIIanomalies were found, peaking at ;2308 in the northand ;408 in the south, consistent with excitation bywestward drifting electrons [e.g., Herbert et al., 1987]. Itwas also found that the brightnesses of the northern andsouthern auroras are well correlated.
Using the same data set, Baron et al. [1996] noticedthat the daily variations in H3
1 auroral brightness werewell correlated (R 5 0.65) with variations in solar windram pressure at Jupiter (as determined by instrumentson the Ulysses spacecraft, which was near Jupiter at thetime). The authors suggested that the correlation was anatural result of “magnetic pumping” [Goertz, 1978], inwhich some of the increase in perpendicular energy oftrapped particles (received when the increased solarwind ram pressure compresses the Jovian magneto-sphere and thus increases the local magnetic fieldstrength) is converted to parallel energy by pitch anglescattering before the magnetosphere relaxes back to itsoriginal state. Some of the particles would have theirparallel velocities increased enough to precipitate outinto the atmosphere. This result is the first linking the
Jovian aurora, previously believed to be entirely domi-nated by internal processes in the inner magnetosphere(e.g., plasma outflow from the Io plasma torus), to thesolar wind (see Figure 20).
Recently, Lam et al. [1997a] have presented a spec-troscopic study of Jupiter’s auroral H3
1 emissions, basedon United Kingdom infrared telescope (UKIRT) obser-vations from Mauna Kea, Hawaii, in May 1993. Theyderived temperatures (typically 700–1000 K) and H3
1
column densities (;1012 cm22) in the auroral regionsand found that these two quantities are generally in-versely related (see Plate 7). Lam et al. introduced aparameter E(H3
1), which allows for the strong couplingbetween fitted temperature and column densities. Thisparameter is defined by calculating the total emissionper molecule at the appropriate fitted temperature, as-suming LTE, and multiplying it by the correspondingfitted column density. Maps of E(H3
1) show peak valuesfrom lIII ; 3008–608 in the south and lIII ; 1508 in thenorth. Lam et al. also defined another parameterE(CML), which is the integral of E(H3
1) along a 1-cm-wide arc following the CML from the lowest-latitudepoint of the auroral oval to the limb. Together, theseparameters can be effectively used to study the temporaland spatial variations and in deriving the total poweremitted by H3
1 emissions. In this way they found theintegrated H3
1 auroral output from each hemisphere tobe ;3 3 1012 W. This is roughly equal to the outputfrom the auroral UV emission [e.g., Livengood et al.,1992] and is about 10% of the auroral IR output due tohydrocarbon emissions [e.g., Drossart et al., 1993a].
Figure 20. Change (relative to the previous observation) inthe integrated H3
1 auroral brightness of Jupiter as a function ofthe change in solar wind ram pressure, as measured nearJupiter by instruments on the Ulysses spacecraft. Open sym-bols are for the northern aurora, and solid symbols are for thesouthern aurora [Baron et al., 1996, Figure 3]. Reprinted withpermission from Academic Press.
38, 3 / REVIEWS OF GEOPHYSICS Bhardwaj and Gladstone: GIANT PLANET AURORAS ● 327
Most recently, Rego et al. [1999] presented excellenthigh spectral resolution (14.4 km s21) observations ofH3
1 lines at 3.95251 and 3.95416 mm along the centralmeridian of Jupiter (at ;0.80 spatial resolution), takenwith the IRTF CSHELL instrument (an Echelle spec-trograph). The signal-to-noise ratio of the data was largeenough for the emission lines to be centroided to anaccuracy of 60.3 km s21, and Doppler shifts of up to;63 km s21 were discovered. These Doppler shifts arebest explained as due to the line-of-sight projection oflarge auroral region ion winds in the upper atmosphere,known (as on Earth) as the auroral electrojet. Thesewinds must have true velocities approaching or exceed-ing the speed of sound (;3 km s21) and are probablyalso responsible for driving the neutral winds that arethought to result in the asymmetric Lyman a auroral lineprofiles described earlier. Thus there are now two inde-pendent means for remote study of the dynamics of theviolent upper atmosphere of Jupiter; hopefully, thesemethods will also prove fruitful for the other giant planets.
The Jovian H31 emissions are not confined to the
auroral zones alone; they have been detected from theentire disk of the planet [Ballester et al., 1994; Lam et al.,1997a; Miller et al., 1994, 1997a]. These emissions aretypically only about 10% as bright as those observed inthe polar regions. These nonauroral emissions occur intwo midlatitude bands (one in each hemisphere), wherethe temperatures are relatively lower (;100–300 K lessthan in the polar regions), and in the equatorial region,where the temperatures are high. The H3
1 column den-sities are also lower in the subauroral latitudes (;1011
cm23). The study by Miller et al. [1997a] demonstratedthat the emission level of H3
1 in the middle- to low-latitude region is ;0.1 ergs cm22 s21, indicating thestrong cooling effect due to the H3
1 ions. This high levelof H3
1 emission and its latitudinal profile cannot beexplained by solar EUV input alone. The authors sug-gested the possible causes could be transport of auroralH3
1 to lower latitudes by atmospheric winds and/or theprecipitation of particles at low latitudes (as also indi-cated by recent X-ray observations [Waite et al., 1997]and supported by Galileo probe data from the energeticparticles instrument (EPI) experiment [Fischer et al.,1996] and Ulysses observations [Rezeau et al., 1997]).The observations of H3
1 at low latitudes are also shownto have links to other low-latitude phenomena, such asthe Lyman a bulge [Ballester et al., 1994; Miller et al.,1997a].
The H31 emissions were also used to monitor the
comet Shoemaker-Levy 9 (SL-9) collision with Jupiter[e.g., Orton et al., 1995; Encrenaz et al., 1995; Kim et al.,1996; Dinelli et al., 1997; Miller et al., 1997b]. During aweek in July 1994, twenty-one fragments of comet SL-9plunged into Jupiter around 448S latitude. Observationsof the auroral regions both during and after the impactsgave a number of interesting and unexpected results.Readers are referred to special issues of Science (267,1277–1323, March 1995), Geophysical Research Letters
(22(12), 1555–1636, 1995; 22(13), 1761–1840, 1995; and22(17), 2413–2440, 1995), Icarus (121, 207–510, 1996),and to West and Bohnhardt [1995] and Noll et al. [1996],where various aspects of the observations of the SL-9/Jupiter collision and results are presented and discussed.A chronological history of the effects of the SL-9/Jupitercollision on the Jovian auroral emissions, starting from 5hours before the impact to about 10 days after theimpact week, is given by Miller et al. [1997b]. One of themost interesting results was that the images taken at 3.5mm during the week of collision showed the north andsouth polar intensities at about the same level, whileabout a week after the last impact, the southern aurorahad significantly dimmed and the northern aurora be-came ;5 times brighter than normal. This effect lastedfor about a week before returning to normal.
4. SATURN
4.1. X-Ray EmissionsSince the Saturnian magnetosphere possesses sub-
stantial fluxes of energetic electrons and ions, it wasexpected that Saturn might be a source of X-ray emis-sions. However, probably due to the nondetection of Xrays from Jupiter in early attempts, no attempt was madeto observe X-ray photons from Saturn.
During the Voyager 1 flyby of Saturn the LECPexperiment detected emission in excess of the back-ground radiation emanating from the vicinity of Saturn,upstream from the bow shock [Kirsch et al., 1981b],similar to the detections at Jupiter [Kirsch et al., 1981a].Although the LECP was not equipped for the detectionof X rays, the possibility that these excess counts may bedue to X-ray radiation produced by the precipitatingmagnetospheric energetic electrons in the auroral regionor through interaction with rings and satellites was con-sidered. The requirement of very large fluxes of precip-itating electrons, by a factor of 103–104 compared withthe maximum flux measured by the same LECP instru-ment in the Saturnian magnetosphere, led Kirsch et al.[1981b] to conclude that the observed excess emissionsare probably not due to X rays from Saturn but toenergetic neutrals (as at Jupiter). Such neutrals areexpected to be emitted from Saturn’s inner magneto-sphere, being produced by charge exchange reactionsbetween radiation belt ions and the neutral corona[Kirsch et al., 1981a, b; Cheng, 1986].
Prompted by the first detection of X rays from Jupiter[Metzger et al., 1983], Gilman et al. [1986] made the firstsystematic attempt to measure X-ray emissions fromSaturn using the Einstein observatory. No X-ray emis-sions from Saturn were detected. The 3s upper limit ofthe flux at Earth was found to be ;2–5 3 10213 ergscm22 s21, depending on whether ion precipitation (high-er value) or electron bremsstrahlung (lower limit) is thesource. For bremsstrahlung from keV electrons precip-itating into Saturn’s atmosphere and satisfying observed
328 ● Bhardwaj and Gladstone: GIANT PLANET AURORAS 38, 3 / REVIEWS OF GEOPHYSICS

UV aurora constraints, the expected energy flux at Earthin the 0.2- to 3-keV energy range is ;8 3 10216 ergscm22 s21, requiring about a 2-order-of-magnitude in-crease in sensitivity for the detection of Saturn’s X-rayemissions [Gilman et al., 1986].
Barbosa [1990b] predicted X-ray intensities at Saturnat 10 and 50 RS using his electron bremsstrahlung model[Barbosa, 1990a], constraining the primary electronbeam parameters by UV aurora observations [Sandel etal., 1982; Atreya et al., 1984]. Although the X-ray fluxcalculated by him for Saturn was ;104 times less than forJupiter, he considered that it should be still measurableby an orbiting spacecraft (e.g., Cassini). However, inview of the apparent inadequacies in Barbosa’s brems-strahlung model, as discussed in detail in the section onJovian X-ray emissions, the X-ray photon fluxes pre-dicted by Barbosa should probably be scaled down by afew orders of magnitude in the low-energy region (#2keV). The precipitation of nitrogen ions from Titantorus [Barbosa, 1987] may also produce significant fluxesof emission line X rays on Saturn; this possibility has notbeen explored so far.
4.2. Ultraviolet EmissionsThe presence of an aurora on Saturn was suspected
from observations made by the UV photometer aboardthe Pioneer 11 [Judge et al., 1980] and IUE [Clarke et al.,1981], which found enhancements in the Lyman a
brightness near the polar regions. However, it was theUVS instrument on Voyager 1 which provided the firstunassailable evidence for the existence of a Saturnianaurora [Broadfoot et al., 1981b]. Aurorally excited emis-sions were found at H I Lyman a and in the H2 Lymanand Werner bands (see Figure 21 for the auroral spec-trum) around both poles of Saturn, with emission ratesvarying between 1 and 20 kR. In the south the emissionsare confined to an axisymmetric oval between 788 and81.58S (see Figure 22), with no emission detected frominside the polar cap region. For the northern aurora theposition of the oval is not accurately known, but it is atleast poleward of 768N and may not extend below 788N[Sandel and Broadfoot, 1981]. Brightness variations byfactors of ;2–5 times were observed on timescales of afew hours for the auroral emissions. Sandel and Broad-foot [1981] noted that the Lyman a component of theVoyager 1 auroral emission was ;5 times fainter thanthe H2 band emission, and the lowest burst detected byClarke et al. [1981] compared roughly in intensity withthe brightest Lyman a measured by Voyager 1.
The small size of the auroral oval and its location athigh magnetic latitudes (;758–808) suggested that theauroral regions map back magnetically to the magneto-tail and that the solar wind provides the energy sourcethrough an Earth-like interaction with the planet mag-netosphere [Sandel and Broadfoot, 1981]. The situationat Saturn thus seemed to be quite different than atJupiter, where the electrodynamical interaction of Iowith the Jovian magnetosphere supplies a large part ofthe auroral power. The power required by precipitatingelectrons to drive Saturn’s aurora is estimated to beabout 2 3 1011 W, with an uncertainty of a factor of ;4[Sandel and Broadfoot, 1981], based on an averagebrightness of 5 kR in the H2 bands extending over an
Figure 21. Voyager UVS auroral spectra of Saturn at a localzenith angle of 608 (curve a), Saturn at a local zenith angle of768 (curve b), and Jupiter (curve c), showing relative differ-ences in H2 Lyman and Werner band emissions in the 90- to113-nm range [Sandel and Broadfoot, 1981, Figure 4]. Thespectra have been normalized at 110.5 nm (note that the strongLyman a emissions have been clipped in these plots). Re-printed with permission from Nature.
Figure 22. Geometry of Voyager UVS polar auroral scans atSaturn. The range of the spacecraft is 3.6 RS, and its latitude is36.68S. The dashes show the position of the 0.18 3 0.868 UVSslit at 90-s intervals. Auroral emissions were detected at 788–81.58S, and relative H2 band brightnesses are shown as afunction of position in the inset [Sandel and Broadfoot, 1981,Figure 1]. Reprinted with permission from Nature.
38, 3 / REVIEWS OF GEOPHYSICS Bhardwaj and Gladstone: GIANT PLANET AURORAS ● 329
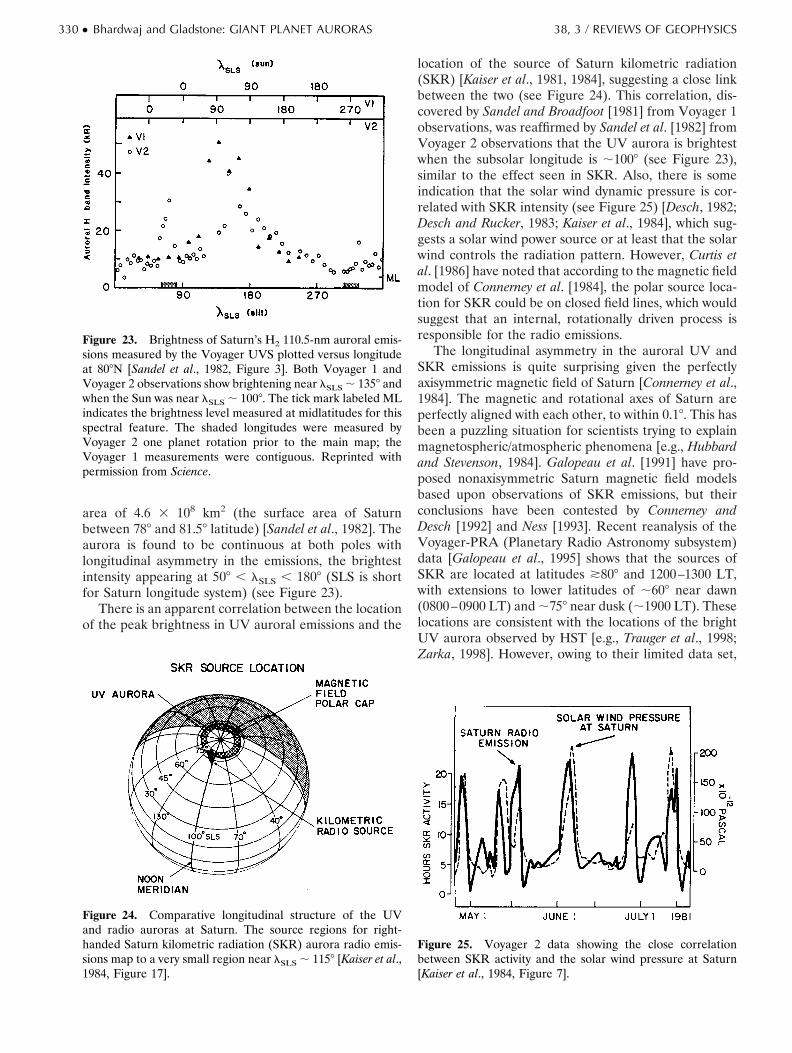
area of 4.6 3 108 km2 (the surface area of Saturnbetween 788 and 81.58 latitude) [Sandel et al., 1982]. Theaurora is found to be continuous at both poles withlongitudinal asymmetry in the emissions, the brightestintensity appearing at 508 , lSLS , 1808 (SLS is shortfor Saturn longitude system) (see Figure 23).
There is an apparent correlation between the locationof the peak brightness in UV auroral emissions and the
location of the source of Saturn kilometric radiation(SKR) [Kaiser et al., 1981, 1984], suggesting a close linkbetween the two (see Figure 24). This correlation, dis-covered by Sandel and Broadfoot [1981] from Voyager 1observations, was reaffirmed by Sandel et al. [1982] fromVoyager 2 observations that the UV aurora is brightestwhen the subsolar longitude is ;1008 (see Figure 23),similar to the effect seen in SKR. Also, there is someindication that the solar wind dynamic pressure is cor-related with SKR intensity (see Figure 25) [Desch, 1982;Desch and Rucker, 1983; Kaiser et al., 1984], which sug-gests a solar wind power source or at least that the solarwind controls the radiation pattern. However, Curtis etal. [1986] have noted that according to the magnetic fieldmodel of Connerney et al. [1984], the polar source loca-tion for SKR could be on closed field lines, which wouldsuggest that an internal, rotationally driven process isresponsible for the radio emissions.
The longitudinal asymmetry in the auroral UV andSKR emissions is quite surprising given the perfectlyaxisymmetric magnetic field of Saturn [Connerney et al.,1984]. The magnetic and rotational axes of Saturn areperfectly aligned with each other, to within 0.18. This hasbeen a puzzling situation for scientists trying to explainmagnetospheric/atmospheric phenomena [e.g., Hubbardand Stevenson, 1984]. Galopeau et al. [1991] have pro-posed nonaxisymmetric Saturn magnetic field modelsbased upon observations of SKR emissions, but theirconclusions have been contested by Connerney andDesch [1992] and Ness [1993]. Recent reanalysis of theVoyager-PRA (Planetary Radio Astronomy subsystem)data [Galopeau et al., 1995] shows that the sources ofSKR are located at latitudes *808 and 1200–1300 LT,with extensions to lower latitudes of ;608 near dawn(0800–0900 LT) and ;758 near dusk (;1900 LT). Theselocations are consistent with the locations of the brightUV aurora observed by HST [e.g., Trauger et al., 1998;Zarka, 1998]. However, owing to their limited data set,
Figure 23. Brightness of Saturn’s H2 110.5-nm auroral emis-sions measured by the Voyager UVS plotted versus longitudeat 808N [Sandel et al., 1982, Figure 3]. Both Voyager 1 andVoyager 2 observations show brightening near lSLS ; 1358 andwhen the Sun was near lSLS ; 1008. The tick mark labeled MLindicates the brightness level measured at midlatitudes for thisspectral feature. The shaded longitudes were measured byVoyager 2 one planet rotation prior to the main map; theVoyager 1 measurements were contiguous. Reprinted withpermission from Science.
Figure 24. Comparative longitudinal structure of the UVand radio auroras at Saturn. The source regions for right-handed Saturn kilometric radiation (SKR) aurora radio emis-sions map to a very small region near lSLS ; 1158 [Kaiser et al.,1984, Figure 17].
Figure 25. Voyager 2 data showing the close correlationbetween SKR activity and the solar wind pressure at Saturn[Kaiser et al., 1984, Figure 7].
330 ● Bhardwaj and Gladstone: GIANT PLANET AURORAS 38, 3 / REVIEWS OF GEOPHYSICS

Trauger et al. were unable to infer anything about theVoyager-observed longitudinal correlation between UVemissions and SKR.
Pre-Voyager calculations of Waite [1981] showed thatthe Lyman a brightness of about 2 kR and the H2 bandbrightness of 6–9 kR could be produced by precipitatingmonoenergetic electrons in the energy range 1–10 keVwith an energy flux of 0.75 ergs cm22 s21. Gerard andSingh [1982] modeled the Saturn aurora using the CSDAmethod for a primary electron flux having a Maxwellianenergy distribution with characteristic energies rangingfrom 0.1 to 2 keV. From comparison with the observedH2 band intensities, they computed a total energy dep-osition rate into the auroral zone of 0.2–1.5 ergs cm22
s21 and a globally averaged H atom column productionrate of 0.9–7 3 107 cm22 s21. In contrast, Shemanskyand Ajello [1983] constructed a synthetic spectral modelof the aurora which treats electron-excited H and H2
emissions at electron energies $100 eV with an electrondifferential flux distribution of the form E21.4. Theyfound that H2 emissions require a foreground H2 verti-cal column of only ;1016 cm22, which corresponds to apressure level of ;4 3 10211 bar (well above the homo-pause), indicating low-energy (,100 eV) exciting elec-trons. Atreya et al. [1984] suggested that electrons in theenergy range 1–10 keV are responsible for exciting theaurora. Saturn’s UV auroral spectrum shows less atmo-spheric absorption than Jupiter’s (compare curve c withcurves a and b in Figure 21), suggesting a relativelyhigher altitude auroral region corresponding to less en-ergetic primary particles. Modeling the precipitation ofprotons in Saturn’s atmosphere using CSDA [Singh,1991] yielded an excitation efficiency of about 10 kR (ergcm22 s21)21 for the H2 bands, thus requiring a flux ofabout 1 erg cm22 s21 to explain the 10 kR of H2 bandemissions observed by Voyager.
Barbosa [1987] proposed that Titanogenic nitrogenions are a key component of Saturn’s magnetosphericparticle population and can account for the energetics ofthe Saturn UV aurora in a corotation-dominated mag-netosphere. The nitrogen atoms which are escapingfrom the sunlit hemisphere of Titan at a rate of ;3 31026 s21 due to dissociative excitation of N2 [Strobel andShemansky, 1982] form a torus around Saturn. (A recentestimate of nonthermal photochemical loss of nitrogenfrom Titan in any chemical form is 1.2 3 107 cm22 s21,corresponding to a global loss rate of 2.5 3 1025 s21, ofwhich 70% is atomic nitrogen [Cravens et al., 1997]. Thesame study estimates a sputtering loss of ;1.5 3 1026
s21, while the loss due to polar wind processes is ;2 31025 s21). Ionization of the nitrogen torus by both solarEUV and magnetospheric electrons and subsequentpickup of ions produces a population of ;keV N ionswhich can supply the bulk of mass and energy input tothe magnetosphere at a power level of 2 3 1010 W. ThusBarbosa [1987] suggests that the aurora on Saturn can beaccounted for solely by an internal (Titan) plasma supply
in a corotation-dominated magnetosphere, deemphasiz-ing the importance of the solar wind.
In a subsequent paper, Barbosa [1990c] estimated thepower delivered to the aurora by protons and N1 ions tobe 5 3 109 and 2 3 1010 W, respectively. Taking the fluxof superthermal electrons (1–10 keV) from Sittler et al.[1983], he estimated *5 3 1010 W of power for theelectron aurora and concluded that electrons are mostlikely the primary precipitation energy source for theaurora as a result of energy transfer from TitanogenicN1 pickup ions in a corotation-dominated magneto-sphere. A suggested mechanism for this energy transferwas ion-generated lower hybrid waves, which could ac-celerate electrons to keV energies. Recently, combiningthe electron observations from three Voyager experi-ments (plasma instrument, LECP, and cosmic ray sub-system), Maurice et al. [1996] have generated a compos-ite flux spectrum of electrons in Saturn’s magnetospherewhich extends over nearly 12 orders of magnitude inintensity (from ;1022 to 109 particles (cm2 s sr keV)21)and more than 4 orders of magnitude in energy (from 10eV to ;2 MeV) (see Figure 26). Such a comprehensiveelectron spectrum can be employed to better constrainthe role of magnetospheric electrons in powering theSaturn aurora.
The IUE observations of auroral H I Lyman a emis-sions from Saturn over a period of a decade (1980–1990)showed intermittent outbursts of up to 1 kR above thedisk brightness (see Figure 27) [McGrath and Clarke,1992]. Voyager observations indicated continuous emis-sions around the auroral ovals that are apparently notdetectable with IUE probably due to the observing ge-ometry and larger slit aperture for IUE (which averagesout the intensity). Attempts were made to correlate theauroral activity on Saturn seen with IUE with majorsolar flares that produced strong geomagnetic activity,but the results were negative [McGrath and Clarke,1992].
Most recently, WFPC2 images of Saturn’s FUV au-rora were presented by Trauger et al. [1998]. They showthat the aurora is brightest (;100 kR) near the dawnlimb and appears to be fixed in local time (similar to thedawn storms observed at Jupiter). A total radiated FUVpower of 40 GW was determined. These results for 1995were for the northern auroral oval but are consistentwith the STIS image highlighting the southern auroraloval shown in Plate 1.
The atmosphere of Saturn contains a variety of par-ticulate material (e.g., aerosols, clouds, haze) whichplays an important role in various physical, chemical,and dynamical processes (e.g., radiation and heat bud-get, chemistry, transport) in the atmosphere [Tomaskoand Doose, 1984]. The ability of these particles to absorband scatter sunlight enables us to study their spatialdistribution and physical properties through remotesensing at various wavelengths. Voyager photopolarim-eter subsystem (PPS) observations at 264 nm have re-vealed the existence of a layer of small aerosols (radii
38, 3 / REVIEWS OF GEOPHYSICS Bhardwaj and Gladstone: GIANT PLANET AURORAS ● 331

;0.1 mm) in the atmosphere of Saturn which absorbsstrongly in the UV region and is located at a pressurelevel of 30–70 mbar at low to middle latitudes and atpressures &20 mbar at higher latitudes (.608) [West etal., 1983; Tomasko and Doose, 1984].
The observed UV-darkening of the polar regions ofSaturn has been interpreted as the sign of the presenceof UV-dark material (auroral haze) in the stratosphere[West et al., 1983; Karkoschka and Tomasko, 1993]. Pryorand Hord [1991] have found that a spatial correlationexists between the regions of strong auroral H2 bandemissions and UV-dark polar haze at Saturn. The ob-served northern haze region appears to enclose theauroral zone as defined from the Voyager UVS morpho-logical observations. Pryor and Hord have proposed thatthe source of this haze is auroral ionization and subse-quent hydrocarbon chemistry leading to the polymeriza-tion of hydrocarbons. The suggestion that auroras maybe important in haze formation was made earlier byLane et al. [1982] and is supported by the recent modelcalculations of Singhal et al. [1992] on Jupiter. However,for the auroral mechanism to be an important source ofhaze production, it is necessary that the precipitatingparticles be energetic enough to cause substantial ion-ization at altitudes of appreciable methane abundance(i.e., below the methane homopause) and thus initiatehydrocarbon-ion-polymerization chemistry.
Observations made near 220 nm by the FOC aboardHST (pre-COSTAR) have revealed a dark UV ovalenclosing the north pole of Saturn having an equivalentwidth of ;118 in latitude and centered around 798N [Ben
Figure 26. Composite electron flux spectrum for Saturn’s magnetosphere at L 5 11.21, lSLS 5 25.1,utilizing data from the plasma (PLS) (10 eV to 2.5 keV), Low Energy Charged Particle (LECP) experiment(22 keV to 1 MeV), and cosmic ray subsystem (CRS) (.600 keV) instruments [Maurice et al., 1996, Figure 7].The density (ne), return current density (Fe), pressure (Pe), and ratio of electron to magnetic pressure (be)are listed with 61s uncertainties, and the energies at which these quantities reach various percentages(integrating up from 10 eV) are indicated above with tick marks.
Figure 27. A sequence of IUE observations of Saturn show-ing the onset of a bright (;1 kR) Lyman a aurora during May17, 1990 [McGrath and Clarke, 1992, Figure 10]. The solid linerepresents a uniformly emitting disk, smoothed by a 60 fullwidth at half maximum Gaussian approximation to the IUEpoint-spread function. Saturn’s diameter as seen from Earth atthe time of the observations was 17.50, and the sub-Earthlatitude was 22.38N.
332 ● Bhardwaj and Gladstone: GIANT PLANET AURORAS 38, 3 / REVIEWS OF GEOPHYSICS
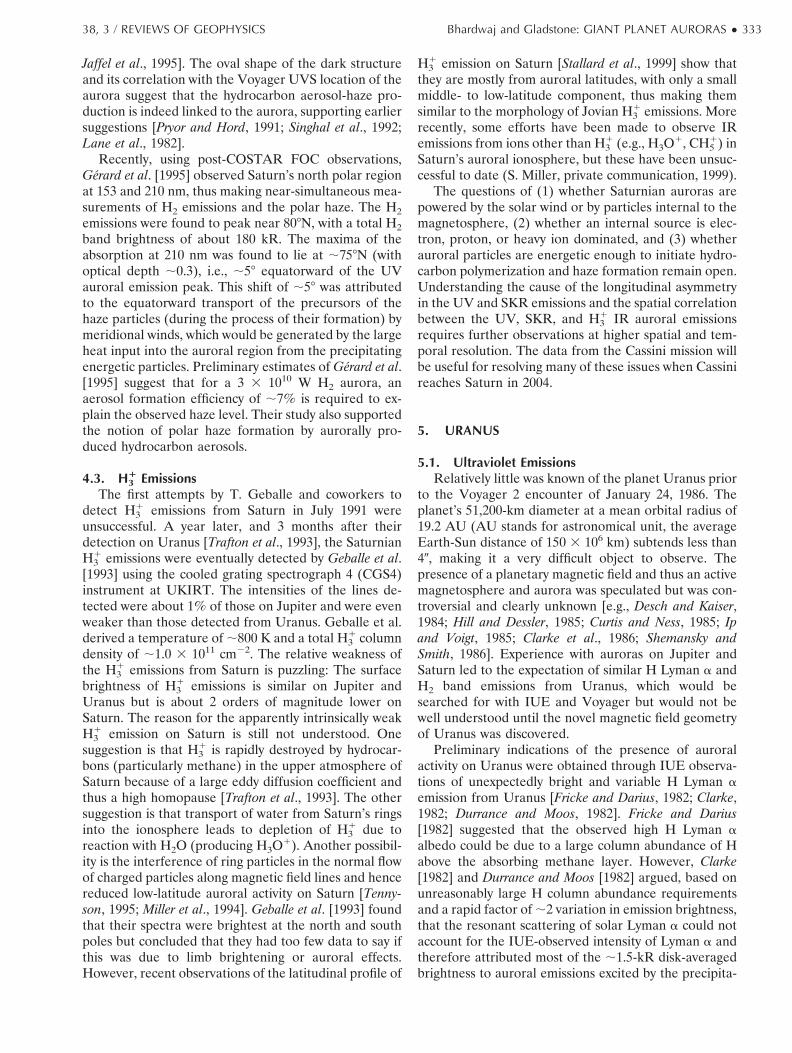
Jaffel et al., 1995]. The oval shape of the dark structureand its correlation with the Voyager UVS location of theaurora suggest that the hydrocarbon aerosol-haze pro-duction is indeed linked to the aurora, supporting earliersuggestions [Pryor and Hord, 1991; Singhal et al., 1992;Lane et al., 1982].
Recently, using post-COSTAR FOC observations,Gerard et al. [1995] observed Saturn’s north polar regionat 153 and 210 nm, thus making near-simultaneous mea-surements of H2 emissions and the polar haze. The H2emissions were found to peak near 808N, with a total H2band brightness of about 180 kR. The maxima of theabsorption at 210 nm was found to lie at ;758N (withoptical depth ;0.3), i.e., ;58 equatorward of the UVauroral emission peak. This shift of ;58 was attributedto the equatorward transport of the precursors of thehaze particles (during the process of their formation) bymeridional winds, which would be generated by the largeheat input into the auroral region from the precipitatingenergetic particles. Preliminary estimates of Gerard et al.[1995] suggest that for a 3 3 1010 W H2 aurora, anaerosol formation efficiency of ;7% is required to ex-plain the observed haze level. Their study also supportedthe notion of polar haze formation by aurorally pro-duced hydrocarbon aerosols.
4.3. H31 Emissions
The first attempts by T. Geballe and coworkers todetect H3
1 emissions from Saturn in July 1991 wereunsuccessful. A year later, and 3 months after theirdetection on Uranus [Trafton et al., 1993], the SaturnianH3
1 emissions were eventually detected by Geballe et al.[1993] using the cooled grating spectrograph 4 (CGS4)instrument at UKIRT. The intensities of the lines de-tected were about 1% of those on Jupiter and were evenweaker than those detected from Uranus. Geballe et al.derived a temperature of ;800 K and a total H3
1 columndensity of ;1.0 3 1011 cm22. The relative weakness ofthe H3
1 emissions from Saturn is puzzling: The surfacebrightness of H3
1 emissions is similar on Jupiter andUranus but is about 2 orders of magnitude lower onSaturn. The reason for the apparently intrinsically weakH3
1 emission on Saturn is still not understood. Onesuggestion is that H3
1 is rapidly destroyed by hydrocar-bons (particularly methane) in the upper atmosphere ofSaturn because of a large eddy diffusion coefficient andthus a high homopause [Trafton et al., 1993]. The othersuggestion is that transport of water from Saturn’s ringsinto the ionosphere leads to depletion of H3
1 due toreaction with H2O (producing H3O1). Another possibil-ity is the interference of ring particles in the normal flowof charged particles along magnetic field lines and hencereduced low-latitude auroral activity on Saturn [Tenny-son, 1995; Miller et al., 1994]. Geballe et al. [1993] foundthat their spectra were brightest at the north and southpoles but concluded that they had too few data to say ifthis was due to limb brightening or auroral effects.However, recent observations of the latitudinal profile of
H31 emission on Saturn [Stallard et al., 1999] show that
they are mostly from auroral latitudes, with only a smallmiddle- to low-latitude component, thus making themsimilar to the morphology of Jovian H3
1 emissions. Morerecently, some efforts have been made to observe IRemissions from ions other than H3
1 (e.g., H3O1, CH51) in
Saturn’s auroral ionosphere, but these have been unsuc-cessful to date (S. Miller, private communication, 1999).
The questions of (1) whether Saturnian auroras arepowered by the solar wind or by particles internal to themagnetosphere, (2) whether an internal source is elec-tron, proton, or heavy ion dominated, and (3) whetherauroral particles are energetic enough to initiate hydro-carbon polymerization and haze formation remain open.Understanding the cause of the longitudinal asymmetryin the UV and SKR emissions and the spatial correlationbetween the UV, SKR, and H3
1 IR auroral emissionsrequires further observations at higher spatial and tem-poral resolution. The data from the Cassini mission willbe useful for resolving many of these issues when Cassinireaches Saturn in 2004.
5. URANUS
5.1. Ultraviolet EmissionsRelatively little was known of the planet Uranus prior
to the Voyager 2 encounter of January 24, 1986. Theplanet’s 51,200-km diameter at a mean orbital radius of19.2 AU (AU stands for astronomical unit, the averageEarth-Sun distance of 150 3 106 km) subtends less than40, making it a very difficult object to observe. Thepresence of a planetary magnetic field and thus an activemagnetosphere and aurora was speculated but was con-troversial and clearly unknown [e.g., Desch and Kaiser,1984; Hill and Dessler, 1985; Curtis and Ness, 1985; Ipand Voigt, 1985; Clarke et al., 1986; Shemansky andSmith, 1986]. Experience with auroras on Jupiter andSaturn led to the expectation of similar H Lyman a andH2 band emissions from Uranus, which would besearched for with IUE and Voyager but would not bewell understood until the novel magnetic field geometryof Uranus was discovered.
Preliminary indications of the presence of auroralactivity on Uranus were obtained through IUE observa-tions of unexpectedly bright and variable H Lyman aemission from Uranus [Fricke and Darius, 1982; Clarke,1982; Durrance and Moos, 1982]. Fricke and Darius[1982] suggested that the observed high H Lyman aalbedo could be due to a large column abundance of Habove the absorbing methane layer. However, Clarke[1982] and Durrance and Moos [1982] argued, based onunreasonably large H column abundance requirementsand a rapid factor of ;2 variation in emission brightness,that the resonant scattering of solar Lyman a could notaccount for the IUE-observed intensity of Lyman a andtherefore attributed most of the ;1.5-kR disk-averagedbrightness to auroral emissions excited by the precipita-
38, 3 / REVIEWS OF GEOPHYSICS Bhardwaj and Gladstone: GIANT PLANET AURORAS ● 333
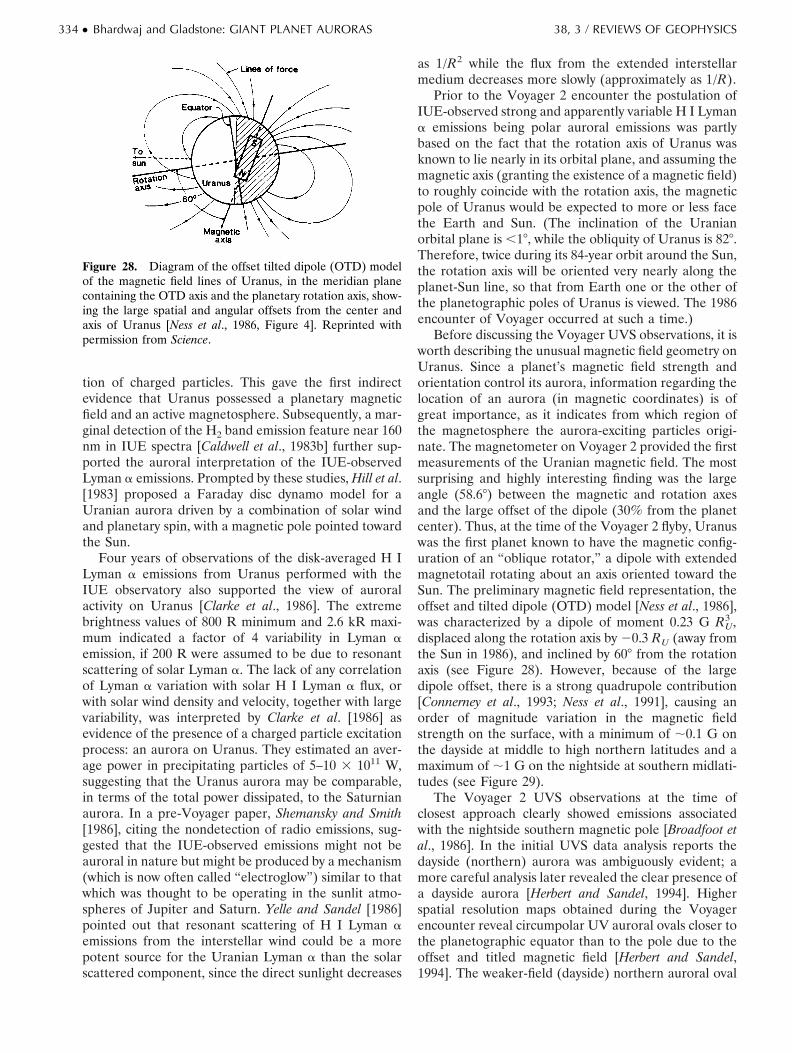
tion of charged particles. This gave the first indirectevidence that Uranus possessed a planetary magneticfield and an active magnetosphere. Subsequently, a mar-ginal detection of the H2 band emission feature near 160nm in IUE spectra [Caldwell et al., 1983b] further sup-ported the auroral interpretation of the IUE-observedLyman a emissions. Prompted by these studies, Hill et al.[1983] proposed a Faraday disc dynamo model for aUranian aurora driven by a combination of solar windand planetary spin, with a magnetic pole pointed towardthe Sun.
Four years of observations of the disk-averaged H ILyman a emissions from Uranus performed with theIUE observatory also supported the view of auroralactivity on Uranus [Clarke et al., 1986]. The extremebrightness values of 800 R minimum and 2.6 kR maxi-mum indicated a factor of 4 variability in Lyman aemission, if 200 R were assumed to be due to resonantscattering of solar Lyman a. The lack of any correlationof Lyman a variation with solar H I Lyman a flux, orwith solar wind density and velocity, together with largevariability, was interpreted by Clarke et al. [1986] asevidence of the presence of a charged particle excitationprocess: an aurora on Uranus. They estimated an aver-age power in precipitating particles of 5–10 3 1011 W,suggesting that the Uranus aurora may be comparable,in terms of the total power dissipated, to the Saturnianaurora. In a pre-Voyager paper, Shemansky and Smith[1986], citing the nondetection of radio emissions, sug-gested that the IUE-observed emissions might not beauroral in nature but might be produced by a mechanism(which is now often called “electroglow”) similar to thatwhich was thought to be operating in the sunlit atmo-spheres of Jupiter and Saturn. Yelle and Sandel [1986]pointed out that resonant scattering of H I Lyman aemissions from the interstellar wind could be a morepotent source for the Uranian Lyman a than the solarscattered component, since the direct sunlight decreases
as 1/R2 while the flux from the extended interstellarmedium decreases more slowly (approximately as 1/R).
Prior to the Voyager 2 encounter the postulation ofIUE-observed strong and apparently variable H I Lymana emissions being polar auroral emissions was partlybased on the fact that the rotation axis of Uranus wasknown to lie nearly in its orbital plane, and assuming themagnetic axis (granting the existence of a magnetic field)to roughly coincide with the rotation axis, the magneticpole of Uranus would be expected to more or less facethe Earth and Sun. (The inclination of the Uranianorbital plane is ,18, while the obliquity of Uranus is 828.Therefore, twice during its 84-year orbit around the Sun,the rotation axis will be oriented very nearly along theplanet-Sun line, so that from Earth one or the other ofthe planetographic poles of Uranus is viewed. The 1986encounter of Voyager occurred at such a time.)
Before discussing the Voyager UVS observations, it isworth describing the unusual magnetic field geometry onUranus. Since a planet’s magnetic field strength andorientation control its aurora, information regarding thelocation of an aurora (in magnetic coordinates) is ofgreat importance, as it indicates from which region ofthe magnetosphere the aurora-exciting particles origi-nate. The magnetometer on Voyager 2 provided the firstmeasurements of the Uranian magnetic field. The mostsurprising and highly interesting finding was the largeangle (58.68) between the magnetic and rotation axesand the large offset of the dipole (30% from the planetcenter). Thus, at the time of the Voyager 2 flyby, Uranuswas the first planet known to have the magnetic config-uration of an “oblique rotator,” a dipole with extendedmagnetotail rotating about an axis oriented toward theSun. The preliminary magnetic field representation, theoffset and tilted dipole (OTD) model [Ness et al., 1986],was characterized by a dipole of moment 0.23 G RU
3 ,displaced along the rotation axis by 20.3 RU (away fromthe Sun in 1986), and inclined by 608 from the rotationaxis (see Figure 28). However, because of the largedipole offset, there is a strong quadrupole contribution[Connerney et al., 1993; Ness et al., 1991], causing anorder of magnitude variation in the magnetic fieldstrength on the surface, with a minimum of ;0.1 G onthe dayside at middle to high northern latitudes and amaximum of ;1 G on the nightside at southern midlati-tudes (see Figure 29).
The Voyager 2 UVS observations at the time ofclosest approach clearly showed emissions associatedwith the nightside southern magnetic pole [Broadfoot etal., 1986]. In the initial UVS data analysis reports thedayside (northern) aurora was ambiguously evident; amore careful analysis later revealed the clear presence ofa dayside aurora [Herbert and Sandel, 1994]. Higherspatial resolution maps obtained during the Voyagerencounter reveal circumpolar UV auroral ovals closer tothe planetographic equator than to the pole due to theoffset and titled magnetic field [Herbert and Sandel,1994]. The weaker-field (dayside) northern auroral oval
Figure 28. Diagram of the offset tilted dipole (OTD) modelof the magnetic field lines of Uranus, in the meridian planecontaining the OTD axis and the planetary rotation axis, show-ing the large spatial and angular offsets from the center andaxis of Uranus [Ness et al., 1986, Figure 4]. Reprinted withpermission from Science.
334 ● Bhardwaj and Gladstone: GIANT PLANET AURORAS 38, 3 / REVIEWS OF GEOPHYSICS
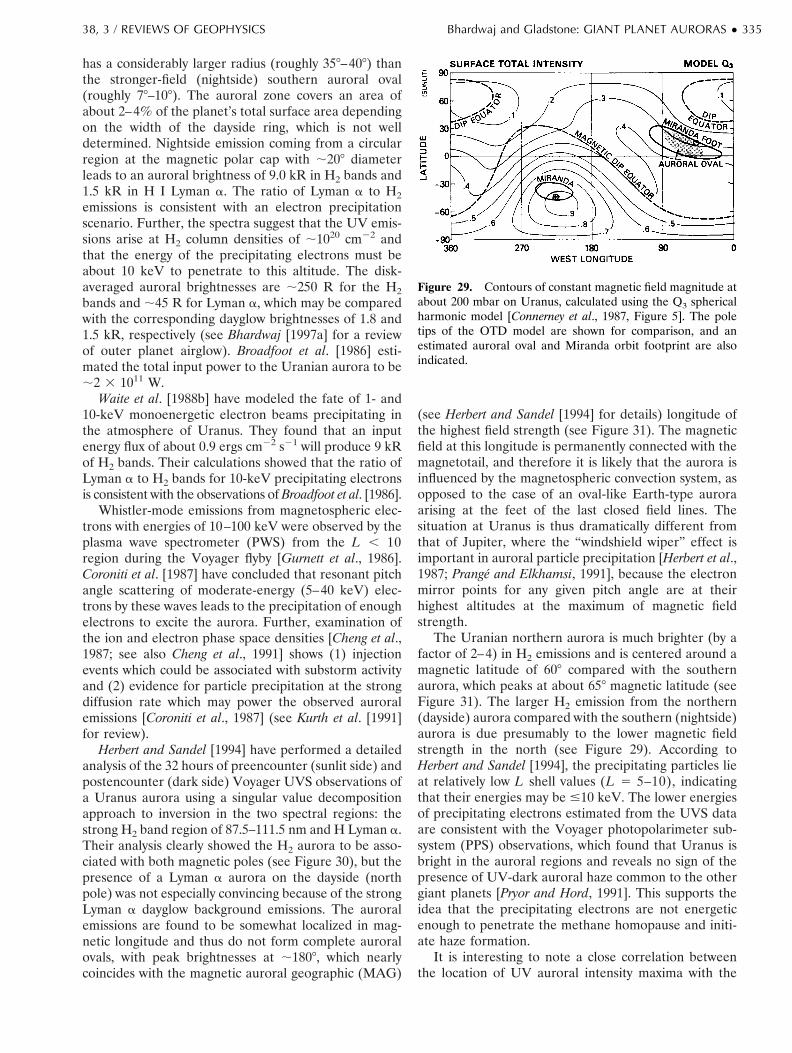
has a considerably larger radius (roughly 358–408) thanthe stronger-field (nightside) southern auroral oval(roughly 78–108). The auroral zone covers an area ofabout 2–4% of the planet’s total surface area dependingon the width of the dayside ring, which is not welldetermined. Nightside emission coming from a circularregion at the magnetic polar cap with ;208 diameterleads to an auroral brightness of 9.0 kR in H2 bands and1.5 kR in H I Lyman a. The ratio of Lyman a to H2emissions is consistent with an electron precipitationscenario. Further, the spectra suggest that the UV emis-sions arise at H2 column densities of ;1020 cm22 andthat the energy of the precipitating electrons must beabout 10 keV to penetrate to this altitude. The disk-averaged auroral brightnesses are ;250 R for the H2bands and ;45 R for Lyman a, which may be comparedwith the corresponding dayglow brightnesses of 1.8 and1.5 kR, respectively (see Bhardwaj [1997a] for a reviewof outer planet airglow). Broadfoot et al. [1986] esti-mated the total input power to the Uranian aurora to be;2 3 1011 W.
Waite et al. [1988b] have modeled the fate of 1- and10-keV monoenergetic electron beams precipitating inthe atmosphere of Uranus. They found that an inputenergy flux of about 0.9 ergs cm22 s21 will produce 9 kRof H2 bands. Their calculations showed that the ratio ofLyman a to H2 bands for 10-keV precipitating electronsis consistent with the observations of Broadfoot et al. [1986].
Whistler-mode emissions from magnetospheric elec-trons with energies of 10–100 keV were observed by theplasma wave spectrometer (PWS) from the L , 10region during the Voyager flyby [Gurnett et al., 1986].Coroniti et al. [1987] have concluded that resonant pitchangle scattering of moderate-energy (5–40 keV) elec-trons by these waves leads to the precipitation of enoughelectrons to excite the aurora. Further, examination ofthe ion and electron phase space densities [Cheng et al.,1987; see also Cheng et al., 1991] shows (1) injectionevents which could be associated with substorm activityand (2) evidence for particle precipitation at the strongdiffusion rate which may power the observed auroralemissions [Coroniti et al., 1987] (see Kurth et al. [1991]for review).
Herbert and Sandel [1994] have performed a detailedanalysis of the 32 hours of preencounter (sunlit side) andpostencounter (dark side) Voyager UVS observations ofa Uranus aurora using a singular value decompositionapproach to inversion in the two spectral regions: thestrong H2 band region of 87.5–111.5 nm and H Lyman a.Their analysis clearly showed the H2 aurora to be asso-ciated with both magnetic poles (see Figure 30), but thepresence of a Lyman a aurora on the dayside (northpole) was not especially convincing because of the strongLyman a dayglow background emissions. The auroralemissions are found to be somewhat localized in mag-netic longitude and thus do not form complete auroralovals, with peak brightnesses at ;1808, which nearlycoincides with the magnetic auroral geographic (MAG)
(see Herbert and Sandel [1994] for details) longitude ofthe highest field strength (see Figure 31). The magneticfield at this longitude is permanently connected with themagnetotail, and therefore it is likely that the aurora isinfluenced by the magnetospheric convection system, asopposed to the case of an oval-like Earth-type auroraarising at the feet of the last closed field lines. Thesituation at Uranus is thus dramatically different fromthat of Jupiter, where the “windshield wiper” effect isimportant in auroral particle precipitation [Herbert et al.,1987; Prange and Elkhamsi, 1991], because the electronmirror points for any given pitch angle are at theirhighest altitudes at the maximum of magnetic fieldstrength.
The Uranian northern aurora is much brighter (by afactor of 2–4) in H2 emissions and is centered around amagnetic latitude of 608 compared with the southernaurora, which peaks at about 658 magnetic latitude (seeFigure 31). The larger H2 emission from the northern(dayside) aurora compared with the southern (nightside)aurora is due presumably to the lower magnetic fieldstrength in the north (see Figure 29). According toHerbert and Sandel [1994], the precipitating particles lieat relatively low L shell values (L 5 5–10), indicatingthat their energies may be #10 keV. The lower energiesof precipitating electrons estimated from the UVS dataare consistent with the Voyager photopolarimeter sub-system (PPS) observations, which found that Uranus isbright in the auroral regions and reveals no sign of thepresence of UV-dark auroral haze common to the othergiant planets [Pryor and Hord, 1991]. This supports theidea that the precipitating electrons are not energeticenough to penetrate the methane homopause and initi-ate haze formation.
It is interesting to note a close correlation betweenthe location of UV auroral intensity maxima with the
Figure 29. Contours of constant magnetic field magnitude atabout 200 mbar on Uranus, calculated using the Q3 sphericalharmonic model [Connerney et al., 1987, Figure 5]. The poletips of the OTD model are shown for comparison, and anestimated auroral oval and Miranda orbit footprint are alsoindicated.
38, 3 / REVIEWS OF GEOPHYSICS Bhardwaj and Gladstone: GIANT PLANET AURORAS ● 335
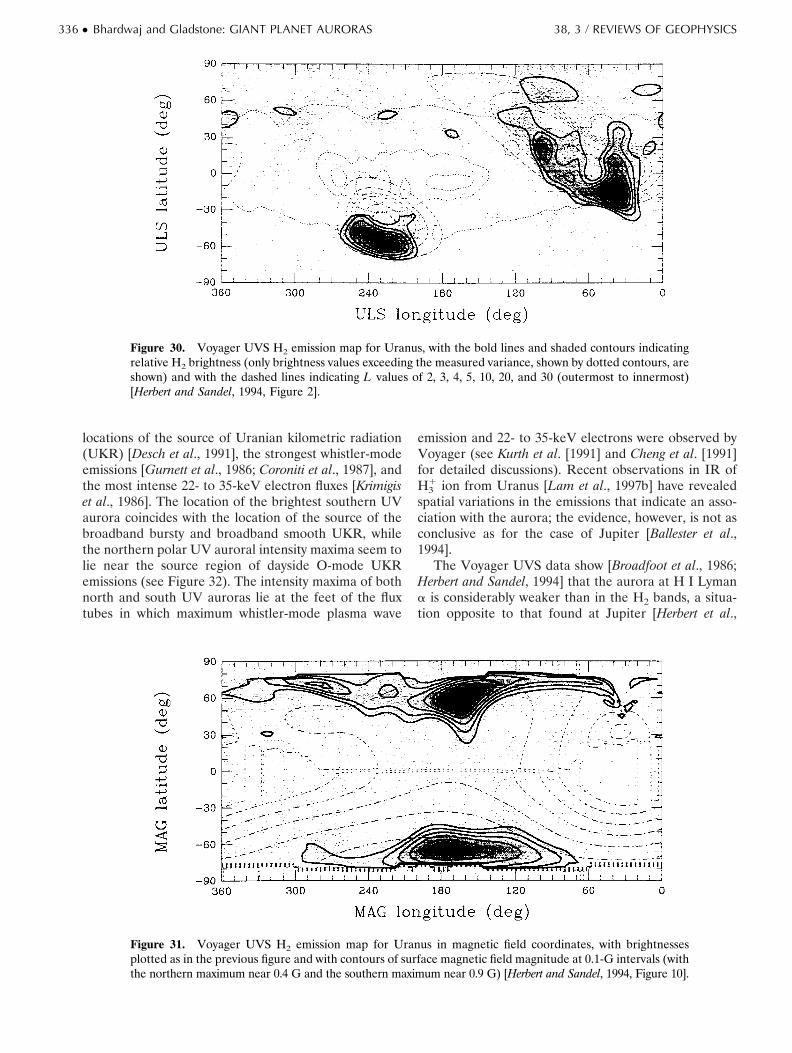
locations of the source of Uranian kilometric radiation(UKR) [Desch et al., 1991], the strongest whistler-modeemissions [Gurnett et al., 1986; Coroniti et al., 1987], andthe most intense 22- to 35-keV electron fluxes [Krimigiset al., 1986]. The location of the brightest southern UVaurora coincides with the location of the source of thebroadband bursty and broadband smooth UKR, whilethe northern polar UV auroral intensity maxima seem tolie near the source region of dayside O-mode UKRemissions (see Figure 32). The intensity maxima of bothnorth and south UV auroras lie at the feet of the fluxtubes in which maximum whistler-mode plasma wave
emission and 22- to 35-keV electrons were observed byVoyager (see Kurth et al. [1991] and Cheng et al. [1991]for detailed discussions). Recent observations in IR ofH3
1 ion from Uranus [Lam et al., 1997b] have revealedspatial variations in the emissions that indicate an asso-ciation with the aurora; the evidence, however, is not asconclusive as for the case of Jupiter [Ballester et al.,1994].
The Voyager UVS data show [Broadfoot et al., 1986;Herbert and Sandel, 1994] that the aurora at H I Lymana is considerably weaker than in the H2 bands, a situa-tion opposite to that found at Jupiter [Herbert et al.,
Figure 30. Voyager UVS H2 emission map for Uranus, with the bold lines and shaded contours indicatingrelative H2 brightness (only brightness values exceeding the measured variance, shown by dotted contours, areshown) and with the dashed lines indicating L values of 2, 3, 4, 5, 10, 20, and 30 (outermost to innermost)[Herbert and Sandel, 1994, Figure 2].
Figure 31. Voyager UVS H2 emission map for Uranus in magnetic field coordinates, with brightnessesplotted as in the previous figure and with contours of surface magnetic field magnitude at 0.1-G intervals (withthe northern maximum near 0.4 G and the southern maximum near 0.9 G) [Herbert and Sandel, 1994, Figure 10].
336 ● Bhardwaj and Gladstone: GIANT PLANET AURORAS 38, 3 / REVIEWS OF GEOPHYSICS

1987; Broadfoot et al., 1981a]. Because the north polewas in the sunlit hemisphere at the Voyager encounter,and the Lyman a dayglow is several times brighter thanthe H2 band emissions in 87.5–111.5 nm [cf. Bhardwaj,1997a], the Lyman a emissions from the northern auroraare obscured by resonantly scattered solar Lyman a. Thereason that the auroral Lyman a/H2 band intensity ratiois diminished at Uranus relative to Jupiter may be thatthe atomic H column abundance in the Uranian aurorais smaller than at Jupiter. Herbert and Sandel [1994] have
estimated the total auroral power output of the H2 bandsand H I Lyman a at 3–7 3 109 W. For a presumed 10%UV excitation efficiency, the particle input power islikely around 3–7 3 1010 W, corresponding to a disk-averaged deposition rate of about 0.003–0.008 ergs cm22
s21.Recently, Herbert and Hall [1996] have examined the
spatial distribution of hot (&2 eV) H atoms (at theexosphere temperature of 800 K the thermal energy is0.07 eV) [Herbert, 1988; Stevens et al., 1993] detected bythe Voyager UVS in the extended Uranian H corona[Broadfoot et al., 1986]. The extended H corona hassignificant consequences for the magnetospheric plasma,which can charge exchange with coronal H, resulting inthe production of fast neutrals that can escape from themagnetosphere [Cheng, 1986; Krimigis et al., 1988] orprecipitate into the upper atmosphere [Ip, 1987; Bhard-waj and Singhal, 1993; Bhardwaj, 1997b]. The H coronadensity distribution has a radial profile } 1/r2, which ischaracteristic of an escaping population with high tem-perature Tnonthermal .. Tthermal. The nonthermal Hcoronal density is higher on the sunlit side (typically400–500 cm23 at 2 RU) than on the nightside (200–300cm23 at 2 RU) [Herbert, 1988; Herbert and Hall, 1996].The hot H density distribution is found to maximize nearthe dayside (north) magnetic pole, with the minima nearthe darkside (south) magnetic pole (see Figure 33). Theratio of about 5:2 of the H densities between the twopoles is approximately the same (;2:1) as obtained forthe ratio of the total brightness of the two UV auroras[Herbert and Sandel, 1994] and is also consistent with the1:2 ratio of the magnetic field strengths of the north andsouth magnetic poles. The coincidence between the UVauroral intensity ratio and hot H coronal density ratio atthe two poles probably indicates a common source of the
Figure 32. Meridian plane diagram indicating the source lo-cations for Uranian kilometric radiation (UKR), which agreewell with the locations of H2 FUV emission [Desch et al., 1991,Figure 10]. Reprinted with permission from University of Ar-izona Press.
Figure 33. Density map of the H corona of Uranus at 2 RU derived from Voyager UVS observations ofLyman a emissions, with solid contours labeled in per cubic centimeters, and with L values of 10, 5, 4, and 3indicated (proceeding outward from each magnetic pole) [Herbert and Hall, 1996, Figure 3]. The uncertaintyin density is estimated to vary from 650 cm23 near the equator to 690 cm23 near the poles. At the time ofthe Voyager 2 flyby the northern hemisphere was sunlit.
38, 3 / REVIEWS OF GEOPHYSICS Bhardwaj and Gladstone: GIANT PLANET AURORAS ● 337
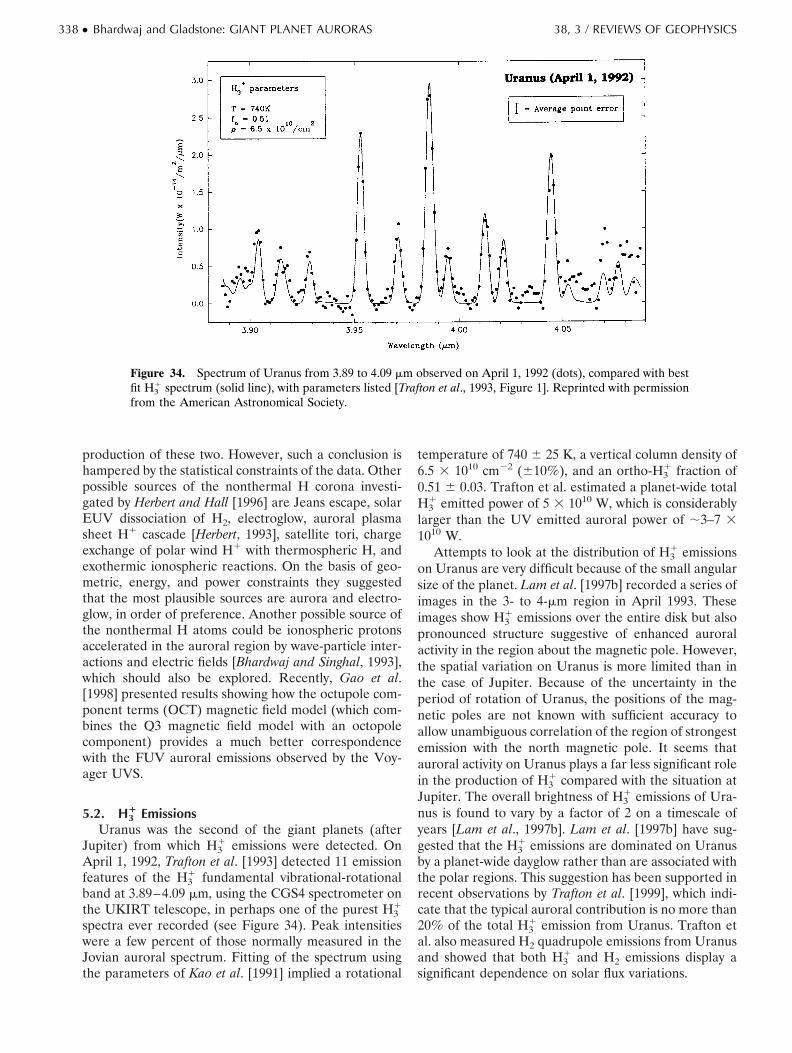
production of these two. However, such a conclusion ishampered by the statistical constraints of the data. Otherpossible sources of the nonthermal H corona investi-gated by Herbert and Hall [1996] are Jeans escape, solarEUV dissociation of H2, electroglow, auroral plasmasheet H1 cascade [Herbert, 1993], satellite tori, chargeexchange of polar wind H1 with thermospheric H, andexothermic ionospheric reactions. On the basis of geo-metric, energy, and power constraints they suggestedthat the most plausible sources are aurora and electro-glow, in order of preference. Another possible source ofthe nonthermal H atoms could be ionospheric protonsaccelerated in the auroral region by wave-particle inter-actions and electric fields [Bhardwaj and Singhal, 1993],which should also be explored. Recently, Gao et al.[1998] presented results showing how the octupole com-ponent terms (OCT) magnetic field model (which com-bines the Q3 magnetic field model with an octopolecomponent) provides a much better correspondencewith the FUV auroral emissions observed by the Voy-ager UVS.
5.2. H31 Emissions
Uranus was the second of the giant planets (afterJupiter) from which H3
1 emissions were detected. OnApril 1, 1992, Trafton et al. [1993] detected 11 emissionfeatures of the H3
1 fundamental vibrational-rotationalband at 3.89–4.09 mm, using the CGS4 spectrometer onthe UKIRT telescope, in perhaps one of the purest H3
1
spectra ever recorded (see Figure 34). Peak intensitieswere a few percent of those normally measured in theJovian auroral spectrum. Fitting of the spectrum usingthe parameters of Kao et al. [1991] implied a rotational
temperature of 740 6 25 K, a vertical column density of6.5 3 1010 cm22 (610%), and an ortho-H3
1 fraction of0.51 6 0.03. Trafton et al. estimated a planet-wide totalH3
1 emitted power of 5 3 1010 W, which is considerablylarger than the UV emitted auroral power of ;3–7 31010 W.
Attempts to look at the distribution of H31 emissions
on Uranus are very difficult because of the small angularsize of the planet. Lam et al. [1997b] recorded a series ofimages in the 3- to 4-mm region in April 1993. Theseimages show H3
1 emissions over the entire disk but alsopronounced structure suggestive of enhanced auroralactivity in the region about the magnetic pole. However,the spatial variation on Uranus is more limited than inthe case of Jupiter. Because of the uncertainty in theperiod of rotation of Uranus, the positions of the mag-netic poles are not known with sufficient accuracy toallow unambiguous correlation of the region of strongestemission with the north magnetic pole. It seems thatauroral activity on Uranus plays a far less significant rolein the production of H3
1 compared with the situation atJupiter. The overall brightness of H3
1 emissions of Ura-nus is found to vary by a factor of 2 on a timescale ofyears [Lam et al., 1997b]. Lam et al. [1997b] have sug-gested that the H3
1 emissions are dominated on Uranusby a planet-wide dayglow rather than are associated withthe polar regions. This suggestion has been supported inrecent observations by Trafton et al. [1999], which indi-cate that the typical auroral contribution is no more than20% of the total H3
1 emission from Uranus. Trafton etal. also measured H2 quadrupole emissions from Uranusand showed that both H3
1 and H2 emissions display asignificant dependence on solar flux variations.
Figure 34. Spectrum of Uranus from 3.89 to 4.09 mm observed on April 1, 1992 (dots), compared with bestfit H3
1 spectrum (solid line), with parameters listed [Trafton et al., 1993, Figure 1]. Reprinted with permissionfrom the American Astronomical Society.
338 ● Bhardwaj and Gladstone: GIANT PLANET AURORAS 38, 3 / REVIEWS OF GEOPHYSICS
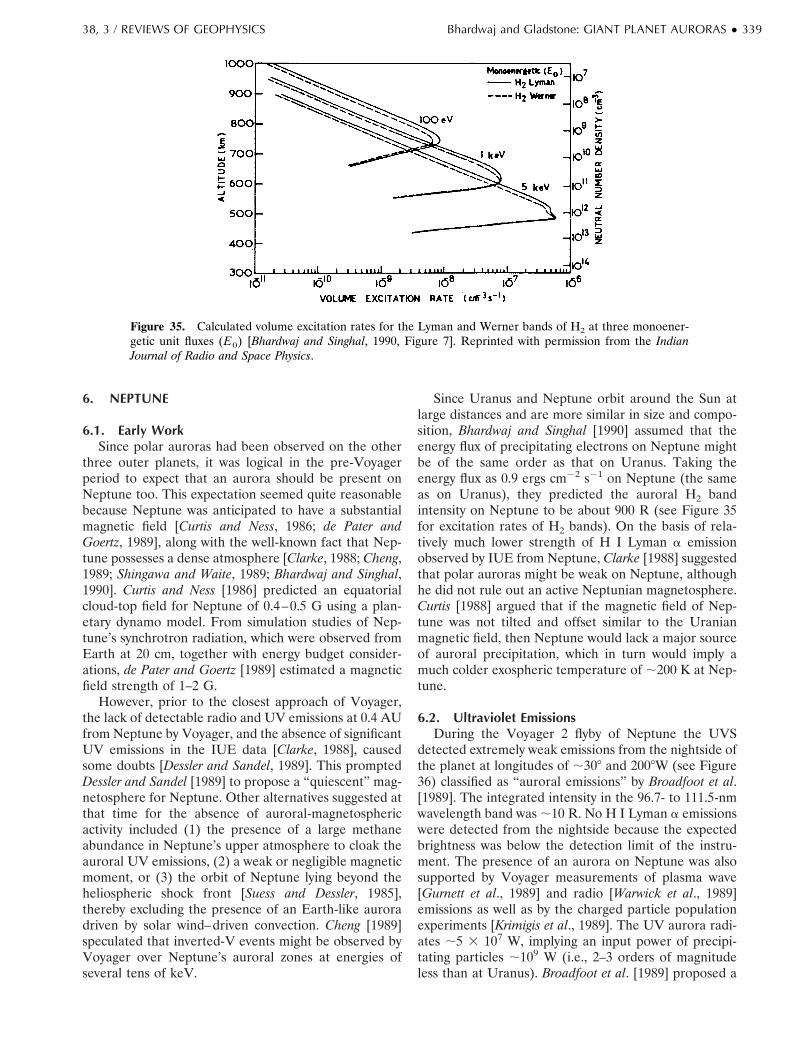
6. NEPTUNE
6.1. Early WorkSince polar auroras had been observed on the other
three outer planets, it was logical in the pre-Voyagerperiod to expect that an aurora should be present onNeptune too. This expectation seemed quite reasonablebecause Neptune was anticipated to have a substantialmagnetic field [Curtis and Ness, 1986; de Pater andGoertz, 1989], along with the well-known fact that Nep-tune possesses a dense atmosphere [Clarke, 1988; Cheng,1989; Shingawa and Waite, 1989; Bhardwaj and Singhal,1990]. Curtis and Ness [1986] predicted an equatorialcloud-top field for Neptune of 0.4–0.5 G using a plan-etary dynamo model. From simulation studies of Nep-tune’s synchrotron radiation, which were observed fromEarth at 20 cm, together with energy budget consider-ations, de Pater and Goertz [1989] estimated a magneticfield strength of 1–2 G.
However, prior to the closest approach of Voyager,the lack of detectable radio and UV emissions at 0.4 AUfrom Neptune by Voyager, and the absence of significantUV emissions in the IUE data [Clarke, 1988], causedsome doubts [Dessler and Sandel, 1989]. This promptedDessler and Sandel [1989] to propose a “quiescent” mag-netosphere for Neptune. Other alternatives suggested atthat time for the absence of auroral-magnetosphericactivity included (1) the presence of a large methaneabundance in Neptune’s upper atmosphere to cloak theauroral UV emissions, (2) a weak or negligible magneticmoment, or (3) the orbit of Neptune lying beyond theheliospheric shock front [Suess and Dessler, 1985],thereby excluding the presence of an Earth-like auroradriven by solar wind–driven convection. Cheng [1989]speculated that inverted-V events might be observed byVoyager over Neptune’s auroral zones at energies ofseveral tens of keV.
Since Uranus and Neptune orbit around the Sun atlarge distances and are more similar in size and compo-sition, Bhardwaj and Singhal [1990] assumed that theenergy flux of precipitating electrons on Neptune mightbe of the same order as that on Uranus. Taking theenergy flux as 0.9 ergs cm22 s21 on Neptune (the sameas on Uranus), they predicted the auroral H2 bandintensity on Neptune to be about 900 R (see Figure 35for excitation rates of H2 bands). On the basis of rela-tively much lower strength of H I Lyman a emissionobserved by IUE from Neptune, Clarke [1988] suggestedthat polar auroras might be weak on Neptune, althoughhe did not rule out an active Neptunian magnetosphere.Curtis [1988] argued that if the magnetic field of Nep-tune was not tilted and offset similar to the Uranianmagnetic field, then Neptune would lack a major sourceof auroral precipitation, which in turn would imply amuch colder exospheric temperature of ;200 K at Nep-tune.
6.2. Ultraviolet EmissionsDuring the Voyager 2 flyby of Neptune the UVS
detected extremely weak emissions from the nightside ofthe planet at longitudes of ;308 and 2008W (see Figure36) classified as “auroral emissions” by Broadfoot et al.[1989]. The integrated intensity in the 96.7- to 111.5-nmwavelength band was ;10 R. No H I Lyman a emissionswere detected from the nightside because the expectedbrightness was below the detection limit of the instru-ment. The presence of an aurora on Neptune was alsosupported by Voyager measurements of plasma wave[Gurnett et al., 1989] and radio [Warwick et al., 1989]emissions as well as by the charged particle populationexperiments [Krimigis et al., 1989]. The UV aurora radi-ates ;5 3 107 W, implying an input power of precipi-tating particles ;109 W (i.e., 2–3 orders of magnitudeless than at Uranus). Broadfoot et al. [1989] proposed a
Figure 35. Calculated volume excitation rates for the Lyman and Werner bands of H2 at three monoener-getic unit fluxes (E0) [Bhardwaj and Singhal, 1990, Figure 7]. Reprinted with permission from the IndianJournal of Radio and Space Physics.
38, 3 / REVIEWS OF GEOPHYSICS Bhardwaj and Gladstone: GIANT PLANET AURORAS ● 339

centrifugally driven torus model in which the energysource for Neptune’s aurora is plasma mass loadingand/or outward transport in the Triton torus (see Figure37), requiring a plasma source of around 1 kg s21 if
corotation is maintained out to 20 RN. However, themodel of Cheng [1990a] showed that the Triton torusplasma source is much smaller and hence the centrifu-gally driven torus model is unable to power Neptune’saurora. Cheng proposed that Neptune’s aurora may bedriven by a solar wind–Neptune interaction generatingfield-aligned currents and producing field-aligned poten-tial drops above the polar caps. He showed that solarwind interactions could, in principle, provide a power of3.2 3 1011 W incident on a circle of 26 RN radius, fornsw 5 0.0045 cm23 and vsw 5 403 km s21, given anefficiency for converting solar wind power to emissionsof about 0.3% (about one third the value at Earth).
Sandel et al. [1990] investigated the latitudinal andlongitudinal distribution of the nightside H2 emissions(96.7–111.5 nm) of Neptune. Two distinct types of Nep-tunian auroral emissions were found (see Figure 38).The first, a spatially distributed emission with almostuniform brightness, extends from 558S to 508N latitudeand longitudes of 08–608W. These emissions are weak,with integrated intensity over the wavelength range andfield of view of ;2.5 R, corresponding to an emittedpower of 6 3 107 W for the areal coverage of 13% of theplanet’s surface. The second, a more localized emissionin both longitude and latitude, was confined mainly inthe southernmost latitudes at ;2408W, with an inte-grated intensity of about 5 R over the same band pass.Although the brightness of this region was larger, theUVS spectrum is of poorer quality because of a smallerintegration time. The spectrum is consistent with H2band emissions, but the level of confidence is lower thanfor the diffuse type emissions. Assuming an emitting areaof 2.5% of the surface, the emitted power is 2 3 107 W.
The more localized and brighter auroral emissionsfrom the southern magnetic latitudes may be a classicalaurora. This interpretation is supported by the observa-tions of the characteristics of the magnetospheric plasmapopulation [Krimigis et al., 1989] and nonthermal radio
Figure 36. Voyager UVS observations of H2 (96.7–111.5nm) emissions from the nightside of Neptune, shown as afunction of central meridian longitude [Broadfoot et al., 1989,Figure 5]. The observations consisted of north-south scans, asindicated in the top diagram, with the data selected to avoidthe sunlit crescent. The solid circles are from the beginning ofa second 16.06-hour rotation of Neptune. Reprinted with per-mission from Science.
Figure 37. Diagram showing the possible formation ofplasma arcs at 1408–2108W and 3108–258W, due to the ioniza-tion of gases escaped from Triton (tilted 218 with respect toNeptune’s equator) as they encounter the plasma equatorialplane (which rotates with the planet but is canted at a largeangle (here shown as 408) to the equator) [Broadfoot et al.,1989, Figure 6]. Reprinted with permission from Science.
Figure 38. Voyager UVS map of H2 96.7- to 111.5-nm emis-sions from the dark side of Neptune [Sandel et al., 1990, Figure1]. The large peak near 2408 CML is thought to be a southernhemisphere aurora; the latitudinally broad region of emissionnear 08–608 CML may be due to precipitation of conjugatephotoelectrons from the daylit side of the planet.
340 ● Bhardwaj and Gladstone: GIANT PLANET AURORAS 38, 3 / REVIEWS OF GEOPHYSICS

emissions [Gurnett et al., 1989; Warwick et al., 1989] ofthe type normally associated with auroral particle accel-eration. This interpretation implies a brighter aurora atthe northern pole, owing to weaker field strength there,which escaped detection because the 518N latitude ofthat pole places it mostly outside the viewing area ofUVS. Thus we lack a reliable measurement of auroralemission from the northern pole.
Sandel et al. [1990] proposed, following the suggestionof Broadfoot et al. [1989], that the brighter and spatiallyconfined component of the aurora could be powered byNeptune’s rotational energy extracted from Neptune’sionosphere through its electrodynamical coupling withTriton’s plasma arcs [cf. Hill and Dessler, 1990]. Theimplied upper limit for mass loading of the magneto-sphere by Triton is estimated to be ;1 kg s21. Theconsequences of such a mass loading rate for convectionin Neptune’s magnetosphere are discussed by Hill andDessler [1990], who concluded that a mass loading rate ofthis magnitude is consistent with results from the Voy-ager PLS and LECP [Belcher et al., 1989; Krimigis et al.,1989].
However, Cheng [1990a] estimated a net injectionrate of only ;45 g s21 for H1 (taking charge exchangeand gravity into account) and ;6 g s21 for N1 (scalingfrom the inferred injection rate in the Saturn systemfrom Titan) and therefore argued that the injection ratesare too low (compared with ;1 kg s21) to drive theaurora. He suggested that Neptune’s aurora is drivenmainly by the solar wind via a low-latitude boundarylayer (LLBL) interaction [Cheng, 1989].
Mauk et al. [1991] have conjectured that the morelocalized and brighter auroral emissions from the south-ern magnetic latitudes are caused by the diffuse precip-itation of energetic electrons trapped at L values *8 RN.The observed electrons in the L . 8 RN region havebroad pitch angle distribution, and the analysis of Mauket al. [1994] suggested that pitch angle scattering can fillup the pitch angle distribution in about 2 hours. Theemission energy flux observed by the Voyager UVS is;1024 ergs cm22 s21, which requires (according to theconversion efficiencies of Sandel et al. [1990]) an elec-tron input power of greater than 1023 ergs cm22 s21.The required auroral power could be obtained from atrapped electron population with ;0.03% of the trappedradiation belt intensities, since the hot electrons ob-served by the LECP experiment [Krimigis et al., 1989;Cheng et al., 1991], if isotropic, could deliver up to ;3ergs cm22 s21 of power to the atmosphere [Mauk et al.,1991]. Also, the L . 8 RN regions map onto Neptune’ssurface with a size of ;3.2% of the planets surface foreach hemisphere with central dipole. This value agreeswell with the size of the auroral emission region of;2.5% seen by the UVS [Sandel et al., 1990]. The studyof Mauk et al. [1994] indicated that the pitch anglescattering rate of energetic electrons near L 5 8 RN islarge enough to cause electrons to precipitate in suffi-cient quantities to power the aurora. These authors
proposed that this brighter component of Neptune’saurora is analogous to the diffuse aurora at Earth.
For the latitudinally diffuse nightside emissions,which are not consistent with usual auroral morphology,two alternative models have been proposed. Sandel et al.[1990] suggested that the diffuse emissions are excited byphotoelectrons precipitating from the magnetically con-jugate sunlit hemisphere. The order of magnitude esti-mates made by Sandel et al. showed that this mechanismrequires an overall solar flux to emission conversionefficiency of ;0.5% (scaling the solar photon flux withenergies .30 eV at 1 AU to the heliocentric distance ofNeptune), which seemed not unreasonable, but no de-tailed model calculations have been performed to assessquantitatively the effectiveness of the proposed photo-electron excitation mechanism. This mechanism will oc-cur only in the nearly pole-on configuration (see Figure39) that occurs once each Neptune rotation. (The ori-entation of Neptune’s spin axis (28.88 obliquity) coupledwith the large magnetic tilt angle (46.88) allows Nep-tune’s magnetosphere to change every 8 hours (a halfrotation) from an “Earth-like” magnetosphere with twopolar cusps to a “pole-on” magnetosphere with only onepolar cusp. One consequence of such a magnetosphericgeometry is that every half rotation Neptune’s magneto-
Figure 39. (a) Diagram showing how the Voyager UVS ob-servations near 608 CML would tend to see emissions fromconjugate photoelectrons produced on the daylit side of Nep-tune, while (b) those taken near 2408 CML see more of anopen-field-line configuration with few emissions [Sandel et al.,1990, Figure 2].
38, 3 / REVIEWS OF GEOPHYSICS Bhardwaj and Gladstone: GIANT PLANET AURORAS ● 341
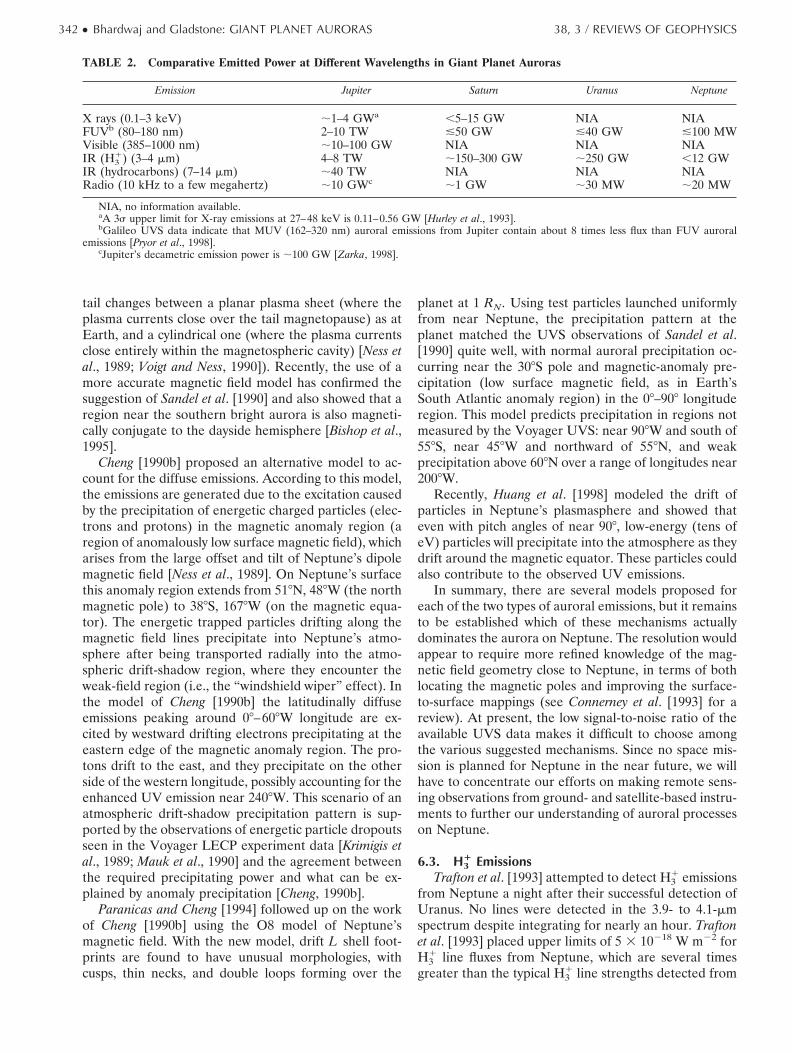
tail changes between a planar plasma sheet (where theplasma currents close over the tail magnetopause) as atEarth, and a cylindrical one (where the plasma currentsclose entirely within the magnetospheric cavity) [Ness etal., 1989; Voigt and Ness, 1990]). Recently, the use of amore accurate magnetic field model has confirmed thesuggestion of Sandel et al. [1990] and also showed that aregion near the southern bright aurora is also magneti-cally conjugate to the dayside hemisphere [Bishop et al.,1995].
Cheng [1990b] proposed an alternative model to ac-count for the diffuse emissions. According to this model,the emissions are generated due to the excitation causedby the precipitation of energetic charged particles (elec-trons and protons) in the magnetic anomaly region (aregion of anomalously low surface magnetic field), whicharises from the large offset and tilt of Neptune’s dipolemagnetic field [Ness et al., 1989]. On Neptune’s surfacethis anomaly region extends from 518N, 488W (the northmagnetic pole) to 388S, 1678W (on the magnetic equa-tor). The energetic trapped particles drifting along themagnetic field lines precipitate into Neptune’s atmo-sphere after being transported radially into the atmo-spheric drift-shadow region, where they encounter theweak-field region (i.e., the “windshield wiper” effect). Inthe model of Cheng [1990b] the latitudinally diffuseemissions peaking around 08–608W longitude are ex-cited by westward drifting electrons precipitating at theeastern edge of the magnetic anomaly region. The pro-tons drift to the east, and they precipitate on the otherside of the western longitude, possibly accounting for theenhanced UV emission near 2408W. This scenario of anatmospheric drift-shadow precipitation pattern is sup-ported by the observations of energetic particle dropoutsseen in the Voyager LECP experiment data [Krimigis etal., 1989; Mauk et al., 1990] and the agreement betweenthe required precipitating power and what can be ex-plained by anomaly precipitation [Cheng, 1990b].
Paranicas and Cheng [1994] followed up on the workof Cheng [1990b] using the O8 model of Neptune’smagnetic field. With the new model, drift L shell foot-prints are found to have unusual morphologies, withcusps, thin necks, and double loops forming over the
planet at 1 RN. Using test particles launched uniformlyfrom near Neptune, the precipitation pattern at theplanet matched the UVS observations of Sandel et al.[1990] quite well, with normal auroral precipitation oc-curring near the 308S pole and magnetic-anomaly pre-cipitation (low surface magnetic field, as in Earth’sSouth Atlantic anomaly region) in the 08–908 longituderegion. This model predicts precipitation in regions notmeasured by the Voyager UVS: near 908W and south of558S, near 458W and northward of 558N, and weakprecipitation above 608N over a range of longitudes near2008W.
Recently, Huang et al. [1998] modeled the drift ofparticles in Neptune’s plasmasphere and showed thateven with pitch angles of near 908, low-energy (tens ofeV) particles will precipitate into the atmosphere as theydrift around the magnetic equator. These particles couldalso contribute to the observed UV emissions.
In summary, there are several models proposed foreach of the two types of auroral emissions, but it remainsto be established which of these mechanisms actuallydominates the aurora on Neptune. The resolution wouldappear to require more refined knowledge of the mag-netic field geometry close to Neptune, in terms of bothlocating the magnetic poles and improving the surface-to-surface mappings (see Connerney et al. [1993] for areview). At present, the low signal-to-noise ratio of theavailable UVS data makes it difficult to choose amongthe various suggested mechanisms. Since no space mis-sion is planned for Neptune in the near future, we willhave to concentrate our efforts on making remote sens-ing observations from ground- and satellite-based instru-ments to further our understanding of auroral processeson Neptune.
6.3. H31 Emissions
Trafton et al. [1993] attempted to detect H31 emissions
from Neptune a night after their successful detection ofUranus. No lines were detected in the 3.9- to 4.1-mmspectrum despite integrating for nearly an hour. Traftonet al. [1993] placed upper limits of 5 3 10218 W m22 forH3
1 line fluxes from Neptune, which are several timesgreater than the typical H3
1 line strengths detected from
TABLE 2. Comparative Emitted Power at Different Wavelengths in Giant Planet Auroras
Emission Jupiter Saturn Uranus Neptune
X rays (0.1–3 keV) ;1–4 GWa ,5–15 GW NIA NIAFUVb (80–180 nm) 2–10 TW &50 GW &40 GW &100 MWVisible (385–1000 nm) ;10–100 GW NIA NIA NIAIR (H3
1) (3–4 mm) 4–8 TW ;150–300 GW ;250 GW ,12 GWIR (hydrocarbons) (7–14 mm) ;40 TW NIA NIA NIARadio (10 kHz to a few megahertz) ;10 GWc ;1 GW ;30 MW ;20 MW
NIA, no information available.aA 3s upper limit for X-ray emissions at 27–48 keV is 0.11–0.56 GW [Hurley et al., 1993].bGalileo UVS data indicate that MUV (162–320 nm) auroral emissions from Jupiter contain about 8 times less flux than FUV auroral
emissions [Pryor et al., 1998].cJupiter’s decametric emission power is ;100 GW [Zarka, 1998].
342 ● Bhardwaj and Gladstone: GIANT PLANET AURORAS 38, 3 / REVIEWS OF GEOPHYSICS

TA
BL
E3.
Sum
mar
yof
Cha
ract
eris
tics
ofU
VA
uror
ason
the
Gia
ntP
lane
ts
Pro
pert
yJu
pite
rSa
turn
Ura
nus
Nep
tune
Em
issi
ons
obse
rved
H2
(80–
170
nm),
HL
ya
;V1,
V2
H2
(80–
170
nm),
HL
ya
;V1,
V2
H2
(88–
112
nm),
HL
ya
;V2
H2
(98–
112
nm);
V2
H2
(115
–170
nm),
HL
ya
;IU
E,H
STH
Ly
a;I
UE
HL
ya
;IU
EH
2(8
3–17
0nm
),H
Ly
a;H
UT
H2
(115
–170
nm),
HL
ya
;HST
H2
(85–
250
nm),
HL
ya
;GL
L
Surf
ace
brig
htne
ssa
H2,;
100–
500
kR(u
pto
;2
MR
)H
2,;
10–1
00kR
(up
to;
150
kR)
H2,;
10kR
diff
use,
;2.
5R
HL
ya
,;50
–150
kRH
Ly
a,;
2–20
kRH
Ly
a,;
1.5
kRdi
scre
te,;
5R
Em
itted
pow
er;
2–10
TW
&50
GW
&40
GW
&0.
1G
W
Bas
icm
orph
olog
yco
ntin
uous
oval
sat
each
pole
;ap
prox
imat
ely
coro
tatin
g;m
ain
oval
sne
arL
;15
–30;
mor
ning
show
ssi
ngle
narr
owar
c(;
200–
2000
kmw
ide)
;aft
erno
onsh
ows
mul
tiple
arcs
(with
emis
sion
insi
depo
lar
cap)
;em
issi
onal
titud
e;
240
km
high
-latit
ude
(;80
8)ov
als;
brig
htes
tin
mor
ning
sect
or;e
mis
sion
altit
ude
;10
00km
emis
sion
sfr
ombo
thpo
les
at60
8–65
8m
agne
ticla
titud
e;br
ight
est
at;
1808
long
itude
;no
rthe
rnau
rora
;2–
4tim
esbr
ight
erth
anso
uthe
rnau
rora
diff
use
emis
sion
sat
558S
–558
N,
08–6
08lo
ngitu
de(1
3%of
surf
ace)
;dis
cret
eem
issi
ons
athi
ghso
uthe
rnla
titud
es,1
808–
2708
long
itude
(2.5
%of
surf
ace)
Gen
erat
ion
scen
ario
e2pr
ecip
itatio
nat
L;
15–3
0;pr
imar
ye2
ener
gy;
10–5
0ke
V(p
enet
rate
sC
H4
hom
opau
se),
with
e2flu
x;
30–3
00er
gscm
22
s21;S
and
Oio
npr
ecip
itatio
nat
L;
8–12
prod
uces
X-r
ayem
issi
ons
e2pr
ecip
itatio
n;pr
imar
ye2
ener
gy&
10ke
V,w
ithe2
flux
;1
erg
cm2
2
s21;p
ossi
ble
Nio
npr
ecip
itatio
n(o
rigi
natin
gfr
omT
itan)
e2pr
ecip
itatio
nat
L;
5–10
;pr
imar
ye2
ener
gy&
10ke
V,
with
e2flu
x;
1er
gcm
22
s21
e2,
ion
prec
ipita
tion
(N1
from
Tri
ton)
;pos
sibl
eso
urce
sar
eco
njug
ate
phot
oele
ctro
ns(d
iffus
e)an
dw
hist
ler-
indu
ced
pitc
han
gle
scat
teri
ng(d
iscr
ete)
Rel
ated
obse
rvat
ions
UV
-dar
k,hi
gh-a
ltitu
deha
ze(l
ikel
yau
rora
llypr
oduc
ed)
UV
-dar
k,hi
gh-a
ltitu
deha
ze(l
ikel
yau
rora
llypr
oduc
ed);
max
imum
haze
UV
-abs
orpt
ion
58–8
8eq
uato
rwar
dof
mai
nov
al
peak
Nan
dS
UV
brig
htne
ssco
inci
dent
with
max
ima
inw
hist
ler-
mod
epl
asm
aw
aves
and
22-
to35
-keV
e2flu
x
The
vari
ous
auro
ral-U
Vob
serv
ing
plat
form
sar
eV
1,V
oyag
er1;
V2,
Voy
ager
2;IU
E,I
nter
natio
nalU
ltrav
iole
tE
xplo
rer;
HST
,Hub
ble
Spac
eT
eles
cope
;HU
T,H
opki
nsU
ltrav
iole
tT
eles
cope
(par
tof
the
Ast
ro-1
and
Ast
ro-2
spac
esh
uttle
mis
sion
s);a
ndG
LL
,Gal
ileo.
a The
rayl
eigh
(R)
isa
unit
ofsu
rfac
ebr
ight
ness
equi
vale
ntto
106
phot
ons
cm2
2s2
14p
sr2
1 .
38, 3 / REVIEWS OF GEOPHYSICS Bhardwaj and Gladstone: GIANT PLANET AURORAS ● 343
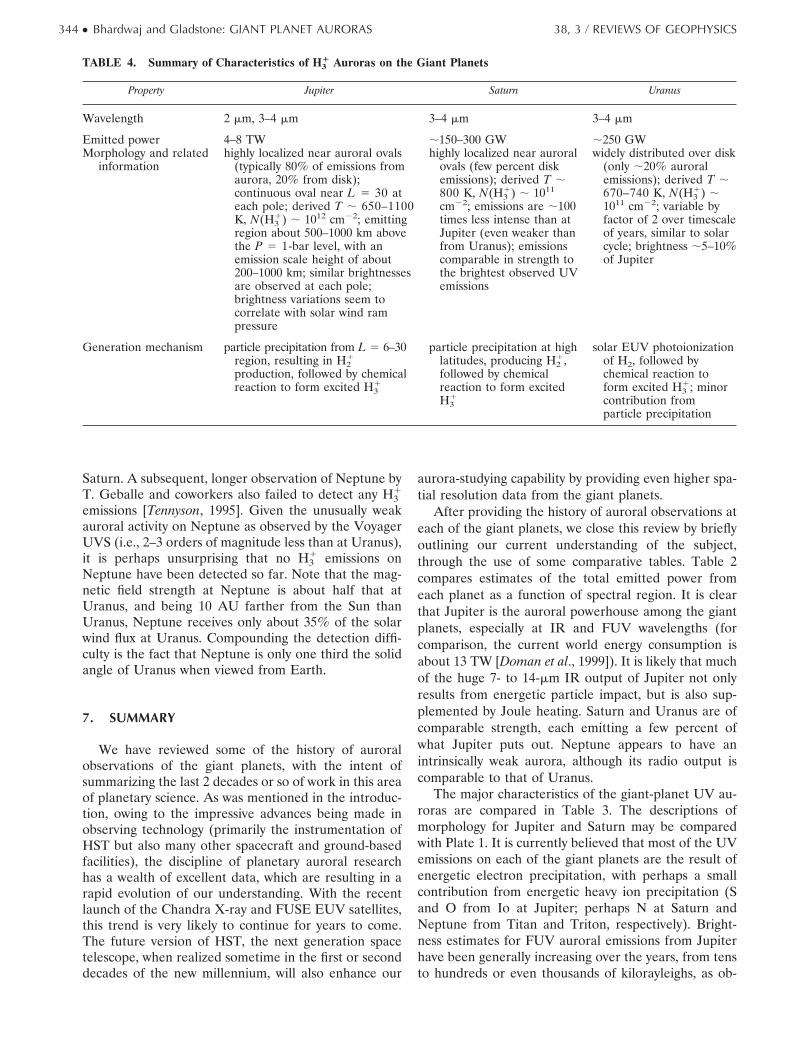
Saturn. A subsequent, longer observation of Neptune byT. Geballe and coworkers also failed to detect any H3
1
emissions [Tennyson, 1995]. Given the unusually weakauroral activity on Neptune as observed by the VoyagerUVS (i.e., 2–3 orders of magnitude less than at Uranus),it is perhaps unsurprising that no H3
1 emissions onNeptune have been detected so far. Note that the mag-netic field strength at Neptune is about half that atUranus, and being 10 AU farther from the Sun thanUranus, Neptune receives only about 35% of the solarwind flux at Uranus. Compounding the detection diffi-culty is the fact that Neptune is only one third the solidangle of Uranus when viewed from Earth.
7. SUMMARY
We have reviewed some of the history of auroralobservations of the giant planets, with the intent ofsummarizing the last 2 decades or so of work in this areaof planetary science. As was mentioned in the introduc-tion, owing to the impressive advances being made inobserving technology (primarily the instrumentation ofHST but also many other spacecraft and ground-basedfacilities), the discipline of planetary auroral researchhas a wealth of excellent data, which are resulting in arapid evolution of our understanding. With the recentlaunch of the Chandra X-ray and FUSE EUV satellites,this trend is very likely to continue for years to come.The future version of HST, the next generation spacetelescope, when realized sometime in the first or seconddecades of the new millennium, will also enhance our
aurora-studying capability by providing even higher spa-tial resolution data from the giant planets.
After providing the history of auroral observations ateach of the giant planets, we close this review by brieflyoutlining our current understanding of the subject,through the use of some comparative tables. Table 2compares estimates of the total emitted power fromeach planet as a function of spectral region. It is clearthat Jupiter is the auroral powerhouse among the giantplanets, especially at IR and FUV wavelengths (forcomparison, the current world energy consumption isabout 13 TW [Doman et al., 1999]). It is likely that muchof the huge 7- to 14-mm IR output of Jupiter not onlyresults from energetic particle impact, but is also sup-plemented by Joule heating. Saturn and Uranus are ofcomparable strength, each emitting a few percent ofwhat Jupiter puts out. Neptune appears to have anintrinsically weak aurora, although its radio output iscomparable to that of Uranus.
The major characteristics of the giant-planet UV au-roras are compared in Table 3. The descriptions ofmorphology for Jupiter and Saturn may be comparedwith Plate 1. It is currently believed that most of the UVemissions on each of the giant planets are the result ofenergetic electron precipitation, with perhaps a smallcontribution from energetic heavy ion precipitation (Sand O from Io at Jupiter; perhaps N at Saturn andNeptune from Titan and Triton, respectively). Bright-ness estimates for FUV auroral emissions from Jupiterhave been generally increasing over the years, from tensto hundreds or even thousands of kilorayleighs, as ob-
TABLE 4. Summary of Characteristics of H31 Auroras on the Giant Planets
Property Jupiter Saturn Uranus
Wavelength 2 mm, 3–4 mm 3–4 mm 3–4 mm
Emitted power 4–8 TW ;150–300 GW ;250 GWMorphology and related
informationhighly localized near auroral ovals
(typically 80% of emissions fromaurora, 20% from disk);continuous oval near L 5 30 ateach pole; derived T ; 650–1100K, N(H3
1) ; 1012 cm22; emittingregion about 500–1000 km abovethe P 5 1-bar level, with anemission scale height of about200–1000 km; similar brightnessesare observed at each pole;brightness variations seem tocorrelate with solar wind rampressure
highly localized near auroralovals (few percent diskemissions); derived T ;800 K, N(H3
1) ; 1011
cm22; emissions are ;100times less intense than atJupiter (even weaker thanfrom Uranus); emissionscomparable in strength tothe brightest observed UVemissions
widely distributed over disk(only ;20% auroralemissions); derived T ;670–740 K, N(H3
1) ;1011 cm22; variable byfactor of 2 over timescaleof years, similar to solarcycle; brightness ;5–10%of Jupiter
Generation mechanism particle precipitation from L 5 6–30region, resulting in H2
1
production, followed by chemicalreaction to form excited H3
1
particle precipitation at highlatitudes, producing H2
1,followed by chemicalreaction to form excitedH3
1
solar EUV photoionizationof H2, followed bychemical reaction toform excited H3
1; minorcontribution fromparticle precipitation
344 ● Bhardwaj and Gladstone: GIANT PLANET AURORAS 38, 3 / REVIEWS OF GEOPHYSICS
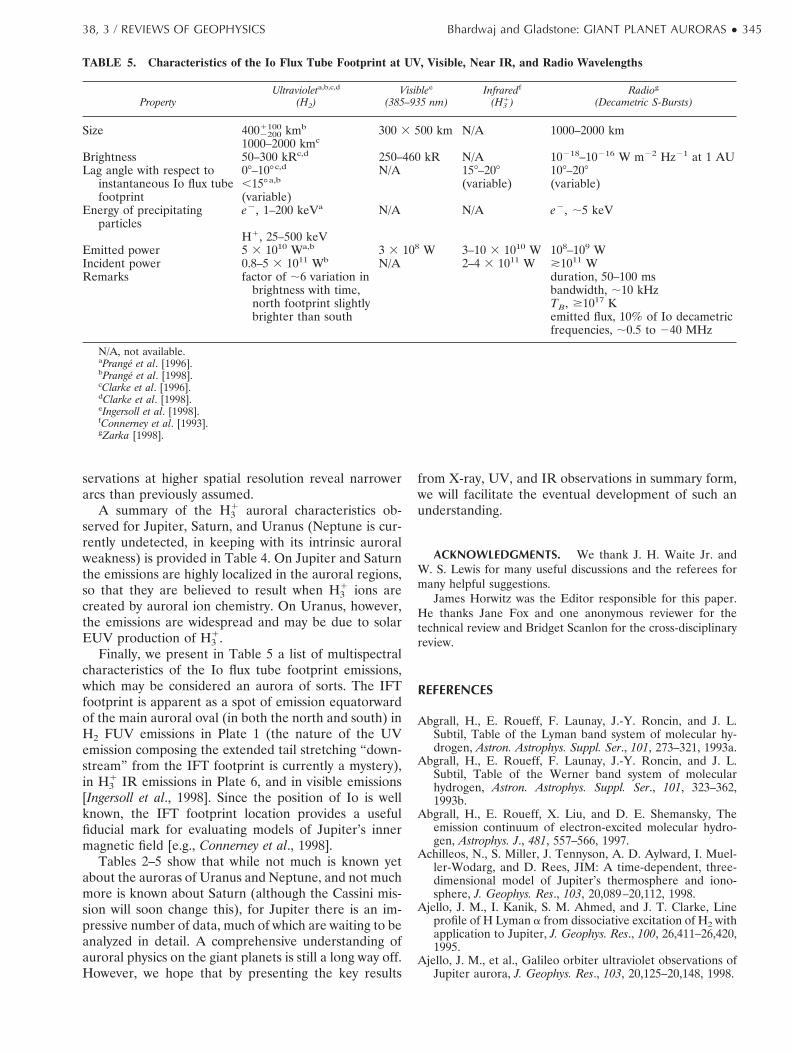
servations at higher spatial resolution reveal narrowerarcs than previously assumed.
A summary of the H31 auroral characteristics ob-
served for Jupiter, Saturn, and Uranus (Neptune is cur-rently undetected, in keeping with its intrinsic auroralweakness) is provided in Table 4. On Jupiter and Saturnthe emissions are highly localized in the auroral regions,so that they are believed to result when H3
1 ions arecreated by auroral ion chemistry. On Uranus, however,the emissions are widespread and may be due to solarEUV production of H3
1.Finally, we present in Table 5 a list of multispectral
characteristics of the Io flux tube footprint emissions,which may be considered an aurora of sorts. The IFTfootprint is apparent as a spot of emission equatorwardof the main auroral oval (in both the north and south) inH2 FUV emissions in Plate 1 (the nature of the UVemission composing the extended tail stretching “down-stream” from the IFT footprint is currently a mystery),in H3
1 IR emissions in Plate 6, and in visible emissions[Ingersoll et al., 1998]. Since the position of Io is wellknown, the IFT footprint location provides a usefulfiducial mark for evaluating models of Jupiter’s innermagnetic field [e.g., Connerney et al., 1998].
Tables 2–5 show that while not much is known yetabout the auroras of Uranus and Neptune, and not muchmore is known about Saturn (although the Cassini mis-sion will soon change this), for Jupiter there is an im-pressive number of data, much of which are waiting to beanalyzed in detail. A comprehensive understanding ofauroral physics on the giant planets is still a long way off.However, we hope that by presenting the key results
from X-ray, UV, and IR observations in summary form,we will facilitate the eventual development of such anunderstanding.
ACKNOWLEDGMENTS. We thank J. H. Waite Jr. andW. S. Lewis for many useful discussions and the referees formany helpful suggestions.
James Horwitz was the Editor responsible for this paper.He thanks Jane Fox and one anonymous reviewer for thetechnical review and Bridget Scanlon for the cross-disciplinaryreview.
REFERENCES
Abgrall, H., E. Roueff, F. Launay, J.-Y. Roncin, and J. L.Subtil, Table of the Lyman band system of molecular hy-drogen, Astron. Astrophys. Suppl. Ser., 101, 273–321, 1993a.
Abgrall, H., E. Roueff, F. Launay, J.-Y. Roncin, and J. L.Subtil, Table of the Werner band system of molecularhydrogen, Astron. Astrophys. Suppl. Ser., 101, 323–362,1993b.
Abgrall, H., E. Roueff, X. Liu, and D. E. Shemansky, Theemission continuum of electron-excited molecular hydro-gen, Astrophys. J., 481, 557–566, 1997.
Achilleos, N., S. Miller, J. Tennyson, A. D. Aylward, I. Muel-ler-Wodarg, and D. Rees, JIM: A time-dependent, three-dimensional model of Jupiter’s thermosphere and iono-sphere, J. Geophys. Res., 103, 20,089–20,112, 1998.
Ajello, J. M., I. Kanik, S. M. Ahmed, and J. T. Clarke, Lineprofile of H Lyman a from dissociative excitation of H2 withapplication to Jupiter, J. Geophys. Res., 100, 26,411–26,420,1995.
Ajello, J. M., et al., Galileo orbiter ultraviolet observations ofJupiter aurora, J. Geophys. Res., 103, 20,125–20,148, 1998.
TABLE 5. Characteristics of the Io Flux Tube Footprint at UV, Visible, Near IR, and Radio Wavelengths
PropertyUltravioleta,b,c,d
(H2)Visiblee
(385–935 nm)Infraredf
(H31)
Radiog
(Decametric S-Bursts)
Size 40022001100 kmb 300 3 500 km N/A 1000–2000 km
1000–2000 kmc
Brightness 50–300 kRc,d 250–460 kR N/A 10218–10216 W m22 Hz21 at 1 AULag angle with respect to
instantaneous Io flux tubefootprint
08–108 c,d N/A 158–208 108–208,158a,b (variable) (variable)(variable)
Energy of precipitatingparticles
e2, 1–200 keVa N/A N/A e2, ;5 keV
H1, 25–500 keVEmitted power 5 3 1010 Wa,b 3 3 108 W 3–10 3 1010 W 108–109 WIncident power 0.8–5 3 1011 Wb N/A 2–4 3 1011 W *1011 WRemarks factor of ;6 variation in
brightness with time,north footprint slightlybrighter than south
duration, 50–100 msbandwidth, ;10 kHzTB, $1017 Kemitted flux, 10% of Io decametricfrequencies, ;0.5 to 240 MHz
N/A, not available.aPrange et al. [1996].bPrange et al. [1998].cClarke et al. [1996].dClarke et al. [1998].eIngersoll et al. [1998].fConnerney et al. [1993].gZarka [1998].
38, 3 / REVIEWS OF GEOPHYSICS Bhardwaj and Gladstone: GIANT PLANET AURORAS ● 345

Akasofu, S.-I., The aurora, in Light From the Sky: ReadingsFrom Scientific American, pp. 13–20, W. H. Freeman, NewYork, 1980.
Anglin, J. D., J. R. Burrows, J. L. Mu, and M. D. Wilson,Trapped energetic ions in Jupiter’s inner magnetosphere, J.Geophys. Res., 102, 1–36, 1997.
Atreya, S. K., Atmospheres and Ionospheres of the Outer Planetsand Their Satellites, 224 pp., Springer-Verlag, New York,1986.
Atreya, S. K., and T. M. Donahue, Model ionospheres ofJupiter, in Jupiter, edited by T. Gehrels, pp. 304–318, Univ.of Ariz. Press, Tucson, 1976.
Atreya, S. K., Y. L. Yung, T. M. Donahue, and E. S. Barker,Search for Jovian auroral hot spots, Astrophys. J., 218,L83–L87, 1977.
Atreya, S. K., J. H. Waite Jr., T. M. Donahue, A. F. Nagy, andJ. C. McConnell, Theory, measurements and models of theupper atmosphere and ionosphere of Saturn, in Saturn,edited by T. Gehrels and M. S. Matthews, pp. 239–277,Univ. of Ariz. Press, Tucson, 1984.
Bagenal, F., and J. D. Sullivan, Direct plasma measurements inthe Io torus and inner magnetosphere of Jupiter, J. Geo-phys. Res., 86, 8447–8466, 1981.
Ballester, G. E., Magnetospheric interactions in the majorplanets, in Ultraviolet Astrophysics Beyond the IUE FinalArchive, Eur. Space Agency Spec. Publ., ESA-SP-413, 21–28,1998.
Ballester, G. E., S. Miller, J. Tennyson, L. M. Trafton, andT. R. Geballe, Latitudinal temperature variations of JovianH3
1, Icarus, 107, 189–194, 1994.Ballester, G. E., et al., Time-resolved observations of Jupiter’s
far-ultraviolet aurora, Science, 274, 409–413, 1996.Banks, P. M., C. R. Chappell, and A. F. Nagy, A new model for
the interaction of auroral electrons with the atmosphere:Spectral degradation, backscatter, optical emission, andionization, J. Geophys. Res., 79, 1459–1470, 1974.
Barbosa, D. D., Titan’s atomic nitrogen torus—Inferred prop-erties and consequences for the Saturnian aurora, Icarus,72, 53–61, 1987.
Barbosa, D. D., Bremsstrahlung X-rays from Jovian auroralelectrons, J. Geophys. Res., 95, 14,969–14,976, 1990a.
Barbosa, D. D., Bremsstrahlung X ray spectra of Jupiter andSaturn: Predictions for future planetary spacecraft, Geo-phys. Res. Lett., 17, 1029–1032, 1990b.
Barbosa, D. D., Auroral precipitation flux of ions and electronsin Saturn’s outer magnetosphere, Planet. Space Sci., 38,1295–1304, 1990c.
Barbosa, D. D., Reply to “Comment on ‘Bremsstrahlung X-rays from Jovian auroral electrons by D. D. Barbosa’ byJ. H. Waite Jr.,” J. Geophys. Res., 96, 19,533–19,534, 1991.
Baron, R. L., R. D. Joseph, T. Owen, J. Tennyson, S. Miller,and G. E. Ballester, Imaging Jupiter’s aurorae from H3
1
emissions in the 3–4 mm band, Nature, 353, 539–542, 1991.Baron, R. L., T. Owen, J. E. P. Connerney, T. Satoh, and J.
Harrington, Solar wind control of Jupiter’s H31 auroras,
Icarus, 120, 437–442, 1996.Barrow, C. H., and M. D. Desch, Solar wind control of Jupi-
ter’s hectometric radio emission, Astron. Astrophys., 213,495–501, 1989.
Barrow, C. H., F. Genova, and M. D. Desch, Solar wind controlof Jupiter’s decametric radio emission, Astron. Astrophys.,165, 244–250, 1986.
Belcher, J. W., et al., Plasma observations near Neptune:Initial results from Voyager 2, Science, 246, 1478–1483,1989.
Ben Jaffel, L., V. Leers, and B. R. Sandel, Dark auroral oval onSaturn discovered in Hubble Space Telescope ultravioletimages, Science, 269, 951–953, 1995.
Berge, G. L., and S. Gulkis, Earth-based radio observations of
Jupiter: Millimeter to meter wavelengths, in Jupiter, editedby T. Gehrels, pp. 621–692, Univ. of Ariz. Press, Tucson,1976.
Bhardwaj, A., Airglow on the outer planets, Sci. Rep. SPL-SR-01-97, 65 pp., Space Phys. Lab., Vikram Sarabhai SpaceCent., Trivandrum, India, 1997a.
Bhardwaj, A., Ring current H atom precipitation on the outerplanets, Adv. Space Res., 20(2), 233–237, 1997b.
Bhardwaj, A., and G. R. Gladstone, Auroras on Saturn, Ura-nus, and Neptune, Adv. Space Res., 26(10), 1551–1558,2000.
Bhardwaj, A., and R. P. Singhal, Auroral and dayglow pro-cesses on Neptune, Indian J. Radio Space Phys., 19, 171–176, 1990.
Bhardwaj, A., and R. P. Singhal, Optically thin H Lyman alphaproduction on outer planets: Low-energy proton accelera-tion in parallel electric fields and neutral H atom precipi-tation from ring current, J. Geophys. Res., 98, 9473–9481,1993.
Bigg, E. K., Influence of the satellite Io on Jupiter’s decametricemission, Nature, 203, 1008–1010, 1964.
Bishop, J., S. K. Atreya, P. N. Romani, G. S. Orton, B. R.Sandel, and R. V. Yelle, The middle and upper atmosphereof Neptune, in Neptune and Triton, edited by D. P. Cruik-shank, pp. 427–487, Univ. of Ariz. Press, Tucson, 1995.
Bisikalo, D. V., V. I. Shematovich, J.-C. Gerard, G. R. Glad-stone, and J. H. Waite Jr., The distribution of hot hydrogenatoms produced by electron and proton precipitation in theJovian aurora, J. Geophys. Res., 101, 21,157–21,168, 1996.
Broadfoot, A. L., et al., Extreme ultraviolet observations fromVoyager 1 encounter with Jupiter, Science, 204, 979–982,1979.
Broadfoot, A. L., B. R. Sandel, D. E. Shemansky, J. C. Mc-Connell, G. R. Smith, J. B. Holberg, S. K. Atreya, T. M.Donahue, D. F. Strobel, and J. L. Bertaux, Overview of theVoyager ultraviolet spectrometry results through Jupiterencounter, J. Geophys. Res., 86, 8259–8284, 1981a.
Broadfoot, A. L., et al., Extreme ultraviolet observations fromVoyager 1 encounter with Saturn, Science, 212, 206–211,1981b.
Broadfoot, A. L., et al., Ultraviolet spectrometer observationsof Uranus, Science, 233, 74–79, 1986.
Broadfoot, A. L., et al., Ultraviolet spectrometer observationsof Neptune and Triton, Science, 246, 1459–1466, 1989.
Burke, B. F., and K. L. Franklin, Observations of a variableradio source associated with the planet Jupiter, J. Geophys.Res., 60, 213–217, 1955.
Caldwell, J., A. T. Tokunaga, and F. C. Gillett, Possible infra-red aurora on Jupiter, Icarus, 44, 667–675, 1980.
Caldwell, J., A. T. Tokunaga, and G. S. Orton, Further obser-vations of 8-mm polar brightenings of Jupiter, Icarus, 53,133–140, 1983a.
Caldwell, J., R. Wagener, T. Owen, M. Combes, and T. En-crenaz, Tentative confirmation of an aurora on Uranus,Nature, 303, 310–312, 1983b.
Caldwell, J., R. Halthore, G. Orton, and J. Bergstralh, Infraredpolar brightenings on Jupiter, 4, Spatial properties of meth-ane emission, Icarus, 74, 331–339, 1988.
Caldwell, J., B. Turgeon, and X.-M. Hua, Hubble Space Tele-scope imaging of the north polar aurora on Jupiter, Science,257, 1512–1515, 1992.
Carr, T. D., M. D. Desch, and J. K. Alexander, Phenomenologyof magnetospheric radio emissions, in Physics of the JovianMagnetosphere, edited by A. J. Dessler, pp. 226–284, Cam-bridge Univ. Press, New York, 1983.
Cheng, A. F., Energetic neutral particles from Jupiter andSaturn, J. Geophys. Res., 91, 4524–4530, 1986.
Cheng, A. F., Magnetosphere of Neptune: Auroral zone field-
346 ● Bhardwaj and Gladstone: GIANT PLANET AURORAS 38, 3 / REVIEWS OF GEOPHYSICS
aligned potential drops?, Geophys. Res. Lett., 16, 953–956,1989.
Cheng, A. F., Triton torus and Neptune aurora, Geophys. Res.Lett., 17, 1669–1672, 1990a.
Cheng, A. F., Global magnetic anomaly and aurora of Nep-tune, Geophys. Res. Lett., 17, 1697–1700, 1990b.
Cheng, A. F., S. M. Krimigis, B. H. Mauk, E. P. Keath, C. G.Maclennan, L. J. Lanzerotti, M. T. Paonessa, and T. P.Armstrong, Energetic ion and electron phase space densi-ties in the magnetosphere of Uranus, J. Geophys. Res., 92,15,315–15,328, 1987.
Cheng, A. F., S. M. Krimigis, and L. J. Lanzerotti, Energeticparticles at Uranus, in Uranus, edited by J. T. Bergstralh,E. D. Miner, and M. S. Matthews, pp. 831–893, Univ. ofAriz. Press, Tucson, 1991.
Clarke, J. T., Detection of auroral hydrogen Lyman-alphaemission from Uranus, Astrophys. J., 263, L105–L109, 1982.
Clarke, J. T., IUE observations of Neptune for H Lyman-aemission, Geophys. Res. Lett., 15, 701–704, 1988.
Clarke, J. T., H. W. Moos, S. K. Atreya, and A. L. Lane,Observations from Earth orbit and variability of the polaraurora on Jupiter, Astrophys. J., 241, L179–L182, 1980.
Clarke, J. T., H. W. Moos, S. K. Atreya, and A. L. Lane, IUEdetection of bursts of H Lyman-alpha emission from Sat-urn, Nature, 290, 226–227, 1981.
Clarke, J. T., et al., Continued observations of the H Ly aemission from Uranus, J. Geophys. Res., 91, 8771–8781,1986.
Clarke, J. T., J. T. Trauger, and J. H. Waite Jr., Doppler-shifted H Ly a emissions from Jupiter’s aurora, Geophys.Res. Lett., 16, 587–590, 1989a.
Clarke, J. T., J. J. Caldwell, T. E. Skinner, and R. V. Yelle, Theaurora and airglow of Jupiter, in Time-Variable Phenomenain the Jovian System, edited by M. J. S. Belton, R. A. West,and J. Rahe, NASA Spec. Publ., SP-494, 211–220, 1989b.
Clarke, J. T., L. Ben Jaffel, A. Vidal-Madjar, G. R. Gladstone,J. H. Waite Jr., R. Prange, J.-C. Gerard, J. Ajello, and G.James, Hubble Space Telescope Goddard High-ResolutionSpectrograph H2 rotational spectra of Jupiter’s aurora, As-trophys. J., 430, L73–L76, 1994.
Clarke, J. T., et al., Far-ultraviolet imaging of Jupiter’s auroraand the Io “footprint,” Science, 274, 404–409, 1996.
Clarke, J. T., et al., Hubble Space Telescope imaging of Jupi-ter’s UV aurora during the Galileo orbiter mission, J. Geo-phys. Res., 103, 20,217–20,236, 1998.
Clary, R. S., and J. H. Hunter Jr., Hydrogen-alpha auroralactivity on Jupiter, Astrophys. J., 199, 517–521, 1975.
Connerney, J. E. P., Magnetic fields of the outer planets, J.Geophys. Res., 98, 18,659–18,679, 1993.
Connerney, J. E. P., and M. D. Desch, Comment on “Evidenceof Saturn’s magnetic field anomaly from Saturnian kilomet-ric radiation high-frequency limit” by P. Galopeau et al., J.Geophys. Res., 97, 8713–8717, 1992.
Connerney, J. E. P., M. H. Acuna, and N. F. Ness, Modelingthe Jovian current sheet and inner magnetosphere, J. Geo-phys. Res., 86, 8370–8384, 1981.
Connerney, J. E. P., L. Davis Jr., and D. L. Chenette, Magneticfield models, in Saturn, edited by T. Gehrels and M. S.Matthews, pp. 354–377, Univ. of Ariz. Press, Tucson, 1984.
Connerney, J. E. P., M. H. Acuna, and N. F. Ness, Themagnetic field of Uranus, J. Geophys. Res., 92, 15,329–15,336, 1987.
Connerney, J. E. P., R. L. Baron, T. Satoh, and T. Owen,Images of excited H3
1 at the foot of the Io flux tube inJupiter’s atmosphere, Science, 262, 1035–1038, 1993.
Connerney, J. E. P., T. Satoh, and R. L. Baron, Interpretationof auroral “light curves” with application to Jovian H3
1
emissions, Icarus, 122, 24–35, 1996.Connerney, J. E. P., M. H. Acuna, N. F. Ness, and T. Satoh,
New models of Jupiter’s magnetic field constrained by theIo flux tube footprint, J. Geophys. Res., 103, 11,929–11,939,1998.
Cook, A. F., II, A. Vallance Jones, and D. E. Shemansky,Visible aurora in Jupiter’s atmosphere?, J. Geophys. Res.,86, 8793–8796, 1981.
Coroniti, F. V., F. L. Scarf, C. F. Kennel, W. S. Kurth, andD. A. Gurnett, Detection of Jovian whistler mode chorus:Implications for the Io torus aurora, Geophys. Res. Lett., 7,45–48, 1980.
Coroniti, F. V., W. S. Kurth, F. L. Scarf, S. M. Krimigis, C. F.Kennel, and D. A. Gurnett, Whistler mode emissions in theUranian radiation belts, J. Geophys. Res., 92, 15,234–15,248,1987.
Cravens, T. E., Astrophysical applications of electron energydeposition in molecular hydrogen, Ph.D. thesis, HarvardUniv., Cambridge, Mass., 1975.
Cravens, T. E., Vibrationally excited molecular hydrogen in theupper atmosphere of Jupiter, J. Geophys. Res., 92, 11,083–11,100, 1987.
Cravens, T. E., and G. M. Eisenhower, The chemical effects ofauroral oxygen precipitation at Jupiter, Icarus, 100, 260–270, 1992.
Cravens, T. E., E. Howell, J. H. Waite Jr., and G. R. Glad-stone, Auroral oxygen precipitation at Jupiter, J. Geophys.Res., 100, 17,153–17,161, 1995.
Cravens, T. E., C. N. Keller, and B. Ray, Photochemicalsources of nonthermal neutrals for the exosphere of Titan,Planet. Space Sci., 45, 889–896, 1997.
Curtis, S. A., A prediction for Neptune exospheric tempera-ture, Geophys. Res. Lett., 15, 1319–1321, 1988.
Curtis, S. A., and N. F. Ness, Are Uranus’s rings black becausethey are in the solar wind?, Geophys. Res. Lett., 12, 855–858,1985.
Curtis, S. A., and N. F. Ness, Magnetostrophic balance inplanetary dynamos: Predictions for Neptune’s magneto-sphere, J. Geophys. Res., 91, 11,003–11,008, 1986.
Curtis, S. A., R. P. Lepping, and E. C. Sittler Jr., The centrif-ugal flute instability and the generation of Saturnian kilo-metric radiation, J. Geophys. Res., 91, 10,989–10,994, 1986.
de Pater, I., and C. K. Goertz, Synchrotron radiation fromNeptune: Neptune’s magnetic field and electron popula-tion, Geophys. Res. Lett., 16, 97–100, 1989.
Desch, M. D., Evidence for solar wind control of Saturn radioemission, J. Geophys. Res., 87, 4549–4554, 1982.
Desch, M. D., and M. L. Kaiser, Predictions for Uranus froma radiometric Bode’s law, Nature, 310, 755–757, 1984.
Desch, M. D., and H. O. Rucker, The relationship betweenSaturn kilometric radiation and the solar wind, J. Geophys.Res., 88, 8999–9006, 1983.
Desch, M. D., M. L. Kaiser, P. Zarka, A. Lecacheux,Y. Leblanc, M. Aubier, and A. Ortega-Molina, Uranus as aradio source, in Uranus, edited by J. T. Bergstralh, E. D.Miner, and M. S. Matthews, pp. 894–925, Univ. of Ariz.Press, Tucson, 1991.
Dessler, A. J., and B. R. Sandel, A quiescent magnetospherefor Neptune, Geophys. Res. Lett., 16, 957–960, 1989.
Dinelli, B. M., S. Miller, N. Achilleos, H. A. Lam, M. Cahill, J.Tennyson, M.-F. Yagod, T. Oka, J.-C. Hilico, and T. R.Geballe, UKIRT observations of the impact and conse-quences of comet Shoemaker-Levy 9 on Jupiter, Icarus, 126,107–125, 1997.
Dols, V., J. C. Gerard, F. Paresce, R. Prange, and A. Vidal-Madjar, Ultraviolet imaging of the Jovian aurora with theHubble Space Telescope, Geophys. Res. Lett., 19, 1803–1806, 1992.
Doman, L. E., et al., International energy outlook 1999, DOE/EIA-0484(99), 224 pp., Dep. of Energy, Washington, D. C.,1999.
38, 3 / REVIEWS OF GEOPHYSICS Bhardwaj and Gladstone: GIANT PLANET AURORAS ● 347
Dougherty, M. K., M. W. Dunlop, R. Prange, and D. Rego,Correspondence between field-aligned currents observedby Ulysses and HST auroral emission, Planet. Space Sci., 46,531–540, 1998.
Drossart, P., B. Bezard, S. K. Atreya, J. Lacy, E. Serabyn,A. Tokunaga, and T. Encrenaz, Enhanced acetylene emis-sion near the north pole of Jupiter, Icarus, 66, 610–618,1986.
Drossart, P., et al., Detection of H31 on Jupiter, Nature, 340,
539–541, 1989.Drossart, P., R. Prange, and J.-P. Maillard, Morphology of
infrared H31 emissions in the auroral regions of Jupiter,
Icarus, 97, 10–25, 1992.Drossart, P., B. Bezard, S. K. Atreya, J. Bishop, J. H. Waite Jr.,
and D. Boice, Thermal profiles in the auroral regions ofJupiter, J. Geophys. Res., 98, 18,803–18,811, 1993a.
Drossart, P., J.-P. Maillard, J. Caldwell, and J. Rosenqvist,Line-resolved spectroscopy of the Jovian H3
1 auroral emis-sion at 3.5 micrometers, Astrophys. J., 402, L25–L28, 1993b.
Dulk, G. A., J. A. Eddy, and J. P. Emerson, Search for visualaurora on Jupiter, Astrophys. J., 159, 1123–1124, 1970.
Durrance, S. T., and H. W. Moos, Intense Ly-a emission fromUranus, Nature, 299, 428–429, 1982.
Durrance, S. T., P. D. Feldman, and H. W. Moos, The spec-trum of the Jovian aurora 1150–1700 Å, Geophys. Res. Lett.,9, 652–655, 1982.
Edwards, P. J., and K. G. McCracken, Upper limits to the hardX-ray flux from the quiet Sun and Jupiter, J. Geophys. Res.,72, 1809–1812, 1967.
Encrenaz, T., R. Schulz, J. A. Stuwe, G. Wiedemann, P. Dros-sart, and J. Crovisier, Near-IR spectroscopy of Jupiter atthe time of comet Shoemaker-Levy 9 impacts: Emissions ofCH4, H3
1, and H2, Geophys. Res. Lett., 22, 1577–1580, 1995.Evans, D. S., Precipitating electron fluxes formed by a mag-
netic field aligned potential difference, J. Geophys. Res., 79,2853–2858, 1974.
Eviatar, A., and D. D. Barbosa, Jovian magnetospheric neutralwind and auroral precipitation flux, J. Geophys. Res., 89,7393–7398, 1984.
Fischer, H. M., E. Pehlke, G. Wibberbez, L. J. Lanzerotti, andJ. D. Mihalov, High-energy charged particles in the inner-most Jovian magnetosphere, Science, 272, 856–858, 1996.
Fisher, P. C., D. B. Clark, A. J. Meyerott, and K. L. Smith,Upper limit to Jupiter’s X-ray flux on September 30, 1972,Nature, 204, 982–983, 1964.
Fox, J. L., Models for aurora and airglow emissions from otherplanetary atmospheres, Can. J. Phys., 64, 1631–1656, 1986.
Frank, L. A., and W. R. Paterson, Production of hydrogen ionsat Io, J. Geophys. Res., 104, 10,345–10,354, 1999.
Fricke, K. H., and J. Darius, Observation of the Lyman-alphaalbedo of Uranus, in Proceedings of the Third European IUEConference, ESA SP-176, pp. 463–469, Eur. Space Agency,Paris, 1982.
Galopeau, P., A. Ortega-Molina, and P. Zarka, Evidence ofSaturn’s magnetic field anomaly from Saturnian kilometricradiation high-frequency limit, J. Geophys. Res., 96, 14,129–14,140, 1991.
Galopeau, P., P. Zarka, and D. Le Queau, Source location ofSaturn’s kilometric radiation: The Kelvin-Helmholtz insta-bility hypothesis, J. Geophys. Res., 100, 26,397–26,410, 1995.
Gao, S., C. W. Ho, T.-S. Huang, and C. J. Alexander, Uranus’smagnetic field and particle drifts in its inner magneto-sphere, J. Geophys. Res., 103, 20,257–20,265, 1998.
Geballe, T. R., M.-F. Jagod, and T. Oka, Detection of H31
infrared emission lines in Saturn, Astrophys. J., 408, L109–L112, 1993.
Gehrels, N., and E. C. Stone, Energetic oxygen and sulfur ionsin the Jovian magnetosphere and their contribution to theauroral excitation, J. Geophys. Res., 88, 5537–5550, 1983.
Gehrels, N., E. C. Stone, and J. H. Trainor, Energetic oxygenand sulfur in the Jovian magnetosphere, J. Geophys. Res.,86, 8906–8918, 1981.
Gerard, J.-C., and V. Singh, A model of energy deposition ofenergetic electrons and EUV emission in the Jovian andSaturnian atmospheres and implications, J. Geophys. Res.,87, 4525–4532, 1982.
Gerard, J.-C., V. Dols, F. Paresce, and R. Prange, Morphologyand time variation of the Jovian far UV aurora: HubbleSpace Telescope observations, J. Geophys. Res., 98, 18,793–18,801, 1993.
Gerard, J.-C., V. Dols, R. Prange, and F. Paresce, The mor-phology of the north Jovian ultraviolet aurora observedwith the Hubble Space Telescope, Planet. Space Sci., 42,905–917, 1994a.
Gerard, J.-C., D. Grodent, R. Prange, J. H. Waite, G. R.Gladstone, V. Dols, F. Paresce, A. Storrs, L. Ben Jaffel, andK. A. Franke, A remarkable auroral event on Jupiter ob-served in the ultraviolet with the Hubble Space Telescope,Science, 266, 1675–1678, 1994b.
Gerard, J.-C., V. Dols, D. Grodent, J. H. Waite, G. R. Glad-stone, and R. Prange, Simultaneous observations of theSaturnian aurora and polar haze with the HST/FOC, Geo-phys. Res. Lett., 22, 2685–2688, 1995.
Gerard, J.-C., D. Grodent, V. Dols, and J. H. Waite Jr., Thelongitudinal variation of the color ratio of the Jovian ultra-violet aurora: A geometric effect?, Geophys. Res. Lett., 25,1601–1604, 1998.
Giles, J. W., H. W. Moos, and W. R. McKinney, The farultraviolet (1200–1900 Å) spectrum of Jupiter obtainedwith a rocket-borne multichannel spectrometer, J. Geophys.Res., 81, 5797–5806, 1976.
Gilman, D. A., K. C. Hurley, F. D. Seward, H. W. Schnopper,J. D. Sullivan, and A. E. Metzger, An upper limit to X-rayemission from Saturn, Astrophys. J., 300, 453–455, 1986.
Gladstone, G. R., Radiative transfer with partial frequencyredistribution in inhomogeneous atmospheres: Applicationto the Jovian aurora, J. Quant. Spectrosc. Radiat. Transfer,27, 545–556, 1982.
Gladstone, G. R., and T. E. Skinner, Spectral analysis of Jovianauroral emissions, in Time-Variable Phenomena in the Jo-vian System, edited by M. J. S. Belton, R. A. West, andJ. Rahe, NASA Spec. Publ., SP-494, 221–228, 1989.
Gladstone, G. R., M. Allen, and Y. L. Yung, Hydrocarbonphotochemistry in the upper atmosphere of Jupiter, Icarus,119, 1–52, 1996.
Gladstone, G. R., J. H. Waite Jr., and W. S. Lewis, Secular andlocal time dependence of Jovian X ray emissions, J. Geo-phys. Res., 103, 20,083–20,088, 1998a.
Gladstone, G. R., J. H. Waite Jr., and J.-C. Gerard, Jovianauroral Lyman-a self-reversals: A window on Jupiter’s au-roral electrojet?, Bull. Am. Astron. Soc., 30, 1078, 1998b.
Goertz, C. K., Energization of charged particles in Jupiter’souter magnetosphere, J. Geophys. Res., 83, 3145–3150, 1978.
Goertz, C. K., Proton aurora on Jupiter’s nightside, Geophys.Res. Lett., 7, 365–368, 1980.
Grodent, D., V. Dols, J.-C. Gerard, and D. Rego, The equa-torial boundary of the ultraviolet Jovian north aurora ob-served with multispectral Hubble Space Telescope images,J. Geophys. Res., 101, 2163–2168, 1996.
Grodent, D., G. R. Gladstone, J.-C. Gerard, V. Dols, and J. H.Waite Jr., Simulation of the morphology of the Jovian UVnorth aurora observed with the Hubble Space Telescope,Icarus, 128, 306–321, 1997.
Gurnett, D. A., and F. L. Scarf, Plasma waves in the Jovianmagnetosphere, in Physics of the Jovian Magnetosphere, ed-ited by A. J. Dessler, pp. 285–316, Cambridge Univ. Press,New York, 1983.
Gurnett, D. A., W. S. Kurth, F. L. Scarf, and R. L. Poynter,
348 ● Bhardwaj and Gladstone: GIANT PLANET AURORAS 38, 3 / REVIEWS OF GEOPHYSICS

First plasma wave observations at Uranus, Science, 233,106–109, 1986.
Gurnett, D. A., W. S. Kurth, R. L. Poynter, L. J. Granroth,I. H. Cairns, W. M. Macek, S. L. Moses, F. V. Coroniti,C. F. Kennel, and D. D. Barbosa, First plasma wave obser-vations at Neptune, Science, 246, 1494–1498, 1989.
Haider, S. A., and R. P. Singhal, Analytical yield spectrumapproach to electron energy degradation in Earth’s atmo-sphere, J. Geophys. Res., 88, 7185–7189, 1983.
Halthore, R., A. Burrows, and J. Caldwell, Infrared polarbrightenings on Jupiter, 5, A thermal equilibrium model forthe north polar hot spot, Icarus, 74, 340–350, 1988.
Halthore, R., J. E. Allen, and P. L. Decola, A non-LTE modelfor the Jovian methane infrared emissions at high spectralresolution, Astrophys. J., 424, L61–L64, 1994.
Hamilton, D. C., G. Gloeckler, S. M. Krimigis, C. O. Bostrom,T. P. Armstrong, W. I. Axford, C. Y. Fan, L. J. Lanzerotti,and D. M. Hunten, Detection of energetic hydrogen mole-cules in Jupiter’s magnetosphere by Voyager 2: Evidencefor an ionospheric plasma source, Geophys. Res. Lett., 7,813–816, 1980.
Harris, W., J. T. Clarke, M. A. McGrath, and G. E. Ballester,Analysis of Jovian auroral H Ly-a emission (1981–1991),Icarus, 124, 350–365, 1996.
Haymes, R. C., D. V. Ellis, and G. J. Fishman, Upper limits tothe hard X-ray fluxes from Mars, Venus, and Jupiter, J.Geophys. Res., 73, 867–870, 1968.
Heaps, M. G., The roles of particle precipitation and Jouleheating in the energy balance of the Jovian thermosphere,Icarus, 29, 273–281, 1976.
Heaps, M. G., J. N. Bass, and A. E. S. Green, Electronexcitation of a Jovian aurora, Icarus, 20, 297–303, 1973.
Heaps, M. G., B. C. Edgar, and A. E. S. Green, Jovian protonaurora, Icarus, 24, 78–85, 1975.
Herbert, F., Constraints on the neutral hydrogen corona atUranus from its interaction with magnetospheric plasma,Geophys. Res. Lett., 15, 705–708, 1988.
Herbert, F., The Uranian corona as a charge exchange cascadeof plasma sheet protons, J. Geophys. Res., 98, 3999–4011,1993.
Herbert, F., and D. T. Hall, Atomic hydrogen corona ofUranus, J. Geophys. Res., 101, 10,877–10,885, 1996.
Herbert, F., and B. R. Sandel, The Uranian aurora and itsrelationship to the magnetosphere, J. Geophys. Res., 99,4143–4160, 1994.
Herbert, F., and B. R. Sandel, Ultraviolet observations ofUranus and Neptune, Planet. Space Sci., 47, 1119–1139,1999.
Herbert, F., B. R. Sandel, and A. L. Broadfoot, Observationsof the Jovian aurora by Voyager, J. Geophys. Res., 92,3141–3154, 1987.
Hill, T. W., and A. J. Dessler, Remote sensing of the magneticmoment of Uranus: Predictions for Voyager, Science, 227,1466–1469, 1985.
Hill, T. W., and A. J. Dessler, Convection in Neptune’s mag-netosphere, Geophys. Res. Lett., 17, 1677–1680, 1990.
Hill, T. W., A. J. Dessler, and M. E. Rassbach, Aurora onUranus: A Faraday disc dynamo mechanism, Planet. SpaceSci., 31, 1187–1198, 1983.
Holman, B. L., and J. H. Hunter Jr., Hydrogen-alpha auroralactivity on Jupiter, 2, Astrophys. J., 213, 906–907, 1977.
Horanyi, M., T. E. Cravens, and J. H. Waite Jr., The precipi-tation of energetic heavy ions into the upper atmosphere ofJupiter, J. Geophys. Res., 93, 7251–7271, 1988.
Hord, C. W., R. A. West, K. E. Simmons, D. L. Coffeen, M.Sato, A. L. Lane, and J. T. Bergstralh, Photometric obser-vations of Jupiter at 2400 angstroms, Science, 206, 956–959,1979.
Huang, T.-S., C. W. Ho, and C. J. Alexander, The plasma-
sphere of Neptune, J. Geophys. Res., 103, 20,267–20,278,1998.
Hubbard, W. B., and D. J. Stevenson, Interior structure ofSaturn, in Saturn, edited by T. Gehrels and M. S. Matthews,pp. 47–87, Univ. of Ariz. Press, Tucson, 1984.
Hunten, D. M., and A. J. Dessler, Soft electrons as a possibleheat source for Jupiter’s thermosphere, Planet. Space Sci.,25, 817–821, 1977.
Hunter, J. H., Ha auroral activity on Jupiter, Nature, 223,388–389, 1969.
Hurley, K. C., A search for X rays from the planet Jupiter, J.Geophys. Res., 77, 46–53, 1972.
Hurley, K. C., Upper limits to Jovian X-ray emission from theUHURU satellite, in The Magnetospheres of the Earth andJupiter, edited by V. Formisano, pp. 241–244, D. Reidel,Norwell, Mass., 1975.
Hurley, K. C., M. Sommer, and J. H. Waite Jr., Upper limits toJovian hard X radiation from the Ulysses gamma ray burstexperiment, J. Geophys. Res., 98, 21,217–21,219, 1993.
Ingersoll, A. P., A. R. Vasavada, B. Little, C. D. Anger, S. J.Bolton, C. Alexander, K. P. Klaasen, and the Galileo SSITeam, Imaging Jupiter’s aurora at visible wavelengths, Ica-rus, 135, 251–264, 1998.
Ip, A. K., and G. H. Voigt, Plasma-dominated magnetic fieldconfigurations for the magnetosphere of Uranus, J. Geo-phys. Res., 90, 6287–6293, 1985.
Ip, W.-H., Magnetospheric charge exchange effect on theelectroglow of Uranus, Nature, 326, 775–777, 1987.
Judge, D. L., F. M. Wu, and R. W. Carlson, Ultravioletspectrometer observations of the Saturnian system, Science,207, 431–434, 1980.
Kaiser, M. L., Time-variable magnetospheric radio emissionsfrom Jupiter, J. Geophys. Res., 98, 18,757–18,765, 1993.
Kaiser, M. L., and M. D. Desch, Radio emissions from theplanets Earth, Jupiter, and Saturn, Rev. Geophys., 22, 373–384, 1984.
Kaiser, M. L., M. D. Desch, and A. Lecacheux, Saturniankilometric radiation: Statistical properties and beam geom-etry, Nature, 292, 731–733, 1981.
Kaiser, M. L., M. D. Desch, W. Kurth, A. Lecacheux,F. Genova, B. M. Pedersen, and D. R. Evans, Saturn as aradio source, in Saturn, edited by T. Gehrels and M. S.Matthews, pp. 378–415, Univ. of Ariz. Press, Tucson, 1984.
Kao, L., T. Oka, S. Miller, and J. Tennyson, A table ofastronomically important ro-vibrational transitions for theH3
1 molecular ion, Astrophys. J. Suppl. Ser., 77, 317–329,1991.
Karkoschka, E., and M. G. Tomasko, Saturn’s upper atmo-spheric hazes observed by the Hubble Space Telescope,Icarus, 106, 428–441, 1993.
Kharchenko, V., W. H. Liu, and A. Dalgarno, X ray and EUVemission spectra of oxygen ions precipitating into the Jo-vian atmosphere, J. Geophys. Res., 103, 26,687–26,698, 1998.
Kim, S. J., Infrared processes in the Jovian auroral zone,Icarus, 75, 399–408, 1988.
Kim, S. J., and W. Maguire, Two micron quadrupole lineemission of H2 from the Jovian auroral zone, in The JovianAtmosphere, NASA Conf. Publ., 2441, 95–98, 1986.
Kim, S. J., J. Caldwell, A. R. Rivolo, R. Wagener, and G. S.Orton, Infrared polar brightening on Jupiter, 3, Spectrom-etry from the Voyager 1 IRIS experiment, Icarus, 64, 233–248, 1985.
Kim, S. J., P. Drossart, J. Caldwell, and J.-P. Maillard, Tem-peratures of the Jovian auroral zone inferred from 2-mm H2quadrupole line emissions, Icarus, 84, 54–61, 1990.
Kim, S. J., P. Drossart, J. Caldwell, J.-P. Maillard, T. Herbst,and M. Shure, Images of aurorae on Jupiter from H3
1
emission at 4 mm, Nature, 353, 536–542, 1991.Kim, S. J., D. A. Glenar, R. R. Joyce, and T. Kostiuk, Spatial
38, 3 / REVIEWS OF GEOPHYSICS Bhardwaj and Gladstone: GIANT PLANET AURORAS ● 349

and spectral characteristics of the near-infrared aurorae ofJupiter, Icarus, 102, 99–106, 1993.
Kim, S. J., Y. H. Kim, J.-P. Maillard, J. Caldwell, and G. Bjoraker,Four-micron polar continuum of Jupiter, Icarus, 116, 423–432, 1995.
Kim, S. J., G. S. Orton, C. Dumas, and Y. H. Kim, Infraredspectroscopy of Jupiter’s atmosphere after the A and Eimpacts of comet Shoemaker-Levy 9, Icarus, 120, 326–331,1996.
Kim, S. J., D. H. Lee, and Y. H. Kim, Jovian aurorae, Rep.Prog. Phys., 61, 525–568, 1998.
Kim, Y. H., J. L. Fox, and H. S. Porter, Densities and vibra-tional distribution of H3
1 in the Jovian auroral ionosphere,J. Geophys. Res., 97, 6093–6101, 1992.
Kim, Y. H., S. J. Kim, J. A. Stuewe, J. Caldwell, and T. M.Herbst, Jovian auroral ovals inferred from infrared H3
1
images, Icarus, 112, 326–336, 1994.Kim, Y. H., J. J. Caldwell, and J. L. Fox, High-resolution
ultraviolet spectroscopy of Jupiter’s aurora with the HubbleSpace Telescope, Astrophys. J., 447, 906–914, 1995.
Kim, Y. H., J. L. Fox, and J. J. Caldwell, Temperatures andaltitudes of Jupiter’s ultraviolet aurora inferred fromGHRS observations with the Hubble Space Telescope, Ica-rus, 128, 189–201, 1997.
Kirsch, E., S. M. Krimigis, J. W. Kohl, and E. P. Keath, Upperlimits for X-ray and energetic neutral particle emissionfrom Jupiter: Voyager 1 results, Geophys. Res. Lett., 8,169–172, 1981a.
Kirsch, E., S. M. Krimigis, W.-H. Ip, and G. Gloeckler, X-rayenergetic neutral particle emission from Saturn’s magneto-sphere: Measurements by Voyager 1, Nature, 292, 718–721,1981b.
Kostiuk, T., M. J. Mumma, F. Espenak, D. Deming, D. E.Jennings, W. Maguire, and D. Zipoy, Measurements ofstratospheric ethane in the Jovian south polar region frominfrared heterodyne spectroscopy of the n9 band near 12microns, Astrophys. J., 265, 564–569, 1983.
Kostiuk, T., F. Espenak, M. J. Mumma, D. Deming, andD. Zipoy, Variability of ethane on Jupiter, Icarus, 72, 394–410, 1987.
Kostiuk, T., F. Espenak, M. J. Mumma, D. Deming, andP. Romani, Infrared studies of hydrocarbons on Jupiter,Infrared Phys., 29, 199–204, 1989.
Kostiuk, T., P. Romani, F. Espenak, T. A. Livengood, and J. J.Goldstein, Temperature and abundances in the Jovian au-roral stratosphere, 2, Ethylene as a probe of the microbarregion, J. Geophys. Res., 98, 18,823–18,830, 1993.
Krimigis, S. M., T. P. Armstrong, W. I. Axford, A. F. Cheng,G. Gloeckler, D. C. Hamilton, E. P. Keath, L. J. Lanzerotti,and B. H. Mauk, The magnetosphere of Uranus: Hotplasma and radiation environment, Science, 233, 97–102,1986.
Krimigis, S. M., E. P. Keath, B. H. Mauk, A. F. Cheng, L. J.Lanzerotti, R. P. Lepping, and N. F. Ness, Observations ofenergetic ion enhancements and fast neutrals upstream anddownstream of Uranus’ bow shock by the Voyager 2 space-craft, Planet. Space Sci., 36, 311–328, 1988.
Krimigis, S. M., et al., Hot plasma and energetic particles inNeptune’s magnetosphere, Science, 246, 1483–1489, 1989.
Kurth, W. S., D. A. Gurnett, F. L. Scarf, and F. V. Coroniti,Wave-particle interactions in the magnetosphere of Ura-nus: Uranus as a radio source, in Uranus, edited by J. T.Bergstralh, E. D. Miner, and M. S. Matthews, pp. 926–958,Univ. of Ariz. Press, Tucson, 1991.
Lam, H. A., N. Achilleos, S. Miller, J. Tennyson, L. M. Trafton,T. R. Geballe, and G. E. Ballester, A baseline spectroscopicstudy of the infrared auroras of Jupiter, Icarus, 127, 379–393, 1997a.
Lam, H. A., S. Miller, R. D. Joseph, T. R. Geballe, L. M.
Trafton, J. Tennyson, and G. E. Ballester, Variation in theH3
1 emission of Uranus, Astron. Astrophys., 474, L73–L76,1997b.
Lane, A. L., C. W. Hord, R. A. West, L. W. Esposito, D. L.Coffeen, M. Sato, K. E. Simmons, R. B. Pomphrey, andR. B. Morris, Photopolarimetry from Voyager 2: Prelimi-nary results on Saturn, Titan, and the rings, Science, 215,537–543, 1982.
Lanzerotti, L. J., T. P. Armstrong, R. E. Gold, K. A. Anderson,S. M. Krimigis, R. P. Lin, M. Pick, E. C. Roelof, E. T. Sarris,and G. M. Simnett, The hot plasma environment at Jupi-ter—Ulysses results, Science, 257, 1518–1524, 1992.
Lanzerotti, L. J., C. G. MacClennon, and D. M. Feldman,Ulysses measurements of energetic H3 molecules in Jupi-ter’s magnetosphere, J. Geophys. Res., 98, 21,145–21,149,1993.
Liu, W., and A. Dalgarno, The ultraviolet spectra of the Jovianaurora, Astrophys. J., 467, 446–453, 1996.
Livengood, T. A., and H. W. Moos, Jupiter’s north and southpolar aurorae with IUE data, Geophys. Res. Lett., 17, 2265–2268, 1990.
Livengood, T. A., H. W. Moos, and G. E. Ballester, Phenom-enological analysis of Jovian north auroral H2 Lyman bandemissions, in A Decade of UV Astronomy With the IUESatellite, vol. 1, pp. 97–100, Eur. Space Agency, Paris, 1988.
Livengood, T. A., D. F. Strobel, and H. W. Moos, Long-termstudy of longitudinal dependence in primary particle pre-cipitation in the north Jovian aurora, J. Geophys. Res., 95,10,375–10,388, 1990.
Livengood, T. A., H. W. Moos, G. E. Ballester, and R. M.Prange, Jovian ultraviolet auroral activity, 1981–1991, Ica-rus, 97, 26–45, 1992.
Livengood, T. A., T. Kostiuk, F. Espenak, and J. J. Goldstein,Temperature and abundances in the Jovian auroral strato-sphere, 1, Ethane as a probe of the millibar region, J.Geophys. Res., 98, 18,813–18,822, 1993.
Mahoney, W. A., Hard X-ray spectra of discrete cosmicsources, Ph.D. thesis, Univ. of Calif., Berkeley, 1973.
Maillard, J.-P., P. Drossart, J. K. G. Watson, S. J. Kim, andJ. Caldwell, H3
1 fundamental band in Jupiter’s auroralzones at high resolution from 2400 to 2900 inverse centi-meters, Astrophys. J., 363, L37–L41, 1990.
Margon, B. H., Model-fitting in X-ray astronomy, Ph.D. thesis,Univ. of Calif. at Berkeley, 1973.
Mauk, B. H., M. Kane, E. P. Keath, A. F. Cheng, S. M.Krimigis, T. P. Armstrong, and N. F. Ness, Energeticcharged particle angular distributions near (r # 2 RN) andover the pole of Neptune, Geophys. Res. Lett., 17, 1701–1704, 1990.
Mauk, B. H., E. P. Keath, M. Kane, S. M. Krimigis, A. F.Cheng, M. H. Acuna, T. P. Armstrong, and N. F. Ness, Themagnetosphere of Neptune: Hot plasmas and energeticparticles, J. Geophys. Res., 96, 19,061–19,084, 1991.
Mauk, B. H., S. M. Krimigis, and M. H. Acuna, Neptune’sinner magnetosphere and aurora: Energetic particle con-straints, J. Geophys. Res., 99, 14,781–14,788, 1994.
Mauk, B. H., S. A. Gary, M. Kane, E. P. Keath, S. M. Krimigis,and T. P. Armstrong, Hot plasma parameters of Jupiter’sinner magnetosphere, J. Geophys. Res., 101, 7685–7695,1996.
Maurice, S., E. C. Sittler, J. F. Cooper, B. H. Mauk, M. Blanc,and R. S. Selesnick, Comprehensive analysis of electronobservations at Saturn: Voyager 1 and 2, J. Geophys. Res.,101, 15,211–15,232, 1996.
McConnell, J. C., and T. Majeed, H31 in the Jovian ionosphere,
J. Geophys. Res., 92, 8570–8578, 1987.McElroy, M. B., The ionospheres of the major planets, Space
Sci. Rev., 14, 460–473, 1973.McGrath, M. A., and J. T. Clarke, H I Lyman alpha emission
350 ● Bhardwaj and Gladstone: GIANT PLANET AURORAS 38, 3 / REVIEWS OF GEOPHYSICS
from Saturn (1980–1990), J. Geophys. Res., 97, 13,691–13,703, 1992.
McNutt, R. L., F. Bagenal, and R. M. Thorne, Observation ofauroral secondary electrons in the Jovian magnetosphere,Geophys. Res. Lett., 17, 291–294, 1990.
Metzger, A. E., D. A. Gilman, J. L. Luthey, K. C. Hurley,H. W. Schnopper, F. D. Seward, and J. D. Sullivan, Thedetection of X rays from Jupiter, J. Geophys. Res., 88,7731–7741, 1983.
Mihalov, J. D., On limits to Jupiter’s magnetospheric diffusionrates, Astrophys. Space Sci., 20, 483, 1973.
Miller, S., R. D. Joseph, and J. Tennyson, Infrared emissions ofH3
1 in the atmosphere of Jupiter in the 2.1 and 4.0 micronregion, Astrophys. J., 360, L55–L58, 1990.
Miller, S., H. A. Lam, and J. Tennyson, What astronomy haslearned from observations of H3
1, Can. J. Phys., 72, 760–771, 1994.
Miller, S., N. Achilleos, G. E. Ballester, H. A. Lam, J. Tenny-son, T. R. Geballe, and L. M. Trafton, Mid-to-low latitudeH3
1 emission from Jupiter, Icarus, 130, 57–67, 1997a.Miller, S., N. Achilleos, H. A. Lam, B. M. Dinelli, and
R. Prange, The impact of comet Shoemaker-Levy 9 on theJovian ionosphere and aurorae, Planet. Space Sci., 45, 1237–1250, 1997b.
Morrissey, P. F., P. D. Feldman, J. T. Clarke, B. C. Wolven,D. F. Strobel, S. T. Durrance, and J. T. Trauger, Simulta-neous spectroscopy and imaging of the Jovian aurora withthe Hopkins Ultraviolet Telescope and the Hubble SpaceTelescope, Astrophys. J., 476, 918–923, 1997.
Nagy, A. F., W. L. Chameides, R. H. Chen, and S. K. Atreya,Electron temperatures in the Jovian ionosphere, J. Geophys.Res., 81, 5567–5569, 1976.
Ness, N. F., Comment on “Reply to comment on ‘Evidence ofSaturn’s magnetic field anomaly from Saturnian kilometricradiation high-frequency limit’ by P. Galopeau and P.Zarka,” J. Geophys. Res., 98, 1505, 1993.
Ness, N. F., M. H. Acuna, K. W. Behannon, and F. M.Neubauer, Magnetic fields at Uranus, Science, 233, 85–89,1986.
Ness, N. F., M. H. Acuna, L. F. Burlaga, J. E. P. Connerney,R. P. Lepping, and F. M. Neubauer, Magnetic fields atNeptune, Science, 246, 1473–1478, 1989.
Ness, N. F., J. E. P. Connerney, R. P. Lepping, M. Schulz, andG.-H. Voigt, The magnetic field and magnetospheric con-figuration of Uranus, in Uranus, edited by J. T. Bergstralh,E. D. Miner, and M. S. Matthews, pp. 739–779, Univ. ofAriz. Press, Tucson, 1991.
Neubauer, F. M., Nonlinear standing Alfven wave currentsystem at Io: Theory, J. Geophys. Res., 85, 1171–1178, 1980.
Noll, K. S., H. A. Weaver, and P. D. Feldman (Eds.), TheCollision of Comet Shoemaker-Levy 9 and Jupiter, Cam-bridge Univ. Press, New York, 1996.
Ogino, T., R. J. Walker, and M. G. Kivelson, A global magne-tohydrodynamic simulation of the Jovian magnetosphere, J.Geophys. Res., 103, 225–235, 1998.
Oka, T., The infrared spectrum of H31 in laboratory and space
plasmas, Rev. Mod. Phys., 64, 1141–1149, 1992.Oka, T., and T. R. Geballe, Observations of the 4 micron
fundamental band of H31 in Jupiter, Astrophys. J., 351,
L53–L56, 1990.Orton, G. S., The thermal structure of Jupiter, 2, Observations
and analysis of 8–14 micron radiation, Icarus, 26, 142–158,1975.
Orton, G. S., et al., Thermal maps of Jupiter: Spatial organi-zation and time dependence of stratospheric temperatures,1980 to 1990, Science, 252, 537–542, 1991.
Orton, G. S., et al., Collision of comet Shoemaker-Levy 9 withJupiter observed by the NASA Infrared Telescope Facility,Science, 267, 1277–1282, 1995.
Paranicas, C., and A. F. Cheng, Drift shells and aurora com-puted using the O8 magnetic field model for Neptune, J.Geophys. Res., 99, 19,433–19,440, 1994.
Perry, J. J., Y. H. Kim, J. L. Fox, and H. S. Porter, Chemistryof the Jovian auroral ionosphere, J. Geophys. Res., 104,16,541–16,565, 1999.
Piddington, J. H., and J. F. Drake, Electrodynamic effects ofJupiter’s satellite Io, Nature, 217, 935–937, 1968.
Prange, R., Jovian UV aurorae, IR aurorae, and particle pre-cipitation—A common origin?, Astron. Astrophys., 251,L15–L18, 1991.
Prange, R., The UV and IR Jovian aurorae, Adv. Space Res.,12(8), 379–389, 1992.
Prange, R., and M. Elkhamsi, Modeling the precipitation fluxin the Jovian auroral zones, 1, The model and its applica-tion to the UV auroral emissions, J. Geophys. Res., 96,21,371–21,389, 1991.
Prange, R., and T. A. Livengood, Monitoring auroral activityon Jupiter, in Ultraviolet Astrophysics Beyond the IUE FinalArchive, Eur. Space Agency Spec. Publ., ESA-SP-413, 29–36,1998.
Prange, R., P. Zarka, G. E. Ballester, T. A. Livengood, L. Denis,T. Carr, F. Reyes, S. J. Bame, and H. W. Moos, Correlatedvariations of UV and radio emissions during an outstandingJovian auroral event, J. Geophys. Res., 98, 18,779–18,791, 1993.
Prange, R., D. Rego, and J.-C. Gerard, Auroral Lyman a andH2 bands from the giant planets, 2, Effect of the anisotropyof the precipitating particles on the interpretation of the“color ratio,” J. Geophys. Res., 100, 7513–7521, 1995.
Prange, R., D. Rego, D. Southwood, P. Zarka, S. Miller, andW. Ip, Rapid energy dissipation and variability of the Io-Jupiter electrodynamic circuit, Nature, 379, 323–325, 1996.
Prange, R., S. Maurice, W. M. Harris, D. Rego, and T. A.Livengood, Comparison of IUE and HST diagnostics of theJovian aurorae, J. Geophys. Res., 102, 9289–9301, 1997a.
Prange, R., D. Rego, L. Pallier, L. Ben Jaffel, C. Emerich,J. Ajello, J. T. Clarke, and G. Ballester, Detection of self-reversed Ly a lines from the Jovian aurorae with theHubble Space Telescope, Astrophys. J., 484, L169–L173,1997b.
Prange, R., D. Rego, L. Pallier, J. E. P. Connerney, P. Zarka,and J. Queinnec, Detailed study of FUV Jovian auroralfeatures with the post-COSTAR HST faint object camera,J. Geophys. Res., 103, 20,195–20,215, 1998.
Pryor, W. R., and C. W. Hord, A study of PhotopolarimeterSystem UV absorption data on Jupiter, Saturn, Uranus, andNeptune: Implications for auroral haze formation, Icarus,91, 161–172, 1991.
Pryor, W. R., et al., Galileo ultraviolet spectrometer observa-tions of Jupiter’s auroral spectrum from 1600 to 3200 Å, J.Geophys. Res., 103, 20,149–20,158, 1998.
Rego, D., R. Prange, and J.-C. Gerard, Auroral Lyman a andH2 bands from the giant planets, 1, Excitation by protonprecipitation in the Jovian atmosphere, J. Geophys. Res., 99,17,075–17,094, 1994.
Rego, D., N. Achilleos, T. Stallard, S. Miller, R. Prange,M. Dougherty, and R. D. Joseph, Supersonic winds in Jupi-ter’s aurorae, Nature, 399, 121–124, 1999.
Rezeau, L., N. Cornilleau-Wehrlin, G. Belmont, P. Canu,R. Prange, A. Balogh, and R. J. Forsyth, Possible role ofelectromagnetic low-frequency waves in the Io torus in theproduction of Jovian aurorae, Planet. Space Sci., 45, 483–493, 1997.
Ridgway, S. T., H. P. Larson, and U. Fink, The infraredspectrum of Jupiter, in Jupiter, edited by T. Gehrels, pp.384–417, Univ. of Ariz. Press, Tucson, 1976.
Rottman, G. J., H. W. Moos, and C. S. Freer, The far-ultravi-olet spectrum of Jupiter, Astrophys. J., 184, L89–L92, 1973.
38, 3 / REVIEWS OF GEOPHYSICS Bhardwaj and Gladstone: GIANT PLANET AURORAS ● 351
Sandel, B. R., and A. L. Broadfoot, Morphology of Saturn’saurora, Nature, 292, 679–682, 1981.
Sandel, B. R., et al., Extreme ultraviolet observations fromVoyager 2 encounter with Jupiter, Science, 206, 962–966,1979.
Sandel, B. R., et al., Extreme ultraviolet observations fromVoyager 2 encounter with Saturn, Science, 215, 548–553,1982.
Sandel, B. R., F. Herbert, A. J. Dessler, and T. W. Hill, Auroraand airglow on the night side of Neptune, Geophys. Res.Lett., 17, 1693–1696, 1990.
Satoh, T., J. E. P. Connerney, and R. L. Baron, Emissionsource model of Jupiter’s H3
1 aurorae: A generalized in-verse analysis of images, Icarus, 122, 1–23, 1996.
Schwitters, M. T., A search for Jovian limb aurorae, Icarus, 9,570–573, 1968.
Seidel, R., E. Keppler, N. Krupp, J. Woch, L. J. Lanzerotti, andC. G. MacLennan, Ulysses observations of energetic H3
1
ions in Jupiter’s magnetosphere, Adv. Space Res., 20(2),229–232, 1997.
Seiff, A., et al., Structure of the atmosphere of Jupiter: Galileoprobe measurements, Science, 272, 844–845, 1996.
Seiff, A., et al., Thermal structure of Jupiter upper atmospherederived from the Galileo Probe, Science, 276, 102–104,1997.
Shemansky, D. E., Mass-loading and diffusion-loss rates of theIo plasma torus, Astrophys. J., 242, 1266–1277, 1980.
Shemansky, D. E., and J. M. Ajello, The Saturn spectrum inthe EUV: Electron excited hydrogen, J. Geophys. Res., 88,459–464, 1983.
Shemansky, D. E., and G. R. Smith, The implication for thepresence of a magnetosphere on Uranus in the relationshipof EUV and radio emission, Geophys. Res. Lett., 13, 2–5,1986.
Shingawa, H., and J. H. Waite Jr., The ionosphere of Neptune,Geophys. Res. Lett., 16, 945–948, 1989.
Singh, V., Proton energy deposition and EUV emission in theJovian and Saturnian atmospheres, Indian J. Radio SpacePhys., 20, 140–149, 1991.
Singhal, R. P., and A. Bhardwaj, Monte Carlo simulation ofphotoelectron energization in parallel electric fields: Elec-troglow on Uranus, J. Geophys. Res., 96, 15,963–15,972,1991.
Singhal, R. P., S. C. Chakravarty, A. Bhardwaj, and B. Prasad,Energetic electron precipitation in Jupiter’s upper atmo-sphere, J. Geophys. Res., 97, 18,245–18,256, 1992.
Sittler, E. C., Jr., K. W. Ogilvie, and J. D. Scudder, Survey oflow-energy plasma electrons in Saturn’s magnetosphere:Voyager 1 and 2, J. Geophys. Res., 88, 8847–8870, 1983.
Skinner, T. E., and H. W. Moos, Comparison of the Joviannorth and south polar aurorae using the IUE observatory,Geophys. Res. Lett., 11, 1107–1110, 1984.
Skinner, T. E., S. T. Durrance, P. D. Feldman, and H. W.Moos, IUE observations of longitudinal and temporal vari-ations in the Jovian auroral emission, Astrophys. J., 278,441–448, 1984.
Smith, B. A., L. A. Soderblom, R. Beebe, J. Boyce, G. Briggs,M. Carr, S. A. Collins, T. V. Johnson, A. F. Cook II, G. E.Danielson, and D. Morrison, The Galilean satellites andJupiter—Voyager 2 imaging science results, Science, 206,927–950, 1979.
Sommeria, J., L. Ben Jaffel, and R. Prange, On the existence ofsupersonic jets in the upper atmosphere of Jupiter, Icarus,119, 2–24, 1995.
Stallard, T., S. Miller, G. E. Ballester, D. Rego, R. D. Joseph,and L. M. Trafton, The H3
1 latitudinal profile of Saturn,Astrophys. J., 521, L149–L152, 1999.
Stevens, M. H., D. F. Strobel, and F. Herbert, An analysis ofthe Voyager 2 ultraviolet spectrometer occultation data at
Uranus: Inferring heat sources and model atmospheres,Icarus, 101, 45–63, 1993.
Strobel, D. F., and S. K. Atreya, Ionosphere, in Physics of theJovian Magnetosphere, edited by A. J. Dessler, pp. 51–67,Cambridge Univ. Press, New York, 1983.
Strobel, D. F., and D. E. Shemansky, EUV emission fromTitan’s upper atmosphere: Voyager 1 encounter, J. Geo-phys. Res., 87, 1361–1368, 1982.
Suess, S. T., and A. J. Dessler, Probing the local interstellarmedium, Nature, 317, 702–703, 1985.
Tennyson, J., Spectroscopy of H31: Planets, chaos and the
universe, Rep. Prog. Phys., 58, 421–476, 1995.Thorne, R. M., Jovian auroral secondary electrons and their
influence on the Io plasma torus, Geophys. Res. Lett., 8,509–512, 1981.
Thorne, R. M., Injection and loss mechanisms for energeticions in the inner Jovian magnetosphere, J. Geophys. Res.,87, 8105–8110, 1982.
Thorne, R. M., Microscopic plasma processes in the Jovianmagnetosphere, in Physics of the Jovian magnetosphere, ed-ited by A. J. Dessler, pp. 454–458, Cambridge Univ. Press,New York, 1983.
Thorne, R. M., and J. Moses, Electromagnetic ion-cyclotroninstability in the multi-ion Jovian magnetosphere, Geophys.Res. Lett., 10, 631–634, 1983.
Thorne, R. M., and B. T. Tsurutani, Diffuse Jovian aurorainfluenced by plasma injection from Io, Geophys. Res. Lett.,6, 649–652, 1979.
Tomasko, M. G., and L. R. Doose, Polarimetry and photom-etry of Saturn from Pioneer 11: Observations and con-straints on the distribution and properties of cloud andaerosol particles, Icarus, 58, 1–34, 1984.
Trafton, L. M., J. Carr, D. Lester, and P. Harvey, A possibledetection of Jupiter’s northern auroral S1(1) H2 quadru-pole line emission, Icarus, 74, 351–356, 1988.
Trafton, L. M., D. F. Lester, and K. L. Thompson, Unidenti-fied emissions lines in Jupiter’s northern and southern 2 mmaurorae, Astrophys. J., 343, L73–L76, 1989a.
Trafton, L. M., J. Carr, D. Lester, and P. Harvey, Jupiter’saurora: Detection of quadrupole H2 emission, in Time-Variable Phenomena in the Jovian System, edited by M. J. S.Belton, R. A. West, and J. Rahe, NASA Spec. Publ., SP-494,229–234, 1989b.
Trafton, L. M., T. R. Geballe, S. Miller, J. Tennyson, and G. E.Ballester, Detection of H3
1 from Uranus, Astrophys. J., 405,761–766, 1993.
Trafton, L. M., J.-C. Gerard, G. Munhoven, and J. H. WaiteJr., High-resolution spectra of Jupiter’s northern auroralultraviolet emission with the Hubble Space Telescope, As-trophys. J., 421, 816–827, 1994.
Trafton, L. M., V. Dols, J.-C. Gerard, J. H. Waite Jr., G. R.Gladstone, and G. Munhoven, HST spectra of the Jovianultraviolet aurora: Search for heavy ion precipitation, As-trophys. J., 507, 955–967, 1998.
Trafton, L. M., S. Miller, T. R. Geballe, J. Tennyson, and G. E.Ballester, H2 quadrupole and H3
1 emission from Uranus:The Uranian thermosphere, ionosphere, and aurora, Astro-phys. J., 524, 1059–1083, 1999.
Trauger, J. T., et al., Saturn’s hydrogen aurora: Wide field andplanetary camera 2 imaging from the Hubble Space Tele-scope, J. Geophys. Res., 103, 20,237–20,244, 1998.
Vesecky, J. F., J. R. Culhane, and F. J. Hawkins, Upper limitsfor X-ray emission from Jupiter as measured from theCopernicus satellite, in The Magnetospheres of the Earth andJupiter, edited by V. Formisano, pp. 245–251, D. Reidel,Norwell, Mass., 1975.
Voigt, G. H., and N. F. Ness, The magnetosphere of Neptune:Its response to daily rotation, Geophys. Res. Lett., 17, 1705–1708, 1990.
352 ● Bhardwaj and Gladstone: GIANT PLANET AURORAS 38, 3 / REVIEWS OF GEOPHYSICS
Waite, J. H., Jr., The ionosphere of Saturn, Ph.D. thesis, Univ.of Mich., Ann Arbor, 1981.
Waite, J. H., Jr., Comment on “Bremsstrahlung X rays fromJovian auroral electrons” by D. D. Barbosa, J. Geophys.Res., 96, 19,529–19,532, 1991.
Waite, J. H., Jr., T. E. Cravens, J. Kozyra, A. F. Nagy, S. K.Atreya, and R. H. Chen, Electron precipitation and relatedaeronomy of the Jovian thermosphere and ionosphere, J.Geophys. Res., 88, 6143–6163, 1983.
Waite, J. H., Jr., J. T. Clarke, T. E. Cravens, and C. M.Hammond, The Jovian aurora: Electron or ion precipita-tion?, J. Geophys. Res., 93, 7244–7250, 1988a.
Waite, J. H., Jr., M. O. Chandler, R. V. Yelle, B. R. Sandel,and T. E. Cravens, Superthermal electron processes in theupper atmosphere of Uranus: Aurora and electroglow, J.Geophys. Res., 93, 14,295–14,308, 1988b.
Waite, J. H., Jr., D. C. Boice, K. C. Hurley, S. A. Stern, and M.Sommer, Jovian bremsstrahlung X rays: A Ulysses predic-tion, Geophys. Res. Lett., 19, 83–86, 1992.
Waite, J. H., Jr., F. Bagenal, F. Seward, C. Na, G. R. Glad-stone, T. E. Cravens, K. C. Hurley, J. T. Clarke, R. Elsner,and S. A. Stern, ROSAT observations of the Jupiter aurora,J. Geophys. Res., 99, 14,799–14,809, 1994.
Waite, J. H., Jr., G. R. Gladstone, W. S. Lewis, P. Drossart,T. E. Cravens, A. N. Maurellis, B. H. Mauk, and S. Miller,Equatorial X-ray emissions: Implications for Jupiter’s highexospheric temperatures, Science, 276, 104–108, 1997.
Walt, M., L. L. Newkirk, and W. E. Francis, Bremsstrahlungproduced by precipitating electrons, J. Geophys. Res., 84,967–973, 1979.
Warwick, J. W., et al., Voyager planetary radio astronomy atNeptune, Science, 246, 1498–1501, 1989.
West, R., and H. Bohnhardt (Eds.), Proceedings of the Euro-pean SL-9/Jupiter Workshop, Eur. Southern Obs., Garching,Germany, 1995.
West, R. A., M. Sato, H. Hart, A. L. Lane, C. W. Hord, K. E.
Simmons, L. W. Esposito, D. L. Coffeen, and R. B. Pom-phrey, Photometry and polarimetry of Saturn at 2640 and7500 Å, J. Geophys. Res., 88, 8679–8697, 1983.
Wolven, B. C., and P. D. Feldman, Self-absorption by vibra-tionally excited H2 in the Astro-2 Hopkins Ultraviolet Tele-scope spectrum of the Jovian aurora, Geophys. Res. Lett.,25, 1537–1540, 1998.
Yelle, R. V., and B. R. Sandel, Uranian H Ly-a emission: Theinterstellar wind source, Geophys. Res. Lett., 13, 89–92,1986.
Yung, Y. L., G. R. Gladstone, K. M. Chang, J. M. Ajello, andS. K. Srivastava, H2 fluorescence spectrum from 1200 to1700 Å by electron impact: Laboratory study and applica-tion to Jovian aurora, Astrophys. J., 254, L65–L69, 1982.
Zarka, P., The auroral radio emissions from planetary magne-tospheres: What do we know, what don’t we know, what dowe learn from them?, Adv. Space Res., 12(8), 99–115, 1992.
Zarka, P., Auroral radio emissions at the outer planets: Ob-servations and theories, J. Geophys. Res., 103,20,159–20,194, 1998.
Zarka, P., and F. Genova, Solar wind effect on Jovian low-frequency magnetospheric radio emissions from ground-based and spacecraft observations, in Time-Variable Phe-nomena in the Jovian System, edited by M. J. S. Belton, R. A.West, and J. Rahe, pp. 175–178, NASA Spec. Publ. SP-494,1989.
Zarka, P., et al., Radio emissions from Neptune, in Neptuneand Triton, edited by D. Cruikshank and M. S. Matthews,pp. 341–387, Univ. of Ariz. Press, Tucson, 1995.
A. Bhardwaj, Space Physics Laboratory, Vikram SarabhaiSpace Centre, Trivandrum 695 022, India. ([email protected])
G. R. Gladstone, Southwest Research Institute, 6220 CulebraRoad, San Antonio, TX 78238. ([email protected])
38, 3 / REVIEWS OF GEOPHYSICS Bhardwaj and Gladstone: GIANT PLANET AURORAS ● 353

● 354 ●