aurobindo ar 2016 final - generic pharmaceuticals
TRANSCRIPT

AUROBINDO PHARMA LIMITED
www.aurobindo.com
REGISTERED OFFICEPLOT NO. 2, MAITRI VIHARAMEERPETHYDERABAD - 500 038TELANGANA, INDIA
CORPORATE OFFICEWATER MARK BUILDINGPLOT NO. 11, SURVEY NO. 9KONDAPUR, HITECH CITYHYDERABAD - 500 084TELANGANA, INDIA
Aurobindo
Pharma
Limited
|
A
nnual Report
2015-16
ANNUAL REPORT 2015-16
Building the future

Forward Looking StatementsThis communication contains statements that constitute ‘forward looking statements’ including, without limitation, statements relating tothe implementation of strategic initiatives and other statements relating to our future business developments and economic performance.
While these forward looking statements represent our judgements and future expectations concerning the development of our business, anumber of risks, uncertainties and other important factors could cause actual developments and results to differ materially from ourexpectations.
These factors include, but are not limited to, general market, macro-economic, governmental and regulatory trends, movements in currencyexchange and interest rates, competitive pressures, technological developments, changes in the financial conditions of third parties dealingwith us, legislative developments, and other key factors that we have indicated could adversely affect our business and financialperformance.
Aurobindo undertakes no obligation to publicly revise any forward looking statements to reflect future events or circumstances.
Concept, Research, Design & Production CAPRICORN ASSOCIATES, Hyderabad
On the cover: Images of three new manufacturing facilities being commissioned.
Unit XV
Unit XVI
Building the future
Unit X
Auro Mission
Aurobindo's mission is to become the most valuedpharmaceutical partner to the world pharma fraternityby continuously researching, developing and manufacturinga wide range of pharmaceutical products that comply withthe highest regulatory standards.
Auro Values
BUSINESS CARE
Operational Excellence
Stakeholder Orientation
Quality
PEOPLE CARE
Fairness, Humility and Respect for Individuals
Teamwork
Applied Learning
ORGANIZATION CARE
Accountability
Integrity
Achievement
Prime Minister of Malta, Mr. Joseph Muscat at our Malta office after inauguration of the expansion project in February, 2016.

Table of Contents
Performance
Governance
Financials
Business overview 2
Building the future 6
Execution excellence 8
New initiatives 10
Walking the extra mile 14
Raising the bar 16
Respect for the environment 18
Pursuit of perfection 22
Contributing to good life 24
Board of Directors 28
Certifications 31
Notice of AGM 33
Boards’ Report 38
Management Discussion & Analysis 45
Report on Corporate Governance 90
Proxy Form 185
Attendance Slip 187
Independent Auditors' Report 103
Balance Sheet 108
Statement of Profit and Loss 109
Cash Flow Statement 110
Consolidated Financial Statements 143

2
OUR BUSINESS
Aurobindo is a leading global pharmaceutical company
producing oral and injectable generic formulations and active
pharmaceutical ingredients (APIs). Consolidated revenues of the
Company at `138,960.8 million in 2015-16, reflect 33.4% CAGR
over the past three years.
Strengthened by several large manufacturing facilities approved
by US FDA, UK MHRA, MCC-SA, ANVISA Brazil for both APIs &
formulations and with strategic alliances with 46 subsidiaries &
joint ventures, Aurobindo features among the top 5 companies
from India in terms of consolidated revenues.
Aurobindo has been ranked as #7 prescription supplier in the US
as per IMS total prescriptions dispensed as at March, 2016. The
Company is among the top 15 generics companies by sales in
Europe.
Business overview
OUR PRESENCE
The Company exports to over 150 countries across the globe
with more than 87% of its revenues derived out of international
operations. The customers include premium multinational
companies.
Headquartered at Hyderabad, India, the Company has a robust
product portfolio spread over seven major therapeutic/product
areas encompassing neurosciences, cardiovasculars,
gastroenterologicals, antibiotics, anti-retrovirals,
anti-diabetics and anti-allergics, supported by an outstanding
R&D set-up. There is a well-entrenched US portfolio of 398
ANDAs filed, of which final approvals received for 215 as at
March, 2016.

Annual Report 2015-16
3
OUR STRENGTHS
Aurobindo's strength lies in vertically integrating its active
pharmaceutical ingredients (APIs) with finished dosages for
around 75% of its formulation products.
The vast scientific pool at Aurobindo creates intellectual wealth
for the Company and commercializes cost effective, quality
generic finished dosages.
The competitive advantage of the Company is to launch
differentiated products including injectables, ophthalmics,
specialty products and controlled substances. The focus is on
complex molecules, differentiated technology platforms and
specialty products.
Aurobindo employs more than 15,000 professionals, from over
30 countries, across various divisions - Research &
Development, manufacturing, quality assurance, marketing,
supply chain, commercial and HRD.
OUR WAY FORWARD
The Company is building leadership position in the business
with its technical excellence, expertise in quality assurance,
compliance with regulatory standards, and being recognized for
cost competitiveness and customer focus.
Aurobindo aims to gain market share for existing products and
by introduction of new products (presently 147 ANDAs under
review including 40 ANDA filings for injectables) with a
pipeline of products in neurosciences, cardiovasculars,
ophthalmics, respiratory, peptides and penems.
New initiatives include gaining entry into complex R&D in new
businesses and differentiated technology platforms such as
oncology, hormones, enzymes, peptides, depot injections,
inhalers, nasal and dermatology products.
Plans are to expand penetration of OTC products and capitalize
on future OTC conversions and enhance nutraceuticals business
profitably through a combination of cost and growth synergies.
In Europe, the strategy is to build on the turned around EU
business and ramp up own filings.
Forward plans include launch of new ARV products and
combinations as well as grow the existing market. New
geographies are being explored in the emerging markets.
API capacities are being augmented to support growth in
advanced markets.

4
Global presence
Consolidated revenuesInternational 87%Domestic 13%
Formulations revenuesUS 55%Europe 28%Emerging markets & ARVs 17%
Manufacturing facilities(including wholly owned subsidiaries)
India 18US 3Brazil 1
Employee presence
15,000+ employees from over 30 countries
Aurobindo is a leading global pharmaceutical company producing oral and
injectable generic formulations and active pharmaceutical ingredients.
The Company exports to over 150 countries across the globe with more
than 87% of its revenues derived out of international operations. The
customers include premium multinational companies.
Among the top 15 generics companies in Europeby sales (Market reports)
Ranked as #7 prescription supplier in the USAs per IMS total prescriptions dispensed, March 2016

Annual Report 2015-16
5
Portfolio mix (Products)Neurosciences 78
Cardiovasculars 65
Anti-retrovirals 38
SSP/Cephalosporin 30
Gastroenterologicals 25
Controlleld substances 16
Anti-diabetics 11
Ophthalmics 10
Respiratory 10
Penems 3
Others 112
Total 398Pipelines being added in oncology, hormones,depot injections, inhalers, patches and films
2014-15 2015-16
121,205.2
138,960.8
Revenue (Net)CONSOLIDATED ` Million
2014-15 2015-16
25,636.2
32,055.8
EBITDA1
CONSOLIDATED ` Million
2014-15 2015-16
15,757.7
19,820.0
Profit after taxCONSOLIDATED ` Million
2014-15 2015-16
21.223.1
EBITDA Margin1
CONSOLIDATED %
2015-16Formulations revenues
` Million
US
Europe
Emerging markets & ARVs
61,439.931,303.7
18,913.0
2015-16Revenue break-up
` Million
28,836.5
111,656.6
API
Formulations
2014-15 2015-16
48,317.0
61,439.9
US formulationsRevenues ` Million
1EBITDA (Earnings before interest, tax, depreciation and amortization) excluding forex & other income
79.5%
20.5%

6
Building the future
We did well on all business fronts: filed several product
applications (ANDAs), received large number of product
approvals, augmented manufacturing capacity, enhanced
utilization, successfully launched new products and
extended the strong presence of existing products. We also
raised our reliability benchmarks, achieved higher revenues,
lowered costs, improved EBITDA performance, reported
superior profitability and healthy earnings per share.
Our success in steering the Company through the
challenging times, has led us to step up dividend during
the financial year and issue bonus shares in July 2015. This
is an expression of our confidence in the health of the
Company and its prospects, and reflects our commitment to
ensuring shareholders participate in our success.
While we managed to gain momentum and create a
platform for sustainable growth, continuous efforts were
made to minimize risks. We proactively examined our
standards and processes on all key parameters with a clear
objective: we want to sustain operational excellence. I am
encouraged by the fact that we are progressing well.
Our earnings were supported by our strong balance sheet
which puts us in a position to respond quickly to emerging
opportunities in the market and step up deliveries. We were
nimble to recognize and seize opportunities, enhance our
competitiveness and upgrade our product mix.
Pharmaceutical industry is a people business. We have
some of the best in the industry and I am grateful to all
our employees for their dedication and passion that has
helped us reach where we are.
I am gratified that we did all that we set out
to do. We anticipated highly competitive
conditions and planned well to execute a
strategy of exceptional operating performance,
disciplined growth and aligned high-
performance teamwork.
Revenue
`138,960.8EBITDA
`32,055.8EBITDA
23.1%Million Million

Annual Report 2015-16
7
We constantly strive to develop and optimize the
professional and personal skills of our employees. Pharma
business is a quality-intensive industry in which the
commitment shown by our employees has a significant
influence on business success. Aurobindo keeps ahead of
the curve with human resource planning and investment in
learning and development of its employees.
Our target is to enhance business growth by enabling
engagement and performance. We will continue to focus on
attracting and developing people for the future, and
ensuring good leadership and organization efficiency.
We have redefined ourselves to grow to the next level and
have hence, built a solid foundation for the Company's
long-term development. The architecture is in place; now,
it's time to consolidate and move to the next level.
Our US business will continue to lead, while we shall stay
focused on profitability of the European operations. We see
Europe as another growth ladder in the foreseeable future.
We are happy to have made a small beginning to introduce
specialty branded generics. We are making investments in
dermatology and inhaler products at our new facility at
Raleigh, NC, USA. Research and development work has
started on 18 products.
We have an encouraging progress in the Company's pipeline
of high value products, which bodes well for the future. In
order to cater to the increasing product basket and market
opportunities, Members will be happy to know that we are
working hard to commission three new manufacturing
facilities in India which would contribute to the revenues
in the foreseeable future.
While we shall have a disciplined and systematic approach
to growth, we will ensure that there is considerable respect
towards all aspects of compliance and regulatory
requirements.
Looking ahead, we will be setting the stage to capitalize
on the platform for growth being built assiduously. We are
striving to become a scientifically stronger company, with
newer technologies and difficult to develop specialty
generics. We aspire to be a science based company with
high quality earnings.
Our aim is to build a tomorrow that all of us are proud of.
We shall therefore, aim higher, move faster and perform
better than ever before. Our goals indeed have a stretch
but are within reach based on the Company's proven
capabilities supported by a team of accomplished
employees.
We will execute the strategies with the same commitment
and passion that we are known for to serve our customers,
business partners and investors. Everyone associated with
us can be certain that we shall reciprocate their trust.
K. Nithyananda Reddy
Vice Chairman
Profit after tax
`19,820.0Earnings per share (`)
33.9ANDAs filed in US
398Consolidated financials (2015-16)
Million As at March 31, 2016

8
Execution excellence
At the consolidated level, the revenues increased by 14.6%
over the previous year to `138,960.8 million while the
EBITDA margin widened to 23.1% as compared to 21.2% in
2014-15. The diluted earnings per share grew by 25.6% to
`33.92, reflecting robust execution, improved product mix,
enhanced productivity and optimization of costs.
We delivered solid financial results fuelled by strong
performance in the US market with our increasing number
of differentiated oral and injectable products. US
formulation business contributed 55% to the overall
formulation revenue during the year, and the revenue
generated from the US business grew by 27.2% over the
previous year.
Formulations sales across all geographies grew by 16.8% to
`111,656.6 million as against `95,586 million in the
previous year and constituted 79.5% of the revenues while
active ingredients made the balance 20.5%.
Revenue from active pharmaceutical ingredients (APIs) has
been `28,836.5 million in the year under review, which is
higher by 6.6% over 2014-15. The growth has mainly been
led by the high value non-betalactam APIs, despite
ramping up volumes to meet the exponential demand for
in-house formulation manufacture. Debottlenecking efforts
are being undertaken at the existing facilities to
supplement API capacities.
We actively created synergies between the acquired
businesses at Western Europe with the Company's existing
ground presence in several European markets. The acquired
business witnessed profitability during the year,
contributed by business structures getting streamlined,
integrated and optimized to improve information flow,
decision making and control. The processes were simplified
We had one more year of record revenues,
increased profitability and a year when we
significantly raised our levels of operational
excellence. We demonstrated that our people
can be globally competitive, operate safely
and sustainably, maintain strong positions in
attractive markets, and generate positive cash
flow even during times of challenging currency
movements.
Revenue CAGR
33.4%Return on equity
32.2%Return on capital employed
26.2%Between 2012-13 & 2015-16

Annual Report 2015-16
9
and made more efficient. These initiatives translate into
better customer contact, add to cost effectiveness, create
superior inventory management and drive profitability.
There was sustained growth in the emerging markets and
for our ARV/HIV product portfolio. We believe the margins
in these segments will climb in line with the rest of the
business. There has been a growth in ARV formulations
revenues by 24.5% to `11,998.8 million during the year,
predominantly due to participation in certain notable
tenders.
Formulations sales to the emerging markets such as Brazil,
Ukraine, Mexico and MENA (Middle East and North Africa)
as well as South Africa and Canada grew by 21.5% to
`6,914.2 million during the year as compared to `5,691.9
million reported in 2014-15.
Our newly acquired nutraceuticals business has done as well
as we planned. Our OTC products have started gaining a
foothold in a highly competitive market.
Our achievements of the year are the result of a robust
long-term strategy and excellent execution capabilities of
our competent team. I will attribute our success to regular
review of our strategies, priorities and more importantly,
close supervision where primacy is given to quality,
compliance, efficacy, safety and managing costs.
By benchmarking our activities against best industry
practices and working to ensure that our processes match
or exceed those standards, we are improving governance,
transparency and efficiency while lowering costs.
Going forward, we will stay focused on high value products,
productivity improvements and cost saving programs to
increase profitability. Material cost and usage is being
reviewed closely especially for APIs, excipients and
packaging materials. We will stay determined on product
life cycle management, derisk the business and improve
operating efficiencies.
We are enhancing our supply chain performance in areas
such as forecasting system to estimate demand, material
planning and procurement capabilities, production
scheduling, asset utilization, operational efficiencies,
productivity and improve on-time-in-full (OTIF) deliveries.
The aim is to achieve more integrated operation that would
help save time, add to our deliveries and enhance
profitability.
Aurobindo is driving growth through several verticals. There
is a determined foray into oncology and hormonal products,
enzymes, peptides including microspheres, oral
contraceptives, steroids, OTC offers, differentiated
technology viz. nasal products, inhalers, patches and films.
In all the newer ventures, Aurobindo will build and leverage
on its inherent strengths augmented by a team of generic
industry-seasoned professionals. I assure you, our new
business models are founded on core competencies. We
have always believed execution is everything, and would
like to excel in whatever we do.
There is enormous enthusiasm within Aurobindo to move
ahead and, achieve better than what we have ever done
before. We have an inspired team that is focused on
customers, markets and opportunities and galvanized to
produce superior performance results. This is a high energy
organization.
We have enhanced our capabilities in research and
development by creating niche, differentiated products and
new technologies. We have further augmented our
manufacturing capacities, improved our supply chain and
strong marketing network, all of which makes us confident
of our many strengths. These leadership initiatives make
Aurobindo a great company to work for, do business with
and invest in, with the promise of a remarkable future.
N. GovindarajanManaging Director
Debt: Equity
0.54Debt: EBITDA
1.2Book value per share (`)
120.6Consolidated financials (2015-16)

10
New initiatives
ONCOLOGY & HORMONAL PRODUCTS
The Company is in the process of developing a wide range
of oncology and hormonal products. Our product
capabilities would include vials (wet vials & dry vials),
prefilled syringes, capsules and tablets that are used in the
hospital as well as in oncology and renal clinics.
A new R&D Centre dedicated for generic research in the
field of oncology and hormones has been set up at
Hyderabad to develop anticancer drugs and hormonal
products, both for solid and parenteral dosage forms.
The oral, solid dose formulations sections of oncology &
hormone manufacturing facility has been completed and
commissioned. The injectable areas of the oncology facility
are expected to be commissioned in the later part of 2016.
We have selected over 50 oncology products in our
portfolio and the plans are to initiate the exhibit batches
for more than 15 products in 2016-17 and the dossier filing
in regulated markets are expected to be initiated
in early 2017.
A new block to manufacture oncology API is being added
keeping the future requirements. The manufacturing facility
is expected to be operational in 2017-18.
Aurobindo is striving to become a scientifically stronger company, with newer
technologies and difficult to develop specialty generics. We aspire to be a
science based company with high quality earnings.
On the strength of the in-house expertise, the Company is taking several
initiatives to make an impact on a few more product segments. Each of the
following product groups is likely to improve the business mix, enhance
revenues and add traction to the continuing momentum of the Company.
DERMATOLOGY, INHALERS & NASAL PRODUCTS
Aurobindo is foraying into inhalation and dermatology
specialties with a basket of products. Initially, development
work has commenced for 2 inhalation products, with
another 4 in the pipeline, and 18 dermatology products
have been selected for development.
Research and development activities have commenced at
the Raleigh, NC, USA R&D center with a small team of top
notch R&D scientists. Initially, the Company has selected
inhalation and topical/transdermal products such as
pressurized metered dose inhalers, dry powder inhalers,
creams, gels and ointments for development and
manufacturing.
A pressurized metered-dose inhaler (pMDI) is a device that
delivers a specific amount of medication to the lungs, in
the form of a short burst of aerosolized medicine in a
solution or suspension that is usually self-administered by
the patient via inhalation. A dry-powder inhaler (DPI) is a
device that delivers medication to the lungs in the form of
a dry powder. pMDIs and DPIs are commonly used to treat
respiratory diseases such as asthma, bronchitis,
emphysema and COPD.
The plans are to complete the product filings by early 2018
and commercialize upon approval.

Annual Report 2015-16
11
SPECIALTY INJECTION PRODUCTS
These belong to the microsphere technology. Aurobindo is
foraying into formulation feasibility, fine tuning and
scaling up of technology with a view to enter specialty
injection products. Plans are on-going to file the first
product in 2017-18. The objective is to launch four
identified products, which together account for a market
size of around USD 3 billion.
Microsphere technology based specialty injection products,
also known as depot injections, refer to administration of a
sustained-action drug formulation that allows slow release
and gradual absorption, so that the active agent can act
for much longer periods than is possible with standard
injections. Depot injections are usually given deep
into a muscle.
Oral route is the convenient and easier way to administer
drugs. However, there are numerous drugs that could be
administered by injection only. Some of the injections have
to be taken life-long for some diseases. Taking injections
for long period is inconvenient and painful. Sustained
release injection is one of the specialty injection product
categories to overcome this problem.
PEPTIDES
Peptides are naturally occurring biological molecules. They
are short chains of amino acid monomers linked by peptide
(amide) bonds. Aurobindo has started investing in peptide
technology and is building a commercial facility with two
modules commensurate with cGMP standards. Necessary
equipment has been commissioned and we have developed
technologies for about 15 products.
On the whole, there are over 30 peptides which are
available globally and Aurobindo is capable of making each
of these peptides and aspires to be an important player in
the premium markets. Considering the capability that we
have in terms of technology as well as competency in our
experienced and talented resources, Aurobindo can compete
with the best players in the industry, in the near future.
A single sustained release injection will maintain required
concentration of drug in blood between several weeks to
several months. The drug will be continuously available
from these injections. These products are generally fine
particles as suspensions or emulsions. Injected particles
will stay at the site of injection for longer duration. For
certain diseases these products are advantageously used for
site specific drug delivery since concentration of drug at
the injection site will be higher for longer duration.
In addition to the convenience, sustained release injection
products provide sustained efficacious level of drug better
than repeated daily injections. Dosage adherence is another
benefit with specialty injection products. Several patients
have poor discipline taking daily oral medication; replacing
that with an injection given once in few months will have
better dosage adherence.
Despite the advantages, manufacturing these products is
challenging. Every process step involved in the fabrication
of these injectable products has to be sterile. This is one of
the challenges in producing these specialty injectable
products.
The team at Aurobindo has the expertise to enter this high
value segment, through both peptide and molecular route.
Validation batches have been completed for four peptides
and sample shipments have commenced to customers for
their development work. Drug Master Files are prepared and
three filings have been done in 2015-16.
We have taken up some more peptide based products, in
particular drug-device combination. We are attempting to
take up two drug-device combination products in sterile
segment, with exhibit batches planned in 2016-17. Product
filing for these high value products would be in 2017-18.
Aurobindo is also working on adopting the clinical pathway
(not bio-equivalence) for a few products. These are complex
molecules, more complicated to develop and would need
multi-centric trials. These will add to Aurobindo's niche
product pipeline.

12
VACCINES
Aurobindo is entering the vaccines business with a joint
venture for developing pneumococcal conjugate vaccine
(PCV). Presently development work is on-going on PCV
through use of novel vaccine technology compressing time
and cost, thereby making such vaccine available at an
affordable cost. Vaccines segment is another addition to
the differentiated portfolio where there are unmet needs
and limited competition.
Pneumococcal conjugate vaccine is a commercially
available vaccine with limited competition and a global
branded market of more than USD 6 billion. Aurobindo will
hold a majority stake in the JV and will fund the product
development in a phased manner spanning over
three years.
Development work for a few more products has commenced
towards building a sizable vaccines portfolio. Toxicology
studies have been completed. A cGMP pilot plant for
clinical lot manufacture is ready and we are now working
on clinical trial protocols. The plans are to create
infrastructure for 50 million dosage per annum, with the
first phase launch being targeted for 25 million doses.
All these efforts are being synchronized to achieve
commercial launch of Aurobindo's branded
products in 2018.
OVER-THE-COUNTER (OTC)
OTC products are a complement to the prescription drugs,
as they trend towards preventive healthcare. Given
increased patient awareness regarding various ailments and
drugs, OTC products are meeting patient needs. This
segment is growing and according to several analysts,
faster than prescription drugs.
The Company's subsidiary, Aurohealth manufactures and
markets a robust pipeline of innovative liquid and solid
dose store brand (OTC) over-the-counter products. The
mission is to develop as many OTC products for the US
retail market as possible, providing a consistent and
reliable supply, at a fair price and of the highest quality.
The plans are to include Rx to OTC switch molecules, ANDA
& Monograph OTC products in various dosage forms/formats
- solids (tablets, capsules, soft gels), liquids, semi-solids &
nasal sprays.
The manufacturing sites are located at New Jersey, US at
Lawrenceville with facility to make liquids and semi solids.
A second facility is set up at Jedcherla, near Hyderabad,
with capacity to manufacture solids (about 8 billion doses
a year). This business is supported with adequate
infrastructure including 200,000 sq ft of packaging &
distribution facilities for solids & liquids.
Over 100 monograph dossiers for liquids have been
prepared, out of which over 75 products have been
launched. On solid dosages (capsules, tablets), about 25
dossiers have been completed and four products have been
launched. Steps are under way to take up soft gelatine
capsules and semi-solids.
The Company markets its products through well-established
chain stores in the US. Our OTC products in the US are
gaining penetration into several key regional markets.
Aurobindo will strive to get a strong foothold in this
competitive but attractive market.

Annual Report 2015-16
13
NUTRACEUTICALS
The Company's newly acquired US based entity Natrol
manufactures and sells quality nutritional supplements in
the US and select international markets. It offers branded
products including vitamins, minerals, and supplements;
diet and weight management products; sports nutrition
products; and products for hair, skin, and nails. This
acquisition is a strategic move to gain an entry for
Aurobindo into the growing nutraceutical segment.
It is estimated that US nutraceuticals market is currently at
around USD 38 billion and is expected to grow to USD 46
billion by 2018 as per 2015 Nutrition Business Journal.
There is enough opportunity for growth not only within US
but also elsewhere globally. Aurobindo would play an active
role in the industry's growth trajectory.
Nutraceuticals industry is moving towards the
pharmaceutical industry in terms of the regulatory
standards and stringent compliance standards are expected.
Aurobindo will strive to take advantage since the Company
has the necessary expertise to ensure that regulatory
requirements are met.
Natrol is a 35-year-old Good Manufacturing Practices (GMP)
vitamin and supplement manufacturer with well-established
brands that has consistently achieved the highest 'A' rating
from the Natural Products Association, an independent
industry association responsible for certifying vitamins and
supplements.
The capacity utilization is being ramped up to its potential.
The focus areas for the medium term are to enhance the
product portfolio, be cost competitive, increase the revenue
and improve the margins.
In the first full year of operation in 2015-16 after the
acquisition, this business grew by about 15% with EBITDA
keeping pace with the overall corporate earnings.
PENEMS
Penem products are used as neuromuscular blockers while under anesthesia reversal. The Company has developed and made
penem filings in regulated markets for three injectable products and the fourth injectable product has also been filed in first
quarter of 2016-17. These four penems are high value products & the annual sales for them in the US, reported in March 2016,
were around USD 500 million (as per IMS).
Aurobindo has selected difficult to develop penem products, in keeping with the corporate strategy. These products have
already been launched in Brazil, Columbia, Mexico, Ukraine, Philippines & in some African countries. Some of these products
are being launched in a few European countries in 2016-17 & the impetus will be gained when the launch takes place in US
in 2016-17.

14
Quality has been the cornerstone of our success. An
Aurobindo product is a promise to the patient that it is
safe to consume, that it complies with all regulation and
meets high standards of quality.
We take nothing for granted. Under no circumstances do we
compromise on the safety of a product and every effort is
made to ensure compliance standards are met. Trained
people, equipment and instruments are available through
the operation, with effective supervision.
Our quality is embedded from the product development
stage. All our technical/operational team members, both at
the labs and in manufacturing, are trained in cGMP and
other regulatory standards and put a premium on raising
their awareness and in following all the laid down norms.
We recognize there can be no compromise on patient-safety. This approach
commits us to work hard on the integrity in our quality systems, standard
operating procedures and compliance standards. For us, product quality is an
investment in to the future and we wish to be known as quality people.
More importantly, our senior management gets involved in
supervising compliance and quality standards.
We are a growing organization and hence have instituted
sustainable systems and processes to cater for the
additional volume of business. In order to sensitize the
Company and bring about more professionalism and
competency based working, there is considerable focus on
quality and compliance right at the recruitment stage of
employees. The new recruits have to demonstrate that they
value current good manufacturing practices (cGMP), Six
Sigma, TQM, compliance & assurance standards and safety
and that these requirements are given priority over
everything else. The recruits thereafter are encouraged to
give priority for quality over quantity.
Walking the extra mile

Annual Report 2015-16
15
Business goals
Impact on quality,processes and people
Lead anddevelop people
Compliance standards
Safety
Coaching
Breakthrough performance
Successful leadersBullet proof managers
Auro DishaGraduate engineers
Boot camp Ownership, accountability
and responsibilityCommunicate with impact
Ensure complianceTeam contributor
Data integrityQuality MatrixSwach BPCRGreen shoot
KaizenFunctional experts in teams
Behavioral safety
We have built a quality culture, with ability to notice a
deviation and analyze everything that is out of trend.
Quality therefore is a deliberate action. This implies a
thorough knowledge of the product, its components and
processes. More importantly, there is empowerment that
contributes to actively enhancing the system.
Across the organization, there is a proactive approach to
meet all desirable standards. For instance, US FDA and
MHRA (UK) published their guidelines on data integrity.
Aurobindo went ahead and proactively implemented all the
data integrity policies and controls.
Similarly, EU has published their toxicology based limits for
removing residues during cleaning processes to prevent
contamination in the products and improve patient safety.
We had implemented this procedure much before the
guidelines were published.
We believe commitment to quality and being responsible is
a competitive advantage and hence are constantly
improving our standards by revisiting our processes, to
achieve continuous quality improvement. Harmonization of
systems across all units is an initiative that helps pre-empt
problem areas.
In a bid to minimize mistakes, most of our processes and
QA/QC systems and procedures are automated. Any
deviation triggers a review process at an early stage, to be
duly escalated to the senior management. Automation
enables us to minimize our risk perception, improve
visibility and escalation process. We shall address our
need to fully automate the processes and raise the
assurance levels.
QA/QC at the facilities, throughout the organization,
provide specific support, promote awareness, assume
guardianship, review relentlessly and audit the system.
They intervene in case of non-conformity. In addition,
there is a remote review system, where another layer of
audit ensures conformity.
The production system has in-process control thereby
allowing the targeted achievement of product/process
quality requirements. The documentation system has been
made reliable with built-in accountability.
We at Aurobindo run a series of stringent controls to ensure
that our products meet the needs of the patients and all
production standards. Every initiative is taken to improve
our processes and supervision.
The primary aim of our compliance management system is
to enhance product quality processes. Care is therefore
taken to raise the awareness and commitment level of the
employees to adhere to SOPs through three pillars:
communication, training and counseling.
Training methodologies and inputs inspire individuals to
walk the extra mile to assure ourselves that we deliver
products that meet process and compliance standards.

16
Aurobindo Pharma has already taken a leap in
manufacturing of sterile products. Today, we have
capabilities to develop and produce liquid, lyophilized and
dry powder injectable in vials, ampoules and pre-filled
syringes. The Company therefore has got one of the largest
portfolio of solutions, suspensions and complex molecules
for sterile products.
In Hyderabad, India, we are building end-to-end
capabilities integrating an R&D centre of excellence and
state-of-the art manufacturing with capabilities in clinical
development and global regulatory affairs. Each of these
The R&D team is increasingly focused on difficult to develop, niche oral, sterile,
specialty injectable products, penems and peptide based drugs involving
difficult, clinical end-point studies. There is a single minded focus on developing
complicated molecules, differentiated offerings, broad spectrum products and
newer technologies.
Raising the bar
distinct areas are backed and resourced with qualified
scientists and engineers working across protein chemistry,
process characterization and engineering.
Some of the on-going niche product pipelines being
developed are briefly listed below:
l Aurobindo has over 50 candidates for oncology in the
pipeline, with over 15 products pegged for early
stages of development;
l Another notable activity during the financial year was
the start of development work on 6 products in the
hormone segments. As in oncology, hormone products
are both in injectable and solid dosage forms, for
which the filings are expected to start soon;
l Work has been commenced on development of
dermatology, inhalers and nasal products at our US
development centers;
l Headway is being made on NDDS products and
technology on liposomes and microspheres, to
produce depot injections. These injectables are
22ANDAs filed
49Final approvals received
in 2015-16

Annual Report 2015-16
17
capable of sustained release delivery of polypeptides
from biodegradable polymeric microsphere;
l Considerable progress has been made in developing
pneumococcal conjugate vaccines (PCV);
l Efforts are underway to make a small beginning by
entering specialty branded generics;
l The Company has identified to develop/scale-up
several niche products, which involve multi-step
complex chemistry and complicated purification
technology;
l Development work has commenced on complex
molecules which take the clinical pathway route; and,
l Progress is being made on drug-device combination
products.
As in the past, during the year, cost optimization
continued to be a core area that was worked upon, for both
the US and EU markets. We optimized at least 20 products.
The nutraceuticals and the OTC teams made significant
contributions by commercializing new products.
In order to develop oncology APIs, an exclusive laboratory
has been created with isolators and appropriate personal
safety protection. A few APIs have been identified and
development work is on-going.
Chemical manufacturing processes of four active ingredients
(APIs) were validated for in-time filing of NCE-1 ANDAs in
the US with Paragraph-IV certification. At the same time,
six additional molecules were identified during the year and
process development was undertaken for NCE-1 filing in
2016-17.
During the year, new chemical technology has been
adopted to improve the productivity and efficiency of some
of the existing processes. Manufacturing technologies of 3
APIs were improved through these new initiatives.
Significant efforts were made to establish novel
crystallization techniques to directly obtain drug
substances with the desired particle size. In certain cases,
very fine particle size of drug substances have been
achieved through crystallization techniques without
multiple micronizations. Particle sizes of 7 APIs have been
modified by the crystallization technique.
In terms of the filings to US FDA, a total of 398 ANDAs
have been filed by Aurobindo as on March 31, 2016 out of
which 251 ANDA approvals (215 final approvals including
10 for Aurolife Pharma LLC, and 36 tentative approvals;
Tentative Approvals include 21 ANDAs approved under
PEPFAR) have been received. The balance 147 ANDAs were
under review for approval. During the year, Aurobindo filed
22 ANDAs, while 49 final approvals were received.
Similarly, as on March 31, 2016, the team has filed over
2,700 DMFs including 202 with US FDA. 158 patent
applications were pending with various authorities
and 18 have been granted patents.
2014-15 2015-16
3,465.5
4,699.4
R&D Expenses` MillionConsolidated
(3.38% ofnet revenue)

18
ENVIRONMENT
Every employee is sensitized and made responsible to look
after himself and be conscious to prevent any harm to his
colleagues and environment. Responsible employee
behaviour is evidenced by the fact that sustainability has
become an integral part of the business strategy and is
visible in the corporate culture.
We are not only minimizing risk, but are also saving on
costs & resources, reducing downtime and are therefore
improving productivity. The corporate culture hence,
demonstrates high level of commitment, responsibility,
compliance, safety, communication, monitoring and review.
At the manufacturing stage, sustainability approach is
reflected in the responsible processes that help to
maximize efficiency, improve yield, and minimize waste,
water and wastewater. We follow therefore, procedures that
Environment, health and safety practices across Aurobindo have a primary goal
to raise awareness in the employees about the importance of safety, the need to
conserve resources and protect the environment. As an organization, we strive
to reduce risks to our business and to our reputation.
Respect for the environment
are adopted for safety and quality such as ISO 14001:2004,
HAZOP (Hazard and operability study) and ensure shortest
possible routes in manufacture. Efficiency in use of
resources has resulted in lower emissions of greenhouse
gases, effluents and waste and maximized safety of
employees and contributed to healthier environment.
Meticulous care is taken right up to the disposal of waste
and discharges, treated wherever necessary, to minimize
the impact on the environment. For instance, about 45% of
total solid and hazardous process wastes generated in API
units and 90% from formulations units are being disposed
off, to be reused as auxiliary fuel in cement units.
Consistency in recycling achieved was due to the
infrastructure put in place for proper collection,
segregation and disposal practices across the organization.
In wastewater management, all larger API units in
Telangana have sustained zero liquid/zero process liquid

Annual Report 2015-16
19
SUSTAINABLE DESIGN
Ensure product and infrastructure sustainability
is examined and approved for every criticality at
facility construction & at pre-manufacturing stage
RESPONSIBLE MANUFACTURE
Minimize risk and waste, conserve energy and water &
reduce greenhouse gases, effluents and waste while
all chemical reactions are handled efficiently
ECOLOGICAL INTEGRATION
Focus on product's environmental compatibility and
ecological friendliness during and post production
SAFE & EFFICIENT USE
Assure people safety in handling and manufacture
recognizing product properties and process needs
RIGOROUSCOMPLIANCE
discharge systems. The treated water is being used for
utility services, and reverse osmosis system is being
installed in one of the API units located in Andhra Pradesh
for treatment of utility wastewater and reuse. We are
exploring further possibility of treatment and recycling of
wastewater to reduce stress on ground water utilization.
Efforts are being made for continual improvement in
segregation of liquid organic wastes at source itself; one
such endeavour pursued is in segregation and collection of
solvents being used in quality control, analytical labs and
process R&D facilities to achieve reduction of organic load
in wastewater and its treatment.
Environmental infrastructure was upgraded in the
manufacturing units: in some units, the existing systems
were further augmented with additional infrastructure that
would lead to energy saving or cleaner handling of waste
streams or emissions; in some others, newer systems were
installed in areas such as ATFD systems, RO systems,
paddle/double drum driers and ESP for boiler. Some of
these systems are planned to be replicated in other
manufacturing units during 2016-17.
On-line ambient air quality monitoring system is set up in
one of the API units and additional systems of the same
are augmented in another API unit. All Aurobindo units
are in compliance with the regulatory requirements in
respect of on-line continuous monitoring systems.
Dedicated STPs were installed in two of the formulations
units with MBBR technology, a patented procedure which is
functioning satisfactorily. Similar systems are being
planned in some of the API manufacturing units.
SAFETY
As a learning organization, we conduct rigorous evaluations
of our structures and processes to raise our own standards.
Safety is a key issue in the Company. Our overriding
approach as a company is that any workplace incident is
absolutely unacceptable.
Our sustainability efforts start at the design & construction
stage of the manufacturing facilities. In order to ensure
that all new facilities comply with EHS guidelines, all
project proposals and layouts are reviewed for EHS and all
necessary requirements are in-built during construction
phase itself. Similarly, we examine the product properties
from the development stage itself. Care is taken at the
design stage to use safest possible components as well as
to maximize use of renewable resources.
COMMITMENT TO EHS

20
We have launched several initiatives towards zero incidents.
This process starts with investment in state-of-the-art
manufacturing infrastructure, automation of the processes
wherever practical, and by sensitized employees trained to
be responsible for self and every colleague. There is an
on-going up-gradation program, where every incident or
near-miss in a manufacturing facility is used to enhance
the standard of safety across all units. As a mission, we
strive towards highest possible level of safety across the
Company.
People safety at handling of chemicals and during
manufacture remains a focus area. Employee awareness has
been raised to recognize product properties and process
needs, be sensitive to their own safety while handling,
without compromising on performance and effectiveness.
At the same time, every employee's suggestions are heard,
appreciated and implemented, as necessary.
During the year, all new chemical processes were reviewed
for safety elements before lab validation is done, so that
necessary changes in process are implemented, and
inherent safety is increased. Reaction Calorimeter and
Differential Scanning Calorimeter are available in research
centre to generate data on reaction hazards. Powder safety
data is also generated and hazards identified at lab stage
itself. These data provide key inputs for safe design of
process and the manufacturing facility.
HAZOP studies initiated in earlier years are continuing and
77 processes have been subjected to HAZOP study. Activity
based risk assessment is also progressing well and 59
activities have been completed this year.
In order to effectively oversee implementation of several
actionable items tracked at multiple sources, a CAPA
tracking methodology has been implemented, where
incomplete action items are highlighted on regular basis.
These are being further fine tuned by installing a software
based system to track completion of all actionable items.
Training remains a focus area, and a target of 0.5% of all
man-hours on safety training was set at the start of the
year. At the end of year, 0.52% was achieved. We intend to
stabilize this, and move to higher targets in the future.
During the year, Aurobindo has added more nitrogen
blanketing systems, VOC sensors, oxygen sensors linked to
alarm systems and better training infrastructure. New and
better technologies for fire fighting like aerosol based
systems and water mist based systems are also installed in
a few units.
Aurobindo conducts its business in accordance with its rigorous approach toEHS which are supported by effective management systems. These include:
l Well defined objectives and targets which are periodically reviewed;
l Active commitment to meeting all relevant legal and other requirements to which the Company is subject to
and monitoring compliance through periodic assessment;
l Continuous improvement in EHS performance, including prevention of pollution, hazard reduction and the
protection of human health;
l Robust training systems to ensure that all persons working for or on behalf of the Company adhere to their EHS
responsibilities;
l Regular assessment of the EHS impact and interactions of all new and existing business activities and products;
l Promotion of efficient use of energy and natural resources to minimize environmental impact;
l Encourage good health and wellness of our employees; and,
l Vigorous participation in initiatives for green cover development, in and around manufacturing locations.

Annual Report 2015-16
21

22
Aurobindo is committed to healthier life. Inspired by this
vision, the leadership in the Company is taking determined
steps towards ensuring that patient-first message reaches
all its employees. This acts therefore as the trigger to
institute robust processes, better documentation practices
and safe conditions.
During the year, the aim was to strategize for building a
large pool of leaders for tomorrow; creation of a talent pool
Whether in quality, compliance, safety, productivity or anything else, we are in
pursuit of perfection. Our aim is clear: Our efforts, on a daily basis, are to
improve ourselves over the previous day. We are a young, learning organization
with some of the best industry professionals taking the Company forward.
Pursuit of perfection
that we can depend upon. Therefore, a meaningful multi
layered training model was designed and implemented.
Our competency development efforts are aligned to the
strategic needs and focused guidance to employees to take
ownership for their own growth and team's operational
excellence. At the same time, organizational objectives are
being aligned with individuals' professional development
goals.
Deliver
Deliver superior results
Set Build
Develop
Develop self & others
RAISING PEOPLESTANDARDS
Raise team performanceSet ambitious standards

Annual Report 2015-16
23
We inducted 25 graduate engineer trainees (GET) into the
system at the entry level, oriented, trained and integrated
them into the system. This is a year-long effort that will
reap its benefits in years to come. Year on year, the policy
will now enable 25 GETs join the system. Much
benchmarking and studies were conducted to develop a
robust policy.
At the mid level management, we tied up with international
consultants to work on 24 key competencies required to
transform managers to leaders, an initiative that was
implemented. A year-long Management Development
Program was designed with assessment centers, reviews and
presentations made to senior management to raise the
standards. This initiative has already started yielding
results.
Manufacturing Council is another initiative designed for the
top leaders of the organization to share, contribute and
cascade critical knowledge with the team. All leaders meet
frequently to exchange working knowledge and experience
related to the challenges overcome, best practices,
compliance and excellence in production, across all
facilities. Analytical dialogues have led to robust reviews,
strengthening of leadership and communication within a
larger landscape. Senior management was also trained on
how to be effective mentors to help enhance performance
standards of their team.
A plethora of initiatives were cascaded to ensure
compliance within processes. As part of ensuring that
business goals are met, emphasis was given throughout the
year to compliance standards, the need to lead and develop
people and commitment to safety.
For instance, ensuring compliance standards is a series of
training sessions targeted at cGMP, data integrity, SOP
training, communication skills, ownership, planning and
team work. Separate workshops were conducted to better
understand Quality Matrix and data integrity for the mid-
to-senior level management. Behavioral based safety for
the entire senior management team was organized in
partnership with one of the best business schools in the
country.
We at Aurobindo offer a world of learning opportunities,
including those aimed at up-skilling, upgrading, cross-
skilling or re-skilling for our employees through a slew of
training programs in regulatory compliance, technical skills,
soft skills and leadership aspects. There is customized skill
orientation program helping the organization to augment
the specific skill set, to impact the operations positively.
The human resource strategy is designed to attract the best
professional suited to the Company, to nurture the
employees, to build long-term relationship and promote
excellence.
Aurobindo relies on its well-trained and motivated team of
employees to build a strong corporation that is oriented to
the core elements of strategy, structures and processes as
well as on APL values. These take everyday performance
initiatives which include:
l Drive for performance;
l Strive for excellence, and
l Deliver on promise.
Continuous investment is being made to steer everyone
towards respect for best practices and being accountable
for patient-health; where what matters is performance,
excellence and credibility; where each one makes a
difference to what we deliver.
The focus is to create a holistic performance led
organization where quality and compliance drives individual
productivity and achievement; a place where people take
responsibility in pursuit of perfection, for self and others.
ROAD TO SUSTAINABLE GROWTHPRODUCTIVITY IMPROVEMENTS CONTINUOUS IMPROVEMENT SUSTAINED PROFITABLE GROWTH
Cost effectivenessPortfolio optimization
Cash generation
Commercial excellenceOperational excellence
People excellence
Growth in all marketsImprove profitability of portfolioBe the first choice of customers

24
Aurobindo's social activities are an expression of how we live up to our
responsibilities. For us commitment goes beyond business. We work to make an
impact on society, with our products for patient-health and safety; with our
environmental initiatives towards safeguarding our neighbourhood; and, with
community partnerships to 'give back to society'.
Contributing to good life
We contribute to good life and engage in activities that
promote a sustainable society. Our contributions are visible
in areas such as promoting education, supporting
preventive health care, eradicating hunger, poverty &
malnutrition, providing safe drinking water, encouraging
environmental sustainability, ecological balance &
conservation of natural resources, sponsoring rural sports
and supporting old age homes etc.
All our initiatives are aimed at adding value to people,
especially the under privileged.
We do not just donate to an organization, but follow up to
ensure that the activity/asset for which the contribution is
made, is actually executed. We believe in creating long-
term assets such as class rooms for schools, dual desks,
bags, books, ambulance, geriatric eye care centre,
infrastructure for RO drinking water, construction of roads,
fire stations and toilets for schools, etc.
Beyond all these, we earmark a very large proportion of
funds to educate village boys and girls. In effect, we create
societal wealth.
During the financial year, Aurobindo undertook the
following activities:
PROMOTING EDUCATION
l Payment of salaries of Vidya volunteers;
l Construction/repair of class rooms/toilets;
l Painting/providing water in several government
schools, colleges & stadium under Swachh Bharat;
l Construction of Government Degree College
(Patancheru) and providing full-fledged furniture like
dual desks, cupboards, tables, lab tables and chairs;
l Distributed school bags & note books in various
government schools;

Annual Report 2015-16
25
PREVENTIVE HEALTH CARE, SANITATION & ROAD SAFETY
l Donated to LV Prasad Eye Institute (Aurobindo Geriatric Eye Care Centre), Visakhapatnam;
l Under healthcare & sanitation, supplied cleaning materials to 30 village panchayats;
l Donated operation theatre table to government public health centre;
l Donated amount towards rehabilitation of children with special needs;
l Contributed to national conference to bring awareness on rare diseases;
l Provided construction materials & supplied of medical equipment to diabetic hospital for senior citizens & socially,
economically backward groups;
l Supplied safe drinking water, free distribution of medicines and conducted health camps;
l Assisted in rehabilitation & skill development of mentally & hearing impaired handicapped children & adults;
l Donated for purchase of air conditioned ambulance, paid maintenance expenses for two fire stations; and,
l Installed closed circuit cameras at several public places such as highways towards ensuring public safety.
l Assisted in setting up of libraries for orphans and at government
high school;
l Provided digital education in 10 schools;
l Contributed towards empowerment of women through critical
knowledge about health, safety, self awareness, communication
skills, etc.;
l Donated towards employment enhancing vocation skills, and
police constable coaching for the socially & economically
backward groups;
l Offered scholarship to students towards education from
economically backward groups and offered financial support for
educating prisoners' children; and
l Distributed dual desks in various government schools.

26
PROVISION OF SAFE DRINKING WATER
l Aurobindo has set up water purification project (RO)
water plants with Any Time Water (ATW) cards & coin
system, dug bore wells, set up sintex tanks with
pipelines, 3-phase motors and RO water plants.
l The Company has constructed sumps for drinking
water purpose along with submersible motor and
other accessories.
l In several villages, the Company supplies drinking
water through water tankers.
HUNGER, POVERTY, MALNUTRITION ALLEVIATION
l Aurobindo distributed food items to Chennai flood victims, as part of
disaster relief;
l Provided food to fire accident victims in a few villages;
l Under 'Bhojanamrita', feeding of under privileged people and donated
amount towards construction of centralized kitchen; and,
l Supplied free meals to in-patient attendants and poor people of a 300
bed hospital.

Annual Report 2015-16
27
ENVIRONMENTAL SUSTAINABILITY,ECOLOGICAL BALANCE & CONSERVATION OFNATURAL RESOURCES & ANIMAL WELFARE
l Under 'Haritha Haram' programme planted trees,
erected cement, plastic and M.S. tree guards for
maintenance of plants;
l Donated to Sri VenugopalaswamiMandirGoshala
towards animal welfare;
l Constructed gobar gas plant for generation of power
for usage of Goshala cows.
DONATION TO OLD AGE HOME
Contributed towards expansion of old age home,
'Sai Krupa' - a home for the aged.
We are certain that we must contribute to the quality of life of people in our
neighbourhood. As in the past, we shall continue to foster positive relationships
with communities and favourably impact their lives.
RURAL DEVELOPMENT PROJECTS
Laying/widening/repairing of rural roads and construction
of village sewage water drainage system in several villages
towards rural development.
Provided drinking water facility and donated amount
towards skill development & employment enhancing
programs for the rural youth, donated towards free
education & free meals to children studying in rural areas,
and conducted surveys for need assessment in two villages
for adopting them.
PROMOTION OF RURAL SPORTS
Donated to sportsmen & women for training in rural sports
and nationally recognized sports.

28
1 2 3 4
5 6 7 8
1. Mr. K. RAGUNATHAN
(born 1963) Non-Executive
Chairman, an Independent
Director, is a Chartered
Accountant by profession and a
leading management consultant.
He has over three decades of
experience in consulting services.
2. Mr. K. NITHYANANDA REDDY
(born 1958) Whole-time Director
& Vice Chairman, a promoter of
the Company. He holds a Masters
Degree in Science and has been
associated with the Company
from the initial days. He is well-
versed with the manufacturing
technology and supervises the
overall affairs of the Company.
3. Mr. N. GOVINDARAJAN
(born 1968) Managing Director, is
a B.E. (Mechanical) from
Annamalai University. He has
more than 25 years of experience
across a variety of domains such
as active ingredients, CRAMS,
finished dosages & biotechnology.
4. Dr. M. SIVAKUMARAN
(born 1943) Whole-time Director,
he holds a Masters Degree in
Science and has been awarded a
PhD in Organic Chemistry. He has
about 43 years of experience in
the pharmaceutical industry and
is responsible for the
technological evolution of the
Company. He looks after research
and development, new product
development and total quality
management.
5. Mr. M. MADAN MOHAN REDDY
(born 1960) Whole-time Director,
has a Masters Degree in Science
(Organic Chemistry) and has held
top managerial positions in
leading pharmaceutical
companies. He commands over 25
years of valuable experience in
the pharmaceutical industry. He
looks after formulations
manufacturing of the Company.
6. Mr. P. SARATH CHANDRA REDDY
(born 1985) Whole-time Director,
he is a graduate in Business
Administration. He is a second
generation entrepreneur
experienced in general
management and has expertise in
project executions, IT,
procurement, etc.
7. Mr. P.V. RAMPRASAD REDDY
(born 1958) Non-Executive
Director and a promoter of the
Company. He is a postgraduate in
Commerce and prior to promoting
Aurobindo in 1986, he held
management positions in various
pharmaceutical companies. In
2008, the widely read World
Pharmaceutical Frontiers,
announced he is among the top
35 most influential people in the
pharmaceutical industry.
Board of Directors

Annual Report 2015-16
29
9
8. Mr. M. SITARAMA MURTY
(born 1943) Non-Executive, Independent
Director, did his Masters in Electronics. He is a
professionally qualified banker. He has over three
decades of experience as a banker and has held
various positions in nationalised banks and
retired as Managing Director & CEO of State Bank
of Mysore, in 2003. His specialised areas of
interest are international banking, foreign
exchange, money markets, funds management,
credit management, rural development,
computerisation, commercial law and systems.
9. Dr. D. RAJAGOPALA REDDY
(born 1959) Non-Executive, Independent
Director, holds Master's Degree in Science and
has been awarded a PhD in Organic Chemistry. He
has over three decades of experience in the
pharmaceutical industry and is the Chairman and
Managing Director of Erithro Pharma Private
Limited.
10. Dr. (Mrs.) AVNIT BIMAL SINGH
(born 1964) Non-Executive, Independent Director
of the Company. She holds an M.B.B.S. degree
and is a Post Graduate in obstetrics &
gynecology. She is a medical practitioner and a
senior obstetrician/gynecologist based at
Hyderabad.
Chief Financial OfficerMr. SANTHANAM SUBRAMANIAN
VP (Legal) & Company SecretaryMr. A. MOHAN RAMI REDDY
(upto May 31, 2016)
Company SecretaryMr. B. ADI REDDY
(from June 1, 2016)
Statutory AuditorsM/s. S.R. BATLIBOI & ASSOCIATES LLP
Chartered Accountants
Oval Office, 18 iLabs Centre,
Hi-tech City, Madhapur,
Hyderabad - 500 081
Internal AuditorsM/s. KPMG
1st Floor, Lodha Excelus,
Apollo Mills Compound,
N.M. Joshi Marg, Mahalaxmi,
Mumbai - 400 011
BankersAndhra Bank
Canara Bank
DBS Bank Limited
HDFC Bank Limited
ICICI Bank Limited
IDBI Bank Limited
Standard Chartered Bank
State Bank of Hyderabad
State Bank of India
Registrars & Transfer AgentsM/s. Karvy Computershare Private Limited
Karvy Selenium, Tower B, Plot No.31-32,
Gachibowli, Financial District,
Nanakramguda, Hyderabad - 500 032
Phone : +91 40 6716 2222
Fax : +91 40 2300 1153
E-mail : [email protected]
Corporate websitewww.aurobindo.com
10

30
Unit IV
Unit VII

Annual Report 2015-16
31
Unit ICVSCNS
Anti-allergicsCephalosporins
(non-sterile)
US FDAMHRA (U.K.)PMDA (Japan)ANVISA (Brazil)TGA (Australia)KFDA (Korea)COFEPRIS (Mexico)WHO
API UNITSUnit V
Penicillins
US FDAMHRA (U.K.)EDQM (France)PMDA (Japan)ANVISA (Brazil)TGA (Australia)COFEPRIS (Mexico)
Unit VIIIARVsCVSCNS
US FDAMHRA (U.K.)PMDA (Japan)ANVISA (Brazil)TGA (Australia)KFDA (Korea)COFEPRIS (Mexico)WHO
Unit IXIntermediates
US FDA Unit XIARVsCVSCNS
US FDAMHRA (U.K.)PMDA (Japan)ANVISA (Brazil)TGA (Australia)KFDA (Korea)COFEPRIS (Mexico)WHO
Unit IIIMultipurpose
Non-Betalactam
US FDAMHRA (U.K.)INFARMEDTGA (Australia)Health CanadaANVISA (Brazil)MCC (SA)
FORMULATIONS UNITSUnit IV
Injectable (generalcategory),
Inhalation andOphthalmic
US FDAANVISA (Brazil)INFARMEDGCC
Unit VI BCephalosporins(Sterile & non-
sterile)
US FDAFIMEA (Finland)TGA (Australia)ANVISA (Brazil)Health CanadaMCC (SA)GCC
Unit VIIMultipurpose
Non-Betalactam
US FDAINFARMEDTGA (Australia)Health CanadaANVISA (Brazil)MCC (SA)KFDAGCC
Unit XIISemi-synthetic
penicillins(Sterile & non-
sterile)
US FDAMHRA (U.K.)TGA (Australia)Health CanadaANVISA (Brazil)MCC (SA)FIMEA (Finland)GCC
Bioequivalencecentre
(inspected)
US FDAMHRA (U.K.)AFSSAPS (France)MCC (SA)
FILED APPROVED
FORMULATIONS USA 398 251
NDA/ANDAs Europe 187 149South Africa 167 84Canada 105 84
TOTAL 857 568
APIs USA 205
DRUG MASTER FILINGS Europe
New Registrations 115
Multiple Registrations 1,574
Others 715
Certificate of Suitability 118
TOTAL 2,727
as at March 31, 2016
Certifications
Regulatory Filings

32
Unit VI
Unit III

Annual Report 2015-16
33
Aurobindo Pharma LimitedCIN - L24239TG1986PLC015190Registered Office:Plot No.2, Maitri Vihar, Ameerpet,Hyderabad - 500 038Phone : +91 40 2373 6370Fax : +91 40 2374 7340E-mail : [email protected] : www.aurobindo.com
NOTICE is hereby given that the Twenty Ninth
Annual General Meeting of the Members of
Aurobindo Pharma Limited will be held on
Wednesday, the 24th day of August, 2016 at
3.30 p.m. at Hotel Taj Krishna, Road No.1,
Banjara Hills, Hyderabad - 500 034 to transact
the following business:
ORDINARY BUSINESS
1. To receive, consider and adopt the Audited
Standalone Balance Sheet as at March 31,
2016, Statement of Profit and Loss and
Cash Flow Statement for the financial year
ended March 31, 2016 and reports of
Directors and Auditors thereon.
2. To receive, consider and adopt the Audited
Consolidated Balance Sheet as at March 31,
2016, Statement of Profit and Loss and
Cash Flow Statement for the financial year
ended March 31, 2016 and report of
Auditors thereon.
3. To confirm the first interim dividend of
`0.50, second interim dividend of `0.60,
third interim dividend of `0.70 and fourth
interim dividend of `0.70, in aggregate
`2.50 per equity share of `1 each, as
dividend for the year 2015-16.
4. To appoint a Director in place of Mr. K.
Nithyananda Reddy (DIN: 01284195) who
retires by rotation at this Annual General
Meeting and being eligible, seeks re-
appointment.
5. To appoint a Director in place of Mr. M. Madan
Mohan Reddy (DIN: 01284266) who retires by
rotation at this Annual General Meeting and
being eligible, seeks re-appointment.
6. To ratify the appointment of the Auditors
and fix their remuneration and in this
regard to consider and if thought fit, to
Notice of Annual General Meeting
pass with or without modification(s), the following resolution as an Ordinary Resolution:
"RESOLVED THAT pursuant to the provisions of Sections 139,142 and other applicable provisions,
if any, of the Companies Act, 2013, read with Rules made there under, the appointment of
M/s. S.R. Batliboi & Associates LLP, Chartered Accountants (Registration No.101049W) as
Statutory Auditors of the Company, approved in the 27th Annual General Meeting, until 30th
Annual General Meeting, be and is hereby ratified in this Annual General Meeting till the
conclusion of next Annual General Meeting, with remuneration as may be decided by the Board of
Directors of the Company."
SPECIAL BUSINESS
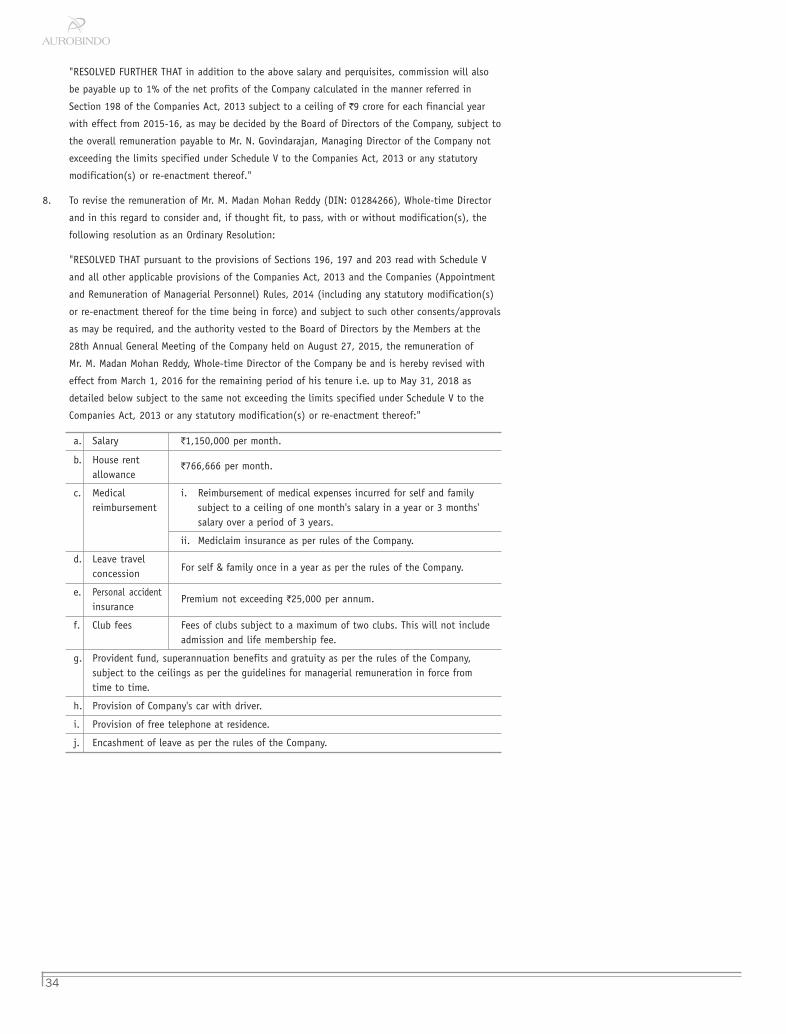
7. To revise the remuneration of Mr. N. Govindarajan (DIN:00050482), Managing Director and in this
regard to consider and, if thought fit, to pass, with or without modification(s), the following
resolution as an Ordinary Resolution:
"RESOLVED THAT pursuant to the provisions of Sections 196, 197 and 203 read with Schedule V
and all other applicable provisions of the Companies Act, 2013 and the Companies (Appointment
and Remuneration of Managerial Personnel) Rules, 2014 (including any statutory modification(s)
or re-enactment thereof for the time being in force) and subject to such other consents/approvals
as may be required, and the authority vested to the Board of Directors by the Members at the
28th Annual General Meeting of the Company held on August 27, 2015, the remuneration of
Mr. N. Govindarajan, Managing Director of the Company be and is hereby revised with effect from
March 1, 2016 for the remaining period of his tenure i.e. up to May 31, 2018 as detailed below
subject to the same not exceeding the limits specified under Schedule V to the Companies Act,
2013 or any statutory modification(s) or re-enactment thereof:
a. Salary `1,435,940 per month.
b. House rent`957,293 per month.
allowance
c. Medical i. Reimbursement of medical expenses incurred for self and familyreimbursement subject to a ceiling of one month's salary in a year or 3 months'
salary over a period of 3 years.
ii. Mediclaim insurance as per rules of the Company.
d. Leave travel For self & family once in a year as per the rules of the Company.concession
e. Other`1,281,200 per annum.
allowances
f. Provident fund, superannuation benefits and gratuity as per the rules of the Companysubject to the ceilings as per the guidelines for managerial remuneration in force fromtime to time.
g. Provision of Company's car with driver.
h. Encashment of leave as per the rules of the Company.
34
"RESOLVED FURTHER THAT in addition to the above salary and perquisites, commission will also
be payable up to 1% of the net profits of the Company calculated in the manner referred in
Section 198 of the Companies Act, 2013 subject to a ceiling of `9 crore for each financial year
with effect from 2015-16, as may be decided by the Board of Directors of the Company, subject to
the overall remuneration payable to Mr. N. Govindarajan, Managing Director of the Company not
exceeding the limits specified under Schedule V to the Companies Act, 2013 or any statutory
modification(s) or re-enactment thereof."
8. To revise the remuneration of Mr. M. Madan Mohan Reddy (DIN: 01284266), Whole-time Director
and in this regard to consider and, if thought fit, to pass, with or without modification(s), the
following resolution as an Ordinary Resolution:
"RESOLVED THAT pursuant to the provisions of Sections 196, 197 and 203 read with Schedule V
and all other applicable provisions of the Companies Act, 2013 and the Companies (Appointment
and Remuneration of Managerial Personnel) Rules, 2014 (including any statutory modification(s)
or re-enactment thereof for the time being in force) and subject to such other consents/approvals
as may be required, and the authority vested to the Board of Directors by the Members at the
28th Annual General Meeting of the Company held on August 27, 2015, the remuneration of
Mr. M. Madan Mohan Reddy, Whole-time Director of the Company be and is hereby revised with
effect from March 1, 2016 for the remaining period of his tenure i.e. up to May 31, 2018 as
detailed below subject to the same not exceeding the limits specified under Schedule V to the
Companies Act, 2013 or any statutory modification(s) or re-enactment thereof:"
a. Salary `1,150,000 per month.
b. House rent`766,666 per month.
allowance
c. Medical i. Reimbursement of medical expenses incurred for self and familyreimbursement subject to a ceiling of one month's salary in a year or 3 months'
salary over a period of 3 years.
ii. Mediclaim insurance as per rules of the Company.
d. Leave travelFor self & family once in a year as per the rules of the Company.
concession
e. Personal accidentPremium not exceeding `25,000 per annum.
insurance
f. Club fees Fees of clubs subject to a maximum of two clubs. This will not includeadmission and life membership fee.
g. Provident fund, superannuation benefits and gratuity as per the rules of the Company,subject to the ceilings as per the guidelines for managerial remuneration in force fromtime to time.
h. Provision of Company's car with driver.
i. Provision of free telephone at residence.
j. Encashment of leave as per the rules of the Company.

Annual Report 2015-16
35
Notes9. To appoint Mr. P. Sarath Chandra Reddy (DIN: 01628013) as Whole-time Director and in this
regard to consider and if thought fit, to pass, with or without modification(s), the following
resolution as an Ordinary Resolution:
"RESOLVED THAT pursuant to the provisions of Sections 196, 197 and 203 read with Schedule V
and all other applicable provisions of the Companies Act, 2013 and the Companies (Appointment
and Remuneration of Managerial Personnel) Rules, 2014 (including any statutory modification(s)
or re-enactment thereof for the time being in force) and subject to such other consents/
approvals as may be required Mr. P. Sarath Chandra Reddy (DIN: 01628013) be and is hereby
appointed as Whole-time Director of the Company for a period of three years with effect from
June 1, 2016, whose term of office shall be liable to determination by retirement of directors by
rotation, at a remuneration and perquisites as detailed below with liberty to the Board of
Directors to alter and vary the terms and conditions of the said re-appointment and/or
remuneration as it may deem fit and as may be acceptable to Mr. P. Sarath Chandra Reddy,
subject to the same not exceeding the limits specified under Schedule V to the Companies Act,
2013 or any statutory modification(s) or re-enactment thereof:"
a. Salary `375,000 per month.
b. House rent`250,000 per month.
allowance
c. Medical i. Reimbursement of medical expenses incurred for self and familyreimbursement subject to a ceiling of one month's salary in a year or 3 months'
salary over a period of 3 years.
ii. Mediclaim insurance as per rules of the Company.
d. Leave travelFor self & family once in a year as per the rules of the Company.
concession
e. Personal accidentPremium not exceeding `25,000 per annum.
insurance
f. Club fees Fees of clubs subject to a maximum of two clubs. This will not includeadmission and life membership fee.
g. Provident fund, superannuation benefits and gratuity as per the rules of the Company,subject to the ceilings as per the guidelines for managerial remuneration in force fromtime to time.
h. Provision of Company's car with driver.
i. Provision of free telephone at residence.
j. Encashment of leave as per the rules of the Company.
By Order of the Board
Hyderabad A. Mohan Rami ReddyMay 30, 2016 Vice President (Legal) & Company Secretary
1. A MEMBER ENTITLED TO ATTEND AND
VOTE AT THE MEETING IS ENTITLED TO
APPOINT A PROXY TO ATTEND AND VOTE
ON A POLL INSTEAD OF HIMESELF/
HERSELF AND THE PROXY NEED NOT BE A
MEMBER OF THE COMPANY. A person can
act as proxy on behalf of Members up to
and not exceeding fifty and holding in
the aggregate not more than ten per
cent of the total share capital of the
Company. Further, a Member holding
more than ten per cent of the total share
capital of the Company carrying voting
rights may appoint a single person as
proxy and such person shall not act as
proxy for any other person or Member. In
order to become valid, the proxy forms
should be deposited at the Registered
Office of the Company not less than 48
hours before the time fixed for holding
the meeting. The proxy form is enclosed.
2. A Statement pursuant to Section 102 of the
Companies Act, 2013 with respect to the
Special Business set out in the Notice, is
annexed.
3. Relevant documents referred to in the
accompanying Notice and the Statement is
open for inspection by the Members at the
Registered Office of the Company on all
working days during business hours up to
the date of the meeting of the Company.
4. The Register of Members and Share Transfer
Books of the Company will remain closed
from August 18, 2016 to August 24, 2016
(both days inclusive).
5. The Board of Directors of the Company has
declared first interim dividend @ 50% i.e.
`0.50 per share of `1 each, second interim
dividend @ 60% i.e. `0.60 per share of `1
each, third interim dividend @ 70% i.e.
`0.70 per share of `1 each and fourth
interim dividend @ 70% i.e. `0.70 per
share of `1 each for the year 2015-16. The
Board of Directors of the Company did not
recommend any further dividend for the
year 2015-16.
6. The unpaid/unclaimed dividend for the year
2007-08 and unpaid/unclaimed interim
dividend for the year 2008-09 were

36
Statement pursuant to Section 102(1) of the Companies Act, 2013
Item 7
The Members of the Company at the 28th Annual
General Meeting held on August 27, 2015
approved re-appointment of Mr. N. Govindarajan
as Managing Director of the Company for a period
of 3 years with effect from June 1, 2015 with a
remuneration of `2.25 crore per annum and other
perquisites, with liberty to the Board of Directors
to alter and vary the terms and conditions of the
re-appointment and/or remuneration as it may
deem fit and as may be acceptable to Mr. N.
Govindarajan, subject to the same not exceeding
the limits specified under Schedule V to the
Companies Act, 2013 or any statutory
modification or re-enactment thereof. In addition
to the salary and perquisites, commission will
also be payable up to 1% of the net profits of the
transferred to the Investor Education and
Protection Fund (IEPF). The Company has
uploaded the details of the unpaid and
unclaimed dividend amounts of the
previous years' on the website of the
Company (www.aurobindo.com) and also on
the website of Ministry of Corporate Affairs.
The unpaid/unclaimed dividend for the year
2008-09 will be transferred to the Investor
Education and Protection Fund of the
Central Government on the due date.
7. Members holding shares in physical form
are requested to notify immediately any
change in their address to the Company's
Registrar and Transfer Agents, M/s. Karvy
Computershare Private Limited. Members
holding shares in electronic form may
intimate any such changes to their
respective Depository Participants (DPs).
8. To avoid loss of dividend warrants in transit
and undue delay in receipt of dividend
warrants, the Company has provided a
facility to the Members for remittance of
dividend through electronic mode. For this
purpose, the details such as, name of the
bank, name of the branch, 9-digit code
number appearing on the MICR band of the
cheque supplied by the bank, account type,
account number, etc. are to be furnished to
your DP if the shares are in electronic form
or to the Registrar & Transfer Agents, if
they are held in physical mode.
9. The annual report for 2015-16 is being sent
by electronic mode only to the Members
whose E-mail addresses are registered with
the Company/Depository Participant(s) for
communication purpose unless any Member
has requested for a hard copy of the same.
For Members who have not registered their
E-mail addresses, physical copies of the
annual report 2015-16 are being sent by
the permitted mode. Members who have not
registered their E-mail addresses so far are
requested to register their E-mail address
for receiving all communication including
Annual Report, Notices, Circulars, etc. from
the Company electronically.
10. In terms of Section 108 of the Companies
Act, 2013 read with the Companies
(Management and Administration) Rules,
2014 and as per the requirements of the
SEBI Listing Regulations, 2015, the
Company is providing the facility, to its
Members holding shares in physical or
dematerialized form as on the cut-off date,
i.e. August 17, 2016, to exercise their right
to vote by electronic means on any or all of
the agenda items specified in the
accompanying Notice of Annual General
Meeting. Details of the process and manner
of E-voting along with the User ID and
password are being sent separately to all
the Members along with the Notice.
11. Members may also note that the Notice of
the 29th Annual General Meeting and the
Annual Report for 2015-16 will be available
on the Company's website. The physical
copies of the aforesaid documents will also
be available at the Company's Registered
Office for inspection during normal business
hours on working days. Members who
require communication in physical form in
addition to E-communication, or have any
other queries, may write to us at
12. Brief resume of Directors proposed to be
re-appointed, nature of their expertise in
specific functional areas, names of
companies in which they hold directorships
and membership/chairmanships of Board
Committees and shareholding in the
Company as stipulated under Securities and
Exchange Board of India (Listing
Obligations and Disclosure Requirements)
Regulations, 2015 are provided in the
Report on Corporate Governance forming
part of the Annual Report.
13. Members are requested to bring their
attendance slip along with their copy of the
Annual Report to the meeting.
Company calculated in the manner referred in
Section 198 of the Companies Act, 2013 subject
to a ceiling of `4 crore for each financial year, as
may be decided by the Board of Directors of the
Company.
Mr. N. Govindarajan, Managing Director is
responsible to the overall affairs of the Company.
The business operations of the Company are
growing substantially and there has been increase
in the Managing Director's responsibilities. He has
been part of sustained growth of the Company. In
view of the same, the Board of Directors of the
Company felt it appropriate to revise the
remuneration of Mr. N. Govindarajan, Managing
Director of the Company, commensurate with his
role and responsibilities. Accordingly, the Board
of Directors of the Company at its meeting held
on February 9, 2016 revised the remuneration of
Mr. N. Govindarajan, Managing Director based on
the recommendation of the Nomination and
Remuneration/Compensation Committee and
subject to the approval of the Members of the
Company, from `2.25 crore per annum to `3.00
crore per annum and other perquisites with effect
from March 1, 2016, with no changes in the other
terms and conditions of his appointment.
In addition to the salary and perquisites, the
Board of Directors of the Company, based on the
recommendation of Nomination and
Remuneration/Compensation Committee and
subject to the approval of the Members of the
Company, also revised the Commission payable to

Annual Report 2015-16
37
Mr. N. Govindarajan, up to 1% of the net profits
of the Company calculated in the manner referred
in Section 198 of the Companies Act, 2013
subject to a ceiling of `9 crore (Previously: `4
crore) for each financial year with effect from the
financial year 2015-16 as may be decided by the
Board of Directors of the Company.
The aforesaid revision of remuneration and
Commission shall be within the ceiling limits as
mentioned in Schedule V of the Companies
Act, 2013.
No Director, Key Managerial Personnel or their
relatives, except Mr. N. Govindarajan, to whom
the resolution relates, is interested or concerned
in the Resolution.
The Board recommends the Ordinary Resolution
set forth in Item 7 for approval of the Members.
Item 8
The Members of the Company at the 28th Annual
General Meeting held on August 27, 2015
approved re-appointment of Mr. M. Madan Mohan
Reddy as a Whole-time Director of the Company
for a period of 3 years with effect from June 1,
2015 at a remuneration of `1.30 crore per annum
and other perquisites, with liberty to the Board
of Directors to alter and vary the terms and
conditions of the re-appointment and/or
remuneration as it may deem fit and as may be
acceptable to Mr. M. Madan Mohan Reddy, subject
to the same not exceeding the limits specified
under Schedule V to the Companies Act, 2013 or
any statutory modification or re-enactment
thereof.
Mr. M. Madan Mohan Reddy looks after the
formulations plant operations and supply chain
management. Considering his multiple roles and
responsibilities, the Board felt it appropriate to
revise the remuneration of Mr. M. Madan Mohan
Reddy, Whole-time Director of the Company,
commensurate with his role and responsibilities.
Accordingly, the Board of Directors of the
Company revised the remuneration of Mr. M.
Madan Mohan Reddy, Whole-time Director based
on the recommendation of Nomination and
Remuneration/Compensation Committee and
subject to the approval of the Members of the
Company, from `1.30 crore to `2.30 crore per
annum and other perquisites with effect from
March 1, 2016 with no changes in other terms
and conditions of his appointment.
The aforesaid revision of remuneration shall be
within the ceiling limits as mentioned in
Schedule V of the Companies Act, 2013.
No Director, Key Managerial Personnel or their
relatives, except Mr. M. Madan Mohan Reddy to
whom the resolution relates, is interested or
concerned in the Resolution.
The Board recommends the Ordinary Resolution
set forth in Item 8 for approval of the Members.
Item 9
The Board of Directors of the Company at its
meeting held on May 30, 2016 based on the
recommendation of Nomination and
Remuneration/Compensation Committee,
appointed Mr. P. Sarath Chandra Reddy as a
Whole-time Director of the Company with effect
from June 1, 2016 for a period of three years,
subject to the approval of the Members at the
ensuing Annual General Meeting.
The terms of appointment of Mr. P. Sarath
Chandra Reddy and remuneration payable to him
are as set out in Item 9 of the Notice.
Mr. P. Sarath Chandra Reddy is on the Board of
the Company since September 27, 2007 as a Non-
Executive Director. He belongs to the promoter
group of the Company. A brief profile of Mr. P.
Sarath Chandra Reddy and name of the companies
in which he holds directorships and
memberships/chairmanships of board/
committees, as stipulated under Securities and
Exchange Board of India (Listing Obligations and
Disclosure Requirements) Regulations, 2015 are
provided in Report on Corporate Governance
forming part of the Annual Report.
No Director, Key Managerial Personnel or their
relatives, except Mr. P.V. Ramprasad Reddy and
Mr. K. Nithyananda Reddy to whom Mr. P. Sarath
Chandra Reddy is related and Mr. P. Sarath
Chandra Reddy, to whom the resolution relates, is
interested or concerned in the Resolution.
The Board recommends the Ordinary Resolution
set forth in Item 9 for approval of the Members.
By Order of the Board
A. Mohan Rami ReddyHyderabad Vice President (Legal) &May 30, 2016 Company Secretary

38
Dear Members ,
Your Directors are pleased to present the 29th Annual Report of the Company together with the auditedaccounts for the financial year ended March 31, 2016.
FINANCIAL RESULTS
2015-16 2014-15
Gross Turnover 93,227.6 82,448.4
Profit before depreciation, interest, tax and exceptional items 26,323.6 23,176.4
Depreciation/amortization 2,630.0 2,451.5
Finance cost 652.7 565.8
Exchange difference adjusted to borrowing cost 1,640.4 755.6
Profit before tax 21,400.5 19,403.4
Provision for tax/deferred tax 5,203.8 4,240.0
Net Profit after tax 16,196.7 15,163.5
Balance brought forward from previous year 41,682.3 28,278.4
Balance available for appropriation 57,879.0 43,441.9
Appropriations
Dividend on equity shares: Interim 1,461.4 1,312.8
Final – –
Tax on dividend 297.5 250.4
Depreciation adjusted (as per Schedule II) – 196.4
Transferred to general reserve – –
Surplus carried to Balance Sheet 56,120.1 41,682.3
Standalone financials ` Million
DIVIDEND
Your Directors have approved a fourth interim
dividend of 70% i.e. `0.70 per equity share and
together with the first interim dividend of 50% i.e.
`0.50 per equity share, second interim dividend of
60% i.e. `0.60 per equity share and third interim
dividend of 70% i.e.`0.70 per equity share, the
total dividend for the financial year 2015-16
comes to 250% (Post 1:1 bonus issue) i.e. `2.50
per share on the equity share of `1 against 450%
i.e. `4.50 per share of `1 paid in the previous year.
BONUS
As Members are aware, during the year, your
Company allotted 291,982,275 equity shares of
Boards' Report
`1 each to the shareholders of the Company as
bonus shares in the ratio of 1:1.
PERFORMANCE REVIEW
Your Company had a healthy financial performance
during the year contributed by a strong product
portfolio of complex products and differentiated
technology. There was a significant growth
momentum in all markets with solid overall results.
The focus was on execution of the strategies,
improving the product mix and gaining presence in
the markets. Your Company shall strive to sustain
the performance with the continuation of
approvals, expansion of manufacturing capacities
and being in verticals that add value to Aurobindo
and its stakeholders.
There was a robust growth in revenues, operating
profit and net profit. Aurobindo achieved a 14.5%
increase in standalone revenue in 2015-16 to
`93,495.0 million. At `26,323.6 million, the
operating profit including forex and other
income exceeded the corresponding previous
year by 13.6%.
Profit before tax for the year at standalone level
was `21,400.5 million, a growth of 10.3% over
2014-15 while the net profit at `16,196.7 million
is a growth of 6.8% over `15,163.5 million
reported in 2014-15. The diluted earnings per
share is `27.72 as compared to `25.98 (adjusted
for bonus shares issued in July 2015).
The rupee depreciated by 7% during the year
which entailed a foreign exchange loss of `1,640.4
million to your Company, due to restatement of
the Company's debt, most of which are dollar
denominated.
At the consolidated level, the revenues increased
to `138,960.8 million, a growth of 14.6% over the
previous year. EBITDA margin widened to 23.1% as
compared to 21.2% in 2014-15. EBITDA for the
year was `32,055.8 million as against `25,636.2
million in the previous year and the diluted
earnings per share grew by 25.6% to `33.92,
reflecting robust execution, improved product mix,
enhanced productivity and optimization of costs.
The Company saw sustained growth in all markets,
especially in the US, emerging markets and for its
ARV/HIV product portfolio.
US formulation business contributed 55% to the
overall formulation revenue during the year, as
against 50.5% in the previous year. The revenue
generated from the US business grew by 27.2% at
`61,439.9 million in 2015-16 over the previous
year sales of `48,317.0 million. The sales uptick
gained traction with the launch of several new oral
and injectable products in the US and the
performance of the nutraceuticals business.
Aurobindo received 49 final approvals from the US
FDA during the financial year, which helped add to
the momentum and market presence.
OTC products in the US continued to gain
penetration into several key regional markets. The
current portfolio consists of over 75 products and
a few more are being developed which are
expected to be commercialized in 2016-17.

Annual Report 2015-16
39
Europe sales were at `31,303.7 million in 2015-16
over the previous year sales of `31,947 million.
The focus during the year was on working towards
synergies between the acquired businesses at
Western Europe with the Company's existing
ground presence in several markets. The acquired
business witnessed profitability during the year,
contributed by business structures getting
streamlined, integrated and optimized to improve
information flow, decision making and control. The
processes were simplified and made more efficient.
These initiatives translate into better customer
contact, add to cost effectiveness, create superior
inventory management and drive profitability.
As part of further enhancing the European
business with a focus on cost optimization, several
products earmarked for Europe are being developed
at the research centre at Hyderabad and a large
manufacturing facility is being commissioned
dedicated for supplies at Visakhapatnam.
Shipments from this Unit XV facility would
commence in 2016-17.
Formulations sales to the emerging markets such
as Brazil, Ukraine, Mexico, and MENA (Middle East
and North Africa) as well as South Africa and
Canada grew by 21.5% to `6,914.2 million during
the year as compared to `5,691.9 million reported
in 2014-15. There has been a growth in ARV
formulations revenues by 24.5% to `11,998.8
million during the year, predominantly due to
participation in certain notable tenders.
Formulations sales across all geographies grew by
16.8% to `111,656.6 million as against `95,586
million in the previous year and constituted 79.5%
of the revenues while active pharmaceutical
ingredients (APIs) made the balance 20.5%.
Revenue from APIs has been `28,836.5 million in
the year under review, which is higher by 6.6%
over 2014-15. The growth has mainly been led by
the high value non-betalactam APIs, despite
ramping up volumes to meet the exponential
demand for in-house formulation manufacture.
Debottlenecking efforts are being undertaken at
the existing facilities to supplement API
capacities. Your Company sells API to domestic as
well as the global markets.
As in the past, Aurobindo made long-term
investments in all key markets with its customer
relationships, strategic partnerships and improved
business mix and market share. With a view to
ensure sustainable growth, the Company continued
to augment manufacturing capacity. This was
another year focused on operational excellence,
compliance standards, quality assurance,
productivity improvement and highest priority to
health and safety.
In order to enhance business intensity, employee
engagement and performance was targeted.
Aurobindo continued to attract and develop people
for the future to ensure good leadership and
organizational efficiency. Determined efforts on
enhancing margins, raising profitability and cash
flow generation helped lower the debt and improve
the quality of the balance sheet.
Overall, every initiative and endeavour was
designed to shape a successful future for the
Company.
OUTLOOK
Aurobindo's strategy is to develop and bring to
market specialty and complex generic products
including injectables, where the active
pharmaceutical ingredient is difficult to source, or
significant manufacturing or regulatory hurdles
exist and are difficult to overcome, or where
product is in short supply. The focus is on demand
led products that have a sustainable elevated
market, where the demand is for high value,
difficult to develop complex products.
Accordingly, your Company has been having a
strategy of filing for select, differentiated products
and as the approvals are received,
commercialization leads to market expansion.
Increasing launch of recently approved injectable
products and improved economics of the
commercialized products are likely to make an
impact on the revenues and bottom line. Several of
these are niche and high value products which
would further improve the product mix in the
market.
The anticipated launch of some of the products
recently approved by the FDA and increased
volumes of existing products is expected to keep
the momentum going over the next few quarters.
Several of the products that were approved by the
FDA in recent times and several others that await
approval are considered to be large market
opportunities. More important, the manufacturing
capacities are in place to meet the requirement.
The Company therefore looks forward to
significantly ramp up contributions from the
products over the foreseeable future.
There are several products under development in
the oncology and hormonal verticals which are
likely to be filed over the next 12 to 18 months.
Progress is being made at development stage in
microsphere technology, especially on formulation
feasibility, fine tuning and scaling up of
technology with a view to enter depot injection
products. Plans are on-going to file the first
product in 2017-18. The objective is to launch four
identified products, which together account for a
market size of around USD 3 billion. As stated
earlier, the focus is in qualitatively adding to a
differentiated product basket.
The Company has developed and made penem
filings for three injectable products for the US
market and the fourth product is filed in
first quarter of 2016-17. These four penems have
an addressable market of about USD 500 million as
per IMS March 2016 data. Aurobindo has selected
difficult to develop penem products, in keeping
with the corporate strategy. While the products
have been launched in Brazil and Mexico, the
impetus will be gained when the launch takes
place in US in 2016-17.
At Natrol, the business is encouraging. New
products are being developed and launched and in
line with the growth momentum the R&D pipeline
is being strengthened.
Aurobindo offers solid value proposition to its
customers with a breadth of portfolio. The build up
in portfolio with complex products makes your
Company a partner of choice. The team at
Aurobindo has been steadily improving on its
timing of supplies, especially its on-time-in-full
(OTIF) record. Investments are being made in
further enhancing the supply chain dynamics, to
improve reliability of deliveries while optimizing
on costs. There is a perceptible change favourably
impacting the customers and driving your
Company's growth.
Aurobindo is driving growth through several
verticals. There is a determined foray into

40
oncology and hormonal products, enzymes,
peptides including microspheres, oral
contraceptives, nasal products, steroids, OTC offers,
differentiated technology viz depot injections,
inhalers, patches and films. In all the newer
ventures, Aurobindo will build and leverage on its
inherent strengths augmented by a team of generic
industry-seasoned professionals. Your Company has
strong relationships in the market that would help
to create businesses with a broad, unique product
portfolio in record time. In essence, the new
business models are founded on core
competencies.
In financial terms, the objective is to strive for
higher predictable and calibrated growth, and
improve EBITDA margin and Return on Investment.
The target is to stay cash flow positive, improve
the quality of the balance sheet, lower the
leverage, reduce interest outgo and expand
earnings year-on-year
Your Company has set a vision to build businesses
that meaningfully impact their addressable
markets, are respected for customer centric
products and services, meet industry benchmarks
in productivity of resources, are recognized for
quality and compliance standards and in the
ultimate analysis, create societal wealth for all
stakeholders.
RESEARCH & DEVELOPMENT
Aurobindo's new product development initiatives
range from conventional oral and injectable
products to more complex and advanced dosages.
The focus during the year was to prioritize on the
difficult and niche products including oral and
sterile, peptide drug products involving difficult
clinical end-point studies. In filing ANDAs such
products involved innovative and highly
development intensive work. Cost optimization
continued to be a core area that was worked upon,
for both the US and EU markets.
The nutraceuticals and the OTC teams made
significant contributions by launching new
products. Another notable activity during the
financial year was the start of development work
on more than 20 products in the oncology and
hormone segments, both in injectable and solid
dosage forms for which the filings are expected
over the next 12 to18 months. Further, product
development has been initiated in new segments
such as dermatology products and nasal drug
delivery.
The continuous innovative and skillful work being
done by R&D team is seen in the number of
approvals received over the years with revenue
growth and productivity gains. The regulatory
product approvals for the ANDAs filed in the past
as well as increased contribution/
commercialization of the development projects
already undertaken, will continue to demonstrate
the intellectual property strengths of your
Company.
In order to develop oncology APIs, an exclusive
laboratory has been created with isolators and
appropriate personal safety protection. A few APIs
have been identified and development work is on-
going.
Analytical capabilities were enhanced by acquiring
the advanced models of GCMS, LCMS and ICPMS in
order to comply with the stringent ICH guidelines
for control of genotoxic impurities and toxic metal
ions. These would further improve quality of drug
substances and would also facilitate regulatory
approvals as impurities as low as less than 1 ppm
can be identified and quantified with these new
equipments. Additionally, an advanced XRD
machine has been acquired to detect and quantify
polymorph contamination at very low levels.
Chemical manufacturing processes of four APIs
were validated for in-time filing of NCE-1 ANDAs in
the US with Paragraph-IV certification. At the
same time, six additional molecules were identified
during the year and process development was
undertaken for NCE-1 filing in 2016-17.
In terms of the filings to US FDA, a total of 398
ANDAs have been filed by Aurobindo as on March 31,
2016 out of which 251 ANDA approvals (215 final
approvals including 10 for Aurolife Pharma LLC,
and 36 tentative approvals) have been received.
The balance 147 ANDAs are under review for
approval. During the year, Aurobindo filed 22
ANDAs, while 49 final approvals were received.
Similarly, as on March 31, 2016, the team has filed
over 2,700 DMFs including 202 with US FDA. So
far, 158 patent applications are pending with
various authorities and 18 have been granted
patents.
ENVIRONMENT, HEALTH & SAFETY
Your Company demonstrated consistency in
successful implementation of wastewater
treatment, recycle/reuse, hazardous waste disposal
and recycling from environmental management
considerations, across all manufacturing locations.
Consents from local regulatory agencies have been
obtained for four green field drug formulation
units.
Environmental infrastructure has been further
upgraded in some of the manufacturing facilities.
In some cases, the existing systems are further
augmented with additional infrastructure that
would lead to energy saving or cleaner handling of
waste streams or emissions. Some of these systems
include ATFD systems, RO systems, paddle/double
drum driers and ESP for boiler. Some of these
systems are planned to be replicated in other
manufacturing units where necessary during
2016-17.
On-line ambient air quality monitoring system is set
up in one of the API facility and additional systems
of the same are augmented in another API unit. The
Company's facilities are in compliance with the
regulatory requirements in respect of on-line
continuous monitoring systems.
Dedicated STPs are installed in two of the
formulations units with MBBR technology; a
patented procedure which is functioning
satisfactorily. Similar systems are being planned in
some of the API manufacturing units.
Preparation for ISO 14001 accreditation process of
one of the API unit is complete and certification is
expected during the year. It is proposed to initiate
the process for one more API unit during 2016-17.
As part of plantation drive, about 15,000 saplings
were planted in 2015-16. In 2016-17, it is
proposed to plant another 10,000 saplings.
On the safety aspect, all new chemical processes
are reviewed for safety elements before lab
validation is done, so that necessary changes can
be implemented in the processes, and inherent
safety is enhanced. Reaction calorimeter and DSC
are installed in the research centre to generate
data on reaction hazards. Powder safety data is
also generated at a third party lab and hazards
identified at lab stage itself. This data will provide
key inputs for safe design of process and plant in
which the process operates.
Hazard and operability (HAZOP) studies initiated
in earlier years are continuing and 77 processes

Annual Report 2015-16
41
have been subjected to HAZOP study. Activity
based risk assessment is also progressing well and
59 activities have been completed this year.
In order to effectively oversee implementation of
actionable items derived from multiple sources, a
corrective and preventive action (CAPA) tracking
methodology is implemented, where incomplete
action items are highlighted to senior management
on immediate basis.
Aurobindo's safety team ensures that all new
facilities comply with EHS guidelines, and hence
all project proposals and layouts are reviewed for
EHS, and necessary requirements are in-built from
the construction phase itself.
Training is a focus area, and a target of 0.5% of all
man-hours on safety training was set at the start
of the year. At the end of year, 0.52% was
achieved. The awareness levels will be further
enhanced with higher targeted training in the
coming years.
HUMAN RESOURCE DEVELOPMENT
During the year, the aim was to strategize for
future leaders of tomorrow; creation of a talent
pool that can be depend upon. Therefore, a
meaningful multi-layered model was designed and
implemented.
25 graduate engineers were inducted into the
system at the entry level, and were oriented,
trained and integrated into the system. This is a
year-long effort that will reap its benefits in years
to come. Year on year, the 25 GETs would be
inducted in to the system. Much benchmarking and
study was conducted to develop a robust
recruitment and induction policy.
At the mid level management, the Company tied
up with international consultants to work on 24
key competencies required to transform managers
to leaders and was implemented within the year. A
year-long MDP was designed with assessment
centers, reviews and presentations made to senior
management which had a perceptible impact on
the Company's operations.
The in-house Aurobindo Training and Development
Centre (ATDC) recruits, trains and helps absorb
talented employees. During the year, we have
recruited through this route over 230 employees
(M.Pharm, M.Sc., B. Pharm & ITI/diploma holders).
Adequate care is taken to ensure that the
candidates were fully equipped with appropriate
skill sets to perform their duties from day one.
Across the organization, every employee has been
sensitized towards technical excellence,
continuous improvement and to respect the
assurance standards in the interest of protecting
the process and product quality and patient
health.
An advanced management training system
'Nichelon 5 CMS' is implemented at all formulation
units, global pharmaco-vigilance and at APL
Healthcare. As part of harmonization, Nichelon5
CMS has been implemented at Auronext, a
subsidiary of the Company during 2015-16 and
also initiated implementation at other subsidiaries
such as Aurobindo USA, and in the Western Europe
operations.
AWARDS
Your Company was honoured in January 2016, the
Indian Drug Manufacturers' Association IDMA Margi
Memorial Best Process Patent Award 2014-15 for
three US patents.
The Pharmaceuticals Export Promotion Council of
India (Pharmexcil) conferred upon your Company a
Certificate of Appreciation in recognition of
commendable contribution in bulk/APIs category.
The Chief Commissioner of Central Excise, Customs
and Service Tax, Hyderabad felicitated your
Company in February 2016 for outstanding
performance during the financial year 2014-15.
SUBSIDIARIES/JOINT VENTURES
As per the provisions of Section 129 of the
Companies Act, 2013 read with the Companies
(Accounts) Rules, 2014, a separate statement
containing the salient features of the financial
statements of the subsidiary companies/associate
companies/joint ventures is detailed in Form
AOC-1 and is in Annexure-1 to this Report.
During the year, the following are the changes in
the subsidiaries of the Company:
Closure of subsidiaries
a. Actavis France (Merged with Arrow
Generiques, France retrospectively from
April 1, 2015);
b. APL IP Company Limited;
c. APL Holdings (Jersey) Limited;
d. Helix Healthcare B.V. has sold entire
shareholding of Aurobindo Pharma
(Australia) Pty Limited, Australia and its
subsidiary Aurobindo Pharma NZ Limited,
New Zealand on April 10, 2015.
Changes in structure/ownership
a. Milpharm Limited was acquired by Agile
Pharma B.V. from Helix Healthcare B.V.;
b. Aurobindo Pharma B.V. was merged into
Actavis B.V. On the same day, Actavis B.V.
was renamed as Aurobindo Pharma B.V.
Changes in the names of subsidiaries
a. Aurex B.V. was renamed as Pharmacin B.V.;
b. A separate company Pharmacin B.V. was
renamed as Aurex B.V.;
c. Actavis Deutschland GmbH & Co. KG was
renamed as Puren Pharma GmbH & Co. KG.
The process of liquidation of Aurobindo Pharma
(Singapore) Pte Limited, a dormant company, is
pending with Registrar of Companies, Singapore.
CONSOLIDATED FINANCIAL STATEMENTS
Consolidated Financial Statements have been
prepared by the Company in accordance with the
requirements of Accounting Standards 21 issued by
the Institute of Chartered Accountants of India
(ICAI) and as per the provisions of Companies Act,
2013. As per the provisions of Section 136 of the
Companies Act, 2013, the Company has placed
separately, the audited accounts of its subsidiaries
on its website www.aurobindo.com and copy of
audited financial statements of its subsidiaries will
be provided to the Members at their request.
VIGIL MECHANISM
The Board of Directors has adopted the Whistle
Blower Policy which is in compliance with Section
177(10) of the Companies Act, 2013 and
Regulation 22 of the SEBI (Listing Obligations and
Disclosure Requirements) Regulations, 2015. The
Whistle Blower Policy aims for conducting the
affairs in a fair and transparent manner by
adopting highest standards of professionalism,
honesty, integrity and ethical behavior. All
permanent employees and whole-time directors of
the Company are covered under the Whistle Blower
Policy.
A mechanism has been established for employees
to report concerns about unethical behavior, actual

42
or suspected fraud or violation of Code of Conduct
and Ethics. It also provides for adequate
safeguards against the victimization of employees
who avail of the mechanism and allows direct
access to the Chairperson of the audit committee
in exceptional cases. The Whistle Blower Policy is
available on the Company's website
http://www.aurobindo.com/about-us/
corporategovernance.
POLICY ON SEXUAL HARASSMENT
Your Company has constituted an Internal
Complaints Committee as per the Sexual
Harassment of Women at Workplace (Prevention,
Prohibition and Redressal) Act, 2013 and the Rules
there under. The Company has a policy on
prevention & prohibition of sexual harassment at
workplace. The policy provides for protection
against sexual harassment of women at workplace
and for prevention and redressal of such
complaints. During the year, no complaints have
been received under the policy.
RATING
The Long-term Fitch Rating of your Company has
been upgraded to 'IND AA+' from 'IND AA'
indicating stable outlook of the Company.
MEETINGS OF THE BOARD
The Board and Committee meetings are pre-
scheduled and a tentative calendar of the
meetings finalized in consultation with the
Directors to facilitate them to plan their schedule.
However, in case of special and urgent business
needs, approval is taken by passing resolutions
through circulation. During the year under review,
six Board Meetings and six Audit Committee
Meetings were convened and held. The details of
the meetings including composition of Audit
Committee are provided in the Corporate
Governance Report. During the year, all the
recommendations of the Audit Committee were
accepted by the Board.
DIRECTORS
As per the provisions of the Companies Act, 2013,
Mr. K. Nithyananda Reddy and Mr. M. Madan Mohan
Reddy will retire at the ensuing annual general
meeting and being eligible, seek re-appointment.
The Board of Directors recommends their
re-appointment.
The appointment of Mr. P. Sarath Chandra Reddy as
the Whole-time Director of the Company is being
proposed at the ensuing Annual General Meeting.
The Board of Directors recommonds his
appointment.
DETAILS OF DIRECTORS & KEY MANAGERIAL
PERSONNEL
The Members of the Company at the 28th Annual
General Meeting of the Company held on August
27, 2015 have re-appointed Mr. N. Govindarajan as
Managing Director, Mr. K. Nithyananda Reddy as
Vice Chairman and Whole-time Director, Dr. M.
Sivakumaran as Whole-time Director and Mr. M.
Madan Mohan Reddy as Whole-time Director for a
period of three years with effect from June 1,
2015. The Members also appointed Dr. (Mrs.) Avnit
Bimal Singh as an Independent Director of
the Company for a period of five years up to
March 24, 2020.
Mr. P. Sarath Chandra Reddy, a Non-Executive
Director of the Company was appointed as a
Whole-time Director of the Company with effect
from June 1, 2016 subject to the approval of the
Member at the ensuing Annual General Meeting.
Mr. A. Mohan Rami Reddy, Vice President (Legal) &
Company Secretary is retiring from the services of
the Company at the close of business hours on
May 31, 2016. Mr. B. Adi Reddy has been
appointed as Company Secretary of the Company
with effect from June 1, 2016.
DIRECTORS' RESPONSIBILITY STATEMENT
Pursuant to Section 134(3)(c) of the Companies
Act, 2013 your Directors confirm that:
a. in the preparation of the annual accounts,
the applicable accounting standards have
been followed along with proper explanation
relating to material departures, if any;
b. appropriate accounting policies have been
selected and applied consistently. Judgment
and estimates which are reasonable and
prudent have been made so as to give a true
and fair view of the state of affairs of your
Company as at the end of the financial year
and of the profit of your Company for the year;
c. proper and sufficient care has been taken for
the maintenance of adequate accounting
records in accordance with the provisions of
the Companies Act, 2013 for safeguarding
the assets of your Company and for
preventing and detecting fraud and other
irregularities;
d. the annual accounts have been prepared on
a going concern basis;
e. proper internal financial controls have been
laid down to be followed by your Company
and such internal financial controls are
adequate and are operating effectively; and
f. proper systems to ensure compliance with
the provisions of all applicable laws have
been devised, and such systems are
adequate and are operating effectively.
DECLARATION FROM INDEPENDENT DIRECTORS
The independent directors have submitted the
declaration of independence stating that they
meet the criteria of independence as provided in
sub-section (6) of Section 149 of the Companies
Act, 2013.
BOARD DIVERSITY
The Company recognizes and embraces the
importance of a diverse board in its success. The
Board has adopted the Board Diversity Policy
which sets out the approach to diversity of the
Board of Directors. The Board Diversity Policy is
available on the Company's website
http://www.aurobindo.com/about-us/corporate-
governance.
BOARD EVALUATION
SEBI (Listing Obligations and Disclosure
Requirements) Regulations, 2015 mandates that
the Board shall monitor and review the Board
evaluation framework. The Companies Act, 2013
states that a formal annual evaluation needs to be
made by the Board of its own performance and
that of its committees and individual directors.
Schedule IV of the Companies Act, 2013 states
that the performance evaluation of independent
directors shall be done by the entire Board of
Directors, excluding the director being evaluated.
The evaluation of all the Directors and the Board
as a whole was conducted based on the criteria
and framework adopted by the Board including
performance and working of its committees.
POLICY ON DIRECTORS' APPOINTMENT AND
REMUNERATION
The policy of the Company on directors'

Annual Report 2015-16
43
appointment and remuneration, including criteria
for determining qualifications, positive attributes,
independence of a director and other matters are
adopted as per the provisions of the Companies
Act, 2013. The remuneration paid to the Directors
is as per the terms laid out in the nomination and
remuneration policy of the Company. The
nomination and remuneration policy as adopted by
the Board is placed on the Company's website
http://www.aurobindo.com/about-us/corporate-
governance.
TRANSFER TO RESERVE
The Company has not transferred any amount to
general reserve out of the profits of the year.
LOANS, GUARANTEES OR INVESTMENTS
Loans, guarantees or investments covered under
Section 186 of the Companies Act, 2013 form part
of the Notes to the financial statements provided
in this Annual Report.
CONTRACTS OR ARRANGEMENTS WITH RELATED
PARTIES
The particulars of contracts or arrangements with
related parties referred to in sub-section (1) of
Section 188 of the Companies Act, 2013 is
prepared in Form No. AOC-2 pursuant to clause (h)
of sub-section (3) of Section 134 of the Act and
Rule 8(2) of the Companies (Accounts) Rules, 2014
and is in Annexure-2 to this Report.
EXTRACT OF ANNUAL RETURN
As required under Section 92(3) of the Companies
Act, 2013 and Rule 12(1) of the Companies
(Management and Administration) Rules, 2014, the
extract of Annual Return prepared in Form MGT-9 is
in Annexure-3 to this Report.
CONSERVATION OF ENERGY, TECHNOLOGY
ABSORPTION, FOREIGN EXCHANGE EARNINGS
ANDOUTGO
Information with respect to conservation of
energy, technology absorption, foreign exchange
earnings and outgo pursuant to Section 134(3)(m)
of the Act read with Companies (Accounts) Rules,
2014 is in Annexure-4 to this Report.
RISK MANAGEMENT COMMITTEE
Risk Management Committee of the Company
consists of three Directors viz. Mr. M. Sitarama
Murty, Mr. N. Govindarajan and Mr. P. Sarath
Chandra Reddy. The Company has established a
separate department to monitor the enterprise risk
and for its management.
The Committee had formulated a risk management
policy for dealing with different kinds of risks
which it faces in day-to-day operations of the
Company. Risk management policy of the Company
outlines different kinds of risks and risk mitigating
measures to be adopted by the Board. The
Company has adequate internal financial control
systems and procedures to combat the risk. The
risk management procedure is reviewed by the
Audit Committee and Board of Directors on regular
basis at the time of review of quarterly financial
results of the Company. A report on the risk and
their management is enclosed as a separate
section forming part of this report.
AUDITORS & AUDITORS' REPORT
The statutory auditors' report is annexed to this
report. The notes on financial statements referred
to in the Auditors' Report are self-explanatory and
do not call for any further comments. There are no
specifications, reservations, adverse remarks on
disclosure by the statutory auditors in their report.
They have not reported any incident of fraud to
the Audit Committee of the Company during the
year under review.
The Members of the Company at the 27th Annual
General Meeting had appointed M/s. S.R. Batliboi
& Associates LLP, Chartered Accountants as
Statutory Auditors of the Company up to the
conclusion of 30th Annual General Meeting of the
Company subject to ratification of the
appointment by the members at every Annual
General Meeting. The ratification of the
appointment of statutory auditors is proposed at
the ensuing Annual General Meeting.
COST AUDIT
M/s. Sagar & Associates, Cost Accountants, were
appointed as Cost Auditors of the Company to
conduct cost audit of the Company for the year
2014-15. The Cost Audit Report of the Company in
XBRL format for 2014-15 was filed with the
Ministry of Corporate Affairs within the due date.
INTERNAL AUDITORS
The Board of Directors of the Company has
appointed a professional firm of Chartered
Accountants to conduct internal audit of the
Company for the financial year ended March 31,
2016.
INTERNAL FINANCIAL CONTROLS
The internal financial controls (IFC) framework at
Aurobindo encompasses internal controls over
financial reporting (ICOFR) as well as operational
controls that have been put in place across all key
business processes of the Company. The internal
controls are designed to facilitate and support the
achievement of the Company's business objectives
and such controls do enable the Company to adapt
to changing and operating environment, to
mitigate risks to acceptable levels and to support
sound decision making and good governance.
Details in respect of adequacy of internal financial
controls with reference to the financial statements
are briefly iterated below:
a. The Company maintains all its major records
in ERP System (Oracle Financials) and the
work flow and approvals are routed
accordingly;
b. The Company has appointed internal
auditors to examine the internal controls,
and examine whether the workflow of the
organization is being done through the
approved policies of the Company. In every
quarter, during the approval of financial
statements, internal auditors present the
internal audit report and the management
comments on the internal audit
observations; and
c. The Board of Directors of the Company has
adopted various SOPs and policies such as
related party transactions policy, whistle
blower policy, policy to determine material
subsidiaries and such other procedures for
ensuring the orderly and efficient conduct of
its business for safeguarding of its assets,
the prevention and detection of frauds and
errors, the accuracy and completeness of the
accounting records, and the timely
preparation of reliable financial information.
SECRETARIAL AUDIT REPORT
Pursuant to the provisions of Section 204 of the
Companies Act, 2013 and Rule 9 of the Companies
(Appointment and Remuneration of Managerial
Personnel) Rules, 2014, the Company has
appointed Mr. S. Chidambaram, Practicing Company
Secretary (C.P.No:2286) to undertake the
Secretarial Audit of the Company for the financial
year 2015-16. The Secretarial Audit Report issued

44
in form MR-3 is in Annexure-5 to this Report.
There are no qualifications, reservations or adverse
remarks in the Secretarial Audit Report.
CORPORATE SOCIAL RESPONSIBILITY
Your Company believes that there must be a
healthy partnership between business and the
society. Initiatives are therefore taken to execute
on the stated CSR policy of 'give back to the
society.'
The activities during the year centered on
providing educational support, healthcare,
sanitation, public safety, poverty alleviation and
sports. In educational area, the activities included
renovation of school buildings, construction of
class rooms, library and toilets, provision of
furniture such as desks, payment of salaries at
municipal schools, and encouraging school
children with bags, note books, scholarship etc.
In healthcare, the Company continued to supply
safe drinking water to an entire village, provide
pipelines to transport water to overhead tanks,
underground storages and installation of RO
plants. Drains were constructed and ambulance
donated to a village.
Under the category of public safety, Aurobindo also
contributed fire engines and paid monthly salaries
of fire safety staff. At the request of the police
authorities, the Company installed CCTV cameras
on national highway covering areas such as
Hyderabad, Polepally, Siddipet and Jedcherla.
From August 2015, the Company provides 300
meals every day for the attendants and staff of a
government hospital at Sangareddy. A centralized
kitchen is also run for the benefit of the public at
an Iskcon centre.
A detailed account of the CSR activities forms part
of the annual report on CSR placed on the
Company's website at: http://www.aurobindo.com/
social-responsibility/csr-activities. Report on
Corporate Social Responsibility as per Rule 8 of the
Companies (Corporate Social Responsibility Policy)
Rules, 2014 is in Annexure-6 to this Report.
STATEMENT OF PARTICULARS OF APPOINTMENT
AND REMUNERATION OF MANAGERIAL
PERSONNEL
The statement of particulars of appointment and
remuneration of managerial personnel as per Rule
5 of the Companies (Appointment and
Remuneration of Managerial Personnel) Rules,
2014 is in Annexure-7 to this Report.
INSURANCE
All properties and insurable interests of the
Company including buildings, plant and machinery
and stocks have been fully insured.
MATERIAL CHANGES AND COMMITMENTS
There are no material changes and commitments in
the business operations of the Company from the
financial year ended March 31, 2016 to the date of
signing of the Director's Report. There were no
significant and material orders passed by the
regulators or courts or tribunals impacting the
going concern status and Company's operations in
future.
CORPORATE GOVERNANCE
A separate section on Corporate Governance
standards followed by your Company, as stipulated
under Schedule V (C) of the SEBI (Listing
Obligations and Disclosure Requirements)
Regulations, 2015 is enclosed as a separate
section forming part of this report.
The certificate of the Practicing Company
Secretary, Mr. S. Chidambaram with regard to
compliance of conditions of corporate governance
as stipulated under Schedule V (E) of the SEBI
(Listing Obligations and Disclosure Requirements)
Regulations, 2015 is annexed to the Report on
Corporate Governance.
MANAGEMENT DISCUSSION AND ANALYSIS
Management Discussion and Analysis Report for
the year under review as stipulated under SEBI
(Listing Obligations and Disclosure Requirements)
Regulations, 2015 is presented in a separate
section forming part of this report.
FIXED DEPOSITS
Your Company has not accepted any fixed deposits
from the public within the purview of Chapter V of
the Companies Act, 2013.
INDUSTRIAL RELATIONS
Industrial relations at all units of the Company
have been harmonious and cordial. The employees
are motivated and have shown initiative in
improving the Company's performance.
TRANSFER OF UNPAID AND UNCLAIMED AMOUNT
TO IEPF
The dividends which remain unpaid/unclaimed for
a period of seven years, have been transferred on
due dates by the Company to the Investor
Education and Protection Fund (IEPF) established
by the Central Government.
SHARE CAPITAL
The paid up share capital of the Company
increased by `293,187,311 during the year due to
the allotment of 291,982,275 equity shares of `1
each as Bonus and 1,205,036 equity shares of `1
each on exercise of stock options under the
Employee Stock Option Plan-2006 (ESOP 2006) of
the Company. The paid up share capital of the
Company as on March 31, 2016 was 585,169,586
equity shares of `1 each.
EMPLOYEE STOCK OPTION SCHEME
The Members at the Annual General Meeting of the
Company held on September 18, 2006 approved
formulation of Employee Stock Option Scheme-
2006 (ESOP 2006) for the eligible employees and
Directors of the Company and its subsidiaries.
Details of the stock options as on March 31, 2016
is provided on the Company's website:
http://www.aurobindo.com/about-us/corporate-
governance. The details of the employee stock
options also form part of the notes to accounts of
the financial statements in this Annual Report.
ACKNOWLEDGEMENTS
Your Directors are grateful to the employees of
Aurobindo for building a strong foundation for the
Company and working towards enhancing growth
in the future. The Directors want to thank the
customers, business associates, banks, central and
state governments and their agencies for their
trust, encouragement and support. Every day, the
investors have shown their faith in Aurobindo. The
Board shall always strive to perform to meet their
expectations.
For and on behalf of the Board
K. RagunathanHyderabad ChairmanMay 30, 2016 DIN: 00523576

Annual Report 2015-16
45
ECONOMIC BACKGROUND
Indian economy has taken impressive strides with
reduction in macro-vulnerability due to reforms in
key areas, pursuit of fiscal prudence and focus on
price stability. The benign price situation and
comfortable level of external current account in
the country makes it possible for growth rates of
8% or higher in the next couple of years.
The Government has reiterated its commitment to
carrying the reform process forward and
conditions exists today for such growth aided by
the prevailing macro-economic stability.
The GDP growth rate climbed from 7.2% in
2014-15 to 7.6% in 2015-16 and is estimated to
be in the range of 7.5% to 8% in 2016-17. Such a
growth rate makes India the fastest growing
major economy in the world. India's contribution
in the global economy has become much more
valuable today than anytime ever in the past. The
recent growth revival in India is predominantly
consumption driven. The growth in services
sector however, has moderated slightly. The
acceleration in manufacturing growth has
compensated for the lower growth in agriculture
sector, due to two successive years of lower than
normal monsoon rains. With the expected above-
normal monsoon in 2016, there is considerable
optimism across all sections of the economy.
INDUSTRY PERSPECTIVE
In several respects, pharmaceutical industry never
had it so good. Demand for its products is
escalating and trade is getting easier with the
result, well-organized companies have been
growing sustainably. Aging populations, chronic/
lifestyle diseases, emerging-market expansion,
and treatment and technology advances are
expected to spur the global pharmaceutical
industry.
Management
Discussion & Analysis
For instance, an aging population in many
developed countries, coupled with lengthening
life expectancies globally, should generate
increasing demand for life sciences products to
treat age related diseases such as Alzheimer's,
diabetes, and arthritis. According to Economist
Intelligence Unit (EIU), life expectancy is
expected to increase from an estimated 72.7
years in 2013 to 73.7 years by 2018 (due, in
part, to dropping infant mortality rates and the
fight against communicable diseases). Another
study estimates that the number of people
globally over the age 65 is around 601 million, or
over 8.5% of the total global population. This
segment will continue to grow.
At the same time, efforts by governments, health
care providers, and health plans to reduce costs,
improve outcomes and demonstrate value is
dramatically altering the health care demand and
delivery landscape. It is becoming increasingly
evident that the global pharmaceutical industry
sector is operating in an era of significant
transformation.
A dynamically changing clinical, regulatory, and
business landscape demands that pharmaceutical,
biotechnology, and medical technology
companies adapt traditional research and
development (R&D), pricing, supply chain and
commercial models to support value-based
payments for public and private health care
systems, contain costs to face price controls and
increase the use of generics and bio-similars to
contain drug and device costs. In addition, a
growing list of regulatory requirements and
expectations are imposing new challenges on the
industry.
According to the EIU, pharmaceutical sales are
projected to increase an average of 6.9% annually
over 2014-18, outpacing the estimated global
health care spending rate of 5.2% during that
same period. Total pharma revenues are expected
to increase from USD 1.23 trillion in 2014 to USD
1.61 trillion in 2018.
North America is responsible for the largest
portion, generating more than 41% of these
revenues. This is mostly due to the leading role
of the U.S. pharmaceutical industry.
In 2015, total spending on medicines in the U.S.
reached USD 310 billion on an estimated net
price basis, up 8.5% from the previous year,
according to a report issued by the IMS Institute
for Healthcare Informatics. The surge of new
medicines remained strong in 2015 and demand
for recently launched brands maintained
historically high levels. The savings from branded
medicines facing generic competition were
relatively low in 2015, and the impact of price
increases on brands was limited due to higher
rebates and price concessions from
manufacturers. Specialty drug spending reached
USD 121 billion on a net price basis, up more
than 15% from 2014.
The IMS study, Medicines Use and Spending in the
U.S.: A Review of 2015 and Outlook to 2020,
found that longer-term trends continued to play
out last year, driven by the Affordable Care Act
and ongoing response to rising overall healthcare
costs. Increasingly, healthcare is being delivered
by different types of healthcare professionals and
from different facilities, while patients face
higher out-of-pocket costs and access barriers.
The outlook for the global pharmaceutical market
is expected to reach USD 1.4 trillion and 4.5
trillion doses of medicine in 2020 from USD 1.07
trillion and 3.6 trillion doses in 2015 and the
generic market is expected to be at USD 190
billion in 2020. The growth is being driven by
clusters of innovative treatments and offset by

46
the rising impact of brands facing generic or bio-
similar competition.
Overall, the 10 largest drug companies control
over one-third of this market, several with sales
of more than USD 10 billion a year and profit
margins of about 30%. Six are based in the
United States and four in Europe. It is estimated
that North and South America, Europe and Japan
will continue to account for 85% of the global
pharmaceuticals market well into the 21st
century. Of these collectively, the mature markets
generate 59% of the total revenues.
According to the current trend, in addition to
oncology drugs, the cardiovascular therapeutic
class will likely prosper, with four of the 10
projected blockbuster drugs belonging to these
categories. Spending on mid-market prescription
drugs used for treating common chronic diseases
is likely to stagnate as prices fall. Demand for
generic drugs will continue to rise as payers take
advantage of patent expiries to reduce costs.
A generic drug (commonly referred as generics) is
a drug defined as 'a drug product that is
comparable to a brand/reference listed drug
product in dosage form, strength, quality and
performance characteristics and intended use.'
Generic drugs are subject to the regulations of
the governments of countries where they are
dispensed.
A generic drug must contain the same active
ingredients as the original formulation. According
to the US FDA, generic drugs are identical or
within an acceptable bioequivalent range to the
brand-name counterpart with respect to
pharmacokinetic and pharmacodynamic
properties. By extension, therefore, generics are
considered (by the FDA) identical in dose,
strength, route of administration, safety, efficacy,
and intended use. In most cases, generic products
are available once the patent protections afforded
to the original developer have expired.
Traditionally, pharmaceutical companies develop
new branded drugs by investing huge amounts of
money (often more than USD 1 billion) into
research and development over 10-15 years. This
is the amount of time and money required to not
only develop a number of potential new drugs,
but go through the long, expensive and arduous
approval process required by the US Food and
Drug Administration (FDA) to prove a drug is safe
and effective, and then market the drug to
consumers. Since this model is expensive and
time consuming, the FDA typically gives drug
companies 12 years of patent protection and a
total monopoly on sales during that period. This
allows the drug companies to recoup their costs,
earn a profit, and start the process anew for the
next wave of new and innovative drugs.
In contrast, generic drug companies operate very
differently. The amount of money they need to
invest to produce a generic is many orders of
magnitude less than the traditional branded drug
companies, since the drug has already been
formulated and approved. In order to protect the
traditional branded drug companies and allow
them to earn back the amount of money invested,
generic drugs can only be introduced after the 12
years of patent protection has expired. And even
then, FDA-approved copies of branded drugs are
only given a short 180-day exclusivity period if
their generic is the first to market. Once generic
drugs are introduced to the market, they are
typically sold at steep discounts (50%-70%)
compared to the branded alternative and, as a
result, branded drugs typically lose 90% or more
of their market share to generics in a short
amount of time.
Today in the US, generic drugs account for 88%
of all prescriptions filled and according to an IMS
report, generics may account for 91%-92% of
prescription volumes by 2020. According to a
report by IMS Health, generic drugs are expected
to account for 52% of global pharmaceutical
spending growth, compared to 35% for branded
drugs. As per IMS report of Q2 2015, the U.S.
healthcare system saved USD 1.7 trillion in the
last ten years due to the availability of low cost
generics.
According to estimates by IMS, generics will
constitute 52% of global pharmaceutical
expenditure growth. Branded drugs will
constitute only 35% of growth. IMS also
estimates that generic drug revenues will climb
to USD 442 billion in 2018. Major factors driving
the growth include popular branded drugs losing
their patent protection (known as a 'patent
cliff'), support for generics from governments,
new complex generics coming into the market,
and industry consolidation.
Over the last one year US FDA approval activity
has picked up significantly. As per several
research reports, at the current approval rate,
annualized approvals are likely to be 700 versus
historical approvals in the 400-500 range. The
higher approval rates are likely to benefit the
large pharmaceuticals companies that have strong
US pipeline.
The US nutraceuticals market is currently at
around USD 38 billion and is expected to grow to
USD 46 billion by 2018 as per 2015 Nutrition
Business Journal. The growth drivers for the US
nutraceutical market is ageing population,
increased consumer focus on proactive health
management, increase/perceived increase in
condition-specific disorders, growing consumer
interest in drug-free/natural health solutions that
are proven effective. Key macro segments in the
US nutraceutical category is vitamins, specialty
supplements, herbs & botanicals, sports nutrition,
meal replacements and minerals.
In the European markets, as per IMS, the top 5
countries are expected to spend USD 180-190
billion on medicines in 2020, an increase of USD
40 billion, which includes USD 19.4 billion of
exchange rate effects and is mostly driven by
Germany and the wider adoption of specialty
medicines. Germany will increase spending from
USD 41 billion to USD 57 billion, an increase of
USD 16 billion (including USD 7.9 billion of
exchange rate effects) largely a result of wider
adoption of innovation and supported by health
technology assessments, including re-assessments
of already marketed products. France is the
second largest market in Europe with lower
generics penetration. Across Europe, the adoption
of specialty medicines will drive higher spending
growth to 2020 with 81% of the increase to be
driven by specialty medicines.
Seen from India perspective, the country has over
10,500 manufacturing units and over 3,000
pharma companies and exports all forms of
pharmaceuticals from active pharmaceutical
ingredients (APIs) to formulations, both in
modern medicine and traditional Indian
medicines. Globally, India ranks among the top
exporters of formulations by volume. The Indian
pharmaceuticals market is third largest in terms
of volume and thirteen largest in terms of value,
as per a pharmaceuticals sector analysis report.

Annual Report 2015-16
47
The Indian pharma industry stands diversified
into various spheres of activities including
research and development (R&D), manufacturing
of branded, generic and branded generic drugs,
manufacturing APIs, laboratory testing and
clinical research.
Indian pharmaceutical manufacturing facilities
registered with US Food and Drug Administration
(FDA) as on March 2014 was the highest at 523
for any country outside the US. In a study of the
top 20 countries that have filed Drug Master
Files, India stands first with 3,264 DMFs that are
currently active with a contribution of about 36%
of the total of 9,080 active DMF filed as at 2013.
The trend continued through 2014 and 2015.
Indian pharma exports have consistently
improved over the years. India exports over USD
15 billion worth of medicines, of which more than
55% were to regulated markets. The US with 28%
is the India's largest pharma export destination
followed by the European Union. These figures
indicate that Indian medicines have established
themselves as affordable and reliable, across the
world.
India's exports of generics have been growing at
a rate of nearly 22% annually over the past four
years. It is estimated that around 40% of the
generic drugs in the US come from India and with
Obamacare being introduced this figure is set to
rise further. In 2015, the healthy growth
momentum continued.
The drugs and pharmaceuticals sector attracted
cumulative foreign direct investment (FDI)
inflows worth USD 12,813.02 million between
April 2000 and December 2014, according to data
released by the Department of Industrial Policy
and Promotion (DIPP).
The Department of Pharmaceuticals, Ministry of
Chemicals and Fertilizers, Government of India
under the 'Make in India' program declared the
year 2015 as Year of Active Pharmaceutical
Ingredients. Under the 'Make in India' initiative,
it is expected that the government will introduce
several industry-friendly policies and incentives
to give a major thrust to the growth of Indian
bulk actives industry to make it a formidable
force globally.
Several states are encouraging this industry. For
instance, the State of Telangana has proposed to
set up India's largest integrated pharmaceutical
city spread over 11,000 acres near Hyderabad,
complete with effluent treatment plants and a
township for employees, in a bid to attract
investment of `300 billion (USD 4.5 billion) in
phases.
Pharmaceutical exports from India clocked a CAGR
of 10.3% to USD 15.5 billion during 2014-15 from
USD 10.4 billion during 2010-11 with the US
being the largest importer of Indian products. It
is estimated that Hyderabad, which is known as
the bulk drug capital of India, accounts for nearly
a fifth of India's exports of drugs.
Going ahead, as asserted in the 'Pharma Vision
2020', the Government of India aims to make
India a global leader in end-to-end drug
manufacturing epicenter, leveraging on the fact
that cost of production in India is approximately
35% to 40% lower than in the developed
countries. The enormous opportunity can be best
illustrated from the projected human resource
requirement of the Indian pharma sector,
estimated to be about 2.15 million by 2020.
Overall, India's pharmaceuticals industry is likely
to grow at an average annual pace of at least
14%, aided by a rapidly growing domestic market
and emerging export opportunities as patents of
at least a dozen blockbuster drugs in the US
expire in the next three years, according to a
September 2014 report by CARE Ratings.
There are however estimates which suggest more
aggressive growth. As per India Ratings, a Fitch
Group company, the industry is estimated to grow
at 20% compounded annual growth rate (CAGR)
over the next five years.
COMPANY PERSPECTIVE
Normally, generic pharmaceutical companies have
challenges that need to be addressed. The
successful companies drive their growth by
improving their fundamentals in critical areas
such as:
� Backward integration into active
pharmaceutical ingredients;
� Manufacture at their state-of-the-art
facilities;
� Aggressive portfolio build up in niche,
specialty, and differentiated products;
� Investment in compliance and regulatory
standards to provide for patient-safety;
� Rapid geographic expansion into both
developed and emerging markets.
Anecdotally, generic companies have had to
overcome their challenges by achieving
economies of scale, diversifying their product
portfolios, becoming vertically integrated across
the manufacturing process, and expanding their
geographic presence, both into developed and
emerging markets.
Early access to high-quality active pharmaceutical
ingredients that are not infringing patents is
critical to success in regulated finished-dose
markets as a significant part of generics' profits is
made during the early days of their availability.
These are precisely the strengths of Aurobindo.
The Company is one of the largest vertically
integrated pharmaceutical companies in India. In
addition to being the market leader in semi-
synthetic penicillins, the Company has a presence
in key therapeutic segments such as
neurosciences, cardiovasculars,
gastroenterologicals, antibiotics, anti-retrovirals,
anti-diabetics, anti-allergies, among others.
Strengthened by manufacturing facilities
approved by US FDA, UK MHRA, MCC-SA, ANVISA-
Brazil for both APIs & formulations and with a
global presence with own infrastructure, strategic
alliances with almost 50 subsidiaries & joint
ventures, Aurobindo features among the top 5
companies from India in terms of consolidated
revenues. The Company exports to over 150
countries across the globe with more than 87% of
its revenues derived out of international
operations. The customers include premium multi-
national companies.
After creating a name for itself in the
manufacture of bulk actives and ensuring a firm
foundation of cost effective production
capabilities together with a clutch of loyal
customers, the Company has entered the high-
margin specialty generic formulations segment,
with a global marketing network. The business is
systematically organized with an identified
accountability structure and a focused team for
each key international market. Aurobindo's
business strategy includes gaining volumes and

48
market shares in every business/segment it
enters.
In less than a decade, Aurobindo has evolved into
a knowledge driven company manufacturing
active pharmaceutical ingredients and
formulation products. It is R&D focused and has a
multi-product portfolio with several
manufacturing facilities.
Leveraging on its large state-of-the-art
manufacturing infrastructure for APIs and
formulations, wide and diversified basket of
products and confidence of its customers, the
Company aims to sustain its momentum of
growth. Aurobindo's strategic competitive
advantage includes eleven units ensuring captive
source of APIs/intermediates and seven units
manufacturing formulations, designed to meet the
requirements of both advanced as well as
emerging market opportunities. These 18 units in
India are in addition to four units overseas.
Aurobindo makes use of in-house R&D for filing of
patents, Drug Master Files (DMFs), Abbreviated
New Drug Applications (ANDAs) and formulation
dossiers across the world. The Company is among
the largest filers of DMFs and ANDAs globally.
Aurobindo's R&D strengths, across various
molecules including oral and injectables, lie in
developing intellectual property in non-infringing
processes and resolving complex chemistry
challenges. As a result, Aurobindo develops new
drug delivery systems, dosage formulations and
applies new technology for improved processes.
The medium term strategy of the Company is to
continuously globalize and enhance value to
shareholders and customers. In global markets,
the Company continues to retain and enhance
cost-efficient quality leadership in its chosen
segments, such as newer anti-infectives and
lifestyle disease drugs. It is the endeavor of the
Company to achieve this by resolving complex
chemistry challenges, improving process
efficiencies, adopting global scale manufacturing
and using cost-effective market networks
throughout its addressable markets. Aurobindo
aims to repeat its success year after year and
emerge as a major player in the developed
markets.
The long-term growth strategies being put into
action include:
� Developing a broad portfolio of DMFs/ANDAs
through non-infringing processes and with
backward integration across the basket;
� Becoming a significant player in the
generics market, especially in the regulated
markets with differentiated products;
� Managing cost efficiency in a mega-
manufacturing environment approved by US
FDA/European regulatory authorities; and in
the process, enhance the attractiveness of
Aurobindo to alliance partners;
� Resolving complex chemical challenges and
offering advanced drugs to the global
markets;
� Increasing penetration in controlled
substances;
� Globalizing and further penetrating the
markets through joint ventures/
subsidiaries/organic means into Japan,
Brazil and other Latin American countries as
well as into Europe; and,
� Emerging as a leading player in global high-
quality innovative specialty generic
formulations.
In the competitive US market, the focus is on
building customer relationships, expanding
volume and market share on new and existing
products. Marketing efforts have already started
showing results. Aurobindo had been ranked #7
generics supplier as per IMS total prescriptions
dispensed for the 12-months ending March 2016.
In 2014, the Company had acquired certain
products from Actavis in Western Europe to
strengthen its formulations presence in those
premium markets. Aurobindo is now gaining
traction in several west European countries
supported by a robust infrastructure already in
place. The acquired business turned profitable
during the year on the back of increased focus,
product pruning and cost efficiencies.
Aurobindo, with a large portfolio of anti-retroviral
products for HIV/AIDS relief, is in the top five
preferred global suppliers to reputed global
funding agencies such as PEPFAR, USAID,
UNITAID, Global Fund, World Bank and Clinton
Health Access Initiative.
The evolving focus of the Company is on complex
molecules, differentiated technology platforms
and specialty products. The corporate plans are to
ensure growth through organic means and
adopting strategic joint ventures and alliances.
The objective is to maximize the revenues and
margins while risks are minimized.
Aurobindo has tie-ups with a few customers,
giving them a competitive edge through faster
product development and optimized costs. The
strategy is based on co-working and collaborative
alliances and the Company has successfully
established strategic partnerships with global
pharmaceutical majors.
Aurobindo has made significant foray into
neutraceuticals, especially with the acquisition of
Natrol in California, US, which is amongst the top
20 branded neutraceutical companies in the US
with more than 25 years old, well established
brands. This entity brings enormous growth
potential with its portfolio of dietary
supplements, sports nutrition, functional foods,
vitamins, minerals and weight loss products,
diverse customer base of long-term relationships
with key distribution and retail partners and
strong customer partnerships across multiple
distribution channels. Since the US, the world's
largest neutraceuticals market is expected to
grow, there is considerable headroom for
Aurobindo to grow its neutraceuticals product
market.
The forward plans include entering newer
technologies such as peptides, vaccines,
biocatalysts, as well as newer product lines such
as oncology, hormones, steroids, inhalers,
patches and films.
STRENGTHS
A few strengths of the Company are as follows:
� Amongst the deepest portfolio of ANDAs in
global generic companies with a diverse
product basket of 3,100+ formulation filings
& about 2,700 API filings worldwide
including multiple registrations;
� Complete portfolio of products in SSPs,
cephalosporin, ARV, Anti-infectives and
other non-betalactams, sterile and non-
sterile antibiotics;
Annual Report 2015-16
49
� API integration for almost 75% of its
products - a key differentiator in the fiercely
competitive global generic markets;
� One of the leading vertically integrated
pharma companies in India;
� Uncompromised investment in quality
systems & processes, with every employee
sensitized to the need to comply with
regulatory and customer requirements;
� Strict confidentiality and utmost secrecy are
maintained through absolute adherence to
the non-disclosure clause;
� Efficient supply chain management and
optimal utilization of capacities, are ensured
enabling Aurobindo to pass on substantial
cost benefits to its customers;
� Sticking to set deadlines. For instance, the
Company commercialized an API involving a
14-step process with five chiral centers in
just 13 weeks;
� A huge library with syndicated databases is
available and the latest software ensures
quick and efficient literature/patent survey
and retrieval of information;
� Multi-disciplinary project teams interface
with the customers' right from the start to
ensure a seamless integrated approach.
Their responsiveness enables rapid execution
of projects;
� Besides conforming to cGMP and cGLP due
attention is given to safety, health and
environment aspects;
� The Company has harnessed the latest in
communication technology - a dedicated
server for on-line data processing, video
conferencing, tele-conferencing, etc. to
ensure constant communication throughout
the life of the project;
� A right mix of instrumentation and
production expertise with due emphasis on
profiling, characterization of compounds and
reduction in impurities, chiral resolution and
impurity profiling ensure the highest quality
of deliverables and yield optimization;
� The manufacturing infrastructure, the
knowledge base at the research centers and
the ability to deal successfully with its
process chemistry strengths are the forte of
Aurobindo.
All the strengths have been tested from the
perspective plan to manufacturing plant and later
in the market place. There is a powerful
marketing infrastructure backed up by state-of-
the-art manufacturing systems that are driving
the business.
THREATS AND CHALLENGES
The pharmaceutical industry is highly competitive
and the challenges are from both the Indian
manufacturers who have similar production
facilities as well as those abroad. Human
resources with similar skills, talents and
experiences in the industry are mobile between
competing companies.
Price pressures in US markets are expected to
stay. Going forward, there is a risk of inability to
maintain current margins on its products. Price
sensitivities get tested in a crowded market
where price tends to sag while volume business
gets done.
Competing pharmaceutical companies have
several similar bio-equivalent products in the
same market manufactured at facilities that have
been approved by the highest regulatory
authorities. All of them stay focused on the same
markets resulting in price elasticity being tested
and margins eroding.
Yet, it must be appreciated that Indian
manufacturers in general, and Aurobindo in
particular, have made an impact on the global
stage and have worked hard to get shelf space.
This threat does not affect Aurobindo, because of
its control over raw material sourcing. The
Company is a dominant player in the active
ingredients business and has been able to control
its quality, improve on timelines, be competitive
on its costs and has the ability to deliver at short
notice. This is a unique advantage that Aurobindo
enjoys over manufacturers across the world.
The Company has been timing its launches to
take advantage of products going off-patent and
the opportunities available in a first-mover
market. This strategy is built around the in-house
R&D capabilities, technology strength in
manufacturing facilities and the marketing
infrastructure. Aurobindo has worked on its
speed-to-market abilities and is quick to convert
product approvals into invoices.
The scientists and professionals of Aurobindo
have been trained to create opportunities,
replicate the successes and drive business
growth. The Company has unmatched strengths
such as experienced staff with ability to
anticipate market needs, plan for product
launches with supportive documentation, create
products that meet regulatory norms and execute
plans within tight cost and time budgets, to cope
with the challenges of the market.
INTERNAL FINANCIAL CONTROLS
The internal financial controls (IFC) framework at
Aurobindo encompasses internal controls over
financial reporting (ICOFR) as well as operational
controls that have been put in place across all
key business processes of the Company. The
internal controls are designed to facilitate and
support the achievement of the Company's
business objectives and such controls do enable
the Company to adapt to changing and operating
environment, to mitigate risks to acceptable
levels and to support sound decision making and
good governance.
Details in respect of adequacy of internal
financial controls with reference to the financial
statements are briefly iterated below:
a. The Company maintains all its major records in
ERP System (Oracle Financials) and the work
flow and approvals are routed accordingly;
b. The Company has appointed internal
auditors to examine the internal controls,
whether the workflow of the organization is
being done through the approved policies of
the Company. In every quarter, during the
approval of financial statements, internal
auditors present the internal audit report
and the management comments on the
internal audit observations; and
c. The Board of Directors of the Company has
adopted various SOPs and policies such as
related party transactions policy, whistle
blower policy, policy to determine material
subsidiaries and such other procedures for
ensuring the orderly and efficient conduct of
its business for safeguarding of its assets,
the prevention and detection of frauds and
errors, the accuracy and completeness of the
accounting records, and the timely
preparation of reliable financial information.

50
HUMAN RESOURCES
Aurobindo is a professionally managed company
with highly competent and committed industry
professionals forming a tight-knit team of
dedicated colleagues. The corporate promise,
'Committed to healthier life' reiterates that the
team is focused on performing and delivering on
patient-safety.
The knowledge, expertise and skills of the
Aurobindo team form a strong foundation of the
Company's progress, and hence considerable
strategic emphasis is laid at people development
and leadership. The overall target is to enhance
business growth by enabling engagement and
performance. This is achieved by having the right
people supported by participative leadership
working together towards organizational goals.
APL Corporate Values forms the foundation for
this development.
Aurobindo Pharma has a team of over 15,000
professionals from 30 countries working at its
various divisions - API manufacturing,
formulation manufacturing, chemical R&D,
formulation R&D and overseas operations. About
80% of these employees are graduates, post
graduates and PhDs.
As part of its investment in learning and
development, the Company has recrafted its
human resource philosophy. In brief, they are
iterated below:
� Attract, build and retain right talent at all
levels;
� Create and nurture a performance culture
through continuous capability building,
performance measurement and leveraging of
IT;
� Foster leadership at all levels through trust,
empowerment and openness;
� Strengthen collaborative approach for
business excellence; and,
� Promote a vibrant work culture based on
innovation and to incentivize people based
on productivity/outstanding performance.
The emphasis has been on the five critical
dimensions of people management:
� Establishment of vibrant organizational
culture;
� Talent attraction and retention;
� Continuous capability building;
� Recognition of outstanding performance of
the team/individuals; and,
� Staff welfare.
Another initiative is 'Quality Mission' which aims
to create and augment the quality culture across
the organization to assess our staff and
executives in quality standards compliance and
their commitment to quality. Quality Mission
program is executed through Quality Marshals.
Quality Marshals are identified through a very
structured process of certification who in turn
cascade the learning to the shop floor level to
impact the quality and compliance levels.
Industrial relations continue to be cordial and
harmonious. The management has initiated
various measures such as formation of bipartite
forums and joint management councils to
promptly redress staff grievances and to improve
welfare amenities in the plants.
The Company cares for its employee and
contractor safety as well as environment
protection. In its approach to business,
Aurobindo integrates a robust and sustainable
safety system that aims for zero incidents. The
objective is to guarantee a high degree of safety
in the workplace.
Aurobindo works in harmony with environmental
and social responsibilities. Continuous efforts are
made to optimize use of resources, minimize
waste, reuse and recycle materials and reduce the
eco-footprint, to create more value with less
environmental impact.
CORPORATE SOCIAL RESPONSIBILITY
Aurobindo's CSR charter covers the following
areas of activities:
� Education
� Health
� Sanitation
� Road and Public Safety
� Rural sports, environmental sustainability,
rural development and animal welfare
As part of societal commitment, Aurobindo
provides support to the neighborhood with
educational aids for school children, construction
of toilets and provision of safe drinking water.
The focus is to promote education, encourage
good health, provide drinking water and support
sanitation.
OUTLOOK
The Company is well-equipped to build further on
the success despite a challenging competitive
environment. There is a robust business model,
diversified product basket, a strong customer
base, business relationships built over a long
time and a global presence in key markets. The
backbone of the Company is the interplay
between a very large basket of products and
several regulatory compliant mega manufacturing
capacities. Aurobindo puts considerable emphasis
on product and process quality and hence relies
on best management practices with specific focus
on compliance standards. Aurobindo will be
synonymous with patient focus, in-depth
expertise on quality and reliability on all it does.
In addition to the existing large basket of
products in its portfolio, Aurobindo is working on
new businesses viz. oncology, hormones, steroids,
enzymes and peptides as well as differentiated
technology initiatives viz. depot injections,
dermatology, inhalers, nasal, patches and films to
sustain growth.
A sharper strategic focus and inherent execution
capabilities will keep Aurobindo firmly on a
sustainable and profitable growth path. The team
has built an excellent platform to make the
Company a significant player in all the
therapeutic areas, product ranges and markets it
has entered.
By combing a variety of internal process
improvements, value enhancing marketing efforts
and improved product mix with a greater focus on
high value specialty molecules, the team is
confident of delivering encouraging performance
results.
Marketing efforts are focused on ramping up
revenues across all the geographies. The Company
will build on its customer touch points and
relationships to reach higher volume of niche and
differentiated products.
As in the earlier years, there have been several
new launches in 2015-16 and it is expected that
there will be a further thrust to improve the

Annual Report 2015-16
51
presence in both US and Europe. The market share
of the injectable side of the business in US is
expected to grow with increased supplies from
both US and India. In Europe, the focus is on
getting better cost efficiencies to improve the
margins. API volumes are being further increased
to cater to the opportunities for in-house
formulations. External volume sales of API will
address the needs of high value products. Overall,
the emphasis will be both on the revenues as well
as the bottom line.
Manufacturing costs will continue to remain a
focus area. Aurobindo has a good foundation of
reliable sourcing and cost effective manufacturing
systems and is exploring further ways of reducing
costs and strengthening competitiveness.
The Company has an enviable product basket with
a large portfolio of regulatory approvals. Capacity
utilization is improving at all production units
and with a view to launch large number of
products as well as step up on existing product
volumes, new manufacturing facilities are under
construction. The Company will capitalize on its
inherent strengths, some of which are iterated
below:
� Cost effective vertically integrated
manufacturing systems;
� Current Good Manufacturing Practices
(cGMP) and regulatory compliant facilities
producing high-quality APIs and finished
dosage formulations;
� Best-in class, best-in cost large
manufacturing capacity;
� High visibility in API and generics;
� Strong financial position with ability to
scale up;
� Highly skilled professionals with regulatory
expertise and competence to deliver on
development, product processes and
regulatory standards;
� Access to new technologies.
Aurobindo has set a vision to build businesses
that impact their respective addressable markets,
are respected for customer centric products and
services, meet industry benchmarks in
productivity of resources, are recognized for
quality and compliance standards and in the
ultimate analysis, create societal wealth for all
stakeholders.
In financial terms, the objective is to strive for
higher predictable and calibrated growth, and
improve EBITDA margin and Return on
Investment. The target is to stay cash flow
positive, lower the leverage, reduce interest
outgo and expand earnings year-on-year.

52
OVERVIEW
Enterprise Risk Management (ERM) Process at
Aurobindo encompasses practices relating to
identification, assessment, evaluation, mitigation
and monitoring of strategic, operational,
compliance, financial and IT risks for achieving
business objectives. Aurobindo's ERM practices
are based on COSO-ERM framework.
The ERM is designed to minimizean adverse
impact of these risks and it enables the Company
to leverage market opportunities effectively and
enhances its competitive advantage and
sustainability on a medium and long-term and
creates value for its stakeholders.The focus of risk
management is to assess risks regularly and take
mitigation measures; which is done through
periodic review meetings of risk management
committee of the Board.
Aurobindo has aligned risk management process
with every part of the critical business processes
to ensure that the processes are designed &
operated effectively towards the achievement of
business objectives. Risks are identified &
assessed across all key business functions in a
holistic manner rather than in silos.
RISK CATEGORIES
The following broad categories of risks to the
business objectives have been considered in the
risk management framework:
� Strategic risks: Risks emerging out of the
choices Aurobindo makes on markets,
product& process development, resources,
business growth & revenue model,
acquisitions, investment model, business
sustainability which can impact the
Company's competitive advantage in
medium and long term.
� Operational risks: Inherent risks to
business operations such as production
Management of Risks
capacities, quality assurance, customer
demands, material availability, human
safety and skilled manpower. Operational
risks are assessed primarily in terms of
process design and its effectiveness.
� Compliance risks: Risks arising due to
adverse developments in regulatory
environment and statutory provisions that
potentially impact the Company's business
objectives and may lead to loss of business.
� Financial & reporting risks: Identifying
risks in business unit plans to achieve their
financial performance targets of revenue
and profit goals and also the Company as a
whole. These risks could have potential
impact on the Company's financial
statements and transmission of timely and
accurate financial information to
stakeholders.
� Information technology (IT) risks: These
risks could have potential impact on
information assets and processing systems.
RISK GOVERNANCE STRUCTURE
The risk management framework operates at
various levels across the Company. The key roles
and responsibilities for risk management process
are as given below:
� Board: Ultimately responsible for ensuring
that appropriate risk management system is
in place;
� Audit Committee: Responsible for
evaluation of risk management system;
� Risk Management Committee (RMC):
Assist the Audit Committee in fulfilling its
oversight responsibilities with respect to
risk management. The RMC reviews risk
management practices and actions
implemented by risk owners regarding risk
mitigation and monitoring;
� Risk Officer (RO): Facilitates and
coordinates the execution of risk
management practices with respect to risk
identification, impact assessment
mitigation and monitoring. The RO submits
periodic risk reports to RMC for its review
and closely interacts with risk owners and
internal audit teams for risk identification,
mitigation and monitoring;
� Functional & Unit Heads: Assume the role
of risk owners entrusted with the
responsibility for identification and
monitoring of risks which are discussed and
deliberated at various review meetings and
actions are drawn for effective business
performance.
RISK IDENTIFICATION & ASSESSMENT
PROCEDURE
The risk assessment at Aurobindo is aimed at
evaluating and prioritizing risks so that risk
levels are managed within defined tolerance
thresholds and also to maximize response and
recovery efforts. The risk assessment is done in
the following manner.
� Assessing impact of risks to business;
� Assessing probability of risks occurring;
� Determining risk rating based on
probability and impact of risk by using a
scale of 1 to 5, with 1 being the lowest
probability/severity and 5 the highest. The
higher the multiple of these two quotients,
the higher the ranking of the risk;
� Considering the effectiveness of existing
controls that address the risk and
evaluating which risks need treatment and
the priority. Internal audits and periodic
assessment of various business processes
also help in risk identification of both
operational and enterprise wide risks.

Annual Report 2015-16
53
Aurobindo adopts bottom-up approach for the
identification of potential risks for each function
and the techniques are structured interviews,
face-to-face meetings, brain storming sessions,
risk questionnaires etc. Risk registers are updated
with existing and emerging risks.
Risk analysis and evaluation is carried out using
scenario-based assessments to determine the
potential impact and likelihood of risk
occurrence. Identified risks along with impact are
compared with established thresholds to
determine the priority and method of risk
mitigation.
RISK MITIGATION & MONITORING PROCEDURE
The Company adopts a meaningful risk mitigation
strategies tailored to each identified risk. Risk
mitigation procedures involve undertaking the
appropriate actions by the business heads/
process owners who are accountable to mitigate
risks in a time bound manner.
The Company identifies & evaluates several risk
factors and draws out appropriate mitigation
actions which are time-bound. Risk owners are
identified and progress of mitigation actions are
monitored and reviewed periodically. The risk
management committee does periodically review
scope adequacy and effectiveness of mitigation
actions and provide necessary direction to
mitigation teams.
RISK REPORTING AND DISCLOSURE PROCEDURE
Risk dashboards are submitted to risk
management committee on a periodic basis. The
risk dashboards help in tracking each identified
risk and its impact to business. The assessment of
top risks, analysis of exposure and potential
impact are carried out periodically, presented and
discussed with risk management committee. Risks
relating to capital project execution reported and
discussed at appropriate level within the
Company. Periodic updates are provided to the
Board highlighting key risks, their impact and
mitigation measures.
INTERNAL FINANCIAL CONTROLS (IFC)
HIGHLIGHTS FOR THE YEAR
For the financial year 2015-16, the Company has
developed and implemented a robust internal
financial controls framework which encompasses
the following:
� Identification of significant accounts and
related processes;
� Process walkthroughs for scoped-in processes;
� Identification of key risks affecting the
process;
� Evaluation of controls at sub-process level;
� Mitigation of any controls gaps; and
� Documenting controls in 'Risk Control
Matrix' (RCM).
The design & operating effectiveness of scoped-in
business processes and related controls were
assessed, tested and documented in 'Risk Control
matrix'. The controls testing was carried out by
an independent outside internal auditors in
respect of entity level controls, manual controls,
IT application controls, IT dependent controls for
its operating effectiveness.
BUSINESS RISKS AT AUROBINDO
Some of the key existing and emerging risks
affecting Aurobindo's business are listed below:
Economic & geopolitical risks
Economic and political instability resulting from
changes in foreign policies &political leadership in
countries such as USA, Europe and emerging
markets (EM), where Aurobindo has business
presence could adversely affect the Company's
operations and revenues.
Aurobindo has its business operations
predominately in USA, Europe and the emerging
markets with a balanced product basket that
contains several therapeutic segments. The
revenue breakup of the Company for financial
year 2015-16 is as given below:
� International sales constitute about 87% of
the Company's total revenue with the rest
13% being domestic sales;
� Formulations business contributes 79.5% to
the Company's total revenue and the rest
20.5% comes from active pharmaceutical
ingredients;
� About 55% of the formulations sales come
from the US, another 28% from Europe and
the balance 17% is from anti-retroviral
business segment and emerging markets.
Continuous efforts are being made to strengthen
business presence in other potential markets such
as Japan, Brazil, South Africa, Canada, Australia,
North and West Africa and Middle East. Initiatives
are being taken to strengthen the presence in
Western Europe, while newer markets are being
added in countries such as Poland and Czech
Republic. Such well-designed moves would also
help consolidate Aurobindo's volumes and
revenues over the long-term, thereby spreading
the risk portfolio.
As a de-risking strategy, the Company is focusing
on territory expansions, partnerships,
globalization & further penetration through joint
ventures and subsidiaries in potential markets.
The Company is developing a broad portfolio of
products through non-infringing processes to
become a significant player in the generics arena.
Competition risks
Aurobindo's products face intense competition
from other pharmaceutical companies in India and
abroad where multiple players are present, and
introduction of new products by competitors may
impair the Company's competitive advantage and
lead to erosion of revenues.
Aurobindo with its unique capabilities has been
able to face competition from its peers. The
competition risks would not significantly impact
the Company's business owing to its integrated
manufacturing process and operational
efficiencies all of which are designed to launch
new products in the market on time and at
competitive prices.
For most of its generic formulations, the Company
has captive manufacture of around 75% of active
ingredients to ensure timely material availability
and effective cost control to focus on improving
profit margins. New products continue to get
launched by experienced and talented R&D teams
which work to deliver on the marketing strategy
by developing new processes/products to meet
customer needs and build market share.
Instability in any one economy will not have a
major influence on the Company. Overall, the
healthcare industry is not price elastic and is
hence, reasonably insulated from recession.
Regulatory, statutory & legal compliance risks
The pharmaceutical industry is constantly being
challenged by critical compliance risks viz. to
comply with rigorous regulatory & legal
requirements and compliance is evolving from an
isolated departmental initiativeto an enterprise
level risk management challenge. This could render
Aurobindo's technology and products non-
competitive or restrict the Company's ability to
introduce new products thereby adversely
impacting business.
54
Aurobindo has a talent pool of over 1,100
scientists, who have adequate experience in
handling complex chemistry and filing
applications with the regulatory authorities, all of
whom have helped Aurobindo receive a total of
251 ANDA approvals (215 final approvals
including 10 for Aurolife Pharma LLC, and 36
tentative approvals) from US FDA as at March 31,
2016. Cumulative filings total 398 ANDAs.
Similarly, as on March 31, 2016, the team has
filed over 2,700 DMFs including 202 with US FDA.
So far, 158 patent applications are pending with
various authorities and 18 have been granted
patents.
Aurobindo is committed to supplying highest
quality medicines to customers for promoting
healthier lives. Hence, the Company always
strives to conform to regulatory and compliance
standards to meet stringent requirements of
customers to ensure the medicines provide health
care and wellness for the consumers. Robust
quality systems and control measures have been
implemented to ensure that the quality is ensured
by process design.
During the financial year 2015-16, the Company
has taken an initiative to devise and implement a
'Statutory & Legal Compliance' framework
(compliance solution - vision 360) for ensuring
compliance with all applicable laws and that
system is adequate and operating effectively.
The compliance system is designed to meet the
compliance monitoring goal of the Company.
The framework is expected to roll out within the
defined timeframe.
Every effort is being made to ensure that there is
no compromise on quality of products and
processes. Continuous monitoring is being done
by QC/QA team to deliver highest quality
products.
Aurobindo's commitment to Employee Health
and Safety: The Company's Board and Executive
management have a strong commitment towards
creating and providing a safe working
environment for all its employees and other
stakeholders. Aurobindo has a full-fledged EHS
(Environmental, Health, and Safety) team which
is continuously addressing the issues of
environmental safeguards by conducting
periodical safety audits and training programs.
Pricing risks
Some of Aurobindo's products are subject to price
controls or other pressures on pricing. The price
controls limit the financial benefits of growth in
the life sciences market and the introduction of
new products.
Due to perfect competition in generic drug
industry, prices are a function of supply and
demand. Prices change in response to supplies
and competitive pressures. Domestic pricing is
also influenced by global trends in both
availability and price of imported
activeingredients.
Aurobindo is able to cope with pricing pressures
and focus on quality assurance to minimize the
possibilities of commoditization. Also, Aurobindo
has a well-diversified product basket in US which
helps in mitigating the pricing pressure. The in-
house R&D is striving to develop cost effective
products by redefining the production process/
facility. Also, the Company focuses on quality
assurance through improved throughput and is
moving up the value chain by offering
differentiated and special products and
technology platforms.
Patent protection risks
Aurobindo's success depends on the Company's
ability to obtain patents, protect trade secrets and
other proprietary information and operate without
infringing on the intellectual property rights of
other pharmaceutical companies. Aurobindo's
inability to obtain timely ANDA approval, thus
missing out on early launch opportunities and
litigation outcomes could affect product launch
date.
Aurobindo has a dedicated team of scientists
whose primary task is to ensure that the products
are manufactured using only non-infringing
processes and related compliances by reviewing
and monitoring IPR issues continuously.
Also, the IPR team evaluates and provides stage-
wise IP clearances during product/process
developmental activities and also provides
frequent updates and alerts on relevant IP
(patent, trademark etc.) to R&D scientists for the
products and suggests remedial measures to deal
with IP related issues. The IP team is also
involved in product selection activity to ensure
that right products are selected for development
and no potential opportunity is missed out.
As of March 31, 2016 the Company has 158
patent applications pending with various
authorities. Aurobindo takes adequate care to
respect trade secrets, know-how and other
proprietary information and ensure that the
employees, vendors and suppliers sign
confidentiality agreements.
Market risks
Aurobindo is significantly dependent on US market
for its business. Failure to develop profitable
operations in that market could adversely affect
the Company's business, operations and financial
condition. This scenario poses the risk of
concentration and dependence on one market.
In order to reduce the concentration risk, the
Company has been spreading its business
(Formulations and API) into European, Japanese
and emerging markets. Aurobindo with its
effective marketing strategy is also increasing
sales volumes for both the businesses in existing
markets and is making regular efforts to widen
geographical spread by entering into large
potential markets in Latin America and emerging
markets. The Company has the right balance
between high margin-low volume products and
low margin-high volume products. The product
base has been streamlined to have a right
balance between various product groups.
The Company has been continuously expanding
end-to-end manufacturing capacities and regular
monitoring of on-going capital projects for their
timely completion. This is to ensure the
availability of capacities. Production planning
team at Aurobindo monitors and utilizes
production capacities at optimum levels with the
support of an effective marketing strategy along
with proper co-ordination and discussion with
production heads and supply chain head.
Financial risks
Downward movements in credit rating: Failure to
maintain appropriate credit ratings could affect
the Company's cost of borrowings thereby having
adverse impact on profitability.
The Company has good and standard history of
servicing various borrowings. The Company is
having a dedicated treasury team to review

Annual Report 2015-16
55
regularly the customer collections and import
payments and necessary actions are taken
wherever necessary. Also, the treasury team
continuously monitors day-to-day fund
requirements and manages the banking relations
effectively.
Foreign Currency fluctuation risks: Aurobindo
has high financial obligations towards import
payments and ECB repayments. In an era of
depreciating rupee against USD, huge borrowings
and imports will lead to high exposure of currency
risks. This could have an impact on the Company's
financial position.
Aurobindo is predominately an export oriented
company. Over 87% of the Company's revenue is
from international markets. At the same time, the
Company is having sizable imports/working
capital in foreign currency and long-term ECB to
fund the export oriented projects. As such, the
Company's growing exports and its proceeds
provide natural hedge to the imports and working
capital in foreign exchange fluctuations.
The Company is conscious of impact on earnings
in the event of currency fluctuations. The forex
position is reviewed on a monthly basis by the
borrowing committee and quarterly by the Board
of Directors/Audit Committee. Based on the
decision of the borrowing committee, the
treasury team would ensure the execution of
transactions for forward cover.
People risks
Aurobindo's success depends largely upon an
effective HR strategy that includes recruitment,
learning & development, succession planning and
retention of competent personnel. The HR strategy
is aligned to overall business plan and growth of
the Company. It is a challenge for Aurobindo in
complying with all applicablestatutes and
maintaining good industrial & employee relations.
Labour unrest could have an adverse impact on the
Company's operations. The industry is human
capital intensive with a high rate of attrition and
this could have an impact on the Company's
operations.
The HR team at Aurobindo has identified and
developed people with potential to fill key
business leadership positions. In addition, the
Company is also recruiting and building a team of
achievers with proper leadership training.
Aurobindo has been fine tuning its HR strategy in
order to meet business requirement and future
growth. Second-in-command in each key function
and decentralised management style has
developed a much stronger organization culture.
There is a proactive approach to HR management,
and at Aurobindo, employees are given
responsibility with authority. Emphasis is on
accountability with clear job descriptions and the
employees are encouraged to raise the bar and
perform to their potential. The professional
approach in day-to-day management has enabled
the employees to stay motivated. Continuous and
consistent structured interactions and
communications help the personnel update and
upgrade their knowledge and skills and help
minimize the operational risks.
During the financial year 2015-16, the Company
has taken an initiative to devise and implement a
'Statutory & Legal Compliance' framework
(compliance solution - vision 360) for ensuring
compliance with all applicable labour &
administrative laws and for its effective
monitoring. Also, for financial year 2015-16, the
HR team has developed and implemented
effectively an on-line employee appraisal system
in formulations division to make the appraisal
process more robust and to measure work
performance as compared to job expectations.
They strive to ensure that annual performance
assessments are conducted effectively with
necessary feedback and counselling.
The employee attrition in the Company is lower
than the industry average. Industrial relations
(IR) team is making continuous efforts to
maintain a cordial relationship with employees
with a view to achieve optimal performance.
Raw-material import risks
Aurobindo's dependency on China market for
import of raw-material is high and this may lead
to risk of import disruptions, short supplies and
production bottlenecks due to unforeseen changes
in government regulations & economic policies of
China.
While the Company's dependence is substantial
on China for raw material, efforts are being made
to create newer second sources of supplies.
Continuous tracking is done by the procurement
department in coordination with production
planning & inventory control (PPIC) teams on the
market trends & dynamics for keeping optimum
levels of inventories to meet the production
requirement.
Information technology (IT) risks
Achievement of business objectives for Aurobindo
depends on the existence of a robust IT strategy
that includes adequate IT infrastructure, data
confidentiality, integrity and availability at all
times. Occurrence of any unforeseen threats to IT
systems could have adverse impact on data
availability and continuity of operations in the
Company.
Aurobindo's business presence is spread across
the globe with manufacturing facilities and
selling and distribution network. Business
transactions are supported by ERP systems with
strong security and password controls at system
and application levels. During the financial year
2015-16, the Company has taken an initiative to
formulate 'IT Governance Committee' with the
objective of ensuring the following:
� Strategic alignment and innovation
between IT and business with respect to
services;
� Adequate infrastructure in place to enable
appropriate service delivery;
� Effective IT risk management;
� Robust information security polices &
procedures in a networked environment;
� Value delivery by IT to the business;
� Clarity and consistent communication of IT
activities to Board/Audit committee;
� Adoption of best IT governance practices
including process automation.
The Committee would meet on a periodical basis
to review the existing IT governance matters in
the Company and report on its activities, and
summarize any recommendations at each meeting
and refer the same to Board/Audit Committee for
its consideration.
The IT team at Aurobindo conducts periodic
review and evaluation of IT process and in case of
any process gaps and concerns, appropriate
corrective measures are taken continuously.

56
OVERVIEW
Aurobindo Pharma believes in doing business in a responsible manner. The Business Responsibility Report is aligned with the National Voluntary Guidelines on
Social, Environmental and Economic Responsibilities of Business (NVGs) released by the Ministry of Corporate Affairs and is in compliance with Regulation
34(2)(f) of the Securities and Exchange Board of India (Listing Obligations and Disclosure Requirements) Regulations, 2015. All the facts and figures reported
in the Business Responsibility Report pertains to the parent company i.e. Aurobindo Pharma Limited.
SECTION A: GENERAL INFORMATION ABOUT THE COMPANY
1. Corporate Identity Number (CIN) of the Company L24239TG1986PLC015190
2. Name of the Company Aurobindo Pharma Limited
3. Company Address Registered Office: Plot No. 2, Maitri Vihar, Ameerpet, Hyderabad - 500038, Telangana, India
Corporate Office: Water Mark Building, Plot No. 11, Survey No. 9, Kondapur, Hitech City,
Hyderabad - 500084, Telangana, India
4. Website www.aurobindo.com
5. E-mail ID [email protected]
6. Financial year reported April 1, 2015 to March 31, 2016
7. Sector(s) that the Company is engaged in S.No. NIC code of product/service Description(industrial activity code-wise) 1. 21001/21002 Manufacturing generic pharmaceuticals and
active pharmaceutical ingredients
8. List three key products/services that the Company The Company's robust product portfolio is spread over seven major therapeutic/product
manufactures/provides (as in balance sheet) areas encompassing antibiotics, anti-retrovirals, cardiovascular, central nervous system,
gastroenterologicals, anti-allergies and anti-diabetics, supported by an outstanding R&D
set-up.
9. Total number of locations where business activity is The Company along with its subsidiaries has marketing and sales offices in over 25
undertaken by the Company countries and markets its products globally in over 150 countries.
a. Number of international locations
The subsidiaries of the Company have manufacturing facilities in New Jersey and
California in U.S.A. and in Brazil apart from the offices in several European, African
and Asian countries.
b. Number of national locations
The parent company has 13 manufacturing units and 2 R&D centers. In addition,
there are 3 manufacturing units under construction. Further, the subsidiaries of the
parent company have 5 manufacturing units and 1 unit is under construction.
10. Markets served by the Company - Local/state/ The Company, in addition to marketing its products domestically, also markets its
national/international products globally in over 150 countries. Around 87% of the sales are generated from
international markets.
Business Responsibility Report

Annual Report 2015-16
57
SECTION B: FINANCIAL DETAILS OF THE COMPANY
1. Paid up capital `585.2 million
2. Total turnover Gross turnover of `93,227.6 million on standalone basis
3. Total profit after taxes `16,196.7 million on standalone basis
4. Total spending on Corporate Social Responsibility (CSR) CSR spend during the financial year 2015-16 was `187.6 million
as percentage of profit after tax (%): (1.2% of standalone profit after tax)
5. List of activities in which expenditure in 4 above � Educationhas been incurred
� Health
� Sanitation
� Road and public safety
� Rural sports promotion, environmental sustainability,
rural development and animal welfare
SECTION C: OTHER DETAILS
1. Does the Company have any subsidiary company/ Yes. Aurobindo has 46 subsidiary companies located in India and other countries
companies? as on March 31, 2016.
2. Do the subsidiary company/companies participate The parent company undertakes majority of the BR initiatives.
in the BR initiatives of the parent company? If yes,
then indicate the number of such subsidiary company(s)
3. Do any other entity/entities (e.g. suppliers, distributors etc.) Entities like suppliers, distributors did not participate in the Company
that the Company does business with, participate in the BR initiative in the reporting period.
BR initiatives of the Company? If yes, then indicate the
percentage of such entity/entities?
SECTION D: BR INFORMATION
1. Details of Director responsible for BR a. Details of the Director responsible for implementation of the BR policies:
Particulars Details
DIN Number 00050482
Name Mr. N. Govindarajan
Designation Managing Director
Telephone number +91 40 6672 5266
E-mail ID [email protected]
b. Details of the BR head: Same as above

58
2. Principles of BR policies as per National Voluntary Guidelines
Details of compliance
S. Questions
No.
1. Do you have policies for
2. Has the policy being formulated in
consultation with the relevant
stakeholders?
3. Does the policy conform to any
national/ international standards?
If yes, specify?
4. Has the policy being approved by the
Board?
Is yes, has it been signed by MD/
owner/CEO/appropriate Board
Director?
5. Does the Company have a specified
committee of the Board/Director/
official to oversee the
implementation of the policy?
6. Indicate the link for the policy to be
viewed on-line?
7. Has the policy been formally
communicated to all relevant internal
and external stakeholders?
8. Does the Company have in-house
structure to implement the policies?
9. Does the Company have a grievance
redressal mechanism related to the
policies to address stakeholders'
grievances related to the policies?
10. Has the Company carried out
independent audit/evaluation of the
working of this policy by an internal
or external agency?
Ethics
Y
Y
Y
Y
BeingFormulated
**
Y
Y
BeingFormulated
N
Prod
uct
Life
Cyc
leSu
stai
nabi
lity
Empl
oyee
sw
ell-
bein
g
Stak
ehol
der
Enga
gem
ent
Hum
an R
ight
s
Envi
ronm
ent
Polic
y Ad
voca
cy
Com
mun
ity
Deve
lopm
ent
(CSR
)
Cust
omer
Val
ue
The
Company
continuously
focuses on
the optimal
utilization
of resources
from its
product
design to
disposal.
Y
Y
Y
Y
Y
Y
Y
Y
Y
Y
Y
Y
Y
Y
Y
Y
Y
Y
Y
Y
Y
Y
Y
Y
Y
Y
Y*
Y
Y
**
Y
Y
Y
NA
Y
Y
Y*
Y
Y
**
Y
Y
The Company
in its
operations
ensures
customer
value.
Employees self service in
IHRMS
Being FormulatedSystemsin place
The CSRassessmentis done
internally.
The Company abides by the law of land and the policies are framed considering the national standards.
*Policy is in line with ISO 14001 international standards.
The policies are available at the following link: **http://www.aurobimdo.com/about-us/corporate-governance.
3. Governance related to BR a. Indicate the frequency with which the Board of Directors, Committee of the Board
or CEO assess the BR performance of the Company.
Reviewed annually.
b. Does the Company publish a BR or a Sustainability Report? What is the hyperlink for
viewing this report? How frequently it is published?
This is the first Business Responsibility Report of the Company and is a part of
the Annual Report for financial year 2015-16.
P1 P2 P3 P4 P5 P6 P7 P8 P9
Annual Report 2015-16
59
SECTION EPRINCIPLE-WISE PERFORMANCEPrinciple 1 - Ethics
1. Does the policy relating to ethics,bribery and corruption cover only theCompany? Yes/No. Does it extend to thegroup/joint ventures/suppliers/contractors/NGOs/others?
The Company is committed to building astrong ethical organization. As a result, theCompany has adopted a Code of Conductpolicy which is applicable to allsupervisory, executive and managerialemployees of the Company including theboard members. The policy lays emphasison the honesty, integrity and ethicalconduct of the employees and has beencommunicated to the employees, across allthe locations.
2. How many stakeholder complaints havebeen received in the past financial yearand what percentage was satisfactorilyresolved by the management?
We did not receive any significantstakeholder complaints during the financialyear.
Principle 2 - Product Life Cycle Sustainability
1. List up to 3 of your products or serviceswhose design has incorporated social orenvironmental concerns, risks and/oropportunities.
Our following products help address socialor environmental concerns in their design
a. Tenofovir Disoproxyl Fumarate
b. Levetiracetam
c. Carvedilol
2. For each such product, provide thefollowing details in respect of resourceuse (energy, water, raw material etc.) perunit of product (optional).
Product wise details are mentioned asfollows:
a. Tenofovir Disoproxyl Fumarate:Tenofovir disoproxyl is anantiretroviral medication used toprevent and treat HIV/AIDS and totreat chronic hepatitis. The drug is onthe World Health Organization's Listof Essential Medicines, the mostimportant medications needed in abasic health system.
Significant improvements have beendone in manufacturing this API, by
reducing the waste of raw materialsand solvents by almost 30% and 50%,respectively. This was achieved byimproving the output and reducing &recycling the solvents and reagents inthe process.
b. Levetiracetam: Levetiracetam hasbeen approved as add-on treatmentfor partial (focal) myoclonic andtonic-clonic seizures. It has potentialbenefits for other psychiatric andneurologic conditions such asTourette syndrome, anxiety disorderand Alzheimer's disease. However, itsmost serious adverse effects arebehavioral, and its benefit-risk ratioin these conditions is not wellunderstood.
Process was developed to reduce thewaste by improving the output. Powerand fuel cost reduction was achievedby improving the scale of operations.
c. Carvedilol: Carvedilol is a betablocker used in the treatment of mildto severe congestive heart failure(CHF), left ventricular dysfunction(LVD) following heart attack inpeople who are otherwise stable andhigh blood pressure. Carvedilol isindicated in the management of CHF.
More than 50% reduction in wastageis by improving the yields, recyclingthe solvents and substituting withalternative reagents.
Overall, the organic waste generated fromour process is further recycled in cementkilns as a fuel. A chemical synthetic processwas converted to enzymatic route, for amajor antibiotic API. This change hadreduced the waste by more than 30% andalso reduced the chemical hazardous waste(solid and liquid). This reduced the load onthe effluent treatment facility and theenvironment.
3. Does the Company have procedures inplace for sustainable sourcing (includingtransportation)?
The Company has laid down a standardoperating procedure for the selection of itsvendors and approving the same forsourcing of material. There is a system inplace for evaluating the EHS resources andcompliance of key suppliers and vendors forkey raw material intermediates and API
sourcing.
4. Has the Company taken any steps toprocure goods and services from local &small producers, including communitiessurrounding their place of work?
The Company follows a strict sourcing codeof conduct with respect to the complianceand quality. The Company procures goodsand services from local vendors in thevicinity of the manufacturing locations whofulfill the above key criteria of complianceand quality.
5. Does the Company have a mechanism torecycle products and waste? If yes, whatis the percentage of recycling of productsand waste? Also, provide details thereof,in about 50 words or so.
Yes. The Company has a mechanism torecycle or dispose materials including wastein a responsible manner.
l The solvents are recovered and reusedwherever possible in processes.
l Used catalysts are sent back tomanufacturers for regeneration andreuse;
l All organic wastes generated fromActive Pharmaceutical Ingredients(API) units (solids and liquids) andall the wastes generated fromformulations units (with very fewexceptions) are disposed to cementunits for use as auxiliary fuel called'co-processing' of wastes. For thefinancial year under discussion,around 51% of the waste is recycledthrough co-processing.
Principle 3 - Employee well being
1. Please indicate the total number ofemployees.
The Company has 13,288 employees as onMarch 31, 2016.
2. Please indicate the total number ofemployees hired on temporary/contractual/casual basis.
Company has over 9,000 contractualemployees as on March 31, 2016.
3. Please indicate the number of permanentwomen employees.
Company has 598 women employees as onMarch 31, 2016.
4. Please indicate the number of permanentemployees with disabilities.
No data available.
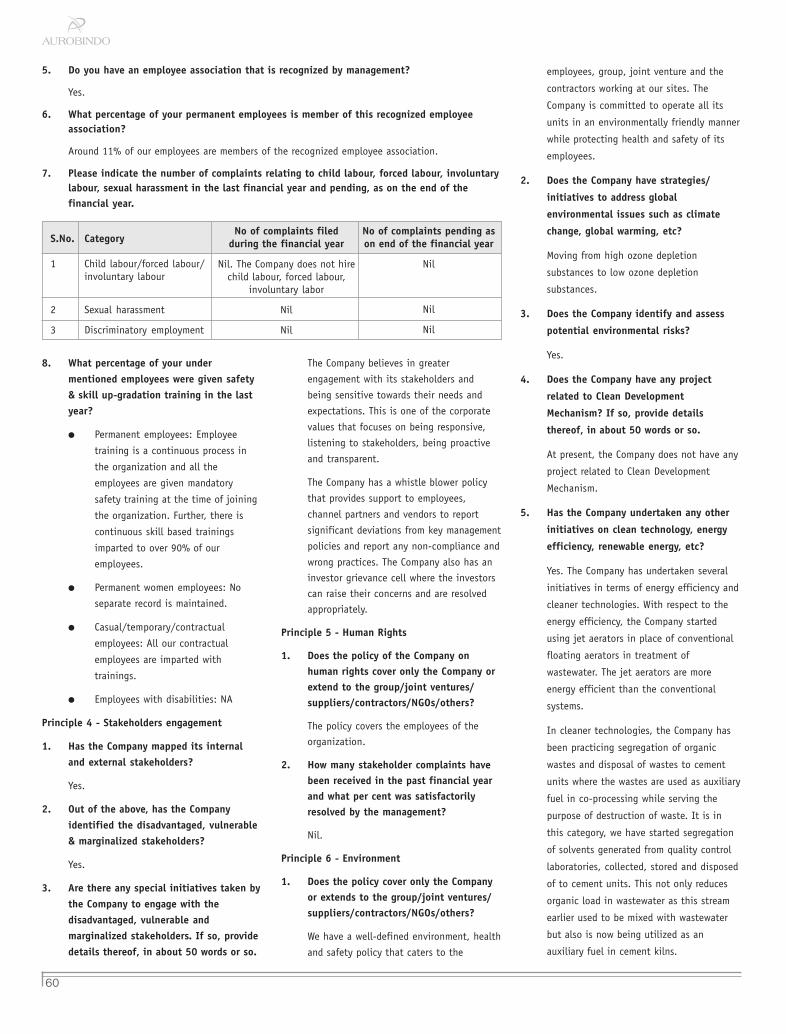
60
5. Do you have an employee association that is recognized by management?
Yes.
6. What percentage of your permanent employees is member of this recognized employeeassociation?
Around 11% of our employees are members of the recognized employee association.
7. Please indicate the number of complaints relating to child labour, forced labour, involuntarylabour, sexual harassment in the last financial year and pending, as on the end of thefinancial year.
8. What percentage of your undermentioned employees were given safety& skill up-gradation training in the lastyear?
l Permanent employees: Employee
training is a continuous process in
the organization and all the
employees are given mandatory
safety training at the time of joining
the organization. Further, there is
continuous skill based trainings
imparted to over 90% of our
employees.
l Permanent women employees: No
separate record is maintained.
l Casual/temporary/contractual
employees: All our contractual
employees are imparted with
trainings.
l Employees with disabilities: NA
Principle 4 - Stakeholders engagement
1. Has the Company mapped its internaland external stakeholders?
Yes.
2. Out of the above, has the Companyidentified the disadvantaged, vulnerable& marginalized stakeholders?
Yes.
3. Are there any special initiatives taken bythe Company to engage with thedisadvantaged, vulnerable andmarginalized stakeholders. If so, providedetails thereof, in about 50 words or so.
employees, group, joint venture and the
contractors working at our sites. The
Company is committed to operate all its
units in an environmentally friendly manner
while protecting health and safety of its
employees.
2. Does the Company have strategies/
initiatives to address global
environmental issues such as climate
change, global warming, etc?
Moving from high ozone depletion
substances to low ozone depletion
substances.
3. Does the Company identify and assess
potential environmental risks?
Yes.
4. Does the Company have any project
related to Clean Development
Mechanism? If so, provide details
thereof, in about 50 words or so.
At present, the Company does not have any
project related to Clean Development
Mechanism.
5. Has the Company undertaken any other
initiatives on clean technology, energy
efficiency, renewable energy, etc?
Yes. The Company has undertaken several
initiatives in terms of energy efficiency and
cleaner technologies. With respect to the
energy efficiency, the Company started
using jet aerators in place of conventional
floating aerators in treatment of
wastewater. The jet aerators are more
energy efficient than the conventional
systems.
In cleaner technologies, the Company has
been practicing segregation of organic
wastes and disposal of wastes to cement
units where the wastes are used as auxiliary
fuel in co-processing while serving the
purpose of destruction of waste. It is in
this category, we have started segregation
of solvents generated from quality control
laboratories, collected, stored and disposed
of to cement units. This not only reduces
organic load in wastewater as this stream
earlier used to be mixed with wastewater
but also is now being utilized as an
auxiliary fuel in cement kilns.
No of complaints filedduring the financial year
Nil. The Company does not hirechild labour, forced labour,
involuntary labor
Nil
Nil
No of complaints pending ason end of the financial year
Nil
Nil
Nil
S.No. Category
1 Child labour/forced labour/involuntary labour
2 Sexual harassment
3 Discriminatory employment
The Company believes in greater
engagement with its stakeholders and
being sensitive towards their needs and
expectations. This is one of the corporate
values that focuses on being responsive,
listening to stakeholders, being proactive
and transparent.
The Company has a whistle blower policy
that provides support to employees,
channel partners and vendors to report
significant deviations from key management
policies and report any non-compliance and
wrong practices. The Company also has an
investor grievance cell where the investors
can raise their concerns and are resolved
appropriately.
Principle 5 - Human Rights
1. Does the policy of the Company onhuman rights cover only the Company orextend to the group/joint ventures/suppliers/contractors/NGOs/others?
The policy covers the employees of the
organization.
2. How many stakeholder complaints havebeen received in the past financial yearand what per cent was satisfactorilyresolved by the management?
Nil.
Principle 6 - Environment
1. Does the policy cover only the Companyor extends to the group/joint ventures/suppliers/contractors/NGOs/others?
We have a well-defined environment, health
and safety policy that caters to the

Annual Report 2015-16
61
6. Are the emissions/waste generated bythe Company within the permissiblelimits given by CPCB/SPCB for thefinancial year being reported?
Yes.
7. Number of show cause/legal noticesreceived from CPCB/SPCB which arepending (i.e. not resolved tosatisfaction) as at the end of thefinancial year.
No pending notices as on March 31, 2016.
Principle 7 - Policy advocacy
1. Is your Company a member of any tradeand chamber or association? If Yes,Name only those major ones that yourbusiness deals with.
The Company is a member of various trade
bodies and chamber associations in India
as follows:
1. Export Promotion Council for EOUS &
SEZS
2. Indian Drug Manufacturers
Association
3. Indian Chamber of Commerce &
Industry
4. The Federation TG and AP Chambers
of Commerce & Industry (FAPCCI)
5. Confederation of Indian Industry
6. Andhra Chamber of Commerce
7. Bulk Drug Manufacturers Association
8. Pharmaceuticals Export Promotion
Council of India
9. Indo American Chamber of Commerce
10. JNPC Manufacturers Association
2. Have you advocated/lobbied throughabove associations for the advancementor improvement of public good? Yes/No;if yes, specify the broad areas.
The Company focuses on the advancement/
improvement of public good through our
well defined CSR activities.
Principle 8 - Community Development (CSR)
1. Does the company have specifiedprograms/initiatives/projects in pursuitof this policy? If yes, details thereof.
The Company focuses on specific projects
for the development of the society. The
Company's vision is to carry out its normal
business in a manner that is beneficial to
society & environment in addition to the
propagation of business. The Company
focuses on the following areas:
l Education
l Health
l Sanitation
l Road and Public safety
l Rural sports promotion,
environmental sustainability, rural
development and animal welfare.
The Company also provides infrastructure
support to the above mentioned areas.
2. Are the programs/projects undertakenthrough in-house team/own foundation/external NGO/government structures/anyother organization?
The Company has a fully functional CSR
team for the implementation and
monitoring of various CSR projects. Any use
of the external agencies viz NGOs,
government offices etc are project based.
3. Have you done any impact assessment of
your initiative?
We review our projects time to time. Each
project has specific deliverables to be met.
The internal teams ensures the
implementation of the projects undertaken.
4. What is your Company's directcontribution to community developmentprojects - amount and details of theprojects undertaken?
The Company has spent `187.6 million on
the CSR activities during the financial year
2015-16. The amount was spent on areas as
mentioned in point 1.
5. Have you taken steps to ensure that thiscommunity development initiative issuccessfully adopted by the community?Please explain in 50 words, or so.
Our community development program
revolves around education, health,
sanitation etc. The programs conducted
during the financial year have benefitted
more than 50,000 students and 100,000
families. During the period, the Company
has set up various libraries for the students,
provided skill development & employment
enhancing skills in backward and rural
areas. The Company sponsored Aurobindo
Geriatric Eye Care Centre (AGE) at L. V.
Prasad Eye Institute provides eye care
treatment covering all districts of northern
Andhra Pradesh and neighboring Odisha
state. In order to promote rural sports,
training is provided to rural sportsmen and
women in games such as chess, badminton,
and power lifting.
Further details on our CSR projects
undertaken during 2015-16 are mentioned
in a separate section of the annual report.
Principle 9 - Customer value
1. What percentage of customercomplaints/consumer cases are pendingas on the end of financial year.
We have a well-defined mechanism to
handle customer complaints. As on
March 31, 2016 less than 1% of the
complaints were pending beyond the
acceptable timelines as per the Standard
Operating Procedures (SOP).
2. Does the Company display productinformation on the product label, overand above what is mandated as per locallaws?
The product labeling is to be approved by
the regulatory authorities of the country
where the product is to be sold. The
Company mentions all the product
information required by the regulatory
agencies.
3. Is there any case filed by anystakeholder against the Companyregarding unfair trade practices,irresponsible advertising and/or anti-competitive behavior during the last fiveyears and pending as on end of thefinancial year?
There is no pending case as on
March 31, 2016.
4. Did your Company carry out anyconsumer survey/consumer satisfactiontrends?
The Company has a dedicated team that
regularly does face to face review meetings
with the customers to understand their
needs. These interactions help in getting
useful feedback to improve upon the
existing process.

62
Anne
xure
–1Fo
rm A
OC–I
Stat
emen
t co
ntai
ning
sal
ient
fea
ture
s of
the
fin
anci
al s
tate
men
t of
sub
sidi
arie
s/as
soci
ate
com
pani
es/j
oint
ven
ture
s
(Pur
suan
t to
firs
t pr
ovis
o to
sub
–sec
tion
(3)
of
Sect
ion
129
read
wit
h Ru
le 5
of
the
Com
pani
es (
Acco
unts
) Ru
les,
201
4)Pa
rt 'A
': Su
bsid
iari
es` M
illio
n
Sl.
Nam
e of
the
sub
sidia
ryRe
port
ing
Exch
ange
rat
eSh
are
Res
erve
sTo
tal
Tota
lIn
vest
–In
vest
–Tu
rnov
erPr
ofit/
Prov
isio
nPr
ofit/
Prop
osed
% o
fCo
untr
yNo
.cu
rrenc
yas
on
the
last
capi
tal
& su
rplu
sas
sets
liabi
litie
sm
ents
inm
ents
(Los
s)fo
r(L
oss)
divi
dend
shar
e–da
te o
f the
rele–
subs
i–ot
her
befo
reta
xatio
naf
ter
hold
ing
vant
fin
anci
aldi
arie
sth
anta
xatio
nta
xatio
nye
ar in
the
case
subs
i–of
fore
ign
diar
ies
sub
sidia
ries
1.He
lix H
ealth
care
B.V
.EU
RO 7
5.39
50 7
,597
.0 (
945.
8) 2
,733
.2 5
29.8
4,4
47.8
– –
(50
0.9)
(74
.0)
(42
6.9)
–10
0Th
e Ne
ther
land
s2.
Agile
Pha
rma
B.V.
EURO
75.
3950
3,0
43.3
504
.6 2
,981
.2 7
,068
.7 7
,635
.4 –
– 3
57.9
159
.7 1
98.2
–10
0Th
e Ne
ther
land
s3.
APL
Hold
ings
(Je
rsey
) Li
mite
d1EU
RO 7
5.39
50 –
– –
– –
– –
(1.
9) –
(1.
9) –
100
Jers
ey4.
Labo
rato
rios
Auro
bind
o S.
L.EU
RO 7
5.39
50 3
66.9
(31
0.1)
1,6
81.7
1,6
24.9
– –
1,0
40.4
51.
1 3
5.6
15.
4 –
100
Spai
n5.
Aure
x B.
V. (
Form
erly
know
n as
Pha
rmac
in B
.V.)
EURO
75.
3950
1.4
95.
7 3
00.7
203
.6 –
– 4
34.4
26.
3 5
.8 2
0.5
–10
0Th
e Ne
ther
land
s6.
Milp
harm
Lim
ited
GBP
95.
4725
343
.5 4
99.4
2,0
96.6
1,2
53.7
– –
2,2
26.9
152
.6 3
3.2
119
.5 –
100
Unite
d Ki
ngdo
m7.
Auro
bind
o Ph
arm
a (M
alta
) Li
mite
dEU
RO 7
5.39
50 3
82.6
227
.1 6
89.4
299
.4 2
19.7
– 4
16.6
(84
.2)
1.1
(85
.4)
–10
0Ma
lta8.
APL
Swift
Ser
vice
s (M
alta
) Li
mite
dEU
RO 7
5.39
50 2
71.4
(68
.1)
3,6
84.1
3,4
80.8
– –
7,3
13.6
(28
.1)
– (
28.1
) –
100
Malta
9.AP
L IP
Com
pany
Lim
ited2
EURO
75.
3950
– –
– –
– –
– (
1.0)
– (
1.0)
–10
0Je
rsey
10.
Auro
bind
o Ph
arm
a Gm
bHEU
RO 7
5.39
50 1
.9 2
99.2
2,2
48.8
1,9
47.7
– –
825
.8 5
1.3
11.
7 3
9.6
–10
0Ge
rman
y11
.Au
robi
ndo
Phar
ma
B.V.
3EU
RO 7
5.39
50 –
– –
– –
– –
(6.
9) 2
6.1
(33
.0)
–10
0Th
e Ne
ther
land
s12
.Au
robi
ndo
Phar
ma
(Rom
ania
) s.
r.l.10
RON
16.
7688
153
.8 (
93.1
) 3
15.1
254
.4 –
– 2
23.5
(8.
1) (
0.3)
(7.
7) –
100
Rom
ania
13.
Auro
bind
o Ila
c Sa
nayi
Ve T
icare
t Lim
ited
Sirk
eti
TRY
23.
3636
156
.0 (
69.2
) 9
1.2
4.4
– –
– (
13.3
) –
(13
.3)
–10
0Tu
rkey
14.
Auro
bind
o Ph
arm
a(P
ortu
gal)
Unip
esso
al L
imita
daEU
RO 7
5.39
50 5
62.7
(90
0.7)
253
.0 5
91.0
– –
221
.4 (
160.
8) (
10.6
) (
150.
2) –
100
Port
ugal
15.
Phar
macin
B.V.
(For
merly
kno
wn a
s Aur
ex B
.V.)
EURO
75.
3950
6.8
4.7
76.
9 6
5.4
– –
246
.2 5
.9 1
.2 4
.7 –
100
The
Neth
erla
nds
16.
Auro
bind
o Ph
arm
a (I
talia
) S.
r.l.
EURO
75.
3950
150
.8 (
34.8
) 1
,482
.7 1
,366
.7 –
– 1
,247
.1 (
247.
7) –
(24
7.7)
–10
0It
aly
17.
Auro
vita
s Un
ipes
soal
LDA
EURO
75.
3950
0.4
76.
2 5
13.2
436
.6 –
– 1
,160
.1 4
4.1
17.
8 2
6.3
–10
0Po
rtug
al18
.Ac
tavi
s Fr
ance
SAS
4EU
RO 7
5.39
50 –
– –
– –
– –
– –
– –
100
Fran
ce19
.Ar
row
Gene
rique
s SA
SEU
RO 7
5.39
50 2
,785
.5 (
909.
4) 6
,180
.3 4
,304
.2 –
– 1
0,62
6.3
222
.1 4
0.6
181
.5 –
100
Fran
ce20
.19
80 P
uren
Pha
rma
GmbH
(for
mer
ly A
ctav
is M
anag
emen
t Gm
bH)
EURO
75.
3950
1.9
2.0
4.4
0.5
– –
– 0
.1 0
.9 (
0.8)
–10
0Ge
rman
y21
.Pu
ren
Phar
ma
GmbH
& C
o. K
G(fo
rmer
ly Ac
tavis
Deu
tsch
land
GmbH
& C
o. K
G)EU
RO 7
5.39
50 1
.9 1
,492
.4 8
,951
.4 7
,457
.1 –
– 5
,722
.4 1
,000
.9 2
05.0
795
.9 1
11.4
100
Germ
any
22.
Auro
vitas
Spa
in S
A (fo
rmer
ly Ac
tavis
Spa
in S
.A)
EURO
75.
3950
9.4
631
.5 1
,536
.6 8
95.7
– –
1,9
38.5
(61
.1)
(7.
9) (
53.2
) –
100
Spai
n23
.Au
robi
ndo
Phar
ma
B.V.
(for
mer
ly k
nown
as
Acta
vis
B.V.
)EU
RO 7
5.39
50 3
.8 (
140.
9) 2
,264
.8 2
,401
.9 –
– 2
,969
.0 (
302.
2) –
(30
2.2)
–10
0Th
e Ne
ther
land
s24
.AP
L Ph
arm
a Th
ai L
imite
d10TH
B 1
.886
0 1
88.6
(27
.5)
441
.4 2
80.3
– –
398
.3 (
14.2
) –
(14
.2)
–98
Thai
land
25.
Auro
bind
o Ph
arm
a In
dust
riaFa
rmac
eutic
a Li
mite
d10Re
ais
18.
4410
186
.8 4
90.9
880
.4 2
02.7
– –
1,5
80.6
385
.4 1
46.9
238
.5 –
100
Braz
il26
.Au
robi
ndo
Phar
ma
Prod
utos
Farm
aceu
ticos
Lim
itada
10Re
ais
18.
4410
1.8
89.
7 5
51.2
459
.7 –
– 8
01.7
150
.9 2
9.2
121
.8 –
100
Braz
il
(Con
td.)

Annual Report 2015-16
63
` M
illio
n
Sl.
Nam
e of
the
sub
sidia
ryRe
port
ing
Exch
ange
rat
eSh
are
Res
erve
sTo
tal
Tota
lIn
vest
-In
vest
-Tu
rnov
erPr
ofit/
Prov
isio
nPr
ofit/
Prop
osed
% o
fCo
untr
yNo
.cu
rrenc
yas
on
the
last
capi
tal
& su
rplu
sas
sets
liabi
litie
sm
ents
inm
ents
(Los
s)fo
r(L
oss)
divi
dend
shar
e-da
te o
f the
rele
-su
bsi-
othe
rbe
fore
taxa
tion
afte
rho
ldin
gva
nt f
inan
cial
diar
ies
than
taxa
tion
taxa
tion
year
in th
e ca
sesu
bsi-
of fo
reig
ndi
arie
s s
ubsid
iarie
s
27.
All P
harm
a (S
hang
hai)
Trad
ing
Com
pany
Lim
ited10
RMB
10.
2506
51.
3 1
03.0
288
.2 1
33.9
– –
1,1
19.4
14.
7 4
.4 1
0.3
–10
0Ch
ina
28.
Auro
Pha
rma
Inc.
CAD
51.
2300
221
.6 3
0.9
989
.7 7
37.2
– –
648
.2 1
49.5
9.4
140
.1 –
100
Cana
da29
Auro
bind
o Ph
arm
a (A
ustra
lia)
Pty
Lim
ited5
AUD
50.
6847
- -
- -
- -
2.7
(2.
5) -
(2.
5) -
100
Aust
ralia
30Au
robi
ndo
Phar
ma
(Pty
) Li
mite
dZA
R 4
.501
2 1
88.6
228
.4 5
46.4
203
.7 -
74.
3 6
28.3
68.
0 -
68.
0 -
100
Sout
h Af
rica
31Au
ro H
ealth
care
(Ni
geria
) Li
mite
dNa
ira(N
GN)
0.3
287
20.
8 (
20.0
) 1
.7 0
.9 -
- 1
.0 (
3.3)
0.1
(3.
3) -
100
Nige
ria32
Auro
bind
o Ph
arm
a Ja
pan
K.K.
JPY
0.5
899
87.
8 1
7.7
244
.6 1
39.1
- -
305
.0 9
.9 3
.3 6
.5 -
100
Japa
n33
Auro
bind
o Ph
arm
a (S
inga
pore
) Pte
Lim
ited6
SGD
49.
0163
- -
- -
- -
- (
0.8)
- (
0.8)
-10
0Si
ngap
ore
34Au
robi
ndo
Phar
ma
NZ L
imite
d7NZ
D 4
5.70
68 -
- -
- -
- -
- -
- -
100
Newz
eala
nd35
Auro
vida
Far
mac
eutic
a SA
DE
CV10
MXN
(Mpe
so)
3.8
307
449
.5 (
105.
6) 3
71.9
28.
0 -
- 2
9.2
(59
.4)
- (
59.4
) -
100
Mexi
co36
Auro
bind
o Ph
arm
a Co
lom
bia
S A
S10Co
lomb
ian
Peso
0.02
13 3
1.6
(15
.8)
81.
2 6
5.4
- -
110
.3 (
4.9)
1.1
(6.
0) -
100
Colo
mbi
a37
Auro
bind
o Ph
arm
a US
A In
c.US
D 6
6.25
50 4
,086
.3 3
,000
.3 2
6,42
3.2
23,
441.
1 4
,104
.5 -
34,
945.
5 1
,080
.6 3
50.3
730
.3 -
100
U.S.
A.38
Auro
life
Phar
ma
LLC
USD
66.
2550
4,0
41.6
3,2
91.8
9,2
09.5
1,8
76.1
- -
9,2
15.8
2,6
05.3
844
.6 1
,760
.7 -
100
U.S.
A.39
Auro
med
ics
Phar
ma
LLC
USD
66.
2550
13.
3 4
13.7
3,9
94.7
3,5
67.7
- -
6,3
05.0
406
.5 1
31.8
274
.7 -
100
U.S.
A.40
Auro
Hea
lth L
LCUS
D 6
6.25
50 0
.6 (
565.
8) 1
,128
.5 1
,693
.7 -
- 2
59.4
(22
0.8)
(71
.6)
(14
9.2)
-10
0U.
S.A.
41Na
trol I
ncUS
D 6
6.25
50 3
3.1
688
.9 7
,907
.7 7
,185
.7 -
- 7
,367
.8 1
,122
.9 3
64.0
758
.8 -
100
U.S.
A.42
APL
Rese
arch
Cen
tre L
imite
dIN
R 1
.000
0 1
22.6
(3.
0) 1
19.6
- -
- -
(2.
8) -
(2.
8) -
100
Indi
a43
APL
Heal
thca
re L
imite
dIN
R 1
.000
0 8
75.0
(58
.2)
917
.7 1
00.9
- -
5.3
(56
.6)
- (
56.6
) -
100
Indi
a44
Auro
next
Pha
rma
Priv
ate
Lim
ited9
INR
1.0
000
1,5
29.8
(68
6.3)
1,1
14.6
271
.1 -
- 1
60.5
(20
5.6)
- (
205.
6) -
100
Indi
a45
Auro
Pep
tides
Lim
ited
INR
1.0
000
661
.0 4
3.7
768
.8 6
4.1
- -
345
.9 1
61.0
55.
8 1
05.2
-95
Indi
a46
Auro
bind
o An
tibio
tics
Lim
ited
INR
1.0
000
13.
0 (
8.3)
12.
9 8
.2 -
- -
(8.
2) -
(8.
2) -
100
Indi
a47
Cure
pro
Pare
nter
als
Lim
ited
INR
1.0
000
57.
8 8
04.8
2.6
- 8
60.0
- -
(0.
1) 0
.1 (
0.2)
-10
0In
dia
48Eu
gia
Phar
ma
Spec
ialit
ies
Lim
ited
INR
1.0
000
1,4
33.4
(12
.6)
2,6
44.2
1,2
23.4
- -
- (
10.5
) 0
.6 (
11.1
) -
60In
dia
49Hy
acin
ths
Phar
ma
Priv
ate
Lim
ited
INR
1.0
000
97.
4 (
1.6)
95.
8 -
- -
- (
1.0)
- (
1.0)
-10
0In
dia
50Si
licon
Life
Sci
ence
s Pr
ivat
e Li
mite
dIN
R 1
.000
0 4
48.7
(11
8.8)
784
.7 4
54.8
- -
267
.3 (
102.
0) (
35.9
) (
66.0
) -
100
Indi
a51
Auro
Zym
es L
imite
dIN
R 1
.000
0 0
.5 (
0.7)
43.
4 4
3.6
- -
- (
0.6)
- (
0.6)
-10
0In
dia
52Te
rgen
e Bi
otec
h Pr
ivat
e Li
mite
d8IN
R 1
.000
0 9
6.5
(59
.2)
46.
0 8
.7 -
- 0
.2 (
54.3
) -
(54
.3)
-60
Indi
a
1AP
L Hol
ding
s (J
erse
y) L
imit
ed,
liqui
date
d w.
e.f.
Nov
embe
r 18
, 20
15.
2AP
L IP
Com
pany
Lim
ited
, liq
uida
ted
w.e.
f. N
ovem
ber
18,
2015
.3
Auro
bind
o Ph
arm
a B.
V. m
erge
d w
ith
Acta
vis
B.V.
Sub
sequ
entl
y, t
he n
ame
of A
ctav
is B
.V.
was
cha
nged
to
Auro
bind
o Ph
arm
a B.
V, w
.e.f
. Ju
ly 1
, 20
15.
4Ac
tavi
s Fr
ance
SAS
was
mer
ged
wit
h Ar
row
Gen
eriq
ues
SAS
w.e.
f. A
pril
1, 2
015.
5Au
robi
ndo
Phar
ma
(Aus
tral
ia)
Pty
Lim
ited
, liq
uida
ted
w.e.
f. A
pril
10,
2015
.6
Auro
bind
o Ph
arm
a (S
inga
pore
) Pt
e Li
mit
ed,
liqui
date
d w.
e.f.
Dec
embe
r 31
, 20
15.
7Au
robi
ndo
Phar
ma
NZ L
imit
ed,
liqui
date
d w.
e.f.
Apr
il 10
, 20
15.
It w
as inc
orpo
rate
d du
ring
the
finan
cial
yea
r 20
11-1
2 an
d th
ere
was
no
acti
vity
dur
ing
the
year
.8
Terg
ene
Biot
ech
Priv
ate
Lim
ited
acq
uire
d du
ring
the
finan
cial
yea
r, re
sult
s gi
ven
are
from
the
dat
e of
acq
uisi
tion
.9
Auro
next
Pha
rma
Priv
ate
Lim
ited
has
bec
ome
who
lly o
wne
d su
bsid
iary
of
Auro
bind
o Ph
arm
a Li
mit
ed,
Indi
a w.
e.f.
Sep
tem
ber
16,
2015
.10
The
finan
cial
yea
r of
the
se c
ompa
nies
end
on
Dece
mbe
r 31
. H
owev
er,
the
resu
lts
give
n ar
e as
of
Mar
ch 3
1, 2
016.

64
Annexure-2Form No. AOC-2
Particulars of contracts/arrangements entered into by the Company with related parties
(Pursuant to clause (h) of sub-section (3) of Section 134 of the Companies Act, 2013 and Rule 8(2) of the Companies (Accounts) Rules, 2014)(Referred to in sub-section (1) of Section 188 of the Companies Act, 2013 including certain arms length transactions under third proviso thereto)
1. Details of contracts or arrangements or transactions not at arm’s length basis:
All contracts/arrangements entered into by the Company with related parties referred to in sub-section (1) of Section 188 of the Companies Act, 2013 are atarms length basis.
2. Details of material contracts or arrangement or transactions at arm’s length basis
Name of the Nature of Nature of Duration Salient terms ` Millionrelated party relationship contracts/ of the of the contracts
arrangements/ contracts/ or arrangementstransactions arrangements/ or transactions
transactions including thevalue, if any
Aurobindo Pharma Wholly Sale of goods On going Based on transfer 22,023.5USA Inc., U.S.A. owned & services pricing guidelines
subsidiaryPurchase of On going Based on transfer 48.3materials, assets pricing guidelines& expenses
Appropriate approvals have been taken for related party transactions. No amount was paid as advance.
For and on behalf of the Board
K. RagunathanHyderabad ChairmanMay 30, 2016 DIN: 00523576
For and on behalf of the Board
N. Govindarajan Dr. M. SivakumaranManaging Director Director
Hyderabad, May 30, 2016 DIN: 00050482 DIN: 01284320
Part 'B': Associates and joint ventures
(Pursuant to Section 129(3) of the Companies Act, 2013 relating to associate companies and joint ventures)` Million
1. Name of the joint venture Novagen Pharma (Pty) Limited
2. Latest audited Balance Sheet Date March 31, 2016
3. Share of joint venture held by the Company at the year end
i. Number 927,236
ii. Amount of investment in joint venture 74.3
iii. Extent of holding 50%
4. Description of significant influence Joint venture
5. Reason associate/joint venture is not consolidated Not applicable
6. Networth attributable to shareholding as per latest audited balance sheet 294.2
7. Profit for the year 154.4
i. Considered in consolidation 77.2
ii. Not considered in consolidation 77.2

Annual Report 2015-16
65
Annexure-3Form No. MGT-9
Extract of Annual ReturnFor the financial year ended onMarch 31, 2016
[Pursuant to Section 92(3) of the Companies Act, 2013 and Rule 12(1) of the Companies (Management and Administration) Rules, 2014]
I. REGISTRATION AND OTHER DETAILS
i. CIN : L24239TG1986PLC015190
ii. Registration date : December 26, 1986
iii. Name of the Company : Aurobindo Pharma Limited
iv. Category/sub-category of the Company : Company having share capital
v. Address of the Registered Office and contact details : Plot No.2, Maitri Vihar, AmeerpetHyderabad 500 038, TelanganaPhone : +91 40 2373 6370Fax : +91 40 2374 3740Email : [email protected]
vi. Whether listed company : Yes. Listed on BSE Limited andNational Stock Exchange of India Limited
vii. Name, address and contact details of : Karvy Computershare Private LimitedRegistrar and Transfer Agent, if any Unit: Aurobindo Pharma Limited
Karvy Selenium, Tower B, Plot No.31-32,Gachibowli, Financial District, Nanakramguda,Hyderabad - 500032Phone : +91 40 6716 2222Fax : +91 40 2300 1153E-mail : [email protected]
II. PRINCIPAL BUSINESS ACTIVITIES OF THE COMPANY
All the business activities contributing 10% or more of the total turnover of the Company:
Sl.No. Name and description of main products/services NIC code of the product/service % to total turnover of the Company
1. Manufacturing generic pharmaceuticals and activepharmaceutical ingredients 21001/21002 100
III. PARTICULARS OF HOLDING, SUBSIDIARY AND ASSOCIATE COMPANIES
Holding/ % of ApplicableS.No. Name and address of the company CIN/GLN subsidiary/ shares Section
associate held
1. Helix Healthcare B.V.Prins Bernhardplein 200,1097 JB Amsterdam,Post Bag No. 990 1000 AZ, The Netherlands Foreign company Subsidiary 100 2(87)
2. Agile Pharma B.V.,Prins Bernhardplein 200,1097 JB Amsterdam,Post Bag No. 990 1000 AZ, The Netherlands Foreign company Subsidiary 100 2(87)
3. Laboratorios Aurobindo S.L.Avda. De Burgos, 16D, 5 deg Planta - Edificio Euromor,28036, Madrid, Spain Foreign company Subsidiary 100 2(87)
4. Aurex B.V. (formerly known as Pharmacin B.V.)Baarnsche Dijkl, 3741, LN Baarn, The Netherlands Foreign company Subsidiary 100 2(87)
5. Milpharm LimitedAres Block, Odyssey Business Park,South Ruislip, Middlesex, London, U.K. Foreign company Subsidiary 100 2(87)
6. Aurobindo Pharma (Malta) LimitedVault-14, Level-2, Valletta Waterfront, Floriana, Malta Foreign company Subsidiary 100 2(87)
7. APL Swift Services (Malta)Vault-14, Level-2, Valletta Waterfront, Floriana, Malta Foreign company Subsidiary 100 2(87)
8. Aurobindo Pharma GmbHWilly-Brandt-Allee 2, 81829 Munchen, Germany Foreign company Subsidiary 100 2(87)
(Contd.)

66
9. Aurobindo Pharma (Romania) s.r.l.Bucuresti Sectorul 1, Soseaua, Bucuresti - Ploiesti,Nr 42-44, Complex, Baneasa Business & Technology Park,Cladirea B, Aripa B2, Etaj 2, Romania Foreign company Subsidiary 100 2(87)
10. Aurobindo Ilac Sanayi Ve Ticaret Limited SirketiEgitim, Mh.Poyraz Sk. Sadikoglu Plaza 5, No. 27,Kadikoy, Istanbul, Turkey Foreign company Subsidiary 100 2(87)
11. Aurobindo Pharma (Portugal) Unipessoal LimitadaAvenida do Forte, 3 Parque Suecia, Ed. IV, 2°,2794-038 Carnaxide, Portugal Foreign company Subsidiary 100 2(87)
12. Pharmacin B.V. (formerly known as Aurex B.V.)Molenvliet103, 3335 LH Zwinindrecht, The Netherlands Foreign company Subsidiary 100 2(87)
13. Aurobindo Pharma (Italia) S.r.l.Via San Giuseppe, 102, 20147 Saronno (Varese), Italy Foreign company Subsidiary 100 2(87)
14. Aurovitas, Unipessoal LDAAvenida do Forte, 3 Parque Suecia, Ed. IV, 2°,2794-038 Carnaxide, Portugal Foreign company Subsidiary 100 2(87)
15. Arrow Generiques SAS26 avenue Tony Garnier 69007 Lyon, France Foreign company Subsidiary 100 2(87)
16. 1980 Puren Pharma GmbH(formerly Actavis Management GmbH),Willy-Brandt-Allee 2; D-81829 München, Germany Foreign company Subsidiary 100 2(87)
17. Puren Pharma GmbH & Co. KG(formerly Actavis Deutschland GmbH & Co. KG)Willy-Brandt-Allee 2; D-81829 München, Germany Foreign company Subsidiary 100 2(87)
18. Aurovitas Spain SA (formerly Actavis Spain S.A.)Avda. De Burgos, 16D, 5 deg Planta, Edificio Euromor,28036, Madrid, Spain Foreign company Subsidiary 100 2(87))
19. Aurobindo Pharma B.V. (formerly known as Actavis B.V.)Baarnschedijk 1, 3741 LN Bsaaarn, The Netherlands Foreign company Subsidiary 100 2(87)
20. APL Pharma Thai Limited436, 438, Soi Phattanakaran, 30 Phattanakaran,Road Khweang Suanluang, Khet Suanluang,Bangkok, Thailand - 10250 Foreign company Subsidiary 97.92 2(87)
21. Aurobindo Pharma Industria Farmaceutica LimitedVP-06-E Qd. 09 Mod 12 a 15, Daia Anapolis, Goias State,Brazil CEF 75132135 Rua 15 De Dezembro 128, Brazil Foreign company Subsidiary 99.97 2(87)
22. Aurobindo Pharma Produtos Farmaceuticos Limitada2 Andar Sala 205, Centro, Anapolis, Goias State, Brazil Foreign company Subsidiary 100 2(87)
23. All Pharma (Shanghai) Trading Company LimitedRoom 3304, No.8 Xingly Road, Shanghai, P.R. China Foreign company Subsidiary 100 2(87)
24. Auro Pharma Inc.3700 Steeles Avenue, W Suite # 402,Woodbridge, Canada, ONL4L 8K8 Foreign company Subsidiary 100 2(87)
25. Novagen Pharma (Pty) Limited100, Sovereign Drive, Route 21, Corporate Park Nellmapius Road,Irene, Pretoria, South Africa Foreign company Joint Venture 50 2(6)
26. Aurobindo Pharma (Pty) Limited53 Phillip Engelbrecht Avenue, Woodhill Office Park,Building No. 1, Meyersdalext 12, 1448,Johannesburg, South Africa Foreign company Subsidiary 100 2(87)
27. Auro Healthcare (Nigeria) LimitedPlot No.4, Oyetubo Street, Off Obafemi,Awolowo Way, Ikeja, Lagos, Nigeria Foreign company Subsidiary 100 2(87)
28. Aurobindo Pharma Japan K.K.9th Floor, Youth Building, Cho-ku, 103-0002,1-3-8 Nihonbashi bakuro-cho, Tokyo, Japan Foreign company Subsidiary 100 2(87)
PARTICULARS OF HOLDING, SUBSIDIARY AND ASSOCIATE COMPANIES (Contd.)
Holding/ % of ApplicableS.No. Name and address of the company CIN/GLN subsidiary/ shares Section
associate held
(Contd.)

Annual Report 2015-16
67
29. Aurovida Farmaceutica SA DE CVCalle 14 de Agosto # 45Col. Lomas Manuel AvilaCamachoDeleg, Naucalpan de Juarez, C.P. 53910,Estado de México Foreign company Subsidiary 100 2(87)
30. Aurobindo Pharma Colombia S A SCalle 100 No. 17A-36, Oficina 1003-1004,Edificio One Hundred, Bogotá, Colombia Foreign company Subsidiary 100 2(87)
31. Aurobindo Pharma USA Inc.6, Wheeling Road, Dayton, NJ 08810, U.S.A. Foreign company Subsidiary 100 2(87)
32. Aurolife Pharma LLC2400 Route 130 North, Dayton, NJ 08810, U.S.A. Not applicable Subsidiary 100 2(87)
33. Auromedics Pharma LLC2401 Route 130 North, Dayton, NJ 08810, U.S.A. Foreign company Subsidiary 100 2(87)
34. Auro Health LLC2572 Brunswick Pike, Lawrenceville, NJ 08648, U.S.A. Foreign company Subsidiary 100 2(87)
35. Natrol LLC21411 Prairie Street, Chatsworth, CA 91311, U.S.A. Foreign Company Subsidiary 100 2(87)
36. APL Research Centre LimitedPlot No.2, Maitri Vihar, Ameerpet, Hyderabad - 500 038 U24116TG2006PLC051171 Subsidiary 100 2(87)
37. APL Healthcare LimitedPlot No.2, Maitri Vihar, Ameerpet, Hyderabad - 500 038 U24239TG2006PLC052053 Subsidiary 100 2(87)
38. Auronext Pharma Private Limited89-A, Ground Floor, Zamrudpur, Greater Kailash-1,New Delhi - 110 048 U74999DL2009PTC191842 Subsidiary 100 2(87)
39. Auro Peptides LimitedPlot No.2, Maitri Vihar, Ameerpet, Hyderabad - 500 038 U24232TG2012PLC078350 Subsidiary 95 2(87)
40. Aurobindo Antibiotics LimitedPlot No.2, Maitri Vihar, Ameerpet, Hyderabad - 500 038 U24232TG2012PLC081892 Subsidiary 100 2(87)
41. Curepro Parenterals LimitedPlot No.2, Maitri Vihar, Ameerpet, Hyderabad - 500 038 U24232TG2013PLC087101 Subsidiary 100 2(87)
42. Eugia Pharma Specialities LimitedPlot No.2, Maitri Vihar, Ameerpet, Hyderabad - 500 038 U24297TG2013PLC087048 Subsidiary 60 2(87)
43. Hyacinths Pharma Private LimitedPlot No.2, Maitri Vihar, Ameerpet, Hyderabad - 500 038 U24232TG2010PTC069638 Subsidiary 100 2(87)
44. Silicon Life Sciences Private LimitedPlot No.2, Maitri Vihar, Ameerpet, Hyderabad - 500 038 U85100TG2008PTC057669 Subsidiary 100 2(87)
45. AuroZymes LimitedPlot No.2, Maitri Vihar, Ameerpet, Hyderabad - 500 038 U24232TG2013PLC091383 Subsidiary 100 2(87)
46. Tergene Biotech Private Limited604/2A, By Pass Road, Sholavaram,Chennai - 600067, Tamil Nadu U24230TN2008PTC066737 Subsidiary 60 2(87)
PARTICULARS OF HOLDING, SUBSIDIARY AND ASSOCIATE COMPANIES (Contd.)
Holding/ % of ApplicableS.No. Name and address of the company CIN/GLN subsidiary/ shares Section
associate held

68
IV. SHARE HOLDING PATTERN (Equity share capital breakup as percentage of total equity)
i. Categorywise share holding
Category of shareholders No. of shares held at the beginning of the year No. of shares held at the end of the yearApril 1, 2015 March 31, 2016
Demat Physical Total % of Demat Physical Total % of Changetotal total during the
shares shares year (%)
A. Promoter and promoter group1. Indian
a. Individual/HUF 139,883,428 – 139,883,428 47.91 279,366,856 – 279,366,856 47.74 -0.17b. Central government/state
government(s) – – – – – – – – –c. Bodies corporate 8,692,358 – 8,692,358 2.98 17,384,716 – 17,384,716 2.97 -0.01d. Financial institutions/banks – – – – – – – – –e. Others – – – – – – – – –Sub-Total A(1) 148,575,786 – 148,575,786 50.89 296,751,572 – 296,751,572 50.71 -0.18
2. Foreigna. Individuals
(NRIs/Foreign Individuals) 9,000,000 – 9,000,000 3.08 18,000,000 – 18,000,000 3.08 –b. Bodies corporate – – – – – – – – –c. Institutions – – – – – – – – –d. Qualified Foreign Investor – – – – – – – – –e. Others – – – – – – – – –Sub-Total A(2) 9,000,000 – 9,000,000 3.08 18,000,000 – 18,000,000 3.08 –Total A=A(1)+A(2) 157,575,786 – 157,575,786 53.97 314,751,572 – 314,751,572 53.79 -0.18
B. Public shareholding1. Institutions
a. Mutual Funds/UTI 17,988,239 – 17,988,239 6.16 41,717,018 – 41,717,018 7.13 0.97b. Financial Institutions/banks 181,669 – 181,669 0.06 535,319 – 535,319 0.09 0.03c. Central Government/State
Government(s) – – – – – – – – –d. Venture Capital Funds – – – – – – – – –e. Insurance companies 52,951 – 52,951 0.02 246,902 – 246,902 0.04 0.02f. Foreign Institutional Investors 86,367,982 – 86,367,982 29.58 160,362,472 – 160,362,472 27.40 -2.18g. Foreign Venture Capital Investors – – – – – – – – –h. Qualified Foreign Investor – – – – – – – – –i. Others – – – – – – – – –Sub-Total B(1) 104,590,841 – 104,590,841 35.82 202,861,711 – 202,861,711 34.67 -1.15
2. Non-institutionsa. Bodies corporate 4,459,878 50,500 4,510,378 1.54 11,314,520 100,970 11,415,490 1.95 0.41b. Individuals
i. Individuals holding nominalshare capital up to `1 lakh 15,313,825 1,469,277 16,783,102 5.75 30,991,479 2,622,558 33,614,037 5.74 –
ii. Individuals holding nominalshare capital in excess of`1 lakh 6,915,881 – 6,915,881 2.37 18,674,983 – 18,674,983 3.19 0.82
c. OthersClearing members 311,186 – 311,186 0.11 1,007,268 – 1,007,268 0.17 0.06Non-Resident Indians 1,287,804 – 1,287,804 0.44 2,807,530 – 2,807,530 0.48 0.04Trusts 7,297 – 7,297 0.00 36,995 – 36,995 0.01 –
d. Qualified Foreign Investor – – – 0.00 – – – – –Sub-Total B(2) 28,295,871 1,519,777 29,815,648 10.21 64,832,775 2,723,528 67,556,303 11.54 1.33Total B=B(1)+B(2) 132,886,712 1,519,777 134,406,489 46.03 267,694,486 2,723,528 270,418,014 46.21 0.18Total (A+B) 290,462,498 1,519,777 291,982,275 100.00 582,446,058 2,723,528 585,169,586 100.00 0.00
C. Shares held by custodians,against which Depository Receiptshave been issued1. Promoter and promoter group – – – – – – – – –2. Public – – – – – – – – –Grand Total (A+B+C) 290,462,498 1,519,777 291,982,275 100.00 582,446,058 2,723,528 585,169,586 100.00
*During the year, the Company has issued bonus shares in the ratio of 1:1 on July 22, 2015.

Annual Report 2015-16
69
ii. Shareholding of promoters
Shareholding at the beginning of the year Share holding at the end of the year
Sl. Shareholder's name No. of % of total % of shares No. of % of total % of shares % change inNo. shares shares pledged/ shares shares pledged/ share holding
of the encumbered of the encumbered during theCompany to total Company to total year
shares shares
1. Mr. P.V. Ramprasad Reddy 9,000,000 3.08 – 18,000,000 3.08 – –
2. Mrs. P. Suneela Rani 100,661,990 34.48 0.99 205,036,760 35.04 0.62 0.56
3. Mrs. K. Kirthi Reddy 10,350,000 3.54 0.03 207,00,000 3.54 0.03 –
4. Mr. K. Nithyananda Reddy 13,762,350 4.71 0.70 27,524,700 4.71 0.14 –
5. Mrs. K. Rajeswari 1,037,750 0.36 – 1,775,500 0.30 0.03 -0.01
6. Trident Chemphar Limited 6,073,613 2.08 0.79 12,147,226 2.08 0.07 –
7. Mrs. Kambam Spoorthi 3,800,000 1.30 0.27 7,600,000 1.30 0.42 –
8. Dr. M. Sivakumaran 7,345,680 2.52 – 14,691,360 2.51 – -0.01
9. Mr. P. Rohit Reddy 1,840,000 0.63 – – – – -0.63
10. Mrs. P. Neha Reddy 65,000 0.02 – 130,000 0.02 – 0.02
11. Mr. P. Sarath Chandra Reddy 16,390 0.01 – – – – -0.01
12. Axis Clinicals Limited 2,618,745 0.90 0.35 5,237,490 0.90 0.18 –
13. Mr. K. Prasad Reddy 200,578 0.07 0.04 301,156 0.05 0.05 -0.02
14. Mr. M. Sumanth Kumar Reddy 800,000 0.27 0.26 1,600,000 0.27 0.16 –
15. Mr. K. Suryaprakash Reddy 3,690 – – 7,920 – – –
Total 157,575,786 53.97 3.43 314,751,572 53.79 1.70 -0.18
*During the year, the Company has issued bonus shares in the ratio of 1:1 on July 22, 2015.
iii. Change in promoters' shareholding (please specify, if there is no change)
Shareholding at the beginning Cumulative shareholdingof the year during the year
Sl. No. of shares % of total shares No. of shares % of total sharesNo. of the Company of the Company
At the beginning of the year 157,575,786 53.97 157,575,786 53.97
Datewise increase/decrease in promoters shareholding during the year specifying the reasonsfor increase/decrease (e.g. allotment/transfer/bonus/sweat equity etc)
April 24, 2015 -150,000 -0.05 157,425,786 53.92
June 12, 2015 -1,840,000 -0.63 155,585,786 53.29
June 12, 2015 1,840,000 0.63 157,425,786 53.92
June 19, 2015 -16,390 -0.01 157,409,396 53.92
June 19, 2015 16,390 0.01 157,425,786 53.92
July 28, 2015* 157,425,786 – 314,851,572 53.92
December 18, 2015 -100,000 -0.02 314,751,572 53.90
At the end of the year 314,751,572 53.79
* During the year, the Company has issued bonus shares in the ratio of 1:1 on July 22, 2015 which was credited to the respective accounts on July 28, 2015.
** Percentage change is also due to issue and allotment of shares under ESOP to the employees of the Company and consequent increase in the total sharecapital of the Company.

70
iv. Shareholding pattern of top ten shareholders (other than directors, promoters and holders of GDRs and ADRs)
Shareholding at the beginning Cumulative shareholdingSl. Name of the shareholder of the year during the yearNo. No. of shares % of total shares No. of shares % of total shares
of the Company of the Company
1. HDFC Trustee Company Limited-HDFC Equity Fund
At the beginning of the year 13,949,091 4.78 13,949,091 4.78
April 10, 2015 175,000 0.06 14,124,091 4.84
May 1, 2015 75,000 0.03 14,199,091 4.86
May 1, 2015 -230,000 -0.08 13,969,091 4.78
May 8, 2015 -372,000 -0.13 13,597,091 4.66
May 15, 2015 -300,000 -0.10 13,297,091 4.55
June 5, 2015 -360,000 -0.12 12,937,091 4.43
June 12, 2015 -154,752 -0.05 12,782,339 4.38
June 19, 2015 -170,000 -0.06 12,612,339 4.32
June 30, 2015 35,000 0.01 12,647,339 4.33
July 3, 2015 -181,000 -0.06 12,466,339 4.27
July 10, 2015 -215,000 -0.07 12,251,339 4.20
July 17, 2015 -69,750 -0.02 12,181,589 4.17
July 24, 2015 26,000 0.01 12,207,589 4.18
July 24, 2015 -601,000 -0.21 11,606,589 3.98
July 31, 2015 12,095,089 2.07 23,701,678 4.06
August 07, 2015 46,000 0.01 23,747,678 4.07
August 07, 2015 -50,000 -0.01 23,697,678 4.06
August 14, 2015 29,500 0.01 23,727,178 4.06
August 14, 2015 -310,000 -0.05 23,417,178 4.01
August 21, 2015 -440,000 -0.08 22,977,178 3.93
September 11, 2015 5,500 0.00 22,982,678 3.94
September 11, 2015 -398,000 -0.07 22,584,678 3.87
September 18, 2015 -276,302 -0.05 22,308,376 3.82
September 25, 2015 -300,000 -0.05 22,008,376 3.77
September 30, 2015 213,500 0.04 22,221,876 3.81
October 16, 2015 -300,000 -0.05 21,921,876 3.75
October 23, 2015 -219,000 -0.04 21,702,876 3.72
October 30, 2015 -202,000 -0.03 21,500,876 3.68
November 6, 2015 53,900 0.01 21,554,776 3.69
November 13, 2015 -192,000 -0.03 21,362,776 3.66
November 27, 2015 -50,000 -0.01 21,312,776 3.65
December 4, 2015 124,600 0.02 21,437,376 3.67
December 4, 2015 -50,000 -0.01 21,387,376 3.66
December 11, 2015 88,900 0.02 21,476,276 3.68
December 11, 2015 -135,000 -0.02 21,341,276 3.65
December 18, 2015 76,300 0.01 21,417,576 3.67
December 25, 2015 163,800 0.03 21,581,376 3.70
December 31, 2015 46,200 0.01 21,627,576 3.70
January 1, 2016 630,000 0.11 22,257,576 3.81
January 8, 2016 -28,000 0.00 22,229,576 3.81
January 15, 2016 -285,400 -0.05 21,944,176 3.76
February 05, 2016 -100,000 -0.02 21,844,176 3.74
February 12, 2016 53,600 0.01 21,897,776 3.74
(Contd.)

Annual Report 2015-16
71
Shareholding pattern of top ten shareholders (Contd.)
Shareholding at the beginning Cumulative shareholdingSl. Name of the shareholder of the year during the yearNo. No. of shares % of total shares No. of shares % of total shares
of the Company of the Company
(Contd.)
January 12, 2016 -475,116 -0.08 21,422,660 3.66
February 19, 2016 1260,400 0.22 22,683,060 3.88
February 19, 2016 -6,300 0.00 22,676,760 3.88
February 26, 2016 16,100 0.00 22,692,860 3.88
March 4, 2016 687,000 0.12 23,379,860 4.00
March 4, 2016 -7,700 0.00 23,372,160 4.00
March 11, 2016 -634,900 -0.11 22,737,260 3.89
March 18, 2016 579,100 0.10 23,316,360 3.98
March 18, 2016 -732,338 -0.13 22,584,022 3.86
March 25, 2016 526,438 0.09 23,110,460 3.95
March 25, 2016 -700 0.00 23,109,760 3.95
March 31, 2016 100,000 0.02 23,209,760 3.97
March 31, 2016 -25,900 0.00 23,183,860 3.96
At the end of the year (or on the date of separation,if separated during the year) 23,183,860 3.96
2. Stichting Depositary APG Emerging Markets Equity Pool
At the beginning of the year – – – –
August 21, 2015 9,191,273 1.57 9,191,273 1.57
September 11, 2015 19,005 0.00 9,210,278 1.58
December 4, 2015 -125,918 -0.02 9,084,360 1.56
January 8, 2016 -265,057 -0.05 8,819,303 1.51
January 15, 2016 -512,101 -0.09 8,307,202 1.42
January 29, 2016 -96,114 -0.02 8,211,088 1.40
February 26, 2016 -781,024 -0.13 7,430,064 1.27
March 4, 2016 41,552 0.01 7,471,616 1.28
March 18, 2016 -26,182 0.00 7,445,434 1.27
At the end of the year (or on the date of separation,if separated during the year) 7,445,434 1.27
3. SBI Pharma Fund
At the beginning of the year 421,699 0.14 421,699 0.14
April 10, 2015 125,000 0.04 546,699 0.19
April 17, 2015 40,000 0.01 586,699 0.20
May 15, 2015 37,500 0.01 624,199 0.21
May 15, 2015 -24 0.00 624,175 0.21
May 22, 2015 -29 0.00 624,146 0.21
May 29, 2015 20,000 0.01 644,146 0.22
June 05, 2015 79 0.00 644,225 0.22
June 26, 2015 60 0.00 644,285 0.22
July 03, 2015 28 0.00 644,313 0.22
July 10, 2015 6,750 0.00 651,063 0.22
July 17, 2015 4 0.00 651,067 0.22
July 31, 2015 651,067 0.11 1,302,134 0.22
August 07, 2015 303,508 0.05 1,605,642 0.27
August 14, 2015 -120 0.00 1,605,522 0.27
August 21, 2015 120,011 0.02 1,725,533 0.30

72
(Contd.)
Shareholding pattern of top ten shareholders (Contd.)
Shareholding at the beginning Cumulative shareholdingSl. Name of the shareholder of the year during the yearNo. No. of shares % of total shares No. of shares % of total shares
of the Company of the Company
August 28, 2015 182,741 0.03 1,908,274 0.33
September 4, 2015 40,000 0.01 1,948,274 0.33
September 11, 2015 70,000 0.01 2,018,274 0.35
September 18, 2015 97,259 0.02 2,115,533 0.36
September 25, 2015 30,000 0.01 2,145,533 0.37
September 25, 2015 -2,700 0.00 2,142,833 0.37
September 30, 2015 -23 0.00 2,142,810 0.37
October 23, 2015 -78 0.00 2,142,732 0.37
October 30, 2015 700 0.00 2,143,432 0.37
November 6, 2015 3 0.00 2,143,435 0.37
November 20, 2015 -40,000 -0.01 2,103,435 0.36
December 4, 2015 106,400 0.02 2,209,835 0.38
December 18, 2015 30,000 0.01 2,239,835 0.38
December 25, 2015 -2 0.00 2,239,833 0.38
December 31, 2015 8 0.00 2,239,841 0.38
January 8, 2016 40,000 0.01 2,279,841 0.39
January 15, 2016 5,000 0.00 2,284,841 0.39
January 29, 2016 5,000 0.00 2,289,841 0.39
February 05, 2016 534,835 0.09 2,824,676 0.48
February 12, 2016 1,474,393 0.25 4,299,069 0.74
February 19, 2016 533,010 0.09 4,832,079 0.83
February 26, 2016 200,000 0.03 5,032,079 0.86
March 4, 2016 302,714 0.05 5,334,793 0.91
March 18, 2016 90,000 0.02 5,424,793 0.93
March 18, 2016 -59,500 -0.01 5,365,293 0.92
March 25, 2016 100,000 0.02 5,465,293 0.93
At the end of the year (or on the date of separation,if separated during the year) 5,465,293 0.93
4. Government of Singapore Investment Corporation A/c
At the beginning of the year 782,601 0.27 782,601 0.27
April 10, 2015 19,039 0.01 801,640 0.27
April 24, 2015 48,169 0.02 849,809 0.29
April 24, 2015 -1,611 0.00 848,198 0.29
May 1, 2015 -53,360 -0.02 794,838 0.27
May 8, 2015 -38,284 -0.01 756,554 0.26
June 5, 2015 5,692 0.00 762,246 0.26
June 12, 2015 -2,664 0.00 759,582 0.26
June 26, 2015 135,495 0.05 895,077 0.31
June 30, 2015 49,583 0.02 944,660 0.32
July 3, 2015 48,509 0.02 993,169 0.34
July 10, 2015 31,486 0.01 1,024,655 0.35
July 24, 2015 46,527 0.02 1,071,182 0.37
July 31, 2015 1,062,797 0.18 2,133,979 0.37
August 7, 2015 94,548 0.02 2,228,527 0.38
August 21, 2015 545,217 0.09 2,773,744 0.47

Annual Report 2015-16
73
Shareholding pattern of top ten shareholders (Contd.)
Shareholding at the beginning Cumulative shareholdingSl. Name of the shareholder of the year during the yearNo. No. of shares % of total shares No. of shares % of total shares
of the Company of the Company
August 28, 2015 342,083 0.06 3,115,827 0.53
September 4, 2015 695,951 0.12 3,811,778 0.65
September 11, 2015 -113,489 -0.02 3,698,289 0.63
October 2, 2015 53,969 0.01 3,752,258 0.64
October 9, 2015 183,948 0.03 3,936,206 0.67
October 23, 2015 -4,000 0.00 3,932,206 0.67
October 30, 2015 -57,983 -0.01 3,874,223 0.66
November 6, 2015 -8,875 0.00 3,865,348 0.66
November 13, 2015 273,400 0.05 4,138,748 0.71
November 20, 2015 -144,258 -0.02 3,994,490 0.68
December 4, 2015 -11,160 0.00 3,983,330 0.68
December 11, 2015 -1,600 0.00 3,981,730 0.68
December 18, 2015 4 0.00 3,981,734 0.68
December 31, 2015 -20,923 0.00 3,960,811 0.68
January 8, 2016 65,828 0.01 4,026,639 0.69
January 15, 2016 -3,864 0.00 4,022,775 0.69
January 22, 2016 -11 0.00 4,022,764 0.69
January 29, 2016 130,388 0.02 4,153,152 0.71
February 5, 2016 181,034 0.03 4,334,186 0.74
February 12, 2016 -106,715 -0.02 4,227,471 0.72
February 19, 2016 -38,807 -0.01 4,188,664 0.72
February 26, 2016 -91,768 -0.02 4,096,896 0.70
March 4, 2016 102,174 0.02 4,199,070 0.72
March 4, 2016 -17,551 0.00 4,181,519 0.72
March 11, 2016 -2,586 0.00 4,178,933 0.71
March 31, 2016 150,972 0.03 4,329,905 0.74
At the end of the year (or on the date of separation,if separated during the year) 4,329,905 0.74
5. Stichting Pensioenfonds ABP
At the beginning of the year 4,172,709 1.43 4,172,709 1.43
May 8, 2015 -9,385 0.00 4,163,324 1.43
May 15, 2015 178,933 0.06 4,342,257 1.49
May 29, 2015 -71,639 -0.02 4,270,618 1.46
June 12, 2015 44,946 0.02 4,315,564 1.48
June 19, 2015 119,126 0.04 4,434,690 1.52
July 10, 2015 99,310 0.03 4,534,000 1.55
July 17, 2015 3,960 0.00 4,537,960 1.55
July 31, 2015 4,623,631 0.79 9,161,591 1.57
August 7, 2015 29,682 0.01 9,191,273 1.57
August 21, 2015 -9,191,273 -1.57 – –
At the end of the year (or on the date of separation,if separated during the year) – –
6. Abu Dhabi Investment Authority - Behave Holdings
At the beginning of the year 4,042,532 1.38 4,042,532 1.38
April 10, 2015 20,601 0.01 4,063,133 1.39
(Contd.)

74
Shareholding pattern of top ten shareholders (Contd.)
Shareholding at the beginning Cumulative shareholdingSl. Name of the shareholder of the year during the yearNo. No. of shares % of total shares No. of shares % of total shares
of the Company of the Company
April 17, 2015 4,854 0.00 4,067,987 1.39
April 17, 2015 -109,458 -0.04 3,958,529 1.36
May 1, 2015 14,069 0.00 3,972,598 1.36
May 1, 2015 -14,069 0.00 3,958,529 1.36
May 22, 2015 -17,400 -0.01 3,941,129 1.35
May 29, 2015 -194,208 -0.07 3,746,921 1.28
June 5, 2015 10,700 0.00 3,757,621 1.29
June 5, 2015 -57,402 -0.02 3,700,219 1.27
June 12, 2015 -745 0.00 3,699,474 1.27
June 19, 2015 8,400 0.00 3,707,874 1.27
June 26, 2015 400,000 0.14 4,107,874 1.41
July 3, 2015 167,000 0.06 4,274,874 1.46
July 10, 2015 17,200 0.01 4,292,074 1.47
July 31, 2015 4,292,074 0.73 8,584,148 1.47
August 14, 2015 7,333 0.00 8,591,481 1.47
August 21, 2015 382,276 0.07 8,973,757 1.54
August 28, 2015 -31,812 -0.01 8,941,945 1.53
September 4, 2015 37,000 0.01 8,978,945 1.54
September 4, 2015 -69,935 -0.01 8,909,010 1.53
September 18, 2015 -14,950 0.00 8,894,060 1.52
September 25, 2015 -107,862 -0.02 8,786,198 1.50
October 23, 2015 244,175 0.04 9,030,373 1.55
October 23, 2015 -260,124 -0.04 8,770,249 1.50
November 6, 2015 464,524 0.08 9,234,773 1.58
November 13, 2015 613,009 0.10 9,847,782 1.69
November 13, 2015 -613,009 -0.10 9,234,773 1.58
November 20, 2015 -233,397 -0.04 9,001,376 1.54
November 27, 2015 -54,914 -0.01 8,946,462 1.53
December 4, 2015 -177,392 -0.03 8,769,070 1.50
December 11, 2015 -403,465 -0.07 8,365,605 1.43
December 18, 2015 -397,837 -0.07 7,967,768 1.36
December 25, 2015 -141,763 -0.02 7,826,005 1.34
January 22, 2016 14,300 0.00 7,840,305 1.34
January 29, 2016 190,594 0.03 8,030,899 1.37
February 5, 2016 22,427 0.00 8,053,326 1.38
February 26, 2016 268,000 0.05 8,321,326 1.42
February 26, 2016 -23,426 0.00 8,297,900 1.42
March 4, 2016 160,000 0.03 8,457,900 1.45
March 4, 2016 -32,601 -0.01 8,425,299 1.44
March 11, 2016 218,965 0.04 8,644,264 1.48
March 18, 2016 1,000,295 0.17 9,644,559 1.65
March 18, 2016 -465,003 -0.08 9,179,556 1.57
March 25, 2016 83,205 0.01 9,262,761 1.58
At the end of the year (or on the date of separation,if separated during the year) 9,262,761 1.58
(Contd.)

Annual Report 2015-16
75
Shareholding pattern of top ten shareholders (Contd.)
Shareholding at the beginning Cumulative shareholdingSl. Name of the shareholder of the year during the yearNo. No. of shares % of total shares No. of shares % of total shares
of the Company of the Company
7. Morgan Stanley Asia (Singapore) PTE
At the beginning of the year 3,401,742 1.17 3,401,742 1.17
April 10, 2015 -1,296,191 -0.44 2,105,551 0.72
April 17, 2015 -226,721 -0.08 1,878,830 0.64
April 24, 2015 -386,052 -0.13 1,492,778 0.51
May 1, 2015 -343,882 -0.12 1,148,896 0.39
May 8, 2015 -152,158 -0.05 996,738 0.34
May 15, 2015 -237,693 -0.08 759,045 0.26
May 22, 2015 -9,998 0.00 749,047 0.26
May 29, 2015 -3,893 0.00 745,154 0.26
June 5, 2015 67,159 0.02 812,313 0.28
June 12, 2015 27,252 0.01 839,565 0.29
June 19, 2015 -1,750 0.00 837,815 0.29
June 26, 2015 -166,047 -0.06 671,768 0.23
June 30, 2015 -175,399 -0.06 496,369 0.17
July 3, 2015 2,899 0.00 499,268 0.17
July 17, 2015 -750 0.00 498,518 0.17
July 24, 2015 15,608 0.01 514,126 0.18
July 31, 2015 506,122 0.09 1,020,248 0.17
August 7, 2015 -37,744 -0.01 982,504 0.17
August 14, 2015 31,002 0.01 1,013,506 0.17
August 21, 2015 -3,221 0.00 1,010,285 0.17
August 28, 2015 -10,544 0.00 999,741 0.17
September 4, 2015 125,300 0.02 1,125,041 0.19
September 11, 2015 5,354 0.00 1,130,395 0.19
September 25, 2015 11,277 0.00 1,141,672 0.20
September 30, 2015 -78,853 -0.01 1,062,819 0.18
October 2, 2015 -3 0.00 1,062,816 0.18
October 9, 2015 -15,704 0.00 1,047,112 0.18
October 16, 2015 1,468 0.00 1,048,580 0.18
October 23, 2015 -53,358 -0.01 995,222 0.17
October 30, 2015 -26,587 0.00 968,635 0.17
November 6, 2015 -9,039 0.00 959,596 0.16
November 13, 2015 -114,367 -0.02 845,229 0.14
November 20, 2015 12,703 0.00 857,932 0.15
November 27, 2015 455 0.00 858,387 0.15
December 4, 2015 -2,205 0.00 856,182 0.15
December 11, 2015 -229 0.00 855,953 0.15
December 18, 2015 2,998 0.00 858,951 0.15
December 25, 2015 1,592 0.00 860,543 0.15
December 31, 2015 14,899 0.00 875,442 0.15
January 8, 2016 -9,255 0.00 866,187 0.15
January 15, 2016 9 0.00 866,196 0.15
January 22, 2016 -12,410 0.00 853,786 0.15
January 29, 2016 2,605 0.00 856,391 0.15
(Contd.)
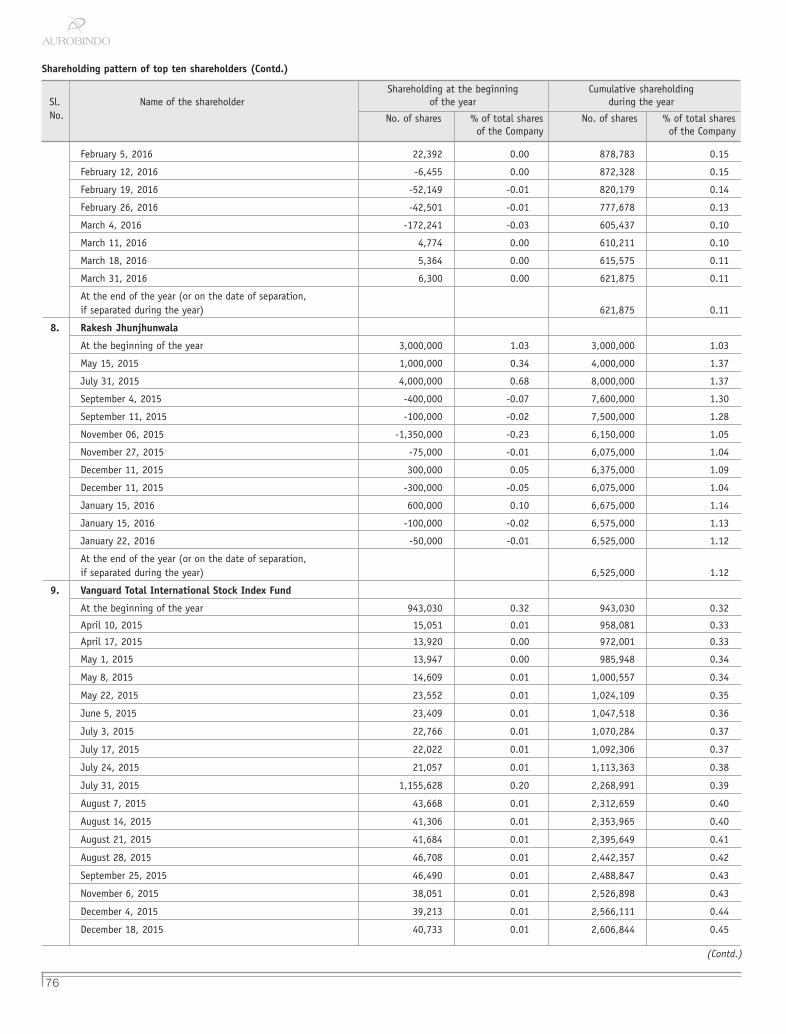
76
(Contd.)
Shareholding pattern of top ten shareholders (Contd.)
Shareholding at the beginning Cumulative shareholdingSl. Name of the shareholder of the year during the yearNo. No. of shares % of total shares No. of shares % of total shares
of the Company of the Company
February 5, 2016 22,392 0.00 878,783 0.15
February 12, 2016 -6,455 0.00 872,328 0.15
February 19, 2016 -52,149 -0.01 820,179 0.14
February 26, 2016 -42,501 -0.01 777,678 0.13
March 4, 2016 -172,241 -0.03 605,437 0.10
March 11, 2016 4,774 0.00 610,211 0.10
March 18, 2016 5,364 0.00 615,575 0.11
March 31, 2016 6,300 0.00 621,875 0.11
At the end of the year (or on the date of separation,if separated during the year) 621,875 0.11
8. Rakesh Jhunjhunwala
At the beginning of the year 3,000,000 1.03 3,000,000 1.03
May 15, 2015 1,000,000 0.34 4,000,000 1.37
July 31, 2015 4,000,000 0.68 8,000,000 1.37
September 4, 2015 -400,000 -0.07 7,600,000 1.30
September 11, 2015 -100,000 -0.02 7,500,000 1.28
November 06, 2015 -1,350,000 -0.23 6,150,000 1.05
November 27, 2015 -75,000 -0.01 6,075,000 1.04
December 11, 2015 300,000 0.05 6,375,000 1.09
December 11, 2015 -300,000 -0.05 6,075,000 1.04
January 15, 2016 600,000 0.10 6,675,000 1.14
January 15, 2016 -100,000 -0.02 6,575,000 1.13
January 22, 2016 -50,000 -0.01 6,525,000 1.12
At the end of the year (or on the date of separation,if separated during the year) 6,525,000 1.12
9. Vanguard Total International Stock Index Fund
At the beginning of the year 943,030 0.32 943,030 0.32
April 10, 2015 15,051 0.01 958,081 0.33
April 17, 2015 13,920 0.00 972,001 0.33
May 1, 2015 13,947 0.00 985,948 0.34
May 8, 2015 14,609 0.01 1,000,557 0.34
May 22, 2015 23,552 0.01 1,024,109 0.35
June 5, 2015 23,409 0.01 1,047,518 0.36
July 3, 2015 22,766 0.01 1,070,284 0.37
July 17, 2015 22,022 0.01 1,092,306 0.37
July 24, 2015 21,057 0.01 1,113,363 0.38
July 31, 2015 1,155,628 0.20 2,268,991 0.39
August 7, 2015 43,668 0.01 2,312,659 0.40
August 14, 2015 41,306 0.01 2,353,965 0.40
August 21, 2015 41,684 0.01 2,395,649 0.41
August 28, 2015 46,708 0.01 2,442,357 0.42
September 25, 2015 46,490 0.01 2,488,847 0.43
November 6, 2015 38,051 0.01 2,526,898 0.43
December 4, 2015 39,213 0.01 2,566,111 0.44
December 18, 2015 40,733 0.01 2,606,844 0.45

Annual Report 2015-16
77
Shareholding pattern of top ten shareholders (Contd.)
Shareholding at the beginning Cumulative shareholdingSl. Name of the shareholder of the year during the yearNo. No. of shares % of total shares No. of shares % of total shares
of the Company of the Company
January 15, 2016 38,516 0.01 2,645,360 0.45
January 22, 2016 42,298 0.01 2,687,658 0.46
February 19, 2016 45,755 0.01 2,733,413 0.47
March 4, 2016 55,797 0.01 2,789,210 0.48
At the end of the year (or on the date of separation,if separated during the year) 2,789,210 0.48
10. Morgan Stanley Mauritius Company Limited
At the beginning of the year 556,480 0.19 556,480 0.19
April 10, 2015 -895 0.00 555,585 0.19
April 17, 2015 -2,258 0.00 553,327 0.19
May 8, 2015 32,266 0.01 585,593 0.20
May 15, 2015 -23,719 -0.01 561,874 0.19
May 22, 2015 -11,829 0.00 550,045 0.19
May 29, 2015 6,000 0.00 556,045 0.19
June 5, 2015 157,750 0.05 713,795 0.24
June 26, 2015 -1,543 0.00 712,252 0.24
June 30, 2015 1,622,998 0.56 2,335,250 0.80
July 3, 2015 -167,225 -0.06 2,168,025 0.74
July 17, 2015 -102,266 -0.04 2,065,759 0.71
July 24, 2015 -299,545 -0.10 1,766,214 0.60
July 31, 2015 2,051,869 0.35 3,818,083 0.65
August 7, 2015 -352,880 -0.06 3,465,203 0.59
August 14, 2015 -144,471 -0.02 3,320,732 0.57
August 21, 2015 -155,786 -0.03 3,164,946 0.54
August 28, 2015 328,886 0.06 3,493,832 0.60
September 04, 2015 856,666 0.15 4,350,498 0.74
September 11, 2015 -7,193 0.00 4,343,305 0.74
September 25, 2015 12,000 0.00 4,355,305 0.75
October 23, 2015 -226,459 -0.04 4,128,846 0.71
October 30, 2015 -1,300,000 -0.22 2,828,846 0.48
November 06, 2015 11,800 0.00 2,840,646 0.49
November 20, 2015 78,549 0.01 2,919,195 0.50
December 25, 2015 2,800 0.00 2,921,995 0.50
December 31, 2015 3,542 0.00 2,925,537 0.50
January 1, 2016 18,900 0.00 2,944,437 0.50
January 8, 2016 3,500 0.00 2,947,937 0.50
January 15, 2016 1,400 0.00 2,949,337 0.51
February 5, 2016 179,200 0.03 3,128,537 0.53
February 12, 2016 3,500 0.00 3,132,037 0.54
February 26, 2016 1,400 0.00 3,133,437 0.54
March 4, 2016 -714,351 -0.12 2,419,086 0.41
March 11, 2016 -74,895 -0.01 2,344,191 0.40
March 31, 2016 306,600 0.05 2,650,791 0.45
At the end of the year (or on the date of separation,if separated during the year) 2,650,791 0.45
(Contd.)
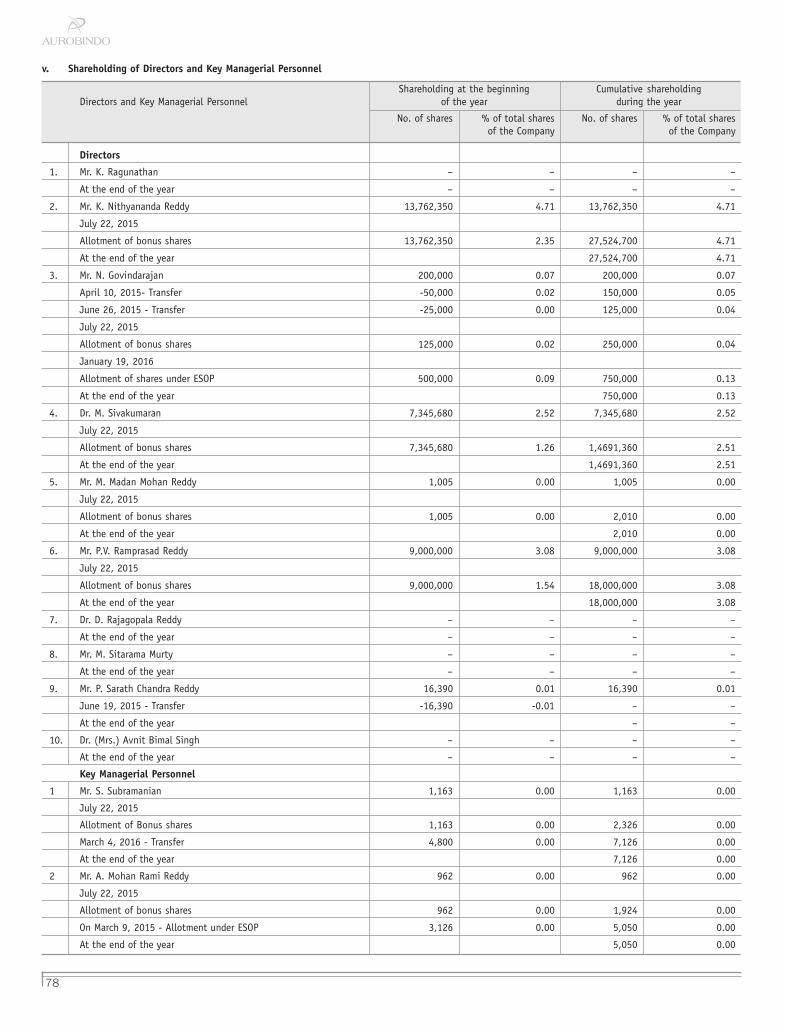
78
v. Shareholding of Directors and Key Managerial Personnel
Shareholding at the beginning Cumulative shareholdingDirectors and Key Managerial Personnel of the year during the year
No. of shares % of total shares No. of shares % of total sharesof the Company of the Company
Directors
1. Mr. K. Ragunathan – – – –
At the end of the year – – – –
2. Mr. K. Nithyananda Reddy 13,762,350 4.71 13,762,350 4.71
July 22, 2015
Allotment of bonus shares 13,762,350 2.35 27,524,700 4.71
At the end of the year 27,524,700 4.71
3. Mr. N. Govindarajan 200,000 0.07 200,000 0.07
April 10, 2015- Transfer -50,000 0.02 150,000 0.05
June 26, 2015 - Transfer -25,000 0.00 125,000 0.04
July 22, 2015
Allotment of bonus shares 125,000 0.02 250,000 0.04
January 19, 2016
Allotment of shares under ESOP 500,000 0.09 750,000 0.13
At the end of the year 750,000 0.13
4. Dr. M. Sivakumaran 7,345,680 2.52 7,345,680 2.52
July 22, 2015
Allotment of bonus shares 7,345,680 1.26 1,4691,360 2.51
At the end of the year 1,4691,360 2.51
5. Mr. M. Madan Mohan Reddy 1,005 0.00 1,005 0.00
July 22, 2015
Allotment of bonus shares 1,005 0.00 2,010 0.00
At the end of the year 2,010 0.00
6. Mr. P.V. Ramprasad Reddy 9,000,000 3.08 9,000,000 3.08
July 22, 2015
Allotment of bonus shares 9,000,000 1.54 18,000,000 3.08
At the end of the year 18,000,000 3.08
7. Dr. D. Rajagopala Reddy – – – –
At the end of the year – – – –
8. Mr. M. Sitarama Murty – – – –
At the end of the year – – – –
9. Mr. P. Sarath Chandra Reddy 16,390 0.01 16,390 0.01
June 19, 2015 - Transfer -16,390 -0.01 – –
At the end of the year – –
10. Dr. (Mrs.) Avnit Bimal Singh – – – –
At the end of the year – – – –
Key Managerial Personnel
1 Mr. S. Subramanian 1,163 0.00 1,163 0.00
July 22, 2015
Allotment of Bonus shares 1,163 0.00 2,326 0.00
March 4, 2016 - Transfer 4,800 0.00 7,126 0.00
At the end of the year 7,126 0.00
2 Mr. A. Mohan Rami Reddy 962 0.00 962 0.00
July 22, 2015
Allotment of bonus shares 962 0.00 1,924 0.00
On March 9, 2015 - Allotment under ESOP 3,126 0.00 5,050 0.00
At the end of the year 5,050 0.00

Annual Report 2015-16
79
V. INDEBTEDNESS
Indebtedness of the Company including interest outstanding/accrued but not due for payment (` Million)
Secured loans Unsecured loans Deposits Totalexcluding deposits indebtedness
Indebtedness at the beginning of the financial year
i. Principal amount 18,840.1 14,007.2 - 32,847.3
ii. Interest due but not paid – – – –
iii. Interest accrued but not due 87.3 – – 87.3
Total (i+ii+iii) 18,927.4 14,007.2 – 32,934.7
Change in indebtedness during the financial year
� Addition – 14,778.8 – 14,778.8
� Reduction (6,438.6) – – (6,438.6)
Net change 8,340.2
Indebtedness at the end of the financial year
i. Principal amount 12,452.6 28,786.0 – 41,238.6
ii. Interest due but not paid – – – –
iii. Interest accrued but not due 36.2 – – 36.2
Total (i+ii+iii) 12,488.8 28,786.0 – 41,274.8
VI. Remuneration of Directors and Key Managerial Personnel
A. Remuneration to Managing Director, Whole-time Directors and/or Manager (` Million)
Sl. Name TotalNo. Particulars of remuneration Mr. K. Nithyananda Mr. N. Govindarajan Dr. M. Sivakumaran Mr. M. Madan amount
Reddy Mohan Reddy
1. Gross salary
a. Salary as per provisions contained in
Section 17(1) of the Income Tax Act, 1961 12.34 20.98 12.34 13.17 58.83
b. Value of perquisites under Section 17(2)
of the Income Tax Act, 1961 1.97 4.55 1.97 2.07 10.56
c. Profits in-lieu of salary under
Section 17(3) of the Income tax Act, 1961 – – – – –
2. Stock option – 400.26 – – 400.26
3. Sweat equity – – – – –
4. Commission
- as % of profit – 65.00 – – 65.00
- others – – – – –
5. Others - Contribution to PF 0.02 0.02 0.02 0.02 0.08
Total (A) 14.33 490.81 14.33 15.26 534.73
Ceiling as per the Act (being 10% of the net profits of the Company
calculated as per Section 198 of the Companies Act, 2013) 2,193.9

80
Remuneration of Directors and Key Managerial Personnel (Contd.)
B. Remuneration to other directors (` Million)
Sl. Particulars of remuneration Name of Directors TotalNo. amount
1. Independent DirectorsMr. K. Ragunathan Mr. M. Sitarama Dr. D. Rajagopala Dr. (Mrs.) Avnit
Murty Reddy Bimal Singh
Fees for attending board/committee meetings 0.53 0.65 0.58 0.43 2.19
Commission – – – – –
Others – – – – –
Total (1) 0.53 0.65 0.58 0.43 2.19
2. Other Non-Executive DirectorsMr. P.V. Ramprasad Mr. P. Sarath
Reddy Chandra Reddy
Fees for attending board/committee meetings – – –
Commission – – –
Others – – –
Total (2) 0.15 0.40 0.55Total (B) = (1+2) 2.74Total managerial remuneration (A+B) 537.47Overall Ceiling as per the Act (being 11% of the net profits of theCompany calculated as per Section 198 of the Companies Act, 2013) 2,413.3
C. Remuneration to Key Managerial Personnel other than MD/Manager/WTD (` Million)
Sl. Key Managerial Personnel
No. Particulars of remunerationCompany Secretary CFO amount
1. Gross salary
a. Salary as per provisions contained in Section 17(1) of theIncome Tax Act, 1961 2.47 8.78 11.25
b. Value of perquisites under Section 17(2) of the Income Tax Act, 1961 0.81 3.12 3.93
c. Profits in-lieu of salary under Section 17(3) of the Income Tax Act, 1961 – – –
2. Stock option 1.71 – 1.71
3. Sweat equity – – –
4. Commission – – –
5. Others - Contribution to PF 0.02 0.02 0.04
Total 5.01 11.92 16.93
VII. Penalties/punishment/compounding of offences: Nil
Type Section of the Brief Details of penalty/punishment/ Authority Appeal made,Companies Act description compounding fees imposed [RD/NCLT/court] if any
A. Company
Penalty
Punishment
Compounding
B. Directors
Penalty
Punishment
Compounding
C. Other officers in default
Penalty
Punishment
Compounding
Nil
Total

Annual Report 2015-16
81
A. Conservation of energy
i. Steps taken or impact on conservation ofenergy:
l Energy management system was initiatedby corporate operational excellence withenergy managers in each site to focus onenergy audits and conservation schemesof each site of formulation units.
l Detailed energy audit and pumps auditsuccessfully completed with experts in 3major formulation units (Units 3, 7 and 12)which contribute 80% to the energy bill.
l Power balance initiative done to identifythe major consumers of power with focuson running hours, efficiency and powerdrawn. This gave insight of pumps,blowers, chiller compressors and AHUswhich needs technological solutions.
l Following energy schemes implementedand achieved 3-5% savings in each sites:
p Daily monitoring in standard formatof energy balance done for identifyinglosses and taking immediate actionsusing cross functional team.
p Reducing the losses on Sundays orwhen production is minimal. 2%reduction achieved at all formulationsunits.
p Use of RO water in cooling towermake up and cleaning of chillercondensers periodically as per Delta Tof cooling water, improved thereliability of chillers and overallefficiency improvement in KW/TR.
p Water management system andmapping losses done and about 300KL/day reduction achieved by closemonitoring and schemesimplementation in Units 3 and 7.
l Temperature controller arrangement forcooling tower - Saving operationexpenses.
l Air compressor pressure setting changedto save operational expenses.
l Arrangement of 200 Nm3/hr nitrogencompressor, reduced liquid nitrogenconsumption.
l Capacitors arranged for power factor,improvement from 0.984 to 0.994.
l RT pumps 3x30 hp replaced with 1x50 hppump, saved 29KW.
l Installation of VFDs for reactors.
Annexure-4Conservation of energy, technology absorption, foreign exchange earnings and outgo
(Pursuant to the provisions of Section 134(3)(m) of the Companies Act, 2013 read with the Companies (Accounts) Rules, 2014)
l Installation of voltage stabilizers forlighting.
l Replacement of low efficient motors withhigh efficient motors.
l Timer arrangement for vacuum pump.
l Installation of de-super heater in theturbine outlet steam line.
l Use of energy efficient timber coolingtower as per site conditions.
ii. Steps taken by the Company for utilizingalternate sources of energy:
l LED lights replacing conventional lights inall formulation units phase-wise and indesign stages of new units initiated andimplemented successfully.
l Implementation of use of solar power forall street lighting done in all newprojects.
iii. Capital investment on energy conservationequipments:
l Implemented Utility Management Systemsin Units 3 and 7 for all chillers and aircompressors for efficiency monitoring,energy conservation and manpowerproductivity.
l Installation of energy efficient pumpsphase wise instead of centrifugal pumpsin all cooling water and chilled watersystems. This had direct impact of about10% reduction of energy.
l Installation of variable frequency drives innon critical areas. About 30 numbersinstalled as a pilot and about 24%reduction in power consumption achieved.
l Implemented and successfullycommissioned the RO system to reuse theeffluent water to process and coolingtowers. This saved about 100 KL/dayconsumption.
l Replacement of old air compressor withnew energy efficient one at Unit 1 andUnit 9.
l Box type heat exchanger replacingconvention shell & tube type heatexchanger, which resulted in electricityand time saving at Unit 1.
l Replacing existing old cooling tower withenergy efficient timber cooling tower atUnits 5 and 8.
l VFD is installed at Unit 8 with which weget power saving and qualityimprovement.
B. Technology absorption
Efforts made towards technologyabsorption:
Technology absorption is not involved as theprocess for manufacture of active ingredients/formulation is being developed in-house bythe Company.
Benefits derived like product improvement,cost reduction, product development orimport substitution:
Cost optimization initiative with respect toless expensive active ingredients, excipients,packaging materials change over incommercialized products. These will result inannualized savings worth millions of rupeeswhen approved and implemented.
In case of imported technology (importedduring the last three years reckoned from thebeginning of the financial year): Not applicable.
Expenditure incurred on Research andDevelopment
` Million
2015-16 2014-15
Capital 306.6 416.4
Recurring 4,119.0 3,182.4
Total R&D expenditure 4,425.6 3,598.8
As a % of total grossturnover 4.75 4.37
C. Foreign exchange earnings and outgo
Foreign exchange earned in terms of actualinflows during the year and the foreignexchange outgo during the year in terms ofactual outflows:
` Million
2015-16 2014-15
Foreign exchange earned
Exports 70,926.8 62,514.1
Others 88.3 98.9
71,015.1 62,613.0
Foreign exchange outgo
Exports 26,193.3 23,271.7
Others 2,605.1 2,056.9
28,798.4 25,328.6
for and on behalf of he Board
K. RagunathanHyderabad ChairmanMay 30, 2016 DIN: 00523576

82
Annexure-5Secretarial Audit Report
For the financial year ended March 31, 2016[Pursuant to Section 204(1) of the Companies Act, 2013 and Rule No.9 of the Companies
(Appointmentand Remuneration Personnel) Rules, 2014]
The Members,
Aurobindo Pharma Limited
CIN: L24239TG1986PLC015190)
Maitri Vihar, Plot No.2, Ameerpet,
Hyderabad - 500 038, Telangana
I have conducted the secretarial audit of the
compliance of applicable statutory provisions and
the adherence to good corporate practices by
Aurobindo Pharma Limited. Secretarial Audit was
conducted in a manner that provided me a
reasonable basis for evaluating the corporate
conducts/statutory compliances and expressing my
opinion thereon.
Based on my verification of the Company's books,
papers, minute books, forms and returns filed and
other records maintained by the Company and also
the information provided and declarations made by
the Company, its officers, agents and authorized
representatives during the conduct of secretarial
audit, I hereby report that in my opinion, the
Company has, during the audit period covering the
financial year ended on March 31, 2016 complied
with the statutory provisions listed hereunder and
also that the Company has proper Board-processes
and compliance-mechanism in place to the extent,
in the manner and subject to the reporting made
hereinafter:
I have examined the books, papers, minute books,
forms and returns filed and other records
maintained by 'the Company' for the financial year
ended on March 31, 2016 according to the
provisions of:
i. The Companies Act, 2013 (the Act) and the
Rules made there under;
ii. The Securities Contracts (Regulation) Act,
1956 ('SCRA') and the Rules made there
under;
iii. The Depositories Act, 1996 and the
Regulations and Bye-laws framed there under;
iv. Foreign Exchange Management Act, 1999 and
the Rules and Regulations made there under
to the extent of Foreign Direct Investment,
Overseas Direct Investment and External
Commercial Borrowings;
v. The following Regulations and Guidelines
prescribed under the Securities and Exchange
Board of India Act, 1992 ('SEBI Act'):
a. The Securities and Exchange Board of
India (Substantial Acquisition of Shares
and Takeovers) Regulations, 2011;
b. The Securities and Exchange Board of
India (Prohibition of Insider Trading)
Regulations, 1992 and SEBI (Prohibition
of Insider Trading) Regulations, 2015;
c. The Securities and Exchange Board of
India (Issue of Capital and Disclosure
Requirements) Regulations, 2009;
d. The Securities and Exchange Board of
India (Employee Stock Option Scheme
and Employee Stock Purchase Scheme)
Guidelines, 1999/The Securities and
Exchange Board of India (Share Based
Employee Benefits) Regulations, 2014;
e. The Securities and Exchange Board of
India (Registrars to an Issue and Share
Transfer Agents) Regulations, 1993
regarding the Companies Act and
dealing with client;
vi. A.P. Shops and Establishment Act, 1988;
vii. Employees' State Insurance Act, 1948 and the
Employees' State Insurance (General)
Regulations, 1950;
viii. The Employees' Provident Funds and
Miscellaneous Provisions Act, 1952 and the
Employees' Provident Funds Scheme, 1952;
ix. The Payment of Bonus Act, 1965 and the
Payment of Bonus Rules, 1965;
x. The Contract Labour (Regulation and
Abolition) Act, 1970 and the Contract Labour
(Regulation and Abolition) Central Rules,
1971;
xi. Income Tax Act, 1961 and Rules made there
under;
xii. Service Tax Act, 1994 and Rules made there
under;
xiii. Drugs and Cosmetics Act, 1940;
xiv. Narcotic Drugs and Psychotropic Substances
Act, 1985;
xv. Indian Boilers Act, 1923 (Amended 1960) and
the Indian Boiler Regulations, 1950 and State
Rules framed under the Act.
I have also examined compliance with the
applicable clauses of the following:
i. Secretarial Standards issued by the Institute
of Company Secretaries of India;
ii. The Listing Agreement entered into by the
Company with BSE Limited and National
Stock Exchange of India Limited;
iii. Securities and Exchange Board of India
(Listing Obligations and Disclosure
Requirements) Regulations, 2015.
During the period under review, the Company has
complied with the provisions of the act, rules,
regulations, guidelines, standards, etc. except
some delay in filing Annual Performance Report
and Foreign Assets and Liabilities Reporting with
Reserve Bank of India.
I further report that the Board of Directors of the
Company is duly constituted with proper balance
of Executive Directors, Non-Executive Directors and
Independent Directors. The changes in the
composition of the Board of Directors that took
place during the period under review were carried
out in compliance with the provisions of the Act.
Adequate notice is given to all Directors to
schedule the Board Meetings, agenda and detailed
notes on agenda were sent at least seven days in
advance, and a system exists for seeking and
obtaining further information and clarifications on
the agenda items before the meeting and for
meaningful participation at the meeting.
Majority decision is carried through while the
dissenting members' views are captured and
recorded as part of the minutes.
I further report that there are adequate systems
and processes in the Company commensurate with
the size and operations of the Company to monitor
and ensure compliance with applicable laws, rules,
regulations and guidelines.
I further report that during the audit period, the
Company has issued bonus shares in the ratio
of 1:1.
S. ChidambaramPracticing Company Secretary:
Hyderabad FCS No. 3935
May 30, 2016 C P No: 2286

Annual Report 2015-16
83
Annexure-6Annual Report on Corporate Social Responsibility
1. A brief outline of the Company's Corporate Social Responsibility (CSR) policy, including overview of projects or programs proposed to be undertaken and areference to the web-link to the CSR policy and projects or programs:
a. The CSR activities undertaken can be briefly summarized as follows:
l Promoting education;
l Supporting preventive healthcare;
l Eradicating hunger, poverty & malnutrition;
l Making available safe drinking water;
l Encouraging environmental sustainability;
l Ecological balance & conservation of natural resources, and
l Sponsoring rural sports and setting up old age homes, etc.
b. The CSR Policy has been placed on the Company's website at: http://www.aurobindo.com/about-us/corporate-governance.
c. The annual report on the CSR activities of the Company during the year are also placed on the Company's website at: http://www.aurobindo.com/social-responsibility/csr-activities.
2. Composition of CSR Committee:
Name Designation
Mr. K. Nithyananda Reddy Chairman
Mr. K. Ragunathan Member
Dr. M. Sivakumaran Member
Mr. P. Sarath Chandra Reddy Member
3. Average net profit (as per Section 198 of the Companies Act, 2013) for last three financial years:
ParticularsFor the financial year
2014-15 2013-14 2012-13
Net profit as per Section 198 of the Companies Act, 2013for the preceding three financial years 19,968,441,698 16,054,997,357 6,305,113,154
`
4. a. Average net profit for three years : 14,109,517,403
b. Prescribed CSR expenditure (2% of average net profit) : 282,190,348
5. Details of CSR spend for the financial year
a. Total expenditure approved by Board : 199,773,671
b. Total amount spent during the financial year : 187,570,230
c. Total sanctioned amount yet to be spent : 12,203,441
d. Total amount yet to be sanctioned : 82,416,677
e. Amount unspent for the year 2015-16 : 94,620,118
f. Amount unspent as on March 31, 2015 : 58,533,636
g. Total amount for CSR expenditure as on March 31, 2016 : 153,153,754
(`)

84
Sl. CSR project orNo. activity identified
i. Vidya volunteers salaries,
prize distribution in
government schools,
construction/repairing of
class rooms/toilets/painting/
providing water in
government schools, colleges
& stadium under Swachh
Bharat, construction of
Government Degree College
(Patancheru), distributed
school bags & note books in
various government schools.
Aurobindo has donated
amount towards setting up of
libraries for orphans and at
government high school,
provided digital education in
10 schools, provided financial
support for educating
prisoners' children.
Donated amount to empower
women through critical
knowledge about health,
safety, self awareness,
communication skills, etc.
Aurobindo has donated
amount towards employment
enhancing vocation skills,
donated amount for police
constable coaching for the
socially & economically
backward groups, donated
amount to student towards
education purpose from
economically back ward
groups, and distributed dual
desks in various government
schools.
Sector in which theproject is covered
Promoting education
Projects or programs(1) Local area or other(2) Specify the state and districtwhere projects or programs wasundertaken
Government primary & ZP high schoolsin Patancheru, Hatnoor & JinnaramMandals, Medak District; Bachupally &Mallampet Villages, QuthubullapurMandal, Ranga Reddy District,Telangana.
Pydibhimavaram & surroundingvillages (Srikakulam & VizianagaramDistricts) of Andhra Pradesh.
Toilets construction at Siddipet,Sangareddy & Narsapur Mandals,Medak District, Telangana.
Nimmada & Ranasthalam, SrikakulamDistrict, Andhra Pradesh.
Repairs & renovation of governmentschool at Agasaladinni Village,Kowthalam Mandal, Kurnool District,Andhra Pradesh.
Donated amount towards constructionof school at Umayalpuram, PapanasamTaluq, Thanjavur District, Tamilnadu.
Construction of two class rooms anderection of gate at Government HighSchool, Polepally Village, JedcherlaMandal, Mahboobnagar District,Telangana.
10 orphanages located at Hyderabad,and at Pydibhimavaram, SrikakulamDistrict, Andhra Pradesh.
Digital education through 'GrameenaVidya' at 10 government schools inSrikakulam & Vizianagaram Districts,Andhra Pradesh.
Central Prison, Cherlapally, RangaReddy District, Telangana.
Girls studying in various governmentschools and hostels in Medak Districtof Telangana.
Towards education & employmentenhancing skills donated to'Sundarayya Vignana Kendram,'Hyderabad.
Police constable coaching at Kollapur,Mahboobnagar District, Telangana.
Chintapally Village of VizianagaramDistrict, Andhra Pradesh, Dual desksdistributed in government schools atSircilla, Gambiraopet, Yellareddypet &Mustabad Mandals, KarimnagarDistrict; ZPHS Doodi VenkatapurVillage, Rajapet Mandal, NalgondaDistrict: Pulpanoor & Kasala Villagesof Hatnoor Mandal, Medak District;Bachupally Village, QuthubullapurMandal, Ranga Reddy District,Telangana.
Vizianagaram Police School,Vizianagaram District, Andhra Pradesh.
Amountoutlay(budget)project orprogramswise
78,125,183
Amount spent on theprojects or programssub heads:
(1) Direct expenditureon projects or programs
(2) Overheads
78,125,183
Cumulativeexpenditureupto thereportingperiod
78,125,183
Amount spent:Direct or throughimplementingagency
Direct, through
NGOs
'YDO Net Work',
'Grameena Vidya'
'Family Eduvision
Foundation'
'Sundarayya
Vignana Kendram'
'Kollapur Study
Circle' &
'Voice 4 Girls'.
(Contd.)
h. Purpose for which the amount was spent on CSR during the financial year is detailed below: (`)

Annual Report 2015-16
85
Sl. CSR project orNo. activity identified
ii. Aurobindo Pharma hasDonated amount to LV PrasadEye Institute (AurobindoGeriatric Eye Care Centre),Visakhapatnam.
Under healthcare &sanitation, supplied bleachingpowder to 30 grampanchayats, donated amountto national conference heldto bring awareness on rarediseases, Aurobindo hasdonated towards construction& supply of medicalequipment to diabetichospital for senior citizens &socially, economicallybackward groups.
Aurobindo Pharma hasdonated amount for providingsafe drinking water, freedistribution of medicines,conducting health camps.
Donated towardsrehabilitation & skilldevelopment of mentally &hearing impaired handicappedchildren & adults.
Aurobindo Pharma hasdonated amount for purchaseof air conditioned ambulance,paying maintenance expensesfor two fire stations. Towardspublic safety supplied &installed CC cameras atvarious places.
iii. Aurobindo has set up waterpurification project (RO)water plants with Any TimeWater (ATW) cards & coinsystem, bore wells, sintextanks with pipelines,3 phasemotors, RO water plants.
Construction of sumps fordrinking water purpose alongwith submersible motor andother accessories.
Supplying drinking water
through water tankers.
Sector in which theproject is covered
Promotingpreventive healthcare & sanitation,road safety forpublic.
Making availablesafe drinking water
Projects or programs(1) Local area or other(2) Specify the state and districtwhere projects or programs wasundertaken
LV Prasad Eye Institute, GMRVaralaxmi Campus, Visakhapatnam,Andhra Pradesh.
Supplied bleaching powder to 30 grampanchayats in Srikakulam &Vizianagaram Districts of AndhraPradesh.
National conference on rare diseases,Vijayawada, Andhra Pradesh.
Construction of Diabetic Centre, 'Dr.Jetty Sesha Reddy Memorial Trust' atNellore District, Andhra Pradesh.
Provided free medical camps anddrinking water at Vijayawada'Visalandhra Vignana Samithi,' AndhraPradesh and at Nalgonda District,Telangana.
'Lekhadeep,' located at AG's Colony,Hyderabad, Prerna Welfare Society,Malakpet, Hyderabad, Telangana.
Provided ambulance to 'Industrial FireSafety Association,' PydibhimavaramVillage, Ranasthalam Mandal,Srikakulam District, Andhra Pradesh.
Paid maintenance expenses toIndustrial Fire Safety Association,Gundlamachnoor Village, HatnoorMandal, Medak District;
Installed CC cameras at Jedcherlatown of Mahboobnagar District;Ramchandrapuram to Isnapur CrossRoads at Medak District; Banjara Hills& SR Nagar police station jurisdictionin Hyderabad and at YadaramJunction, Shameerpet Mandal,Rangareddy District, Telangana.
Borapatla Village, Hatnoor Mandal ofMedak District, Telangana.
RO water plant at KamireddygaripalliVillage & Post, Chitoor District &several villages of Srikakulam,Vizianagaram & VisakhapatnamDistricts of Andhra Pradesh.Polepally Village, Jedcherla Mandal,Mahboobnagar District, Telangana.Pydibhimavaram and surroundingvillages at Srikakulam District ofAndhra Pradesh.Several villages in Patancheru Mandalof Medak District, Telangana.Installed RO water plants at CentralPrison, Cherlapally, Ranga ReddyDistrict, Telangana.
Amountoutlay(budget)project orprogramswise
35,992,693
14,875,687
Amount spent on theprojects or programssub heads:
(1) Direct expenditureon projects or programs
(2) Overheads
35,992,693
14,875,687
Cumulativeexpenditureupto thereportingperiod
114,117,876
128,993,563
Amount spent:Direct or throughimplementingagency
Direct andthrough NGO
'Dr. Jetty SeshaReddy MemorialTrust ''Lekhadeep', avoluntaryorganisation
Mallu VenkatNarsimha ReddyVignana Kendram'
Direct
(Contd.)
Purpose for which the amount was spent on CSR during the financial year is detailed (Contd.) (`)

86
Sl. CSR project orNo. activity identified
iv. Aurobindo distributed fooditems to Chennai floodvictims, under disaster relief.
Provided food items to fireaccident victims at severalvillages.
And under 'Bhojanamrita'feeding underprivilegedpeople and donated amounttowards construction ofcentralized kitchen.
Providing free meals to in-patient attendants and poorpeople. Donated operationtheatre table to governmentpublic health centre.
Aurobindo has donatedamount towards rehabilitationof children with specialneeds.
v. Aurobindo has donatedamounts to rural sportsmen &women for training in ruralsports and nationallyrecognized sports.
vi. Under 'Haritha Haram'Programme planted trees,erected cement & plastic treeguards and maintenance ofplants.
Aurobindo has donatedamount to SriVenugopalaswami MandirGoshala towards animalwelfare
vii. Contribution towards old agehome expansion 'Sai Krupa'- ahome for the aged.
Sector in which theproject is covered
Eradicating hunger,poverty, malnutritionand preventivehealth care
Promotion of ruralsports
Environmentalsustainability,ecological balance &conservation ofnatural resources &animal welfare.
Setting up ofOld age homes
Projects or programs(1) Local area or other(2) Specify the state and districtwhere projects or programs wasundertaken
Chennai city, Tamilnadu.
Murapaka Village of Laveru Mandal,Narla & Rajam Villages, SrikakulamDistrict, Andhra Pradesh.
Narsingi Village, Ranga Reddy Districtand Sangareddy Government Hospital,Medak District, Telangana.
Public Health Centre, PusapatiregaVillage & Mandal, VizianagaramDistrict, Andhra Pradesh.
Ashray-Akruti, Borabanda, Hyderabad,Telangana.
Kowkuntla Village, Chevella Mandal,Ranga Reddy District, Telangana.
Kothapalli Village, KothamunchurPost, Valmikipuram Mandal, ChittoorDistrict, Andhra Pradesh and MotiNagar, Hyderabad, Telangana.
Plastic tree guards erected atSangareddy, Siddipet & GajwelMandals in Medak District; iron treeguards erected at several villages inSircilla Mandal, Karimnagar District,Planted trees & erected tree guards atBorapatla, Gundlamachnoor Villages ofHatnoor Mandal, Pashamylaram Villageof Patancheru Mandal, & at PolepallyVillage of Mahboobnagar DistrictTelangana. Planted trees and erectedcement tree guards in PydibhimavaramVillage of Srikakulam District andMadhurawada area of VisakhapatnamDistrict of Andhra Pradesh.
Donated to 'Sri Venugopala SwamiMandir' Goshala located at JanwadaVillage, Shankarpalli Mandal, RangaReddy District, Telangana.
'Sai Krupa' - home for the aged,located at Kummarapalli Village,Chittoor District, Andhra Pradesh.
Amountoutlay(budget)project orprogramswise
27,924,000
1,725,000
7,951,922
900,000
Amount spent on theprojects or programssub heads:
(1) Direct expenditureon projects or programs
(2) Overheads
27,924,000
1,725,000
7,951,922
900,000
Cumulativeexpenditureupto thereportingperiod
156,917,563
158,642,563
166,594,485
167,494,485
Amount spent:Direct or throughimplementingagency
Direct & throughHare KrishnaCharitableFoundation &Ashray-Akruti
Direct
Direct
Sri SrinivasaCharitable Trust
(Contd.)
Purpose for which the amount was spent on CSR during the financial year is detailed (Contd.) (`)

Annual Report 2015-16
87
Sl. CSR project orNo. activity identified
viii. Laying/widening/repairing ofrural roads and constructionof village sewage waterdrainage system in severalvillages towards ruraldevelopment.
Provided drinking waterfacility and donated amounttowards skill development &employment enhancingprograms for the rural youth,donated towards freeeducation & free meals tochildren studying in ruralareas, and conducted surveysfor need assessment in twovillages for adopting them.
ix. Salaries paid by AurobindoPharma to CSR staffexclusively working on CSRactivities.
TOTAL
Sector in which theproject is covered
Rural DevelopmentProjects
CSR expenditure
Projects or programs(1) Local area or other(2) Specify the state and districtwhere projects or programs wasundertaken
Road from Narsapur Road to BorapatlaVillage & at Gundlamachnoor Villageof Hatnoor Mandal, Repairing of roadsat Ismailkhanpet, Sangareddy Mandaland at Isnapur Village, PatancheruMandal, Medak District, Telangana.
Laying/widening of roads &construction of drains fromPydibhimavaram to Saragadapeta,Ranasthalam Mandal, SrikakulamDistrict of Andhra Pradesh;
Skill development for rural youth atKollapur, Mahboobnagar District &'Navachethana Vignana Samithi'Nagole, Hyderabad. 'Jasthi VenkataiahMemorial Development Trust', locatedat Anantapur District, Andhra Pradesh;
Need assessment surveys done atBorapatla and Peyyalapalem Villagesin Medak district, Telangana andNellore district of Andhra Pradesh.
Covering all the Aurobindo PharmaLimited, India offices and facilities.
Amountoutlay(budget)project orprogramswise
14,372,716
5,703,029
187,570,230
Amount spent on theprojects or programssub heads:
(1) Direct expenditureon projects or programs
(2) Overheads
14,372,716
5,703,029
187,570,230
Cumulativeexpenditureupto thereportingperiod
181,867,201
187,570,230
187,570,230
Amount spent:Direct or throughimplementingagency
Direct andthrough NGOs‘Kollapur Studyand SkillDevelopmentSociety’ and‘JasthiVenkataiahMemorialDevelopmentTrust’.
Direct
Purpose for which the amount was spent on CSR during the financial year is detailed (Contd.) (`)
6. The Company could not spend entire two per cent of average net profits of the last three financial years. Out of the sanctioned amounts, some of the
works are ongoing projects and once the works are completed the committed amounts will be released. This entire sanctioned amount will be spent during
the financial year 2016-17. The Company is making efforts to identify the projects for spending the not-sanctioned unspent amount and the same will be
spent this current financial year 2016-17 along with the amount to be spent for the financial year 2015-16.
7. We hereby confirm that the implementation and monitoring of CSR activities is in compliance with CSR objectives and policy of the Company.
K. Nithyananda Reddy N. GovindarajanHyderabad Chairman of the CSR Committee Managing DirectorMay 30, 2016 DIN: 01284195 DIN: 00050482

88
Annexure-7Information pursuant to Section 197(12) of the Companies Act, 2013 read with Rule 5(1) of the Companies (Appointment and Remuneration of
Managerial Personnel) Rules, 2014i. Ratio of remuneration of each director to the median remuneration of the employees of the Company for the financial year
Name & designation Ratio
a. Mr. K. Nithyananda Reddy, Vice Chairman & Whole-time Director 43:1
b. Mr. N. Govindarajan, Managing Director 269:1
c. Dr. M. Sivakumaran, Whole-time Direcetor 43:1
d. Mr. M. Madan Mohan Reddy, Whole-time Director 45:1
ii. The percentage increase in remuneration of each Director, Chief Financial Officer, Chief Executive Officer, Company Secretary or Manager in the financial year
Name & designation Increment percentage
a. Mr. K. Nithyananda Reddy, Vice Chairman & Whole-time Director 36.94
b. Mr. N. Govindarajan, Managing Director 51.79
c. Dr. M. Sivakumaran, Whole-time Director 36.92
d. Mr. M. Madan Mohan Reddy, Whole-time Director 45.48
e. Mr. S. Subramanian, Chief Financial Officer 35.78
f. Mr. A. Mohan Rami Reddy, VP (Legal) & Company Secretary -15.40
iii. The percentage increase in the median remuneration of employees in the financial year was 11.42%.
iv. The number of permanent employees on the rolls of the Company as on March 31, 2016 was 13,288.
v. The explanation on the relationship between average increase in remuneration and Company performance:Average increase in remuneration: 17.55%Increase in net profit of the Company: 6.81%
vi. Comparison of the remuneration of the Key Managerial Personnel against the performance of the Company:Increase in remuneration of KMPs: 44.27%Increase in net profit of the Company: 6.81%
vii. Variations in the market capitalization of the Company, price earnings ratio as at the closing date of the current financial year and previous financial year andpercentage increase/decrease in the market quotations of the shares of the Company in comparison to the rate at which the Company came out with the lastpublic offer:
Particulars As at March 31, 2016 As at March 31, 2015
Market capitalization (` Million) BSE 435,951 BSE 356,277NSE 435,893 NSE 356,686
Price earning multiple BSE 26.87 BSE 23.46NSE 26.86 NSE 23.49
Market quotations of the shares of the Company in comparison to the rate at which the Company came out with the last public offerThe Company came out with an Initial Public Offer in the year 1994 at the price of `180 per equity share of `10 each. As on March 31, 2016 the marketquotation of the Company's Share of `1 each (Closing price) is as under:
BSE Limited: `745.00The National Stock Exchange of India Limited: `744.90
viii. Average percentile increase already made in the salaries of employees other than the managerial personnel in the last financial year and its comparison with thepercentile increase in the managerial remuneration and justification thereof and point out if there are any exceptional circumstances for increase in the managerialremuneration: The percentage increase in the salaries of employees other than the managerial personnel in the last financial year is 17.55% as against 44.27% increasein the salaries of managerial persons. The increase in salary in case of managerial persons is mainly on account of re-appointment with revision in the salary.
ix. Comparison of remuneration of each of the Key Managerial Personnel with the performance of the Company:
Increment percentage Performance of the CompanyName & designation in remuneration for the year ended
March 31, 2016
a. Mr. K. Nithyananda Reddy, Vice Chairman & Whole-time Director 36.94 Net profit of theb. Mr. N. Govindarajan, Managing Director 51.79 Company increased
c. Dr. M. Sivakumaran, Whole-time Direcetor 36.92 by 6.81%
d. Mr. M. Madan Mohan Reddy, Whole-time Director 45.48
e. Mr. S. Subramanian, Chief Financial Officer 35.78
f. Mr. A. Mohan Rami Reddy, VP(Legal) & Company Secretary -15.40
x. The key parameters for any variable component of remuneration availed by the Directors:No variable component of remuneration availed by directors except Managing Director. In addition to the salary, the Managing Director is paid commission upto 1% of the net profit of the Company subject to a ceiling of `9 crore for each financial year.The key parameters are Company performance, periodical reviews, skills and competence, etc.
xi. The ratio of the remuneration of the highest paid director to that of the employees who are not directors but receive remuneration in excess of the highest paiddirector during the year: Nil
xii. The remuneration paid to Key Managerial Persons is as per the remuneration policy of the Company.

Annual Report 2015-16
89
Anne
xure
-7 (
Cont
d.)
Fina
ncia
l ye
ar 2
015-
16
Sr.
Nam
eDe
sign
atio
nRe
mun
e-Qu
alifi
cati
on &
Date
of
Age
The
last
em
ploy
men
t he
ld b
y su
chNo
.ra
tion
Expe
rienc
eCo
mm
ence
men
t(Y
ears
)em
ploy
ee b
efor
e jo
inin
g th
ere
ceiv
edof
em
ploy
men
tCo
mpa
ny( `
Mill
ion)
1.M
r. K.
Nith
yana
nda
Redd
yVi
ce C
hairm
an &
Who
le-t
ime
Dire
ctor
14.
33M
.Sc.
, 29
year
sJa
nuar
y 1,
198
958
Tini
Pha
rma
Lim
ited
2.M
r. N.
Gov
inda
raja
nMa
nagi
ng D
irect
or 9
0.55
B.E.
, 26
year
sOc
tobe
r 7, 2
010
47Sh
asun
Che
mic
als
& Dr
ugs
Lim
ited
3.Dr
. M. S
ivak
umar
anW
hole
-tim
e Di
rect
or 1
4.33
M.S
c., P
hD.,
43 y
ears
Janu
ary
1, 1
989
73TT
K Ph
arm
a Li
mite
d4.
Mr.
M. M
adan
Moh
an R
eddy
Who
le-t
ime
Dire
ctor
15.
26M
.Sc.
, 26
year
sMa
y 27
, 200
356
Rani
t Ph
arm
a Li
mite
d5.
Mr.
G. B
hask
ar R
eddy
Asso
ciat
e Vi
ce P
resid
ent
- Op
erat
ions
6.7
1B.
Phar
m.,
20 y
ears
June
8, 1
995
45Rh
onac
Lab
Priv
ate
Lim
ited
6.Dr
. V. K
. Han
daPr
esid
ent
- Ch
emic
al R
esea
rch
18.
68Ph
D, 3
3 ye
ars
Janu
ary
1, 1
999
64Ra
nbax
y Re
sear
ch L
abor
ator
ies
7.Dr
. Sha
rma
Hem
ant
Kum
arSe
nior
Vic
e Pr
esid
ent
- AR
D 6
.36
PhD,
22
year
sJu
ly 1
4, 2
000
48Ra
nbax
y Re
sear
ch L
abor
ator
ies
8.Dr
. A. R
ama
Moha
na R
aoPr
esid
ent
- Co
rpor
ate
QA 1
3.70
PhD,
28
year
sMa
y 7,
200
154
Biol
ogic
al E
Lim
ited
9.M
r. Ja
in A
nil K
umar
*Ch
ief
Oper
atin
g Of
ficer
2.9
1B.
Tech
., M
.Tec
h., 2
4 ye
ars
July
9, 2
002
49Al
embi
c Li
mite
d10
.Dr
. A. T
. Bap
uji
Seni
or V
ice
Pres
iden
t -
CPD-
Bio
7.3
2Ph
D, 2
4 ye
ars
Octo
ber 2
5, 2
004
49Ra
nbax
y Re
sear
ch L
abor
ator
ies
11.
Mr.
Sudh
ir B.
Sin
ghi
Head
- G
loba
l Fin
ance
Ope
ratio
ns 8
.76
B.Co
m.,
C.A.
, I.C
.W.A
.I., 2
7 ye
ars
Marc
h 23
, 200
547
Proc
on F
inan
cials
and
Inve
stim
ents
Priv
ate
Lim
ited
12.
Mr.
V. N
aga
Pras
adAs
soci
ate
Pres
iden
t -
FRD
8.4
1M
.Pha
rm.,
24 y
ears
Marc
h 16
, 200
649
Ranb
axy
Rese
arch
Lab
orat
orie
s13
.M
r. M
. Ven
kate
swar
Rao
Asso
ciat
e Vi
ce P
resid
ent
- Q.
A. 6
.19
M.P
harm
., 17
yea
rsJu
ly 6
, 200
645
Ranb
axy
Labo
rato
ries
Lim
ited
14.
Mr.
Sing
h Sa
njay
*Se
nior
Vic
e Pr
esid
ent
- Op
erat
ions
5.2
0M
.B.A
., 26
yea
rsMa
rch
28, 2
011
50Ci
pla
Lim
ited
15.
Dr. K
araj
gi J
ayan
tPr
esid
ent
- FR
D 1
3.09
M.P
harm
., Ph
D, 2
5 ye
ars
Sept
embe
r 2, 2
011
49Fa
my
Care
Lim
ited
16.
Mr.
Vasu
deva
Arv
ind*
Chie
f Exe
cutiv
e Of
ficer
- O
pera
tions
6.0
4M
.Pha
rm.,
33 y
ears
Nove
mbe
r 22
, 201
256
Glen
mar
k Ph
arm
a Li
mite
d17
.Dr
. T. C
hand
iran
Seni
or V
ice
Pres
iden
t -
CRD
6.5
8M
.Sc.
, PhD
, 23
year
sDe
cem
ber
13, 2
012
52Ma
khte
shim
-Aga
n In
dia
Priv
ate
Lim
ited
18.
Mr.
Vaid
yana
than
Srin
ivas
an*
Seni
or V
ice
Pres
iden
t -
Supp
ly C
hain
Man
agem
ent
5.6
6B.
Tech
., 33
yea
rsMa
rch
13, 2
013
57Gl
enm
ark
Phar
ma
Lim
ited
19.
Mr.
Nata
raja
n Vi
jay
*Se
nior
Vic
e Pr
esid
ent
- Op
erat
ions
1.8
2M
.Tec
h, M
.B.A
., 23
yea
rsJu
ly 6
, 201
547
Dr. R
eddy
's La
bora
torie
s Li
mite
d20
.M
r. S.
Sub
ram
ania
nCh
ief
Fina
ncia
l Offi
cer
11.
92B.
Sc.,
C.A.
, C.S
., I.C
.W.A
.I., 3
0 ye
ars
Nove
mbe
r 1,
201
355
RSB
Glob
al21
.M
r. Sh
astr
y Mu
kund
Ram
aswa
my
Vice
Pre
siden
t -
Busi
ness
Dev
elop
men
t 7
.79
P.G.
D.M
., 24
yea
rsAp
ril 1
0, 2
014
45Gl
enm
ark
Phar
mac
eutic
als
Lim
ited
22.
Dr. C
hatu
rved
i San
jay*
Seni
or V
ice
Pres
iden
t -
Mark
etin
g 3
.79
M.S
c., P
hD, 2
0 ye
ars
May
30, 2
014
46IZ
EE P
harm
a23
.Dr
. T. V
. S. K
. Vitt
alSe
nior
Vic
e Pr
esid
ent
- CR
D 7
.80
PhD,
24
year
sOc
tobe
r 15,
201
446
Sai L
ife S
cien
ces
Lim
ited
24.
Mr.
Seth
Jat
inVi
ce P
resid
ent
- Su
pply
Cha
in M
anag
emen
t 6
.40
PG D
iplo
ma,
20
year
sNo
vem
ber 7
, 201
444
Cadi
la L
abor
ator
ies
Lim
ited
25.
Mr.
Shas
tri A
tul S
adas
hiv
Asso
ciat
e Pr
esid
ent
- Op
erat
ions
20.
01M
.Pha
rm.,
26 y
ears
Dece
mbe
r 8, 2
014
50Ra
nbax
y La
bora
torie
s Li
mite
d26
.M
r. Ar
avin
dan
Ragh
avan
*As
soci
ate
Vice
Pre
siden
t -
Oper
atio
nal E
xcel
lenc
e 4
.57
B.Te
ch.,
24 y
ears
June
5, 2
015
46Pi
ram
al H
ealth
care
Lim
ited
27.
Mr.
Sanj
eev
Indr
avad
an D
ani*
Chie
f Ope
ratin
g Of
ficer
- H
ead
Form
ulat
ions
22.
20B.
Phar
m.,
M.B
.A.,
32 y
ears
July
9, 2
015
56Ra
nbax
y La
bora
torie
s Li
mite
d28
.Mr
. Nur
ani H
arih
aran
Kal
yana
krish
nan*
Seni
or V
ice
Pres
iden
t -
Supp
ly C
hain
Man
agem
ent
5.0
8M
.B.A
., M
.Sc.
, 29
yea
rsAu
gust
10,
15
56Ra
nbax
y La
bora
torie
s Li
mite
d29
.M
r. Sa
tnam
Sin
gh L
oom
ba*
Seni
or V
ice
Pres
iden
t -
Oper
atio
ns 3
.34
B.Te
ch.,
25 y
ears
Dece
mbe
r 1, 2
015
48Su
n Ph
arm
aceu
tical
Ind
ustr
ies
Lim
ited
30.
Dr. N
ilend
u Se
n*Vi
ce P
resid
ent
- R&
D 4
.07
M P
harm
., Ph
D., 2
0 ye
ars
Dece
mbe
r 9, 2
015
46Zy
dus
Cadi
la L
imite
d31
.Dr
. Man
gesh
Man
ohar
Bor
kar*
Seni
or V
ice
Pres
iden
t -
Oper
atio
ns 2
.22
M.P
harm
., Ph
D, 2
4 ye
ars
Dece
mbe
r 15
, 201
549
Pfiz
er L
imite
d32
.M
r. As
hok
Kum
ar S
axen
a*Se
nior
Vic
e Pr
esid
ent
- Op
erat
ions
2.9
3B.
Phar
m.,
P.G.
D.M
., 24
yea
rsDe
cem
ber
17, 2
015
46Sh
alin
e He
alth
care
, Du
bai
33.
Mr.
Sudh
ansh
u Ra
dhak
rishn
a Ka
mat
*Vi
ce P
resid
ent
- Bu
sine
ss D
evel
opm
ent
1.2
7B.
Com
., 25
yea
rsFe
brua
ry 1
, 201
651
Myla
n La
bora
torie
s Li
mite
d34
.Dr
. Mak
kapa
ti Sa
taka
rni*
Pres
iden
t -
Biol
ogic
s 6
.77
B.Te
ch.,
PhD,
9 y
ears
Febr
uary
3, 2
016
35In
tas
Phar
ma
Lim
ited
Not
e:1.
Gros
s re
mun
erat
ion
incl
udes
sal
ary,
tax
able
allo
wan
ces,
com
mis
sion
, va
lue
of p
erqu
isit
es a
s pe
r th
e In
com
e Ta
x Ru
les,
196
2 an
d Co
mpa
ny c
ontr
ibut
ion
to p
rovi
dend
fun
d.2.
Natu
re o
f em
ploy
men
t an
d du
ties
: Co
ntra
ctua
l and
in
acco
rdan
ce w
ith
term
s an
d co
ndit
ions
as
per
Com
pany
's ru
les.
3.No
em
ploy
ee is
a r
elat
ive
of a
ny d
irect
or o
r Ke
y M
anag
eria
l Per
sonn
el o
f th
e Co
mpa
ny e
xcep
t M
r. K.
Nit
hyan
anda
Red
dy,
who
is a
rel
ativ
e of
Mr.
P. S
arat
h Ch
andr
a Re
ddy,
Dire
ctor
of
the
Com
pany
.4.
The
perc
enta
ge o
f eq
uity
sha
res
held
by
each
of
the
empl
oyee
in t
he C
ompa
ny w
ithi
n th
e m
eani
ng o
f cl
ause
(iii
) of
sub
-rul
e (2
) of
Rul
e 5
is n
ot a
pplic
able
.*
Empl
oyed
for
the
par
t of
the
fin
anci
al y
ear.
for
and
on b
ehal
f of
he
Boar
d
K. R
agun
atha
nH
yder
abad
Chai
rman
May
30,
201
6DI
N: 0
0523
576

90
COMPANY'S PHILOSOPHY ON CODE OF GOVERNANCE
Aurobindo has always attached great importance to good and responsible corporate governance. The Company belongs to all the stakeholders and the corporate
objective is to maximize shareholder value ethically and legally. Efforts are therefore made to raise the level of transparency, trust and confidence of stakeholders
in the way the Company is run. The team at Aurobindo operates as a trustee on behalf of every shareholder - large or small.
The Company will continue to strive to be a wealth creator to meet stakeholder expectations and be a responsible citizen in its societal commitments. In the
achievement of its goals, the Company utilizes its resources with accountability and professionalism to meet the needs of customers and deliver on their
expectations; meet the commitments with vendors, partners, employees, governments and the community.
BOARD OF DIRECTORS
The Board of Directors guides, directs and oversees the management and protects long-term interests of shareholders, employees and the society, at large. The
Board also ensures compliance of the applicable provisions and code of ethical standards wherever the Company and its subsidiaries are present.
Size and Composition of the Board
As on March 31, 2016 the Board consists of ten Directors. Four of them are Executive and six are Non-Executive Directors. Your Company has taken all necessary
steps to strengthen the Board with optimum combination of executive and non-executive/independent directors.
Composition of Board of Directors as on March 31, 2016
Number of Attendance Number of Number ofBoard at the last directorships committee
Name Category Meetings AGM held on in other positions heldattended August 27, companies* in other companies**
2015 Chairman Member
Mr. K. Ragunathan Non-Executive Independent 5 Yes 1 – – –
Mr. K. Nithyananda Reddy Promoter and Executive 6 Yes 9 – 4 27,524,700
Mr. N. Govindarajan Executive 6 Yes 5 – – 750,000
Dr. M. Sivakumaran Executive 6 Yes 4 – – 14,691,360
Mr. M. Madan Mohan Reddy Executive 6 Yes 9 – 1 2,010
Mr. P.V. Ramprasad Reddy Promoter and Non-Executive 3 No 3 – – 18,000,000
Mr. P. Sarath Chandra Reddy*** Promoter and Non-Executive 5 Yes 8 – 2 –
Mr. M. Sitarama Murty Non-Executive Independent 6 Yes 1 1 – –
Dr. D. Rajagopala Reddy Non-Executive Independent 5 Yes 2 – – –
Dr. (Mrs.) Avnit Bimal Singh Non-Executive Independent 6 Yes – – – –
* The directorships are in the companies incorporated under the Companies Act, 1956/2013.
** Includes only audit and stakeholders relationship committee
*** Mr. P. Sarath Chandra Reddy has been appointed as Whole-time Director of the Company with effect from June 1, 2016 and the category will change accordinglyas Promoter and Executive.
Note: Leave of absence was granted on request to those directors who could not attend the meeting(s).
No. of shares of`1 each held
in the Company
Report on Corporate Governance

Annual Report 2015-16
91
During the year, six Board Meetings were held on the following dates:
Date of meeting Board strength No. of Directors present
May 28, 2015 10 9
August 12, 2015 10 10
October 5, 2015 10 9
November 6, 2015 10 8
December 23, 2015 10 8
February 9, 2016 10 10
Disclosure of relationships between directors inter-se
Mr. P. Sarath Chandra Reddy, Non-Executive and Non-Independent Director of
the Company is son of Mr. P.V. Ramprasad Reddy, Director and son-in-law of
Mr. K. Nithyananda Reddy, Vice Chairman. Other than Mr. P. Sarath Chandra
Reddy, Mr. P.V. Ramprasad Reddy and Mr. K. Nithyananda Reddy, none of the
Directors are related to any other Director.
Details about familiarization program
Senior management personnel of the Company make presentations to the
Board Members on periodical basis, briefing them on the operations of the
Company, plans, strategy, risks involved, new initiatives etc. and seek their
opinions and suggestions on the same. Also, the Directors are briefed on
their specific responsibilities and duties that may arise from time to time.
Any new Director who joins the Board is presented with a brief background
of the Company, its operations and is informed of the important policies of
the Company including the Code of Conduct for Directors and senior
management personnel and the Code of Conduct for Prevention of Insider
Trading, Policy on Related Party Transactions, Policy on Remuneration, Policy
on Material Subsidiaries, Whistle Blower Policy, Risk Management Policy,
Corporate Social Responsibility Policy etc.
The details of the familiarization program are placed on the Company's
website at: http://www.aurobindo.com/aboutus/corporate-governance
Details of Directors proposed for re-appointment at the Annual General
Meeting
Mr. K. Nithyananda Reddy and Mr. M. Madan Mohan Reddy retire by rotation
and being eligible, seek re-appointment. Mr. P. Sarath Chandra Reddy is
proposed to be appointed as a Whole-time Director.
Mr. K. Nithyananda Reddy, aged 58 years, presently is a Whole-time
Director designated as Vice Chairman of the Company. He holds a Master's
Degree in Science (Organic Chemistry) and has been associated with the
Company from the initial days as a promoter, and is well versed with
manufacturing technologies, systems, processes and controls. He is a
Director on the boards of the subsidiaries of Aurobindo Pharma Limited viz.
APL Healthcare Limited, APL Research Centre Limited, Auro Peptides
Limited, Aurobindo Antibiotics Limited, AuroZymes Limited, Auronext
Pharma Private Limited, Silicon Life Sciences Private Limited and Hyacinths
Pharma Private Limited as well as Patancheru Envirotech Limited. He holds
27,524,700 equity shares of `1 each in the Company.
Mr. M. Madan Mohan Reddy, aged 56 years, presently is a Whole-time
Director of the Company. He has a Master's Degree in Science (Organic
Chemistry) and held top managerial positions in leading pharmaceutical
companies. He commands 26 years of valuable experience in the
pharmaceutical industry. He is a Director on the boards of the subsidiaries of
Aurobindo Pharma Limited viz. Eugia Pharma Specialities Limited, Curepro
Parenterals Limited, APL Research Centre Limited, Aurobindo Antibiotics
Limited, AuroZymes Limited and also is a Director on the boards of Pravesha
Industries Private Limited, Cogent Glass Limited, Crest Cellulose Private
Limited and Oremsi Plastics Private Limited. He holds 2,010 equity shares of
`1 each in the Company.
Mr. P. Sarath Chandra Reddy, aged 31 years, is a graduate in Business
Administration. He is a second generation entrepreneur experienced in
general management and has expertise in project executions, IT,
procurement, etc. He is presently Director of PVR Holdings Private Limited.
He is also a director in subsidiary companies of Aurobindo Pharma Limited
viz., APL Health Care Limited, Auro Peptides Limited, Curepro Parenterals
Limited, Auronext Pharma Private Limited and Tergene Biotech Private
Limited. He does not hold any shares in the Company.
AUDIT COMMITTEE
The scope and function of the Audit Committee is to regularly review the
internal control, systems and procedures, accounting policies and other
matters that protect the interest of the stakeholders, ensure compliance
with the laws of the land, and monitor with a view to provide effective
supervision of the management's processes, ensure accurate, timely and
proper disclosures, transparency, integrity and quality of financial reporting.
The composition, procedures, powers and role/functions of the Audit
Committee constituted by the Company comply with the requirements of
Regulation 18 of the SEBI (Listing Obligations and Disclosure Requirements)
Regulations, 2015 and provisions of the Companies Act, 2013.
Role of Audit Committee
The role of the Audit Committee includes the following:
l Oversight of the Company's financial reporting process and the
disclosure of its financial information to ensure that the financial
statement is correct, sufficient and credible;
l Recommendation for appointment, remuneration and terms of
appointment of auditors of the Company;
l Approval of payment to statutory auditors for any other services
rendered by the statutory auditors;
l Review, with the management, the annual financial statements and
auditor's report thereon before submission to the board for approval,
with particular reference to:
u Matters required to be included in the Director's Responsibility
Statement to be included in the Board's report in terms of
clause (c) of sub-section (3) of Section 134 of the Companies
Act, 2013;
u Changes, if any, in accounting policies and practices and
reasons for the same;

92
u Major accounting entries involving estimates based on the
exercise of judgment by management;
u Significant adjustments made in the financial statements arising
out of audit findings;
u Compliance with listing and other legal requirements relating to
financial statements;
u Disclosure of any related party transactions;
u Qualifications in the draft audit report;
l Review, with the management, the quarterly financial statements
before submission to the Board for approval;
l Review, with the management, the statement of uses/application of
funds raised through an issue (public issue, rights issue, preferential
issue, etc.), the statement of funds utilized for purposes other than
those stated in the offer document/prospectus/notice and the report
submitted by the monitoring agency monitoring the utilization of
proceeds of a public or rights issue, and making appropriate
recommendations to the Board to take up steps in this matter;
l Review and monitor the auditor's independence and performance, and
effectiveness of audit process;
l Approval or any subsequent modification of transactions of the
company with related parties;
l Scrutiny of inter-corporate loans and investments;
l Valuation of undertakings or assets of the company, wherever it is
necessary;
l Evaluation of internal financial controls and risk management systems;
l Review, with the management, performance of statutory and internal
auditors, adequacy of the internal financial control systems;
l Review the adequacy of internal audit function, if any, including the
structure of the internal audit department, staffing and seniority of
the official heading the department, reporting structure coverage and
frequency of internal audit;
l Discussion with internal auditors of any significant findings and follow
up thereon;
l Review the findings of any internal investigations by the internal
auditors into matters where there is suspected fraud or irregularity or
a failure of internal control systems of a material nature and reporting
the matter to the board;
l Discussion with statutory auditors before the audit commences, about
the nature and scope of audit as well as post-audit discussion to
ascertain any area of concern;
l Examine into the reasons for substantial defaults in the payment to
the depositors, debenture holders, shareholders (in case of non-
payment of declared dividends) and creditors;
l Review the functioning of the Whistle Blower mechanism;
l Approval of appointment of CFO (i.e. the whole-time finance director
or any other person heading the finance function or discharging that
function) after assessing the qualifications, experience and
background, etc. of the candidate;
l Carry out any other function as is mentioned in the terms of reference
of the Audit Committee under the Securities and Exchange Board of
India (Listing Obligations and Disclosure Requirements) Regulations,
2015 and Companies Act, 2013.
Composition and other details of Audit Committee
The Audit Committee comprises of three Non-Executive Directors, all of them
being independent directors. The heads of finance & accounts, internal
auditors and the representative of the statutory auditors are invitees to the
meetings of the Audit Committee. The Company Secretary is the Secretary to
the Committee. The representative of the Cost Auditors is also invited to the
meetings of Audit Committee whenever matters relating to cost audit are
considered.
Mr. M. Sitarama Murty, Chairman of the Committee, is a Non-Executive,
Independent Director having expertise in accounting and financial
management. Mr. K. Ragunathan and Dr. D. Rajagopala Reddy are the
members of the Committee.
During the year, the Audit Committee met six times on May 28, 2015;
August 12, 2015; November 6, 2015; December 3, 2015; February 9, 2016
and March 29, 2016.
The attendance at the Audit Committee meetings during the financial year
2015-16 is as under:
Name of the Committee Member No. of meetings Attendance
Mr. M. Sitarama Murty 6 6
Mr. K. Ragunathan 6 6
Dr. D. Rajagopala Reddy 6 5
NOMINATION AND REMUNERATION/COMPENSATION COMMITTEE
Brief description of terms of reference of the Nomination and
Remuneration/Compensation Committee
� Identifying persons who are qualified to become directors and who may
be appointed in senior management in accordance with the criteria laid
down and recommend to the Board their appointment and removal;
� Carry out evaluation of every director's performance;
� Formulation of the criteria for determining qualifications, positive
attributes and independence of a director;
� Recommend to the Board a policy, relating to the remuneration for the
directors, key managerial personnel and other employees;
� Formulation of the criteria for evaluation of Independent Directors and
the Board;
� Devising a policy on Board diversity;
� Grant of options to eligible employees and administering the employee
stock option scheme of the Company;
� Any other matter as the Board may decide from time to time.

Annual Report 2015-16
93
Composition and other details of Nomination and Remuneration/
Compensation Committee
The composition of the Nomination and Remuneration/Compensation
Committee comprises of three Non-Executive Directors; all of them are
independent directors.
Dr. D. Rajagopala Reddy is the Chairman of the Committee and Mr. M.
Sitarama Murty and Dr. (Mrs.) Avnit Bimal Singh are other Members of the
Committee. During the year, the Nomination and Remuneration/
Compensation Committee met five times on May 28, 2015; August 12, 2015;
January 19, 2016; February 9, 2016 and March 9, 2016.
Meetings and attendance during the year
The attendance at the Nomination and Remuneration/Compensation
Committee meetings during the financial year 2015-16 is as under:
Name of the Committee Member No. of meetings Attendance
Dr. D. Rajagopala Reddy 5 5
Mr. M. Sitarama Murty 5 5
Mr. K. Ragunathan1
5 1
Dr. (Mrs.) Avnit Bimal Singh2
5 4
Note:1
Mr. K. Ragunathan ceased to be a member of the Nomination and
Remuneration/Compensation Committee from May 28, 2015. He
attended one meeting held during his tenure.
2Dr. (Mrs.) Avnit Bimal Singh was appointed as a member of Nomination
and Remuneration/Compensation Committee with effect from May 28,
2015. She attended four meetings held after her appointment.
Nomination/Remuneration Policy
The compensation of the Executive Directors comprises of fixed component,
perquisites and commission and is determined based on the remuneration
prevailing in the industry and the performance of the Company.
The remuneration package of the Executive Directors is periodically reviewed
and suitable revision is recommended to the Board by the Committee.
The Non-Executive Directors are paid sitting fees for attending meetings of
Board/Committee.
The nomination and remuneration policy as adopted by the Board is placed
on the Company's website at: http://www.aurobindo.com/about-us/
corporate-governance.
Performance evaluation criteria for independent directors
The performance evaluation is done on an annual basis. Each Director is
provided an evaluation sheet in the form of questionnaire. The ratings are
provided by the all the Directors except the Independent Director being
evaluated.
On the basis of the report of performance evaluation, it is determined by the
Nomination and Remuneration/Compensation Committee and Board whether to
extend or continue the term of appointment of Independent Director subject to
all other applicable provisions.
REMUNERATION OF DIRECTORS
Details of remuneration paid to Directors during the financial year 2015-16
are as follows:
a. Executive Directors
Name Salary Benefits Bonus Pension Commission Contribution Total(Perquisites) to P.F
Mr. K. Nithyananda Reddy 12,333,330 1,970,914 – – – 21,600 14,325,844
Dr. M. Sivakumaran 12,333,330 1,979,858 – – – 21,600 14,334,788
Mr. M. Madan Mohan Reddy 13,166,663 2,074,978 – – – 21,600 15,263,241
Mr. N. Govindarajan 20,977,580 4,547,546 – – 65,000,000 21,600 90,546,726
TOTAL 58,810,903 10,573,296 – – 65,000,000 86,400 134,470,599
All the above Executive Directors were re-appointed with effect from
June 1, 2015 for a period of 3 years on the terms and conditions
contained in the respective resolutions passed by the Members at the
General Meetings. The notice period is as per the rules of the Company.
There was no severance fee.
Mr. N. Govindarajan, Managing Director was granted 500,000 options
under Employee Stock Option Plan (ESOP) of the Company which would
entitle him to convert the same into 500,000 equity shares of `1 each.
250,000 options were added to the outstanding options granted to
Mr. N. Govindarajan on adjustment of bonus shares in the ratio of 1:1
allotted to the Members on July 22, 2015. Mr. N. Govindarajan
exercised entire options granted and vested and no options were
outstanding out of the options granted to him as on March 31, 2016.
No other directors were granted options under ESOP.
b. Non-Executive Directors
Non-Executive Directors are paid sitting fee of `50,000 for attending
each meeting of the Board of Directors and `25,000 for each meeting
of the Committees of Board of Directors. During the year, the sitting
fees paid was as follows:
Name Sitting fee
Mr. M. Sitarama Murty 650,000
Mr. P. Sarath Chandra Reddy 400,000
Mr. K. Ragunathan 525,000
Dr. D. Rajagopala Reddy 575,000
Dr. (Mrs.) Avnit Bimal Singh 425,000
Mr. P.V. Ramprasad Reddy 150,000
`

94
STAKEHOLDERS RELATIONSHIP COMMITTEE
Composition
Mr. P. Sarath Chandra Reddy, a Non-Executive Director is the Chairman of the
Committee and Mr. K. Nithyananda Reddy, Mr. M. Madan Mohan Reddy and
Dr. D. Rajagopala Reddy are the other members of the Committee.
Dr. D. Rajagopala Reddy has become the Chairman of the Committee with
effect from May 30, 2016.
Terms of reference
Stakeholders Relationship Committee considers and resolves all matters of
grievances of the security holders of the Company including complaints
related to transfer of shares, non-receipt of annual reports and dividends,
issue of duplicate share certificates etc.
Name and designation of Compliance Officer
Mr. A. Mohan Rami Reddy, Vice President (Legal) & Company Secretary
E-mail ID for investor grievances: [email protected]
Investor Complaints
During the year ended March 31, 2016, the Company has received and
resolved 78 complaints. All complaints were resolved to the satisfaction of
Members and there were no pending complaints at the year end.
CORPORATE SOCIAL RESPONSIBILITY COMMITTEE
As per the Companies Act, 2013, the Company is required to constitute a
Corporate Social Responsibility (CSR) Committee of the Board consisting of
three or more directors, at least one of whom will be an independent
director. The constitution of CSR Committee is as under:
Mr. K. Nithyananda Reddy, Chairman
Mr. K. Ragunathan, Member
Dr. M. Sivakumaran, Member
Mr. P. Sarath Chandra Reddy, Member
The purpose of the Committee is to formulate CSR Policy of the Company
and monitor its implementation.
The CSR Policy has been placed on the Company's website at: http://
www.aurobindo.com/about-us/corporate-governance.
The annual report on the CSR activities of the Company during the year is
also placed on the Company's website at: http://www.aurobindo.com/social-
responsibility/csr-activities.
GENERAL BODY MEETINGS
1. Details of the last three Annual General Meetings are as under:
Year Location Date TimeNo. of Special
Resolutions passed
2013 Taj Deccan, Hyderabad August 7, 2013 4.00 p.m. Nil
2014 Taj Deccan, Hyderabad August 27, 2014 4.00 p.m. Nil
2015 Taj Deccan, Hyderabad August 27, 2015 3.00 p.m. 1
An Extraordinary General Meeting of Members of the Company was held on Thursday, July 9, 2015 wherein the Members have approved two Special
Resolutions.
a. Adoption of new set of Articles as per the provisions of Section 14 and other applicable provisions of the Companies Act, 2013 and rules made there
under and other applicable acts, rules and regulations to substitute the regulations contained in the existing Articles of Association of the Company.
b. Pursuant to the provisions of Section 63 and other applicable provisions of the Companies Act, 2013 and rules made there under and other applicable
acts, rules and regulations to issue bonus shares.
2. Special Resolution passed during the year through postal ballot:
A Special Resolution was passed through postal ballot vide notice dated November 6, 2015 to seek approval of Members for authorization to the Board of
Directors pursuant to Sections 23, 41, 42, 62, 71 and other applicable provisions, if any, of the Companies Act, 2013 and the rules made there under
(including any amendments thereto or re-enactment thereof) to issue and allot securities to such categories of persons including employees in one or more
tranches in domestic and/or international for a value of up to USD 600 million.

Annual Report 2015-16
95
The details of voting pattern for postal ballot are given below:
Category Mode of No. of shares No. of votes % of votes No. of votes No. of % of votes % of votesvoting held (1) polled (2) polled on - in favour votes - in favour against on
outstanding (4) against on votes votes polledshares (5) polled (7)=[(5)/(2)](3)=[(2)/(1)]* (6)=[(4)/(2)] *100100 *100
Promoter and E-Voting Poll 314,851,572 314,844,192 99.99 314,844,192 – 100.00 –
promoter group Postal ballot – – – – – – –
Total 314,851,572 314,844,192 99.99 314,844,192 – 100.00 –
Public - E-Voting Poll 205,925,558 151,583,839 73.60 151,479,270 90,507 99.94 0.06
Institutions Postal ballot – – – – – – –
Total 205,925,558 151,583,839 73.60 151,479,270 90,507 99.94 0.06
Public- E-Voting Poll 63,187,420 446,406 0.71 446,346 16 99.99 0.01
Non-Institutions Postal ballot 121,843 0.19 116,759 2,044 98.28 1.72
Total 63,187,420 568,249 0.90 563,105 2,060 99.64 0.36
TOTAL 583,964,550 466,996,280* 79.97 466,886,567 92567 99.98 0.02
*Out of which 17,146 votes were invalid
The Board appointed Mr. S. Chidambaram, Company Secretary in Practice
(C.P. No.2286) as a Scrutinizer to conduct the postal ballot voting process
in a fair and transparent manner.
The Company followed the procedure for postal ballot as per Section 110
of the Companies Act, 2013 read with Rule 22 of the Companies
(Management and Administration) Rules, 2014. The scrutinizer submitted
a report to the Chairman stating that the resolution has been duly passed
by the Members with requisite majority.
MEANS OF COMMUNICATION
The Company has a website www.aurobindo.com. The quarterly and half
yearly financial statements are not sent to the individual households of
the Members; however, the same are placed on the Company's website for
the information of Members and general public and also published in
leading newspapers in English and Telugu (Regional language). Further,
all material information which has some bearing on the operations of the
Company is sent to the stock exchanges and also placed on the Company's
website.
The presentations made to the investors and analysts are placed on the
Company's website.
The Management Discussion and Analysis forms part of this Report and is
provided separately in the Annual Report.
GENERAL SHAREHOLDERS INFORMATION
29th Annual General Meeting
As mentioned in the Notice, the 29th Annual General Meeting of the
Company will be held on Wednesday, August 24, 2016 at 3.30 p.m. at
Hotel Taj Krishna, Road No. 1, Banjara Hills, Hyderabad - 500 034.
Financial year
The financial year of the Company is April to March.
Financial calendar (tentative and subject to change) of the financial year
2016-17 is as follows:
Unaudited financial results for Declaration on or before
1st quarter August 14, 2016
2nd quarter November 14, 2016
3rd quarter February 14, 2017
4th quarter May 30, 2017
Payment of dividend
The Company has paid interim dividend of 50% (`0.50 per equity share of
`1 each) in the month of September 2015, second interim dividend of
60% (`0.60 per equity share of `1 each) in the month of November, 2015
and third interim dividend of 70% (`0.70 per equity share of `1 each) in
the month of March, 2016 on the equity share capital of the Company for
the year 2015-16. The Board of Directors of the Company at its meeting
held on May 30, 2016 has approved fourth interim dividend of 70% (`0.70
per equity share of `1 each) on the equity share capital of the Company
for the year 2015-16. Thus, the total dividend, including the fourth interim
dividend for the year ended March 31, 2016 will aggregate to 250%
(`2.50 per equity share of `1 each) on the equity share capital of the
Company for the year 2015-16. The Board of Directors has not
recommended any further dividend for the year 2015-16.

96
Name and address of each stock exchange(s) at which the shares are listed
The Company's shares are listed on the following stock exchanges:
Stock Exchanges Stock Code
BSE Limited (BSE) 524804
Phiroze Jeejeebhoy Towers, 25th Floor, Dalal Street, Mumbai - 400 001
National Stock Exchange of India Limited (NSE) AUROPHARMA
Exchange Plaza, Bandra-Kurla Complex, Bandra (East), Mumbai - 400 051
Listing fees for the financial year 2016-17 has been paid to the above stock exchanges.
ISIN: INE406A01037
Market price data
High, low market price during each month in the financial year and volume of shares traded on NSE
NSE (`) S & P CNX NiftyMonth High Low Close Volume High Low
2015 April 1,432.20 1,177.50 1,285.65 33,292,962 8844.80 8144.75
May 1,412.00 1,209.05 1,374.20 27,532,341 8489.55 7997.15
June 1,462.80 1,240.10 1,452.00 25,842,918 8467.15 7940.30
July 1,535.00 715.00 759.90 29,187,592 8654.75 8315.40
August 832.20 645.45 753.00 45,994,650 8621.55 7667.25
September 770.60 675.00 769.20 39,515,065 8055.00 7539.50
October 861.55 732.50 835.95 33,084,993 8336.30 7930.65
November 859.70 794.55 809.75 25,375,241 8116.10 7714.15
December 891.50 781.20 875.95 32,541,602 7979.30 7551.05
2016 January 886.00 766.20 834.25 30,253,415 7972.55 7241.50
February 820.50 582.00 655.65 84,973,021 7600.45 6825.80
March 761.95 645.80 744.90 48,779,329 7777.60 7035.10
High, low market price during each month in the financial year and volume of shares traded on BSE
BSE (`) BSE SensexMonth High Low Close Volume High Low
2015 April 1,432.10 1,180.00 1,283.85 32,07,909 29094.61 26897.54
May 1,412.00 1,211.75 1,374.95 26,23,495 28071.16 26423.99
June 1,470.35 1,241.35 1,449.75 25,88,053 27968.75 26307.07
July 1,540.55 715.00 758.50 44,23,770 28578.33 27416.39
August 832.50 646.20 753.90 44,98,146 28417.59 25298.42
September 769.70 675.15 768.10 36,13,070 26471.82 24833.54
October 860.80 732.60 834.90 27,54,025 27618.14 26168.71
November 859.50 790.00 810.65 21,32,647 26824.30 25451.42
December 891.50 781.20 875.40 22,62,354 26256.42 24867.73
2016 January 886.00 768.00 833.25 21,44,017 26197.27 23839.76
February 824.50 582.00 655.15 70,00,482 25002.32 22494.61
March 761.30 646.25 745.00 43,11,688 23133.18 25341.86

Annual Report 2015-16
97
There was no suspension of trading in securities of the Company during the year under review.
Registrar to an issue and share transfer agents
M/s. Karvy Computershare Private Limited (Karvy) is the Registrars & Share Transfer Agents and Depository Transfer Agents of the Company. Any request
pertaining to investor relations may be forwarded to the following address:
Ms. C. Shobha Anand
Karvy Computershare Private Limited
Unit: Aurobindo Pharma Limited
Karvy Selenium, Tower B, Plot No.31-32,
Gachibowli, Financial District, Nanakramguda,
Hyderabad - 500 032
Phone : +91 40 6716 2222
Fax : +91 40 2300 1153
E-mail : [email protected]
Share transfer system and dematerialization of shares and liquidity
The Company's shares are covered under the compulsory dematerialization list and are transferable through the depository system. The Company has appointed
Karvy as its Registrars and Share Transfer Agents and also Depository Transfer Agent. Shares received for physical transfer are generally registered within a period
of 15 days from the date of receipt, subject to fulfillment of other legal formalities. The Compliance Officer has been delegated the power to approve the share
transfers and the information is placed to the Board in each meeting. Further, the Company has signed a tripartite agreement with NSDL/CDSL and Karvy to
facilitate dematerialization of shares. The Members may contact for the redressal of their grievances to either Karvy or the Company Secretary, Aurobindo Pharma
Limited.
Distribution of shareholding
Distribution schedule as on March 31, 2016
Category Shareholders % ` %
1 - 5000 114,036 98.33 22,265,583 3.80
5001 - 10000 837 0.72 6,304,571 1.08
10001 - 20000 319 0.28 4,801,709 0.82
20001 - 30000 152 0.13 3,814,783 0.65
30001 - 40000 77 0.07 2,754,819 0.47
40001 - 50000 51 0.04 2,337,447 0.40
50001 - 100000 145 0.13 10,537,517 1.80
100001 & above 347 0.30 532,353,157 90.98
TOTAL 115,964 100.00 585,169,586 100.00
Categories of shareholders as on March 31, 2016
Category No. of Shares %
Promoters & Directors 315,503,582 53.92
NRIs/FIIs 163,170,002 27.88
Financial Institutions/banks 535,319 0.09
Mutual Funds 41,717,018 7.13
Insurance companies 246,902 0.04
Bodies corporate 11,415,490 1.95
General public and others 52,581,273 8.99
TOTAL 585,169,586 100.00

98
Outstanding GDR/ADR/warrants or any convertible instruments, conversion date and likely impact on equity
The Company has not issued any GDR/ADR and there are no outstanding warrants or any convertible instruments.
Commodity price risk or foreign exchange risk and hedging activities
Detailed information on commodity price risk and foreign exchange risk has been provided under Management of Risks which forms part of this annual report.
The Company has not undertaken any hedging activities for commodity price risk and foreign exchange risk.
Location of manufacturing and R&D facilities
Unit No. Address
Unit-I Survey No.379, 385, 386, 388 to 396 & 269, Borpatla, Hatnoor Mandal, Medak District, 502 296, Telangana
Unit-II Plot No.103/A & 104/A, SVCIE, Industrial Development Area, Bollaram, Jinnaram Mandal, Medak District, 500 092, Telangana
Unit-III Survey No.313 & 314 Bachupally, Quthubullapur Mandal, Ranga Reddy District, 500 090, Telangana
Unit-IV Plot No.4 in Survey No.151 and Plot Nos.34 to 48 in Survey Nos. part of 146, 150, 151, 152,153 and 154 situated in Phase-III,
APIIC, EPIP, IDA, Pashamylaram, Patancheru Revenue Mandal, Medak District, 502 307, Telangana
Unit-V Plot Nos.68 to 70, 73 to 91, 95, 96, 260 & 261, Industrial Development Area, Chemical Zone, Pashamylaram, Patancheru Mandal,
Medak District, 502 307, Telangana
Unit-VI Survey No. 329/39 & 329/47, Chitkul Village, Patancheru Mandal, Medak District, 502 307, Telangana
Unit-VII (SEZ) Survey Nos. 411/P, 425/P, 434/P, 435/P & 458/P, Plot No.S1/A, Special Economic Zone (Pharma), TSIIC, Green Industrial Park,
Polepally Village, Jedcherla Mandal, Mahaboobnagar, 509 302, Telangana
Unit-VIII Survey No.10 & 13, Gaddapothram, Industrial Development Area - Kazipally Industrial Area, Jinnaram Mandal, Medak District,
502 319, Telangana
Unit-IX Survey No.369, 370, 371 & 374, Gundlamachanoor, Hatnoor Mandal, Medak District, 502 296, Telangana
Unit-X* Plot No 16, APIIC, Multiproduct SEZ at Survey No.3(P) to 6(P) & 413(P) & 416(P) Palchur Village and 113 Part of Palepalem Village,
Naidupeta Mandal, PSR Nellore District, Andhra Pradesh
Unit-XI Survey No.61-66, Industrial Development Area, Pydibhimavaram, Ranasthalam Mandal, Srikakulam District, 532 409,
Andhra Pradesh
Unit-XII Survey No.314, Bachupally, Quthubullapur Mandal, Ranga Reddy District, 500 090, Telangana
Unit-XIV* JN Pharma City, Plot No. 17, Road No.10, 11 & 19, 20, E Bonangi Village, Parawada, Visakhapatnam District, 531 021,
Andhra Pradesh
Unit-XV JN Pharma City, Plot No. 17A, Road No.10,11 & 19,20, E Bonangi Village, Parawada, Visakhapatnam District, 531 021,
Andhra Pradesh
Unit-XVI* Plot No.S-5/B,S-6&S-7, Survey No.408 to 412, 418 to 435, 437 to 445, 452 to 459, TSIIC, SEZ, Polepally Village, Jedcherla Mandal,
Mahaboobnagar District, 509 302, Telangana
Unit-XVII* Survey No.77 & 78, Indrakaran Village, Sangareddy Mandal, Medak District, 502 203, Telangana
APLRC-I@
Survey No. 313 & 314, Bachupally, Quthubullapur Mandal, Ranga Reddy District, 500 090, Telangana
APLRC-II@
Survey No.71 & 72, Indrakaran Village, Sangareddy Mandal, Medak District, 502 203, Telangana
Bhiwadi Unit 1128, RIICO Phase-III, Bhiwadi, 301 019, Rajasthan (under sub-lease to Auronext Pharma Private Limited, a subsidiary of the
Company)
* Facilities under construction/development@
Research and Development Centers
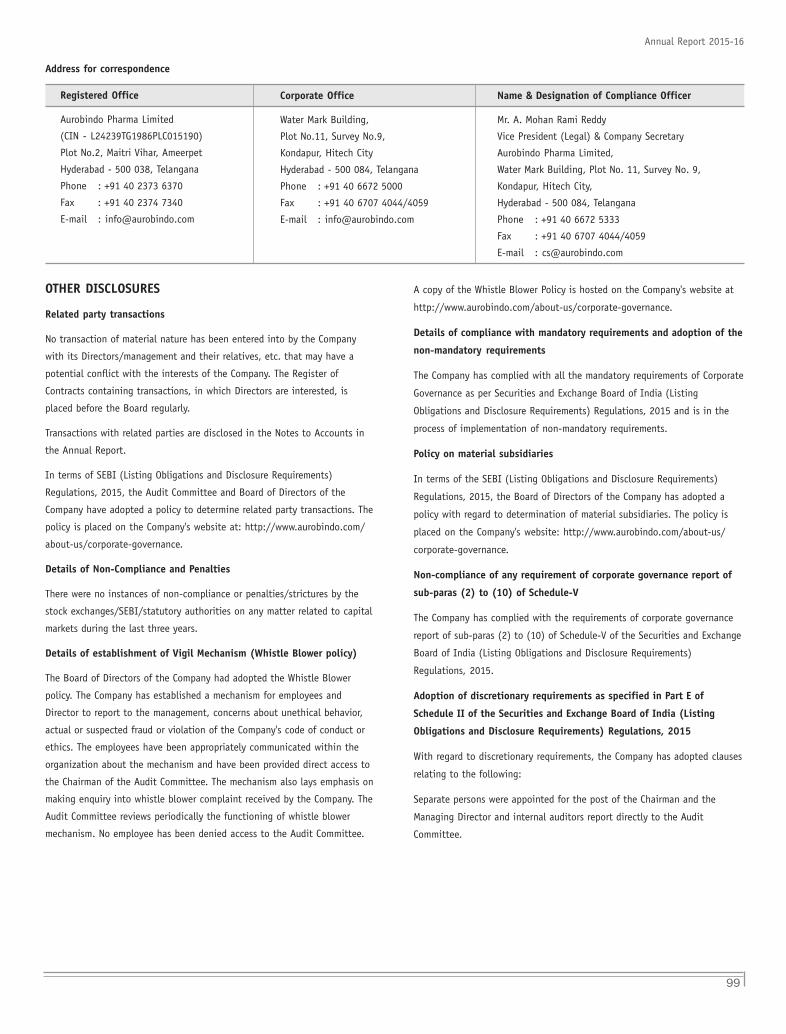
Annual Report 2015-16
99
Address for correspondence
Registered Office
Aurobindo Pharma Limited
(CIN - L24239TG1986PLC015190)
Plot No.2, Maitri Vihar, Ameerpet
Hyderabad - 500 038, Telangana
Phone : +91 40 2373 6370
Fax : +91 40 2374 7340
E-mail : [email protected]
Corporate Office
Water Mark Building,
Plot No.11, Survey No.9,
Kondapur, Hitech City
Hyderabad - 500 084, Telangana
Phone : +91 40 6672 5000
Fax : +91 40 6707 4044/4059
E-mail : [email protected]
Name & Designation of Compliance Officer
Mr. A. Mohan Rami Reddy
Vice President (Legal) & Company Secretary
Aurobindo Pharma Limited,
Water Mark Building, Plot No. 11, Survey No. 9,
Kondapur, Hitech City,
Hyderabad - 500 084, Telangana
Phone : +91 40 6672 5333
Fax : +91 40 6707 4044/4059
E-mail : [email protected]
OTHER DISCLOSURES
Related party transactions
No transaction of material nature has been entered into by the Company
with its Directors/management and their relatives, etc. that may have a
potential conflict with the interests of the Company. The Register of
Contracts containing transactions, in which Directors are interested, is
placed before the Board regularly.
Transactions with related parties are disclosed in the Notes to Accounts in
the Annual Report.
In terms of SEBI (Listing Obligations and Disclosure Requirements)
Regulations, 2015, the Audit Committee and Board of Directors of the
Company have adopted a policy to determine related party transactions. The
policy is placed on the Company's website at: http://www.aurobindo.com/
about-us/corporate-governance.
Details of Non-Compliance and Penalties
There were no instances of non-compliance or penalties/strictures by the
stock exchanges/SEBI/statutory authorities on any matter related to capital
markets during the last three years.
Details of establishment of Vigil Mechanism (Whistle Blower policy)
The Board of Directors of the Company had adopted the Whistle Blower
policy. The Company has established a mechanism for employees and
Director to report to the management, concerns about unethical behavior,
actual or suspected fraud or violation of the Company's code of conduct or
ethics. The employees have been appropriately communicated within the
organization about the mechanism and have been provided direct access to
the Chairman of the Audit Committee. The mechanism also lays emphasis on
making enquiry into whistle blower complaint received by the Company. The
Audit Committee reviews periodically the functioning of whistle blower
mechanism. No employee has been denied access to the Audit Committee.
A copy of the Whistle Blower Policy is hosted on the Company's website at
http://www.aurobindo.com/about-us/corporate-governance.
Details of compliance with mandatory requirements and adoption of the
non-mandatory requirements
The Company has complied with all the mandatory requirements of Corporate
Governance as per Securities and Exchange Board of India (Listing
Obligations and Disclosure Requirements) Regulations, 2015 and is in the
process of implementation of non-mandatory requirements.
Policy on material subsidiaries
In terms of the SEBI (Listing Obligations and Disclosure Requirements)
Regulations, 2015, the Board of Directors of the Company has adopted a
policy with regard to determination of material subsidiaries. The policy is
placed on the Company's website: http://www.aurobindo.com/about-us/
corporate-governance.
Non-compliance of any requirement of corporate governance report of
sub-paras (2) to (10) of Schedule-V
The Company has complied with the requirements of corporate governance
report of sub-paras (2) to (10) of Schedule-V of the Securities and Exchange
Board of India (Listing Obligations and Disclosure Requirements)
Regulations, 2015.
Adoption of discretionary requirements as specified in Part E of
Schedule II of the Securities and Exchange Board of India (Listing
Obligations and Disclosure Requirements) Regulations, 2015
With regard to discretionary requirements, the Company has adopted clauses
relating to the following:
Separate persons were appointed for the post of the Chairman and the
Managing Director and internal auditors report directly to the Audit
Committee.

100
The Disclosures of the compliance with Corporate Governance requirements specified in Regulation 17 to 27 and clauses (b) to (i) of sub-regulation (2)
of Regulation 46 are as follows:
Regulation Particulars of Regulations Compliance status (Yes/No)
17 Board of Directors Yes
18 Audit Committee Yes
19 Nomination and Remuneration Committee Yes
20 Stakeholders Relationship Committee Yes
21 Risk Management Committee Yes
22 Vigil mechanism Yes
23 Related Party Transactions Yes
24 Corporate Governance requirements with respect to subsidiary of listed entity Yes
25 Obligations with respect to Independent Directors Yes
26 Obligation with respect to Directors and senior management Yes
27 Other Corporate Governance requirements Yes
46(2)(b) to (i) Functional Website Yes
Code of Conduct
The Board of Directors has laid down a 'Code of Conduct' (Code) for all the
Board members and the senior management of the Company and this Code is
posted on the website of the Company. Annual declaration is obtained from
every person covered by the Code.
The Company has a comprehensive Code of Conduct for prevention of insider
trading in accordance with the requirements of SEBI (Prohibition of Insider
Trading) Regulations, 1992 as replaced by the SEBI (Prohibition of Insider
Trading) Regulations, 2015, which is effective from May 15, 2015. The Board
has formulated a Code of Conduct to regulate, monitor and report trading by
insiders and the Board has also adopted a code of practices and procedures
for fair disclosure of un-published price sensitive information.
Risk Management
The Company recognizes that it faces various financial, market, technical
and operational risks including regulatory and compliance risks and needs to
take appropriate steps to minimize such risks. The Board regularly discusses
the significant business risks identified by the management and the
mitigation process taken up. The Board has constituted a Risk Management
Committee comprising of Mr. M. Sitarama Murty, as the Chairman of the
Committee and Mr. N. Govindarajan and Mr. P. Sarath Chandra Reddy
as other members of the Committee. The objectives of the Committee
include identifying, measuring and monitoring the various risks
the Company is exposed to and initiate appropriate mitigating
measures on an ongoing basis.
Letter of appointment
Each independent director upon appointment is given a letter of
appointment. The terms and conditions of the appointment of the
independent directors is available on the Company's website at: http://
www.aurobindo.com/about-us/corporate-governance.
CEO and CFO Certification
The Managing Director (Chief Executive officer) and Chief Financial Officer
have submitted a compliance certificate to the Board as contemplated under
Securities and Exchange Board of India (Listing Obligations and Disclosure
Requirements) Regulations, 2015.

Annual Report 2015-16
101
The Members of
Aurobindo Pharma Limited
I have examined the compliance of conditions of corporate governance by Aurobindo Pharma Limited (The Company) for the financial year
ended March 31, 2016, as stipulated in Securities and Exchange Board of India (Listing Obligations and Disclosure Requirements) Regulations,
2015.
The compliance of conditions of corporate governance is the responsibility of the management. My examination was limited to review the
procedures and implementation thereof, adopted by the Company, for ensuring the compliance of the conditions of the corporate governance. It
is neither an audit nor an expression of opinion on financial statements of the Company.
In my opinion and to the best of our information and according to the explanations given to me, I certify that the Company has complied with
the conditions of corporate governance as stipulated in the above Securities and Exchange Board of India (Listing Obligations and Disclosure
Requirements) Regulations, 2015.
I further state that such compliance is neither an assurance as to the future viability of the Company nor the efficiency or effectiveness with
which the management has conducted the affairs of the Company.
S. ChidambaramCompany Secretary in Practice
Hyderabad, May 30, 2016 C.P. No. 2286
Certificate on Compliance with the conditions of Corporate Governance underRegulation 34(3) read with Schedule V of Securities and Exchange Board of India
(Listing Obligations and Disclosure Requirements) Regulations, 2015
Declaration
I, N. Govindarajan, Managing Director, hereby declare that as provided under the SEBI (Listing Obligations and Disclosure Requirements)
Regulations, 2015, the Board Members and the senior management personnel have confirmed compliance with the Code of Conduct and Ethics
for the year ended March 31, 2016.
For Aurobindo Pharma Limited
N. GovindarajanHyderabad, May 30, 2016 Managing Director

102
We hereby certify that:
a. We have reviewed financial statements and the cash flow statement for the financial year ended March 31, 2016 and that to the best of
our knowledge and belief:
i. these statements do not contain any materially untrue statement or omit any material fact or contain statements that might be
misleading;
ii. these statements together present a true and fair view of the Company's affairs and are in compliance with existing accounting
standards, applicable laws and regulations.
b. There are, to the best of our knowledge and belief, no transactions entered into by the Company during the year which are fraudulent,
illegal or violative of the Company's code of conduct.
c. We accept responsibility for establishing and maintaining internal controls for financial reporting and that we have evaluated the
effectiveness of internal control systems of the company pertaining to financial reporting and we have disclosed to the auditors and the
Audit Committee, deficiencies in the design or operation of such internal controls, if any, of which we have aware and the steps we have
taken or propose to take to rectify these deficiencies.
d. We have indicated to the Auditors and the Audit Committee that there are no:
i. significant changes in internal control over financial reporting during the year.
ii. significant changes in accounting policies during the year and that the same have been disclosed in the notes to the financial
statements; and
iii. instances of significant fraud of which we have become aware and the involvement therein, if any, of the management or an
employee having significant role in the Company's internal control system over financial reporting.
For Aurobindo Pharma Limited
N. Govindarajan S. Subramanian
Hyderabad, May 30, 2016 Managing Director Chief Financial Officer
Chief Executive Officer (CEO) and Chief Financial Officer (CFO) Certification

Annual Report 2015-16
103
Independent Auditors' Report
The Members ofAurobindo Pharma Limited
Report on the Financial Statements
We have audited the accompanying standalonefinancial statements of Aurobindo Pharma Limited('the Company'), which comprise the Balance Sheetas at March 31, 2016, the Statement of Profit andLoss and Cash Flow Statement for the year thenended, and a summary of significant accountingpolicies and other explanatory information.
Management's Responsibility for the FinancialStatements
The Company's Board of Directors is responsible forthe matters stated in Section 134(5) of theCompanies Act, 2013 ('the Act') with respect tothe preparation of these standalone financialstatements that give a true and fair view of thefinancial position, financial performance and cashflows of the Company in accordance withaccounting principles generally accepted in India,including the Accounting Standards specifiedunder Section 133 of the Act, read with Rule 7 ofthe Companies (Accounts) Rules, 2014. Thisresponsibility also includes maintenance ofadequate accounting records in accordance withthe provisions of the Act for safeguarding of theassets of the Company and for preventing anddetecting frauds and other irregularities; selectionand application of appropriate accounting policies;making judgments and estimates that arereasonable and prudent; and the design,implementation and maintenance of adequateinternal financial control that were operatingeffectively for ensuring the accuracy andcompleteness of the accounting records, relevantto the preparation and presentation of thefinancial statements that give a true and fair viewand are free from material misstatement, whetherdue to fraud or error.
Auditor's Responsibility
Our responsibility is to express an opinion onthese standalone financial statements based onour audit. We have taken into account theprovisions of the Act, the accounting and auditingstandards and matters which are required to beincluded in the audit report under the provisionsof the Act and the Rules made there under. Weconducted our audit in accordance with theStandards on Auditing, issued by the Institute ofChartered Accountants of India, as specified underSection 143(10) of the Act. Those Standardsrequire that we comply with ethical requirementsand plan and perform the audit to obtainreasonable assurance about whether the financialstatements are free from material misstatement.
An audit involves performing procedures to obtainaudit evidence about the amounts and disclosuresin the financial statements. The proceduresselected depend on the auditor's judgment,including the assessment of the risks of materialmisstatement of the financial statements, whetherdue to fraud or error. In making those riskassessments, the auditor considers internalfinancial control relevant to the Company'spreparation of the financial statements that give atrue and fair view in order to design auditprocedures that are appropriate in thecircumstances. An audit also includes evaluatingthe appropriateness of accounting policies usedand the reasonableness of the accountingestimates made by the Company's Directors, as wellas evaluating the overall presentation of thefinancial statements. We believe that the auditevidence we have obtained is sufficient andappropriate to provide a basis for our auditopinion on the standalone financial statements.
Opinion
In our opinion and to the best of our informationand according to the explanations given to us, thestandalone financial statements give theinformation required by the Act in the manner sorequired and give a true and fair view inconformity with the accounting principlesgenerally accepted in India of the state of affairsof the Company as at March 31, 2016, its profitand its cash flows for the year ended on that date.
Report on Other Legal and RegulatoryRequirements
1. As required by the Companies (Auditor'sReport) Order, 2016 ('the Order') issued bythe Central Government of India in terms ofsub-section (11) of Section 143 of the Act,we give in 'Annexure 1', a statement on thematters specified in paragraphs 3 and 4 ofthe Order.
2. As required by Section 143 (3) of the Act, wereport that:
a. We have sought and obtained all theinformation and explanations which tothe best of our knowledge and beliefwere necessary for the purposes of ouraudit;
b. In our opinion, proper books of accountas required by law have been kept bythe Company so far as it appears fromour examination of those books;
c. The Balance Sheet, the Statement ofProfit and Loss, and the Cash FlowStatement dealt with by this Report are
in agreement with the books of account;
d. In our opinion, the aforesaid standalonefinancial statements comply with theAccounting Standards specified underSection 133 of the Act, read with Rule 7of the Companies (Accounts) Rules,2014;
e. On the basis of the writtenrepresentations received from theDirectors as on March 31, 2016 andtaken on record by the Board ofDirectors, none of the Directors isdisqualified as on March 31, 2016 frombeing appointed as a director in termsof Section 164 (2) of the Act;
f. With respect to the adequacy of theinternal financial controls over financialreporting of the Company and theoperating effectiveness of such controls,refer to our separate report in 'Annexure2' to this report; and
g. With respect to the other matters to beincluded in the Auditor's Report inaccordance with Rule 11 of theCompanies (Audit and Auditors) Rules,2014, in our opinion and to the best ofour information and according to theexplanations given to us:
i. The Company has disclosed theimpact of pending litigations onits financial position in itsfinancial statements - Refer Note28 to the financial statements;
ii. The Company did not have anylong-term contracts includingderivative contracts for whichthere were any material foreseeablelosses;
iii. There has been no delay intransferring amounts, required tobe transferred, to the InvestorEducation and Protection Fund bythe Company.
For S.R. BATLIBOI & ASSOCIATES LLPChartered AccountantsICAI Firm's Registration Number: 101049W/E300004
per VIKAS KUMAR PANSARIPartnerMembership No. 093649Hyderabad, May 30, 2016

104
Annexure 1 referred to in paragraph 1 of our report of even date
Re: Aurobindo Pharma Limited ('the Company')
i. a. The Company has maintained proper records showing full particulars, including quantitative details and situation of fixed assets.
b. All fixed assets have not been physically verified by the management during the year but there is a regular programme of verification which, in ouropinion, is reasonable having regard to the size of the Company and the nature of its assets. No material discrepancies were noticed on suchverification.
c. According to the information and explanations given by management, the title deeds of immovable properties, included in fixed assets except for thefollowing, are held in the name of the Company. As explained to us, Registration of title deeds is in progress in respect of these immovable properties.
Category No. of instances Freehold/leasehold Gross block Net blockas at March 31, 2016 as at March 31, 2016
Land 5 Freehold land 126,535,881 126,535,881
Building 1 Freehold building 35,341,469 17,551,237
TOTAL 161,877,350 144,087,118
Nature of the statute Nature of Disputed Paid under Period to which the Forum where disputethe dues Amount ` protest ` amount relates is pending
Central Excise and Excise duty and 9,224,104 5,559,640 2007-08, 2008-09, CESTATCustoms Act, 1944 penalty 2009-10, 2010-11
Customs duty and 8,709,455 346,340 2002-03, 2003-04, CESTATpenalty 2004-05, 2005-06
Excise duty 14,606,598 14,471,641 2005-06 Commissioner ofCentral Excise
Interest and 14,013,066 1,181,753 2006-07, 2007-08, CESTATpenalty 2008-09, 2009-10
Excise duty 1,303,500 – 2007-08 CESTAT
Excise duty and 2,035,680 1,017,840 2009-10, 2010-11 CESTATpenalty
(Contd.)
ii. The management has conducted physicalverification of inventory at reasonableintervals during the year and no materialdiscrepancies were noticed on such physicalverification.
iii. According to the information andexplanations given to us, the Company hasnot granted any loans, secured or unsecuredto companies, firms, Limited LiabilityPartnerships or other parties covered in theregister maintained under Section 189 of theCompanies Act, 2013. Accordingly, theprovisions of clause 3(iii)(a), (b) and (c) ofthe Order are not applicable to the Companyand hence not commented upon.
iv. In our opinion and according to theinformation and explanations given to us,the Company has not advanced loans toDirectors/to a company in which theDirector is interested to which, theprovisions of Section 185 of the CompaniesAct, 2013 apply and hence not commented
upon. In our opinion and according to theinformation and explanations given to us,the Company has made investments andgiven guarantees/provided security which isin compliance with the provisions of Section186 of the Companies Act, 2013.
v. The Company has not accepted any depositsfrom the public.
vi. We have broadly reviewed the books ofaccount maintained by the Companypursuant to the rules made by the CentralGovernment for the maintenance of costrecords under Section 148(1) of theCompanies Act, 2013, related to themanufacture of Active PharmaceuticalIngredients and Formulations and are of theopinion that prima facie, the specifiedaccounts and records have been made andmaintained. We have not, however, made adetailed examination of the same.
vii. a. The Company is regular in depositingwith appropriate authorities undisputed
statutory dues including provident fund,employees' state insurance, income tax,sales tax, service tax, customs duty,excise duty, value added tax, cess andother material statutory dues applicableto it.
b. According to the information andexplanations given to us, no undisputedamounts payable in respect of providentfund, employees' state insurance,income tax, service tax, sales tax, dutyof custom, duty of excise, value addedtax, cess and other material statutorydues were outstanding, at the year end,for a period of more than six monthsfrom the date they became payable.
c. According to the records of theCompany, the dues outstanding ofincome tax, sales tax, service tax, dutyof custom, duty of excise, value addedtax and cess on account of any dispute,are as follows:

Annual Report 2015-16
105
Nature of the statute Nature of Disputed Paid under Period to which the Forum where disputethe dues Amount ` protest ` amount relates is pending
Excise duty and 77,49,644 2,569,008 2005–06, 2006–07, CESTATpenalty 2007–08, 2008–09,
2009–10, 2010–11
Excise duty and 5,480,404 3,490,202 2008–09 CESTATpenalty
Excise duty and 5,980,852 – 2006–07, 2007–08, CESTATpenalty 2008–09, 2009–10,
2010–11
Customs duty and 4,689,566 3,739,566 2011–12, 2012–13 Commissioner ofpenalty Customs – Appeals
Excise duty and 6,278,701 1,809,138 2000–01, 2001–02, CESTATpenalty 2002–03
Excise duty 3,962,773 3,962,773 2012–13 Revision Authority
Central Excise and Interest 2,297,939 2,297,939 2007–08, 2008–09, Revision AuthorityCustoms Act, 1944 2009–10, 2010–11
Excise duty 4,760,055 – 2006–07, 2007–08 High court
Excise duty 4,490,484 – 2006–07, 2007–08, CESTAT2008–09, 2009–10,2010–11, 2011–12
Excise duty and 636,956 318,478 2008–09 CESTATpenalty
Excise duty and 1,226,000 1,176,000 2012–13 CESTATpenalty
Excise duty 156,000 156,000 2013–14 Commissioner ofCentral Excise (Appeals)
Excise duty 264,226 – 2011–12, 2012–13, Commissioner of2013–14, 2014–15 Central Excise (Appeals)
Excise duty and 83,242 83,242 2008–09, 2009–10 CESTATpenalty
Excise duty and 38,218 19,109 2013–14, 2014–15 Commissioner ofpenalty Central Excise (Appeals)
Excise duty and 1,989,820 1,889,820 2014–15, 2015–16 Commissioner ofpenalty Central Excise
(Appeals)
Excise duty and 84,215 – 2014–15 Commissioner ofpenalty Central Excise (Appeals)
Excise duty 5,665,193 4,925,488 2012–13, 2013–14 Revision Authority
Finance Act, 1994 Service Tax 458,500 458,500 2007–08 CESTAT
Service Tax 3,369,212 428,697 2012–13 CESTAT
Service Tax 11,295,379 2,066,239 2011–12 CESTAT
Service Tax 12,308,490 9,376,541 2006–07, 2007–08, CESTAT2008–09, 2009–10,2010–11
Service Tax 97,222,192 – 2005–06, 2007–08, CESTAT2008–09, 2009–10,2010–11
Service Tax 69,299,037 5,197,428 2011–12 CESTAT
Service Tax 1,595,280 1,595,280 2008–09 CESTAT
Income Tax Act, 1961 Income Tax 190,070,479 – 2008–2009 ITAT
Income Tax 31,585,269 – 2010–2011 ITAT

106
viii. In our opinion and according to the
information and explanations given by the
management, the Company has not
defaulted in repayment of dues to a bank or
government loan in the nature of sales tax
deferment. There are no dues which are
payable to financial institutions or
debenture holders.
ix. In our opinion and according to the
information and explanations given by the
management, the Company has utilized the
monies raised by way of term loans for the
purposes for which they were raised. The
Company has not raised any money by way
of initial public offer/further public offer/
debt instruments and hence, not commented
upon.
x. Based upon the audit procedures performed
for the purpose of reporting the true and fair
view of the financial statements and
according to the information and
explanations given by the management, we
report that no fraud by the Company or on
the Company by the officers and employees
of the Company has been noticed or
reported during the year.
xi. According to the information and
explanations given by the management, the
managerial remuneration has been paid/
provided in accordance with the requisite
approvals mandated by the provisions of
Section 197 read with Schedule V to the
Companies Act, 2013.
xii. In our opinion, the Company is not a nidhi
company. Therefore, the provisions of clause
3(xii) of the order are not applicable to the
Company and hence not commented upon.
xiii. According to the information and
explanations given by the management,
transactions with the related parties are in
compliance with Sections 177 and 188 of
Companies Act, 2013 where applicable and
the details have been disclosed in the notes
to the financial statements, as required by
the applicable accounting standards.
xiv. According to the information and
explanations given to us and on an overall
examination of the balance sheet, the
Company has not made any preferential
allotment or private placement of shares or
fully or partly convertible debentures during
the year under review and hence, reporting
requirements under clause 3(xiv) are not
applicable to the Company and, not
commented upon.
xv. According to the information and
explanations given by the management, the
Company has not entered into any non-cash
transactions with Directors or persons
connected with him as referred to in Section
192 of Companies Act, 2013.
xvi. According to the information and
explanations given to us, the provisions of
Section 45-IA of the Reserve Bank of India
Act, 1934 are not applicable to the
Company.
For S.R. BATLIBOI & ASSOCIATES LLPChartered AccountantsICAI Firm's Registration Number: 101049W/E300004
per VIKAS KUMAR PANSARIPartnerMembership No. 093649Hyderabad, May 30, 2016

Annual Report 2015-16
107
Report on the Internal Financial Controls under
Clause (i) of Sub-section 3 of Section 143 of
the Companies Act, 2013 ('the Act')
We have audited the internal financial controls
over financial reporting of Aurobindo Pharma
Limited ('the Company') as of March 31, 2016 in
conjunction with our audit of the standalone
financial statements of the Company for the year
ended on that date.
Management's Responsibility for Internal
Financial Controls
The Company's Management is responsible for
establishing and maintaining internal financial
controls based on the internal control over
financial reporting criteria established by the
Company considering the essential components of
internal control stated in the Guidance Note on
Audit of Internal Financial Controls Over Financial
Reporting issued by the Institute of Chartered
Accountants of India. These responsibilities
include the design, implementation and
maintenance of adequate internal financial
controls that were operating effectively for
ensuring the orderly and efficient conduct of its
business, including adherence to the Company's
policies, the safeguarding of its assets, the
prevention and detection of frauds and errors, the
accuracy and completeness of the accounting
records, and the timely preparation of reliable
financial information, as required under the
Companies Act, 2013.
Auditor's Responsibility
Our responsibility is to express an opinion on the
Company's internal financial controls over financial
reporting based on our audit. We conducted our
audit in accordance with the Guidance Note on
Audit of Internal Financial Controls Over Financial
Reporting (the 'Guidance Note') and the Standards
on Auditing as specified under section 143(10) of
the Companies Act, 2013, to the extent applicable
to an audit of internal financial controls, both
applicable to an audit of Internal Financial Controls
and, both issued by the Institute of Chartered
Accountants of India. Those Standards and the
Guidance Note require that we comply with ethical
requirements and plan and perform the audit to
obtain reasonable assurance about whether
adequate internal financial controls over financial
reporting was established and maintained and if
such controls operated effectively in all material
respects.
Our audit involves performing procedures to obtain
audit evidence about the adequacy of the internal
financial controls system over financial reporting
and their operating effectiveness. Our audit of
internal financial controls over financial reporting
included obtaining an understanding of internal
financial controls over financial reporting, assessing
the risk that a material weakness exists, and testing
and evaluating the design and operating
effectiveness of internal control based on the
assessed risk. The procedures selected depend on
the auditor's judgement, including the assessment
of the risks of material misstatement of the
financial statements, whether due to fraud or error.
We believe that the audit evidence we have
obtained is sufficient and appropriate to provide a
basis for our audit opinion on the internal
financial controls system over financial reporting.
Meaning of Internal Financial Controls Over
Financial Reporting
A company's internal financial control over
financial reporting is a process designed to provide
reasonable assurance regarding the reliability of
financial reporting and the preparation of financial
statements for external purposes in accordance
with generally accepted accounting principles. A
company's internal financial control over financial
reporting includes those policies and procedures
that (1) pertain to the maintenance of records
that, in reasonable detail, accurately and fairly
reflect the transactions and dispositions of the
assets of the company; (2) provide reasonable
assurance that transactions are recorded as
necessary to permit preparation of financial
statements in accordance with generally accepted
accounting principles, and that receipts and
expenditures of the company are being made only
Annexure 2 to the Independent Auditor's Report of even date on thestandalone financial statements of Aurobindo Pharma Limted
in accordance with authorisations of management
and directors of the company; and (3) provide
reasonable assurance regarding prevention or
timely detection of unauthorised acquisition, use,
or disposition of the company's assets that could
have a material effect on the financial statements.
Inherent Limitations of Internal Financial
Controls Over Financial Reporting
Because of the inherent limitations of internal
financial controls over financial reporting,
including the possibility of collusion or improper
management override of controls, material
misstatements due to error or fraud may occur and
not be detected. Also, projections of any
evaluation of the internal financial controls over
financial reporting to future periods are subject to
the risk that the internal financial control over
financial reporting may become inadequate
because of changes in conditions, or that the
degree of compliance with the policies or
procedures may deteriorate.
Opinion
In our opinion, the Company has, in all material
respects, an adequate internal financial controls
system over financial reporting and such internal
financial controls over financial reporting were
operating effectively as at March 31, 2016, based
on the internal control over financial reporting
criteria established by the Company considering
the essential components of internal control stated
in the Guidance Note on Audit of Internal Financial
Controls Over Financial Reporting issued by the
Institute of Chartered Accountants of India.
For S.R. BATLIBOI & ASSOCIATES LLP
Chartered Accountants
ICAI Firm's Registration Number: 101049W/E300004
per VIKAS KUMAR PANSARI
Partner
Membership No. 093649
Hyderabad, May 30, 2016

108
EQUITY AND LIABILITIESSHAREHOLDERS' FUNDS
Share capital 2 585.2 292.0Reserves and surplus 3 67,520.0 53,303.4
68,105.2 53,595.4NON-CURRENT LIABILITIES
Long-term borrowings 4 3,347.6 6,871.6Deferred tax liabilities (Net) 5 2,124.9 2,103.4Long-term provisions 6 212.6 226.5
5,685.1 9,201.5CURRENT LIABILITIES
Short-term borrowings 7 25,745.7 22,093.7Trade payables 8
Total outstanding dues of micro enterprisesand small enterprises 276.3 –Total outstanding dues of creditors other thanmicro enterprises and small enterprises 12,545.0 11,460.4
Other current liabilities 9 5,909.2 5,047.6Short-term provisions 6 1,062.5 860.2
45,538.7 39,461.9TOTAL 119,329.0 102,258.8
ASSETSNON-CURRENT ASSETS
Fixed assets 10Tangible assets 25,681.3 21,900.1Intangible assets – –Tangible assets - Capital work-in-progress 7,421.4 2,271.9
Non-current investments 11 11,823.7 9,931.1Loans and advances 12 4,173.0 4,189.4Other non-current assets 15 272.3 285.5
49,371.7 38,578.0CURRENT ASSETS
Current investments 16 0.2 196.4Inventories 17 24,316.0 21,450.5Trade receivables 13 35,411.4 37,089.4Cash and bank balances 18 3,308.1 111.3Loans and advances 12 4,681.1 4,008.5Other current assets 14 2,240.5 824.7
69,957.3 63,680.8TOTAL 119,329.0 102,258.8
Summary of significant accounting policies 1The accompanying notes are an integral part of the financial statements.
Balance Sheet as at March 31, 2016
NotesAs at As at
March 31, 2016 March 31, 2015
(All amounts in Indian Rupees million, except share data and where otherwise stated)
As per our report of even date. For and on behalf of the Board of Directors of Aurobindo Pharma Limited
For S.R. BATLIBOI & ASSOCIATES LLPChartered AccountantsICAI Firm registration number:101049W/E300004 N. Govindarajan Dr. M. Sivakumaran
Managing Director DirectorDIN: 00050482 DIN: 01284320
per Vikas Kumar PansariPartnerMembership No. 93649 Santhanam Subramanian A. Mohan Rami Reddy
Chief Financial Officer VP (Legal) &Hyderabad, May 30, 2016 Company Secretary

Annual Report 2015-16
109
INCOME Revenue from operations (Gross) 19 93,227.6 82,448.4
Less: Excise duty 41 1,565.8 1,497.4
Revenue from operations (Net) 91,661.8 80,951.0
Other income 20 1,833.2 672.2
TOTAL REVENUE 93,495.0 81,623.2
EXPENSES Cost of materials consumed 21 44,258.0 39,203.3
Purchase of traded goods 63.1 157.6
Increase in work-in-progress and finished goods 22 (1,415.9) (1,590.9)
Employee benefit expenses 23 8,097.9 6,687.5
Other expenses 24 16,168.3 13,989.3
Depreciation/amortization 25 2,630.0 2,451.5
Finance costs 26 2,293.1 1,321.4
TOTAL EXPENSES 72,094.5 62,219.7
PROFIT BEFORE TAX 21,400.5 19,403.5
TAX EXPENSE Current tax 5,182.3 4,206.3
MAT credit – (99.5)
Deferred tax charge 21.5 133.2
TOTAL TAX EXPENSE 5,203.8 4,240.0
PROFIT FOR THE YEAR 16,196.7 15,163.5
EARNINGS PER EQUITY SHARE 29
Basic earnings per share (`) 27.73 26.00
Diluted earnings per share (`) 27.72 25.98
Nominal value per equity share (`) 1.00 1.00
Summary of significant accounting policies 1
The accompanying notes are an integral part of the financial statements.
Statement of Profit and Loss for the year ended March 31, 2016
Notes Year ended Year ended
March 31, 2016 March 31, 2015
(All amounts in Indian Rupees million, except share data and where otherwise stated)
As per our report of even date. For and on behalf of the Board of Directors of Aurobindo Pharma Limited
For S.R. BATLIBOI & ASSOCIATES LLPChartered AccountantsICAI Firm registration number:101049W/E300004 N. Govindarajan Dr. M. Sivakumaran
Managing Director DirectorDIN: 00050482 DIN: 01284320
per Vikas Kumar PansariPartnerMembership No. 93649 Santhanam Subramanian A. Mohan Rami Reddy
Chief Financial Officer VP (Legal) &Hyderabad, May 30, 2016 Company Secretary

110
Cash Flow Statement for the year ended March 31, 2016
Year ended Year ended March 31, 2016 March 31, 2015
CASH FLOW FROM
OPERATING ACTIVITIES Net profit before tax 21,400.5 19,403.5
Adjustments to reconcile profit before tax to net cash flows
Depreciation and amortization 2,630.0 2,451.5
Provision for doubtful receivables/advances/other assets (Net) 475.4 42.7
Provision for diminution on non–current investment 455.0 540.0
Loss on current investment 0.1 –
Profit on sale of investment (Net) (63.8) –
Balances no longer required written back (4.8) (9.1)
Unrealized foreign exchange loss (Net) 208.3 343.0
Loss on sale of assets (Net) 10.6 25.0
Interest expense 595.6 495.7
Interest income (48.7) (128.6)
Dividend income
Operating profit before working capital changes 25,658.2 23,163.7
Movements in working capital:
Decrease/(increase) in trade receivables 1,260.8 (6,665.4)
Increase in inventories (2,865.5) (4,332.4)
Increase in loans and advances (206.9) (918.5)
Increase in other current/non–current assets (1,434.7) (244.1)
Increase/(decrease) in trade payables 1,467.6 (1,046.5)
Increase in provision for retirement benefits 115.0 237.8
Increase/(decrease) in other current liabilities 76.2 (31.4)
Cash generated from operations 24,070.7 10,163.2
Direct taxes paid (Net of refunds) (4,842.0) (4,259.1)
NET CASH FLOW FROM OPERATING ACTIVITIES (A) 19,228.7 5,904.1
CASH FLOW USED IN
INVESTING ACTIVITIES Purchase of fixed assets, including capital work–in–progress,
capital advances and payables for capital goods (11,681.3) (5,440.0)
Proceeds from sale of fixed assets 15.3 20.4
Purchase of non–current investments made in subsidiaries (2,559.7) (1,975.4)
Redemption of bank deposits 0.3 –
Proceeds of current investments 276.3 –
Proceeds of non–current investments 217.3 –
Intercorporate deposit repaid/(given) 10.0 (10.0)
Loans made to subsidiaries (214.5) (28.0)
Loans repaid by subsidiaries – 1,024.1
Interest received 35.6 172.9
Dividend received – –
NET CASH FLOW USED IN INVESTING ACTIVITIES (B) (13,900.7) (6,236.0)
(All amounts in Indian Rupees million, except share data and where otherwise stated)
(Contd.)

Annual Report 2015-16
111
Year ended Year ended March 31, 2016 March 31, 2015
CASH FLOW USED IN
FINANCING ACTIVITIES Proceeds from issuance of share capital 72.0 67.6
Proceeds from long-term borrowings – 8.3
Repayment of long-term borrowings (3,676.1) (1,103.0)
Proceeds from short-term borrowings (Net) 3,733.6 3,766.8
Interest paid (645.2) (589.1)
Dividend (1,341.9) (1,527.0)
Tax on dividend (273.6) (277.6)
Net cash flow from/(used in) financing activities (C) (2,131.2) 346.0
Net increase in cash and cash equivalents (A+B+C) 3,196.8 14.1
Cash and cash equivalents at the beginning of the year 111.3 97.2
Cash and cash equivalents at the end of the year 3,308.1 111.3
Components of cash and cash equivalents
Cash and bank balances includes:
Cash on hand 5.4 6.0
Balance with banks:
Current accounts 2,326.3 77.5
Cash credit accounts 962.0 15.3
Fixed deposit accounts – 0.3
Unpaid dividend accounts* 14.4 12.5
Cash and bank balances as per balance sheet 3,308.1 111.6
Less: fixed deposits considered as investing activities – 0.3
Total cash and cash equivalents (Refer note 18) 3,308.1 111.3
Summary of significant accounting policies (Refer Note 1)
*The Company can utilize these balances only toward settlement of unpaid dividend.
(All amounts in Indian Rupees million, except share data and where otherwise stated)
As per our report of even date. For and on behalf of the Board of Directors of Aurobindo Pharma Limited
For S.R. BATLIBOI & ASSOCIATES LLPChartered AccountantsICAI Firm registration number:101049W/E300004 N. Govindarajan Dr. M. Sivakumaran
Managing Director DirectorDIN: 00050482 DIN: 01284320
per Vikas Kumar PansariPartnerMembership No. 93649 Santhanam Subramanian A. Mohan Rami Reddy
Chief Financial Officer VP (Legal) &Hyderabad, May 30, 2016 Company Secretary

112
1. Statement of significant accountingpolicies
a. Basis of preparation
The financial statements of the Companyhave been prepared in accordance withthe generally accepted accountingprinciples in India (Indian GAAP). TheCompany has prepared these financialstatements to comply in all materialrespects with the accounting standardsnotified under Section 133 of theCompanies Act 2013, read together withparagraph 7 of the Companies(Accounts) Rules 2014. The accountingpolicies have been consistently appliedby the Company and are consistent withthose used in the previous year exceptas disclosed in (b) below.
b. Change in accounting policy
The Company has adopted componentaccounting as required under ScheduleII to the Companies Act, 2013, fromApril 1, 2015. The Company waspreviously not identifying componentsof fixed assets separately fordepreciation purposes; rather, a singleuseful life was used to depreciate eachitem of fixed assets.
Due to application of Schedule II to theCompanies Act, 2013, the Company haschanged the manner of depreciation forits fixed assets. Now, the Companyidentifies and determines cost of eachcomponent/part of the asset separately,if the component/part has a cost whichis significant to the total cost of theasset and has useful life that ismaterially different from that of theremaining asset. These components aredepreciated separately over their usefullives; the remaining components aredepreciated over the life of the principalasset. The Company has also changed itspolicy on recognition of cost of majorinspection/overhaul. Earlier, theCompany used to charge such cost ofmajor inspection/overhaul directly tostatement of profit and loss, as incurred.On application of componentaccounting, the major inspection/overhaul is identified as a separatecomponent of the asset at the time ofpurchase of new asset and subsequently.The cost of such major inspection/overhaul is depreciated separately overthe period till next major inspection/overhaul. Upon next major inspection/overhaul, the costs of new major
Notes to financial statements for the year ended March 31, 2016Dividend is recognized as and when theCompany’s right to receive payment isestablished by the reporting date.
e. Fixed assets and depreciation
Fixed assets are stated at cost lessaccumulated depreciation, impairmentlosses and specific grant/subsidies, ifany. Cost comprise of purchase price,freight, non refundable taxes and dutiesand any attributable cost of bringingthe asset to its working condition for itsintended use. Borrowing costs relatingto acquisition of fixed assets which takesubstantial period of time to get readyfor use are included to the extent theyrelate to the period till such assets areready for intended use. All otherborrowing costs are expensed in theperiod they occur.
Expenditure directly relating toconstruction activity is capitalized.Expenditure is capitalized to the extentthose are specifically attributable to theconstruction activity or is incidentalthereto. Income earned duringconstruction period is deducted from thetotal expenditure relating toconstruction activity.
Assets retired from active use and heldfor disposal are stated at theirestimated net realizable values or netbook values, whichever is lower.
Assets under finance leases, where thereis no reasonable certainty that theCompany will obtain the ownership bythe end of the lease term are capitalizedand are depreciated over the lease termor estimated useful life of the asset,whichever is shorter.
The Company identifies and determinescost of each component/part of theasset separately, if the component/parthas a cost which is significant to thetotal cost of the asset and has usefullife that is materially different from thatof the remaining asset.
Premium paid on leasehold land isamortized over the lease term.
Depreciation is provided on the straight-line method, based on the useful life ofthe assets as estimated by themanagement. The Company hasestimated the following useful lives toprovide depreciation on its fixed assets:
inspection/overhaul are added to theasset's cost and any amount remainingfrom the previous inspection/overhaul isderecognized. On the date of componentaccounting becoming applicable, i.e.April 1, 2015, there were nocomponents whose cost was significantto the total cost of the assets andwhose useful life was materiallydifferent from that of the remainingassets. The change in accounting forcomponents did not have any impact onfinancial statements of the Company forthe current year.
c. Use of estimates
The preparation of financial statementsin conformity with Indian GAAP requiresthe management to make judgements,estimates and assumptions that affectthe reported amounts of revenues,expenses, assets and liabilities and thedisclosure of contingent liabilities at thedate of the financial statements and theresults of operations during thereporting year. Although these estimatesare based upon management’s bestknowledge of current events andactions, actual results could differ fromthese estimates.
d. Revenue recognition
Revenue is recognized to the extentthat it is probable that the economicbenefits will flow to the Company andthe revenue can be reliably measured.
Revenue from sale of goods isrecognized on dispatch (in respect ofexports on the date of the bill of ladingor airway bill) which coincides withtransfer of significant risks and rewardsto customer and is net of tradediscounts, sales returns and sales tax,where applicable and recognized basedon the terms of the agreements enteredinto with the customers. Excise dutydeducted from revenue (gross) is theamount that is included in revenue(gross) and not the entire amount ofliability arising during the year.
Revenue from sale of dossiers/licenses/services is recognized in accordancewith the terms of the relevantagreements as accepted and agreed withthe customers.
Interest is recognized on a timeproportion basis taking into account theamount outstanding and the rateapplicable.

Annual Report 2015-16
113
Notes to financial statements for the year ended March 31, 2016
f. Intangibles
Cost relating to licenses, which are acquired,are capitalized and amortized on a straight-line basis over their useful life notexceeding ten years. Research costs areexpensed as incurred. Developmentexpenditure incurred in respect of internallygenerated intangible assets such as productdevelopment is carried forward when thefuture recoverability can reasonably beregarded as assured.
g. Impairment of tangible and intangibleassets
The carrying amounts of assets are reviewedat each balance sheet date if there is anyindication of impairment based on internal/external factors. An impairment loss isrecognized wherever the carrying amount ofan asset exceeds its recoverable amount. Therecoverable amount is the greater of theasset’s net selling price and its value in use.In assessing value in use, the estimatedfuture cash flows are discounted to theirpresent value using a pre-tax discount ratethat reflects current market assessments ofthe time value of money and risks specific tothe asset.
After impairment, depreciation is providedon the revised carrying amount of the assetover its remaining useful life.
h. Government grants and subsidies
Grants and subsidies are recognized whenthere is a reasonable assurance that thegrant or subsidy will be received and that allunderlying conditions thereto will becomplied with. When the grant or subsidyrelates to an asset, its value is deducted inarriving at the carrying amount of therelated asset.
i. Investments
Investments that are readily realizable andintended to be held for not more than oneyear from the date on which suchinvestments are made, are classified ascurrent investments. All other investmentsare classified as long-term investments.
Current investments are carried at lower ofcost and fair value determined on individualinvestment basis.
Long-term investments are carried at cost.However, diminution in value is provided torecognize a decline, other than temporary, inthe value of the investments.
j. Inventories
Raw materials, packing materials, stores,spares and consumables are valued at lowerof cost, calculated on 'Weighted average'basis and net realizable value. Items held foruse in the production of inventories are notwritten down below cost if the finishedproduct in which these will be incorporatedare expected to be sold at or above cost.
Finished goods and work-in-progress arevalued at lower of cost and net realizablevalue. Cost includes materials, labour and aproportion of appropriate overheads basedon normal operating capacity. Cost offinished goods includes excise duty. Cost isdetermined on a 'Weighted average' basis.
Trading goods are valued at lower of costand net realisable value. Cost includes costof purchase and other costs incurred inbringing the inventories to their presentlocation and condition. Cost is determinedon a 'Weighted average' basis.
Net realizable value is the estimated sellingprice in the ordinary course of business,reduced by the estimated costs ofcompletion and costs to effect the sale.
k. Employee benefits
Employee benefit in the form of providentfund is a defined contribution scheme andthe contributions are charged to thestatement of profit and loss in the yearwhen an employee renders the relatedservice. There are no other obligations otherthan the contribution payable to therespective authorities.
Gratuity is a defined benefit obligation andis provided for on the basis of an actuarial
valuation on project unit credit methodmade at the end of each financial year.
Short-term compensated absences areprovided for based on estimates. Long-termcompensated absences are provided forbased on actuarial valuation. The actuarialvaluation is done as per projected unit creditmethod at the end of each financial year.
Actuarial gains/losses are immediately takento statement of profit and loss and are notdeferred.
The Company presents the entire leave as acurrent liability in the balance sheet, sinceit does not have an unconditional right todefer its settlement for 12 months after thereporting date.
l. Income taxes
Tax expense comprises of current anddeferred tax. Current income tax is measuredat the amount expected to be paid to thetax authorities in accordance with theIndian Income Tax Act, 1961. Deferredincome taxes reflect the impact of currentyear timing differences between taxableincome and accounting income for the yearand reversal of timing differences of earlieryears.
Deferred tax is measured based on the taxrates and the tax laws enacted orsubstantively enacted at the balance sheetdate. Deferred tax assets are recognized onlyto the extent that there is reasonablecertainty that sufficient future taxableincome will be available against which suchdeferred tax assets can be realized.
In the situations where the Company isentitled to tax holiday under Income TaxAct, 1961, no deferred tax is recognized inrespect of timing differences which reverseduring the tax holiday period, to the extentCompany's gross total income is subject tothe deduction during the tax holiday period.Deferred tax in respect of timing differenceswhich reverse after the tax holiday period isrecognized in the year in which timingdifference originate.
Unrecognized deferred tax assets of earlieryears are re-assessed and recognized to theextent that it has become reasonably certainor virtually certain, as the case may be thatfuture taxable income will be availableagainst which such deferred tax assets canbe realized.
The carrying amount of deferred tax assetsare reviewed at each balance sheet date.The Company writes down the carrying
Nature of the assets Useful life as Useful life as statedestimated by the in the Companies
management (in years) Act, 2013 (in years)
Leasehold buildings 20 10-60
Freehold buildings 15-60 10-60
Plant & machinery 5-20 3-40
Furniture & fittiings 10 10
Vehicles 4-8 8
Office equipment 5 5
114
Notes to financial statements for the year ended March 31, 2016
amount of a deferred tax asset to the extentthat it is no longer reasonably certain orvirtually certain, as the case may be, thatsufficient future taxable income will beavailable against which deferred tax assetcan be realized. Any such write down isreversed to the extent that it becomesreasonably certain or virtually certain, as thecase may be, that sufficient future taxableincome will be available.
Minimum alternate tax (MAT) paid in a yearis charged to the statement of profit andloss as current tax. The Company recognizesMAT credit available as an asset only to theextent that there is convincing evidencethat the Company will pay normal incometax during the specified period, i.e. theperiod for which MAT credit is allowed to becarried forward. In the year in which theCompany recognizes MAT credit as an assetin accordance with the Guidance Note onAccounting for Credit Available in respect ofMinimum Alternative Tax under the IncomeTax Act, 1961, the said asset is created byway of credit to the statement of profit andloss and shown as 'MAT credit entitlement.'The Company reviews the 'MAT creditentitlement' asset at each reporting dateand writes down the asset to the extent theCompany does not have convincing evidencethat it will pay normal tax during thespecified period.
m. Foreign exchange transactions
Initial recognition: Foreign currencytransactions are recorded in the reportingcurrency, by applying to the foreign currencyamount the exchange rate between thereporting currency and foreign currency atthe date of the transaction.
Conversion: Foreign currency monetary itemsare reported at year-end rates. Non-monetary items which are carried in terms ofhistorical cost denominated in foreigncurrency are reported using the exchangerate at the date of the transaction.
Exchange differences: Exchange differencesarising on the settlement of monetary itemsor on reporting monetary items of Companyat rates different from those at which theywere initially recorded during the year, orreported in previous financial statements,are recognized as income or as expenses inthe year in which they arise.
Forward exchange contracts entered into tohedge foreign current risk of an existingasset/liability. The premium or discountarising at the inception of forward exchangecontract is amortized and recognized as an
expense/income over the life of thecontract. Exchange differences on suchcontracts, are recognized in the statement ofprofit and loss in the period in which theexchange rates change. Any profit or lossarising on cancellation or renewal of suchforward exchange contract is also recognizedas income or as expense for the period.
n. Export benefits, incentives and licenses
Export benefits on account of duty drawbackand export promotion schemes are accruedand accounted in the year of export, and areincluded in other operating revenue. Otherbenefits in the form of advanceauthorization for imports are accounted foron purchase of imported materials.
o. Leases
Where the Company is lessee
Finance leases, where the substantial risksand benefits incidental to ownership of theleased items are transferred to the Company,are capitalized at the lower of the fair valueand present value of the minimum leasepayments at the inception of the lease termand disclosed as leased assets. Leasepayments are apportioned between thefinance charges and reduction of the leaseliability based on the implicit rate of return.Finance charges are charged to statement ofprofit and loss. Lease management fees,legal charges and other initial direct costsare capitalized.
Leases, where the lessor effectively retainssubstantially all the risks and benefits ofownership of the leased item are classifiedas operating leases. Operating leasepayments are recognized as an expense inthe statement of profit and loss on astraight-line basis over the lease term.
p. Earnings Per Share
Basic earnings per share is calculated bydividing the net profit for the yearattributable to equity shareholders by theweighted average number of equity sharesoutstanding during the year. The weightedaverage number of shares outstanding duringthe year is adjusted for events such as bonusissue that have changed the number ofshares outstanding, without a correspondingchange in resources.
For the purpose of calculating dilutedearnings per share, the net profit for theyear attributable to equity shareholders andthe weighted average number of equityshares outstanding during the year areadjusted for the effects of all dilutivepotential equity shares.
q. Provisions
A provision is recognized when the Companyhas a present obligation as a result of pastevent, it is probable that an outflow ofresources embodying economic benefits willbe required to settle the obligation and areliable estimate can be made of the amountof the obligation. Provisions are notdiscounted to their present value and aredetermined based on the best estimaterequired to settle the obligation at thereporting date. These estimates are reviewedat each reporting date and adjusted toreflect the current best estimates.
r. Cash and cash equivalents
Cash and cash equivalents in the cash flowstatements comprise cash at bank and inhand and short-term investments with anoriginal maturity of three months or less.
s. Employee Stock Compensation Cost
Measurement and disclosure of the employeeshare-based payment plans is done inaccordance with Securities and ExchangeBoard of India (Share Based EmployeeBenefits) Regulations, 2014 and theGuidance Note on Accounting for EmployeeShare Based Payments Plans, issued by theInstitute of Chartered Accountants of India.The Company measures compensation costrelating to employee stock options using theintrinsic value method. Compensationexpense, if any, is amortized over thevesting period of the option on a straightline basis.
t. Contingent liabilities
A contingent liability is possible obligationthat arises from past events whose existencewill be confirmed by the occurrence or non-occurrence of one or more uncertain futureevents beyond the control of Company or apresent obligation that is not recognizedbecause it is not probable that an outflow ofresources will be required to settle theobligation. A contingent liability also arisesin extremely rare cases where there is aliability that cannot be recognized becauseit can not be measured reliably. TheCompany does not recognize the contingentliability but discloses its existence in thefinancial statements.
u. Borrowing cost
Borrowing cost includes interest incurred inconnection with the arrangement ofborrowings and exchange differences arisingfrom foreign currency borrowings to theextent they are regarded as an adjustment tothe interest cost.

Annual Report 2015-16
115
As at As atMarch 31, 2016 March 31, 2015
2. SHARE CAPITAL
AUTHORISED 660,000,000 (March 31, 2015: 660,000,000)
equity shares of `1 each 660.0 660.0
1,000,000 (March 31, 2015: 1,000,000)
preference shares of `100 each 100.0 100.0
760.0 760.0
ISSUED, SUBSCRIBED
AND FULLY PAID-UP SHARES
585,169,586 (March 31, 2015: 291,982,275)
equity shares of `1 each 585.2 292.0
TOTAL 585.2 292.0
a. Reconciliation of the equity shares outstanding at the beginning and at the end of the year
As at March 31, 2016 As at March 31, 2015
Numbers Value Numbers Value
Equity shares
At the beginning of the year 291,982,275 292.0 291,457,021 291.5
Issued during the year under bonus issue 291,982,275 292.0 – –
Issued during the year under ESOP 1,205,036 1.2 525,254 0.5
Outstanding at the end of the year 585,169,586 585.2 291,982,275 292.0
b. Terms/rights attached to equity shares
The Company has only one class of equity shares having a par value of `1 per share. Each holder of equity shares is entitled to one vote per share.
The Company declares and pays dividends in Indian rupees. The dividend proposed by the Board of Directors is subject to the approval ofshareholders in the ensuing Annual General Meeting.
During the year ended March 31, 2016, the amount of dividend per share recognized as distributions to equity shareholders was`2.5 (March 31, 2015: `4.5) including interim dividend of `2.5 (March 31, 2015: `4.5).
In the event of liquidation of the Company, the holders of equity shares will be entitled to receive remaining assets of the Company, after distributionof all preferential amounts. However, no such preferential amounts exist currently. The distribution will be in proportion to the number of equityshares held by the shareholders.
c. Details of shareholders holding more than 5% equity shares in the Company
As at March 31, 2016 As at March 31, 2015
Numbers % holding Numbers % holding
Mrs. P. Suneela Rani 205,036,760 35.04 100,661,990 34.48
205,036,760 100,661,990
As per records of the Company, including its register of shareholders/members and other declarations received from shareholders regarding beneficial
interest, the above shareholding represents both legal and beneficial ownerships of shares.
d. Aggregate number of bonus shares issued, shares issued for consideration other than cash during the period of five years immediately
preceeding the reporting date:
As at March 31, 2016 As at March 31, 2015Numbers Numbers
Equity shares alloted as fully paid bonus shares by capitalization ofsecurities premium 291,982,275 –
e. For details of shares reserved for issue under Employee Stock Option Plan (ESOP) of the Company, Refer Note 30.
Notes to financial statements for the year ended March 31, 2016
(All amounts in Indian Rupees million, except share data and where otherwise stated)

116
4. LONG-TERM BORROWINGS
Non-current portion Current maturities
As at As at As at As at
March 31, 2016 March 31, 2015 March 31, 2016 March 31, 2015
From banks (Secured)
Term loans in foreign currency 3,091.9 6,458.3 3,975.2 3,750.0
3,091.9 6,458.3 3,975.2 3,750.0
Other loans
Deferred sales tax loan (Unsecured) 255.7 413.3 160.0 132.0
255.7 413.3 160.0 132.0
Amount disclosed under the head 'Other current liabilities' – – (4,135.2) (3,882.0)
(Refer Note 9 )
TOTAL 3,347.6 6,871.6 – –
The above amount includes:
Secured borrowings 3,091.9 6,458.3 3,975.2 3,750.0
Unsecured borrowings 255.7 413.3 160.0 132.0
i. Secured term loans in foreign currency carry interest in the range of LIBOR plus 1% to 1.5%. Out of these loans, loans amounting to `1,104.3(March 31, 2015: `1,562.5) are repayable in two (March 31, 2015: three) equal installments in 5th, 6th (March 31, 2015: 4th, 5th and 6th) years fromthe respective final draw down, and loans amounting to `1,987.6 (March 31, 2015: `1,666.7) is repayable at the end of 4th, 5th and 6th years fromthe respective final draw down and loan amounting `Nil (March 31, 2015: `3,229.2) is repayable at the end of 5th year from the respective final drawdown date.
ii. Deferred sales tax loan is interest free and payable in various installments as per sales tax deferment scheme. The last installment is payable in2029-30 (March 31, 2015: 2028-29)
iii. Term loans are secured by first pari passu charge on all the present and future fixed assets, both movable and immoveable property of the Company.
As at As atMarch 31, 2016 March 31, 2015
3. RESERVES AND SURPLUS
CAPITAL RESERVE 91.1 91.1
CAPITAL REDEMPTION RESERVE 90.0 90.0
SECURITIES PREMIUM
ACCOUNT As per last balance sheet 3,551.6 3,484.5
Add: Premium on exercise of employee stock options 70.8 67.1
Less: Amount utilized towards issue of fully paid bonus shares 292.0 –
3,330.4 3,551.6
GENERAL RESERVE 7,888.4 7,888.4
SURPLUS IN THE STATEMENT OF PROFIT AND LOSS
Balance as per last financial statements 41,682.3 28,278.4
Profit for the year 16,196.7 15,163.5
Less: Appropriations
On equity shares of `1 each
Interim dividend @ `2.5 (March 31, 2015: `4.5) 1,461.4 1,312.8
Tax on dividend 297.5 250.4
Depreciation [Net of deferred tax of `Nil
(March 31, 2015: `82.3)] – 196.4
Total appropriations 1,758.9 1,759.6
NET SURPLUS IN THE STATEMENT OF PROFIT AND LOSS 56,120.1 41,682.3
TOTAL 67,520.0 53,303.4
Notes to financial statements for the year ended March 31, 2016
(All amounts in Indian Rupees million, except share data and where otherwise stated)

Annual Report 2015-16
117
As at As atMarch 31, 2016 March 31, 2015
5. DEFERRED TAX LIABILITIES (NET)
Deferred tax liability on account of differences in depreciation
as per tax books and financial books 2,611.0 2,388.9
Deferred tax asset arising on account of timing differences relating to:
Provision made towards doubtful trade receivables/loans and advances/other assets 244.0 79.5
Employee benefits 242.1 206.0
TOTAL 2,124.9 2,103.4
Notes to financial statements for the year ended March 31, 2016
(All amounts in Indian Rupees million, except share data and where otherwise stated)
6. PROVISIONSLong-term Short-term
As at As at As at As atMarch 31, 2016 March 31, 2015 March 31, 2016 March 31, 2015
For employee benefits
Gratuity [Refer Note 31(b)] 212.6 226.5 65.0 30.0
Compensated absences – – 434.3 340.4
212.6 226.5 499.3 370.4
Other provisions
For proposed dividend – – 409.6 292.0
For tax on proposed dividend – – 83.4 59.4
Provision for income tax (Net of advance tax) – – 70.2 138.4
– – 563.2 489.8
TOTAL 212.6 226.5 1,062.5 860.2
As at As atMarch 31, 2016 March 31, 2015
7. SHORT-TERM BORROWINGS
Loans repayable on demand from banks - working capital loans
Cash credit facilities (Secured) 469.1 372.7
Buyers credit (Unsecured) – 784.6
Packing credit loans (Secured) 2,490.9 8,259.0
Packing credit loans (Unsecured) 22,785.7 12,677.4
25,745.7 22,093.7
The above amount includes
Secured borrowings 2,960.0 8,631.8
Unsecured borrowings 22,785.7 13,461.9
TOTAL 25,745.7 22,093.7
All secured loans payable on demand and secured short term loans from banks are secured by first charge by way of hypothecation of all the stocks, book debts and other current assets
(both present and future).
As at As at
March 31, 2016 March 31, 2015
8. TRADE PAYABLES
Total outstanding dues of micro enterprises and small enterprises (Refer Note 34) 276.3 –
Total outstanding dues of creditors other than micro enterprises and small enterprises 12,545.0 11,460.4

118
10. FIXED ASSETS - TANGIBLE AND INTANGIBLE ASSETS
Leasehold Freehold Leasehold Freehold Plant & Furniture Vehicles Office Total Totalland land buildings buildings machinery & fittings equipment tangible intangible
assets assets -Licenses
AT COST
At April 1, 2014 60.6 337.4 25.5 5,665.2 22,922.3 614.0 151.5 272.1 30,048.6 39.6
Additions 88.8 22.2 0.1 779.1 4,269.0 101.2 6.0 28.7 5,295.1 –
Deletions – – – 2.8 294.6 1.8 3.9 4.8 307.9 –
At March 31, 2015 149.4 359.6 25.6 6,441.5 26,896.7 713.4 153.6 296.0 35,035.8 39.6
Additions – 1,785.5 – 701.1 3,708.9 154.3 64.9 25.5 6,440.2
Deletions – – – – 178.0 2.2 45.7 7.1 233.0
At March 31, 2016 149.4 2,145.1 25.6 7,142.6 30,427.6 865.5 172.8 314.4 41,243.0 39.6
Depreciation/amortization
At April 1, 2014 9.6 – 12.3 974.6 9,282.9 275.3 50.0 64.5 10,669.2 39.6
Charge for the year 3.8 – 1.3 219.0 2,257.2 86.1 60.4 104.6 2,732.4 –
Deletions – – – 0.1 257.9 0.7 3.3 3.9 265.9 –
At March 31, 2015 13.4 – 13.6 1,193.5 11,282.2 360.7 107.1 165.2 13,135.7 39.6
Charge for the year 4.2 – 1.3 247.2 2,240.4 66.2 30.6 43.2 2,633.1 –
Deletions – – – – 155.8 1.9 42.4 7.0 207.1 –
At March 31, 2016 17.6 – 14.9 1,440.7 13,366.8 425.0 95.3 201.4 15,561.7 39.6
Net block
At March 31, 2015 136.0 359.6 12.0 5,248.0 15,614.5 352.7 46.5 130.8 21,900.1 –
At March 31, 2016 131.8 2,145.1 10.7 5,701.9 17,060.8 440.5 77.5 113.0 25,681.3 –
Capital work-in-progress `7,421.4 (March 31, 2015: `2,271.9) (Refer Note 32).
1. The title deeds of land and buildings aggregating to `161.9 (March 31, 2015: `161.9) are pending transfer to the Company's name.
2. Depreciation/amortization for the year include ̀ 3.1 (March 31, 2015: ̀ 2.3) taken as pre-operative capital expenditure on capital projects pending capitalization.
3. Details of finance lease [Refer Note 40(b)].
4. Details of capital research and development [Refer Note 36(b)].
As at As atMarch 31, 2016 March 31, 2015
9. OTHER CURRENT LIABILITIES
Current maturities of long-term borrowings (Refer Note 4) 4,135.2 3,882.0
Payable for capital goods 1,449.9 869.9
Security deposits 1.5 1.5
Unclaimed dividend (Refer Note 35) 14.4 12.5
Interest accrued but not due on borrowings 37.7 87.4
Advance from customers 54.6 44.6
Statutory liabilities 215.9 149.7
TOTAL 5,909.2 5,047.6
Notes to financial statements for the year ended March 31, 2016
(All amounts in Indian Rupees million, except share data and where otherwise stated)

Annual Report 2015-16
119
11. NON-CURRENT INVESTMENTSTrade investmentsLong–term, unquoted, in fully paid equity shares(at cost unless stated otherwise)
In subsidiariesAurobindo Pharma USA Inc, U.S.A. – 100% of 2,824.2 100% of 2,824.2
Paid–in–Capital Paid–in–CapitalAPL Pharma Thai Limited, Thailand 100 Baht 979,200 145.6 979,200 145.6Aurobindo Pharma Industria Farmaceutica Ltda, Brazil 1Real 10,124,795 80.0 10,124,795 80.0[At cost less provision for other than temporary diminutionin value of `180.0 (March 31, 2015: `180.0)]Helix Healthcare B.V., The Netherlands – 100% of 3,970.6 100% of 3,605.4
Paid–in–Capital Paid–in–Capital[At cost less provision for other than temporary diminutionin value of `2,795.0 (March 31, 2015: `2,340.0)]APL Research Centre Limited, India 10 12,260,000 122.6 12,102,750 121.0APL Healthcare Limited, India 10 87,500,000 875.0 55,537,600 555.4All Pharma (Shanghai) Trading Company Limited, China – 100% of 27.5 100% of 27.5
Paid–in–Capital Paid–in–CapitalAPL Holdings (Jersey) Limited, Jersey 1 Euro – – 3,637,824 233.6Aurobindo Pharma Produtos Farmaceuticos Ltda, Brazil 1 Real 99,000 2.1 99,000 2.1Auronext Pharma Private Limited, India 10 124,984,028 1,298.6 94,274,000 942.7Auro Peptides Limited, India 10 95,000 1.0 95,000 1.0Aurobindo Antibiotics Limited, India 10 50,000 0.5 50,000 0.5Curepro Parenterals Limited, India 10 5,783,600 860.5 2,150,000 315.5Hyacinths Pharma Private Limited, India 10 9,740,998 167.3 8,490,998 154.8Silicon Life Sciences Private Limited, India 10 44,867,500 432.4 43,617,500 419.9AuroZymes Limited, India 10 50,000 0.5 50,000 0.5Tergene Biotech Private Limited 10 3,390,000 33.9 – –In othersJeedimetla Effluent Treatment Limited 100 753 0.1 753 0.1Patancheru Envirotech Limited 10 103,709 1.0 103,709 1.0Progressive Effluent Treatment Limited 100 1,000 0.1 1,000 0.1TOTAL (A) 10,843.5 9,430.9Long term, unquoted, in fully paid cumulativeredeemable preference shares (at cost)In subsidiariesAuro Peptides Limited, India 100 6,600,000 660.0 5,000,000 500.0(9.5% Cumulative preference shares redeemable atpar within five years from the date of issue)Tergene Biotech Private Limited 100 400,000 40.0 – –(10.5% Cumulative preference shares redeemable at parwithin five years from the date of issue)Auronext Pharma Private Limited, India 100 2,800,000 280.0 – –(9.5% Cumulative preference shares redeemable atpar within five years from the date of issue)TOTAL (B) 980.0 500.0Non–trade investmentsLong–term, unquoted and at cost, in government securitiesKisan Vikas Patra – –National Savings Certificate [includes held by 0.2 0.2
income tax authorities `0.07 (March 31, 2015: `0.07)]TOTAL (C) 0.2 0.2TOTAL (A+B+C) 11,823.7 9,931.1
Notes: 1. Aggregate value of unquoted investments 11,823.7 9,931.12. Aggregate provision for diminution in the value of investments 2,975.0 2,520.0
As at As atFace March 31, 2016 March 31, 2015
value Qty. ` Qty. `
Notes to financial statements for the year ended March 31, 2016
(All amounts in Indian Rupees million, except share data and where otherwise stated)

120
Non-current Current
As at As at As at As at
March 31, 2016 March 31, 2015 March 31, 2016 March 31, 2015
12. LOANS AND ADVANCES
(Unsecured, considered good except stated otherwise)
Capital advances
Considered good 1,174.3 499.6 – –
Doubtful 0.8 0.8 – –
1,175.1 500.4 – –
Provision for doubtful advances 0.8 0.8 – –
TOTAL (A) 1,174.3 499.6 – –
Trade deposits – – – –
Considered good* 454.2 333.3 – –
Doubtful 0.4 0.4 – –
454.6 333.7 – –
Provision for doubtful deposit 0.4 0.4 – –
TOTAL (B) 454.2 333.3 – –
Loan and advances to related parties (Refer Note 39)
Loans to subsidiaries** 242.5 28.0 – –
Share application money to subsidiaries 12.5 – – –
TOTAL (C) 255.0 28.0 – –
Advances recoverable in cash or kind
Considered good 20.8 24.0 1,024.7 1,199.7
Doubtful 30.1 30.1 – –
50.9 54.1 1,024.7 1,199.7
Provision for doubtful advances 30.1 30.1 – –
TOTAL (D) 20.8 24.0 1,024.7 1,199.7
Other loans and advances
Advance income tax (Net of provision for taxation) 447.5 439.4 – –
MAT credit entitlement 1,593.5 2,610.1 600.0 –
Share application money to others – 33.9 – –
Intercorporate deposit – – – 10.0
Loans to employees 53.5 54.4 94.8 78.9
Export rebate claims receivable – – 2,004.9 1,802.5
Balance with statutory/government authorities
Considered good 174.2 166.7 956.7 917.4
Doubtful 38.1 38.1 – –
212.3 204.8 956.7 917.4
Provision for doubtful advances 38.1 38.1 – –
174.2 166.7 956.7 917.4
TOTAL (E) 2,268.7 3,304.5 3,656.4 2,808.8
TOTAL (A+B+C+D+E) 4,173.0 4,189.4 4,681.1 4,008.5
Refer Note 42 for advances due from private companies/partnership firm in which Company's Director is a director/partner.
* Non-current deposits include deposits pledged with Enforcement Directorate of `32.6 (March 31, 2015: `32.6).
** Loan of `242.5 (March 31, 2015: `28.0) has been given to wholly owned subsidiaries towards project development cost, at interest rate of 9.5% per annum.
Notes to financial statements for the year ended March 31, 2016
(All amounts in Indian Rupees million, except share data and where otherwise stated)
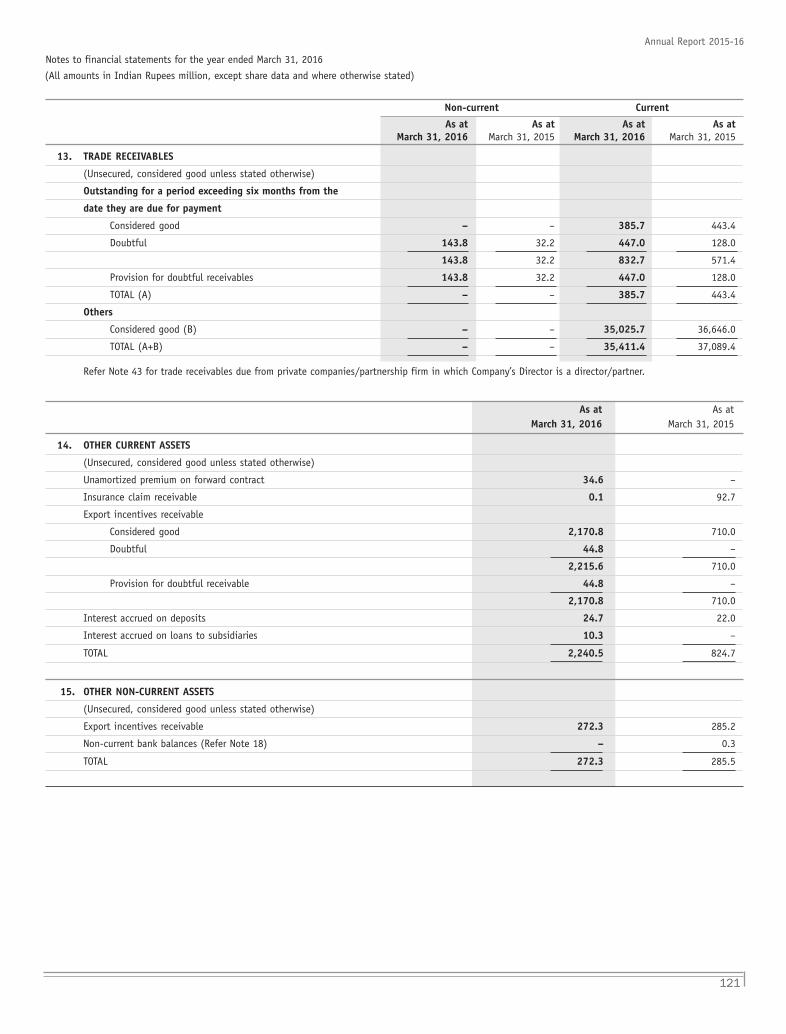
Annual Report 2015-16
121
Non-current Current
As at As at As at As atMarch 31, 2016 March 31, 2015 March 31, 2016 March 31, 2015
13. TRADE RECEIVABLES
(Unsecured, considered good unless stated otherwise)
Outstanding for a period exceeding six months from the
date they are due for payment
Considered good – – 385.7 443.4
Doubtful 143.8 32.2 447.0 128.0
143.8 32.2 832.7 571.4
Provision for doubtful receivables 143.8 32.2 447.0 128.0
TOTAL (A) – – 385.7 443.4
Others
Considered good (B) – – 35,025.7 36,646.0
TOTAL (A+B) – – 35,411.4 37,089.4
Refer Note 43 for trade receivables due from private companies/partnership firm in which Company’s Director is a director/partner.
As at As atMarch 31, 2016 March 31, 2015
14. OTHER CURRENT ASSETS
(Unsecured, considered good unless stated otherwise)
Unamortized premium on forward contract 34.6 –
Insurance claim receivable 0.1 92.7
Export incentives receivable
Considered good 2,170.8 710.0
Doubtful 44.8 –
2,215.6 710.0
Provision for doubtful receivable 44.8 –
2,170.8 710.0
Interest accrued on deposits 24.7 22.0
Interest accrued on loans to subsidiaries 10.3 –
TOTAL 2,240.5 824.7
15. OTHER NON-CURRENT ASSETS
(Unsecured, considered good unless stated otherwise)
Export incentives receivable 272.3 285.2
Non-current bank balances (Refer Note 18) – 0.3
TOTAL 272.3 285.5
Notes to financial statements for the year ended March 31, 2016
(All amounts in Indian Rupees million, except share data and where otherwise stated)

122
16. CURRENT INVESTMENTS
Current portion of long-term investment (at cost)
Unquoted, in fully paid equity shares, at lower of cost and market value
Citadel Aurobindo Biotech Limited, India 100 70,000 – 70,000 –
[Aggregate provision for diminution in value of `7.0
(March 31, 2015: `7.0)]
Sino-Pharma Group Datong Weiqida Zhong Khag Pharma
Company Limited, China – – 10% Paid-in-Capital 196.1
Quoted, in fully paid equity shares, at lower of cost and market value
Andhra Bank 10 4,520 0.2 4,520 0.3
TOTAL 0.2 196.4
1. Aggregate value of unquoted investments – 196.1
2. Aggregate value of quoted investments 0.2 0.3
3. Market value of quoted investments 0.2 0.3
4. Aggregate provision for diminution in the value of investments 7.0 7.0
As at As atFace March 31, 2016 March 31, 2015
value Qty ` Qty `
As at As atMarch 31, 2016 March 31, 2015
17. INVENTORIES
(Valued at lower of cost and net realizable value)
Raw materials [includes in-transit `228.6 (March 31, 2015: `334.0)] 12,118.0 10,948.6
Packing materials 1,366.3 1,278.6
Work-in-progress 7,954.6 6,478.8
Finished goods [includes in-transit `176.9 (March 31, 2015: `322.1)] 1,646.2 1,706.1
Stores, spares and consumables 1,230.9 1,038.4
TOTAL 24,316.0 21,450.5
Notes to financial statements for the year ended March 31, 2016
(All amounts in Indian Rupees million, except share data and where otherwise stated)
Non-current Current
As at As at As at As atMarch 31, 2016 March 31, 2015 March 31, 2016 March 31, 2015
18. CASH AND BANK BALANCES
Cash and cash equivalents
Cash on hand – – 5.4 6.0
Balance with banks:
On current accounts – – 2,326.3 77.5
On cash credit accounts – – 962.0 15.3
On unpaid dividend account – – 14.4 12.5
– – 3,308.1 111.3
Other bank balances
Margin money deposits* – 0.3 – –
– 0.3 – –
Amount disclosed under non–current assets (Refer Note 15) – (0.3) – –
TOTAL – – 3,308.1 111.3
*Given against bank guarantees/performance guarantees

Annual Report 2015-16
123
Year ended Year endedMarch 31, 2016 March 31, 2015
19. REVENUE FROM OPERATIONS (GROSS)
Sale of products 90,773.3 81,639.6
Sale of services 16.3 37.9
Other operating revenue
Scrap sales 78.6 71.4
Export incentives 2,359.4 699.5
TOTAL 93,227.6 82,448.4
Details of sale of products
Active Pharmaceutical Ingredients (APIs) & Intermediates 29,656.0 27,294.7
Formulations - Tablets & Capsules 49,004.0 44,213.8
Formulations - Injections 6,946.5 4,514.0
Formulations - Syrups 3,881.1 4,138.5
Trading goods 66.2 195.6
Others 1,219.5 1,283.0
90,773.3 81,639.6
Details of sale of services
Dossier income 6.0 12.3
Other service income 10.3 25.6
16.3 37.9
Notes to financial statements for the year ended March 31, 2016
(All amounts in Indian Rupees million, except share data and where otherwise stated)
Year ended Year endedMarch 31, 2016 March 31, 2015
20. OTHER INCOME
Interest income on
Bank deposits 0.0 1.2
Other deposits and receivables 37.9 86.0
Loans to subsidiaries 10.8 41.4
Dividend income on current investments-trade – –
Profit on investments (Net) 63.8 –
Bad debts recovered from trade receivables 0.4 15.6
State subsidy received 215.2 135.1
Foreign exchange gain (Net) 1,440.3 249.0
Miscellaneous income 64.8 143.9
TOTAL 1,833.2 672.2
21. COST OF MATERIALS CONSUMED
Raw material consumed
Opening stock 10,948.6 8,611.6
Add: Purchases 41,117.2 37,910.8
52,065.8 46,522.4
Less: Closing stock 12,118.0 10,948.6
Cost of raw material consumed 39,947.8 35,573.8
Packing materials consumed 4,310.2 3,629.5
TOTAL 44,258.0 39,203.3
Details of cost of materials consumed
Material name
6APA 3,400.8 3,483.7
Packing materials consumed 4,310.2 3,629.5
Others 36,547.0 32,090.1
44,258.0 39,203.3

124
Year ended Year ended (Increase)/decreaseMarch 31, 2016 March 31, 2015 March 31, 2016
22. INCREASE IN WORK-IN-PROGRESS AND FINISHED GOODS
Inventories at the end of the year
Finished goods 1,646.2 1,706.1 59.9
Work-in-progress 7,954.6 6,478.8 (1,475.8)
9,600.8 8,184.9 (1,415.9)
Inventories at the beginning of the year March 31, 2015
Finished goods 1,706.1 1,362.7 (343.4)
Work-in-progress 6,478.8 5,231.3 (1,247.5)
8,184.9 6,594.0 (1,590.9)
TOTAL (1,415.9) (1,590.9)
Details of inventory
Finished goods
Active Pharmaceutical Ingredients (APIs) & intermediates 762.1 658.7
Formulations - Tablets & capsules 702.1 829.0
Formulations - Injections 104.2 153.4
Formulations - Syrups 77.8 65.0
1,646.2 1,706.1
Work-in-progress
Active Pharmaceutical Ingredients (APIs) & intermediates 6,488.2 5,379.9
Formulations - Tablets & Capsules 1,418.7 1,011.5
Formulations - Injections 38.9 80.0
Formulations - Syrups 8.8 7.4
7,954.6 6,478.8
23. EMPLOYEE BENEFIT EXPENSES
Salaries, wages and bonus 7,432.8 6,061.5
Contribution to provident and other funds [Refer Note 31 (a)] 238.3 170.0
Gratuity expense [Refer Note 31 (b)] 128.2 172.1
Leave encashment expense 158.0 148.9
Staff welfare expenses 140.6 135.0
TOTAL 8,097.9 6,687.5
Notes to financial statements for the year ended March 31, 2016
(All amounts in Indian Rupees million, except share data and where otherwise stated)

Annual Report 2015-16
125
Year ended Year endedMarch 31, 2016 March 31, 2015
24. OTHER EXPENSES
Conversion charges 420.5 481.2
Consumption of stores and spares 1,379.1 1,159.7
Chemicals consumed 1,528.2 1,149.3
Power and fuel 3,930.6 3,401.3
Carriage inward 386.5 478.3
Factory maintenance 240.2 212.5
Effluent treatment expenses 116.2 111.5
(Increase)/decrease of excise duty on inventory (Refer Note 41) 12.2 2.7
Repairs and maintenance
Plant and machinery 642.6 497.5
Buildings 278.6 284.4
Others 36.8 37.6
Rent (Refer Note 40) 71.1 74.3
Rates and taxes 125.8 141.0
Printing and stationery 114.1 108.7
Postage and telephones 56.1 52.7
Insurance 152.4 139.6
Legal and professional charges 597.4 353.8
Directors sitting fees 2.7 2.4
Remuneration to statutory auditors (Refer Note 37) 17.6 10.9
Sales commission 404.0 269.7
Carriage outwards 1,972.1 2,117.8
Selling expenses 97.0 106.7
Rebates and discounts 83.9 265.3
Travelling and conveyance 176.6 157.6
Vehicle maintenance expenses 4.9 5.3
Analytical charges 538.0 360.9
Provision for diminution on non-current investment 455.0 540.0
Donations (Refer Note 38) 3.4 11.6
Registration and filing charges 1,073.5 756.7
Loss on sale of fixed assets (Net) 10.6 25.0
Provision for doubtful receivables/advances/other assets (Net) 475.4 42.7
Loss on current investments 0.1 –
Corporate social responsibility expenditure (Refer note below) 187.6 81.3
Miscellaneous expenses 577.5 549.3
TOTAL 16,168.3 13,989.3
Details of CSR expenditure Year ended Year ended
March 31, 2016 March 31, 2015
a. Gross amount required to be spent by the Company during the year 282.2 139.8
In cash Yet to be paid in cash Total
b. Amount spent during the year ending on March 31, 2016:
i. Construction/acquisition of any asset – – –
ii. On purposes other than (i) above 187.6 – 187.6
Amount spent during the year ending on March 31, 2015:
i. Construction/acquisition of any asset – – –
ii. On purposes other than (i) above 81.3 – 81.3
Notes to financial statements for the year ended March 31, 2016
(All amounts in Indian Rupees million, except share data and where otherwise stated)
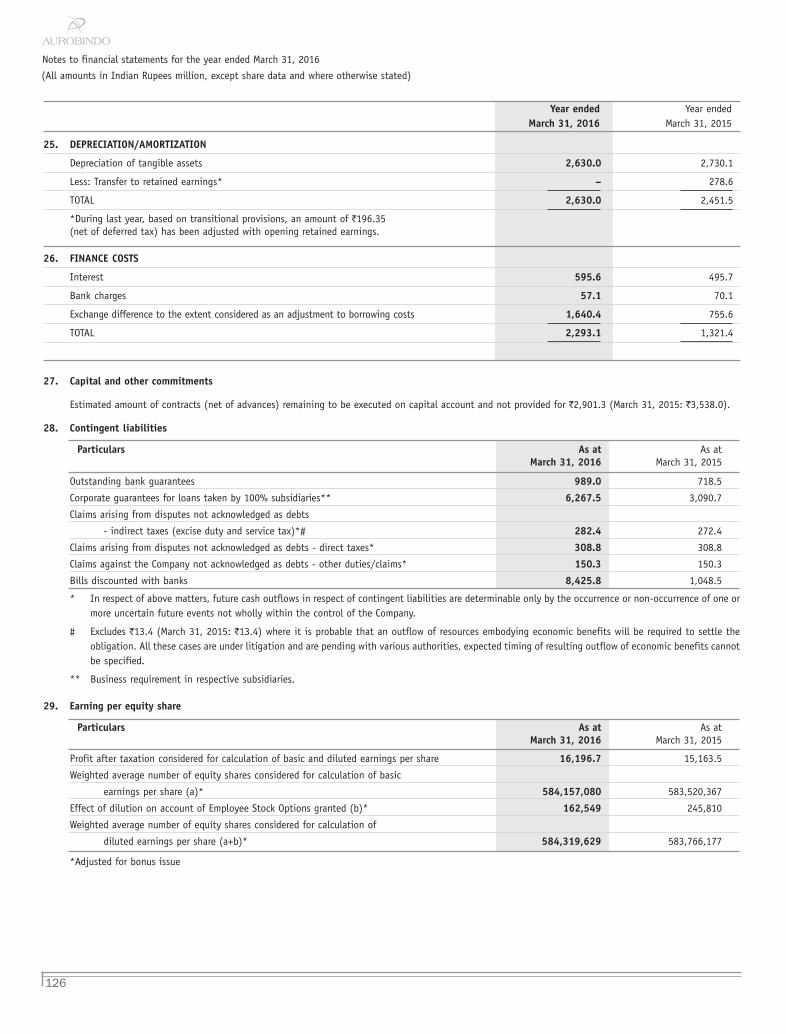
126
Year ended Year endedMarch 31, 2016 March 31, 2015
25. DEPRECIATION/AMORTIZATION
Depreciation of tangible assets 2,630.0 2,730.1
Less: Transfer to retained earnings* – 278.6
TOTAL 2,630.0 2,451.5
*During last year, based on transitional provisions, an amount of `196.35(net of deferred tax) has been adjusted with opening retained earnings.
26. FINANCE COSTS
Interest 595.6 495.7
Bank charges 57.1 70.1
Exchange difference to the extent considered as an adjustment to borrowing costs 1,640.4 755.6
TOTAL 2,293.1 1,321.4
27. Capital and other commitments
Estimated amount of contracts (net of advances) remaining to be executed on capital account and not provided for `2,901.3 (March 31, 2015: `3,538.0).
28. Contingent liabilities
Particulars As at As atMarch 31, 2016 March 31, 2015
Outstanding bank guarantees 989.0 718.5
Corporate guarantees for loans taken by 100% subsidiaries** 6,267.5 3,090.7
Claims arising from disputes not acknowledged as debts
- indirect taxes (excise duty and service tax)*# 282.4 272.4
Claims arising from disputes not acknowledged as debts - direct taxes* 308.8 308.8
Claims against the Company not acknowledged as debts - other duties/claims* 150.3 150.3
Bills discounted with banks 8,425.8 1,048.5
* In respect of above matters, future cash outflows in respect of contingent liabilities are determinable only by the occurrence or non-occurrence of one ormore uncertain future events not wholly within the control of the Company.
# Excludes `13.4 (March 31, 2015: `13.4) where it is probable that an outflow of resources embodying economic benefits will be required to settle theobligation. All these cases are under litigation and are pending with various authorities, expected timing of resulting outflow of economic benefits cannotbe specified.
** Business requirement in respective subsidiaries.
29. Earning per equity share
Particulars As at As atMarch 31, 2016 March 31, 2015
Profit after taxation considered for calculation of basic and diluted earnings per share 16,196.7 15,163.5
Weighted average number of equity shares considered for calculation of basic
earnings per share (a)* 584,157,080 583,520,367
Effect of dilution on account of Employee Stock Options granted (b)* 162,549 245,810
Weighted average number of equity shares considered for calculation of
diluted earnings per share (a+b)* 584,319,629 583,766,177
*Adjusted for bonus issue
Notes to financial statements for the year ended March 31, 2016
(All amounts in Indian Rupees million, except share data and where otherwise stated)

Annual Report 2015-16
127
30. Employee Stock Option Plan 'ESOP-2006'
The Company instituted an Employee Stock Option Plan 'ESOP-2006' as per the special resolution passed in the 19th Annual General Meeting held on
September 18, 2006. This scheme has been formulated in accordance with the Securities Exchange Board of India (Employee Stock Option Scheme and
Employee Stock Purchase Scheme) Guidelines, 1999. The compensation committee accordingly, granted total 3,240,500 options under seven grants of
175,000; 25,000; 90,000; 1,205,000; 300,000; 500,000; 915,500 and 30,000 options to eligible employees on October 30, 2006; July 31, 2007; October 31,
2007; December 16, 2011; June 19, 2012; January 9, 2013; January 28, 2013 and August 9, 2013 respectively. The method of settlement under scheme is by
issue of equity shares of the Company. Each option comprises of one underlying equity share of `1 each. The said options vest on an annual basis at 10%, 15%,
25% and 50% over a period of four years and can be exercised over a period of six years from the date of grant of options. The options have been granted at
the then prevailing market price of `120.70, `132.35, `114.50, `91.60, `106.05, `200.70, `187.40 and `161.30 per share respectively and hence the question
of accounting for employee deferred compensation expenses does not arise as the Company follows intrinsic value method.
The details of options outstanding of ESOP 2006 Scheme:
Year ended Year endedMarch 31, 2016 March 31, 2015
Options outstanding at the beginning of the year 1,556,145 2,131,369
Granted during the year – –
Additional options on adjustment of bonus issue @1:1 on July 22, 2015 1,143,470 –
Vested/exercisable during the year 1,497,564 474,570
Exercised during the year 1,205,036 525,254
Forfeited during the year subject to reissue 467,459 49,970
Options outstanding at end of the year 1,027,120 1,556,145
Exercisable at the end of the year 351,950 22,548
Weighted average exercise price for all the above options (`)* 60.27 107.52
Weighted average fair value of options at the date of grant (`)* 71.57 127.63
*For March 31, 2015 not adjusted for bonus issue
Range of Number of options Weighted average remainingexercise prices (`) outstanding contractual life of options (in years)
As at March 31, 2016 45 to 101 1,027,120 2.59
As at March 31, 2015 91 to 201 1,556,145 3.41
Disclosures as per Fair Value Method
The Company’s net profit and earnings per share would have been as under, had the compensation cost for employees’ stock options been recognized based on
the fair value at the date of grant in accordance with 'Black Scholes' model.
Year ended Year endedMarch 31, 2016 March 31, 2015
Profit after taxationAs reported in Statement of Profit and Loss 16,196.7 15,163.5
Less: Additional employee compensation cost based on Fair Value 17.9 23.6
Profit after taxation as per Fair Value Method 16,178.8 15,139.9
Earnings per share
Basic
No. of shares* 584,157,080 583,520,367
EPS as reported (`) 27.73 26.00
EPS as per Fair Value Method (`) 27.70 25.95
Diluted
No. of shares* 584,319,629 583,766,177
EPS as reported (`) 27.72 25.98
EPS as per Fair Value Method (`) 27.69 25.93
*adjusted for bonus issue
Notes to financial statements for the year ended March 31, 2016
(All amounts in Indian Rupees million, except share data and where otherwise stated)

128
The following assumptions were used for calculation of fair value of grants:
Year ended Year endedMarch 31, 2016 March 31, 2015
ESOP 2006 ESOP 2006
Risk-free interest rate (%) 8 8
Expected life of options (Years) 6 6
Expected volatility (%) 0.15 0.15
Dividend yield (%) 100 61
31. Employee benefits
Year ended Year endedMarch 31, 2016 March 31, 2015
a. Disclosures related to defined contribution plan
Provident fund contribution recognized as expense in the
Statement of Profit and Loss 220.2 153.1
b. Disclosures related to defined benefit plan
The Company has a defined benefit gratuity plan. Every employee who has completed five years or more of service gets a gratuity on departure at 15 days
last drawn salary for each completed year of service.
The scheme is funded with an insurance company in the form of a qualifying insurance policy. The following tables summarise the components of net
benefit expense recognized in the statement of profit and loss, the fund status and balance sheet position:
Statement of Profit and Loss
Year ended Year endedMarch 31, 2016 March 31, 2015
Net employee benefit expense (included under employee benefit expenses)
Current service cost 87.2 54.8
Interest cost on benefit obligation 45.5 36.0
Expected return on plan assets (20.2) (19.0)
Net actuarial (gain)/loss recognized in the year 22.0 101.7
Net benefit expense* 134.4 173.5
Actual return on plan assets 20.3 19.6
*Includes `6.2 (March 31, 2015: `1.5) transferred to capital work-in-progress
Balance Sheet
As at As atMarch 31, 2016 March 31, 2015
Details of provision for gratuity
Defined benefit obligation (DBO)* 618.1 503.4
Fair value of plan assets (FVA)** 340.5 246.9
Net plan liability 277.6 256.5
*DBO as at March 31, 2014: `341.0; March 31, 2013: `317.7; March 31, 2012: `240.9.
**FVPA as at March 31, 2014: `228.1; March 31, 2013: `202.7; March 31, 2012: `174.7.
Notes to financial statements for the year ended March 31, 2016
(All amounts in Indian Rupees million, except share data and where otherwise stated)

Annual Report 2015-16
129
Changes in the present value of the defined benefit obligation for gratuity are as follows:
Year ended Year endedMarch 31, 2016 March 31, 2015
Opening defined benefit obligation 503.4 341.1
Current service cost 87.2 54.8
Interest cost 45.5 36.0
Benefits paid (40.0) (30.8)
Actuarial losses on obligation* 22.0 102.3
Closing defined benefit obligation 618.1 503.4
* Experience adjustments on plan liabilities March 31, 2016: `11.8; March 31, 2015: `12.9; March 31, 2014: `9.7; March 31, 2013: `4.7 andMarch 31, 2012: `12.6.
Changes in fair value of plan assets
Year ended Year endedMarch 31, 2016 March 31, 2015
Opening fair value of plan assets 246.9 228.1
Expected return 20.2 19.0
Contributions by employer 113.3 30.0
Benefits paid (40.0) (30.8)
Actuarial gains* 0.1 0.6
Closing fair value of plan assets 340.5 246.9
* Experience adjustments on plan assets March 31, 2016: `0.00; March 31, 2015: `0.6 and March 31, 2014: `0.01;
March 31, 2013: `0.3 and March 31, 2012: `3.3.
The principal assumptions used in determining gratuity obligations for the Company's plans are shown below:
As at As atMarch 31, 2016 March 31, 2015
Discount rate (p.a.) (%) 7.95 7.90
Expected return on assets (p.a.) (%) 8.00 8.00
Employee turnover:
Age (Years)
21-30 (%) 8 8
31-40 (%) 4 4
41-57 (%) 1 1
Notes:
1. The estimates of future salary increases, considered in actuarial valuation take account of inflation, seniority, promotion and other relevant factors,
such as supply and demand in the employment market.
2. Percentage of plan assets as a percentage of the fair value of total plan assets with insurer is 100%.
3. The expected rate of return on assets is based on the expectation of the average long-term rate of return expected on investments of the fund
during the estimated term of the obligations.
4. The Company expects to contribute `65.0 (March 31, 2015: `30.0) to the qualifying insurance policy in 2016-17.
Notes to financial statements for the year ended March 31, 2016
(All amounts in Indian Rupees million, except share data and where otherwise stated)

130
32. Capital work-in-progress includes expenditure during construction period pending capitalization:
As at As atMarch 31, 2016 March 31, 2015
Balance brought forward 367.0 485.5
Add: Incurred during the year
Salaries, wages and bonus 315.9 43.1
Consumption of material for testing 196.3 –
Consumption of stores and spares 118.6 –
Carriage inward 1.2 0.2
Power and fuel 100.2 5.4
Conversion charges 29.9 1.7
Rates and taxes 1.9 2.3
Printing and stationery 8.6 0.2
Postage and telephones 1.2 0.1
Insurance 1.2 0.9
Legal and professional charges 2.5 0.1
Travelling and conveyance 11.1 1.0
Depreciation 3.1 2.3
Factory maintenance 25.5 5.2
Miscellaneous expenses 47.6 10.5
1,231.8 558.5
Less: Capitalized to fixed assets during the year 271.6 191.5
Balance carried forward 960.2 367.0
33. Disclosure regarding derivative financial instruments
a. The aggregate amount of forward contracts entered into by the Company and remaining outstanding as at Balance Sheet date are:
In foreign currency In Rupees
As at As at As at As atHedge - To sell against March 31, 2016 March 31, 2015 March 31, 2016 March 31, 2015
Receivable $7,000,095 – 463.8 –
Short-term borrowings $10,525,000 – 697.3 –
Receivable £4,800,000 – 458.3 –
Receivable €10,204,772 – 769.4 –
b. Particulars of unhedged foreign currency exposure are detailed below at the exchange rate prevailing as at the Balance Sheet date:
Particulars As at As atMarch 31, 2016 March 31, 2015
Loans availed (31,646.4) (31,929.3)
Trade receivables 25,924.4 29,718.3
Loans and advances (including other current assets) 266.5 361.7
Trade payables (including creditors for capital goods) (4,624.0) (3,693.8)
Interest accrued but not due (37.7) (87.4)
Investments 7,050.0 7,114.5
Bank balances 2,177.4 53.6
Notes to financial statements for the year ended March 31, 2016
(All amounts in Indian Rupees million, except share data and where otherwise stated)

Annual Report 2015-16
131
34. Details of dues to micro, small and medium enterprises as defined under the MSMED Act, 2006
Details As at As atMarch 31, 2016 March 31, 2015
The principal amount remaining unpaid as at the end of the year. 276.3 –
The amount of interest accrued and remaining unpaid at the end of the year. – –
Amount of interest paid by the Company in terms of Section 16 of Micro Small
and Medium Enterprise Development Act, 2006 along with the amounts of
payments made beyond the appointed date during the year. – –
Amount of interest due and payable for the period of delay in making payment
without the interest specified under the Micro Small and Medium Enterprise
Development Act, 2006. – –
The amount of further interest remaining due and payable in the succeeding years,
until such date when the interest dues as above are actually paid to the small
enterprises for the purpose of disallowance as a deductible expenditure underSection 23 of the Micro Small and Medium Enterprise Development Act, 2006. – –
35. In respect of the amounts mentioned under Section 125 of the Companies Act, 2013 there are no dues that are to be credited to the Investor Education andProtection Fund as at March 31, 2016 (March 31, 2015: `Nil).
36. Research and Development expenses
a. Details of Research and Development expenses incurred during the year, debited under various heads of Statement of Profit and Loss are given below:
Particulars Year ended Year endedMarch 31, 2016 March 31, 2015
Material and stores and spares consumption 859.3 605.2
Power and fuel 82.0 84.7
Repairs and maintenance 34.4 15.7
Employee benefit expenses 959.7 861.1
Analytical charges 507.2 341.1
Legal & professional charges 269.8 224.7
Registration and filing fee 1,036.3 689.2
Depreciation 229.3 237.5
Others 140.9 123.2
TOTAL 4,118.9 3,182.4
b. Details of capital expenditure incurred for Research and Development are given below:
ParticularsYear ended Year ended
March 31, 2016 March 31, 2015
Buildings 8.9 34.1
Plant and machinery
- Plant and machinery 52.7 73.7
- Lab equipment 197.9 219.4
- Pipes and valves 4.9 11.4
- Data processing equipment 12.0 22.8
- Electrical Installations 4.7 20.6
Office equipment 4.1 8.0
Furniture 21.4 26.4
TOTAL 306.6 416.4
Notes to financial statements for the year ended March 31, 2016
(All amounts in Indian Rupees million, except share data and where otherwise stated)

132
37. Remuneration to statutory auditors
ParticularsYear ended Year ended
March 31, 2016 March 31, 2015
As auditors
Statutory audit 7.9 6.9
Limited review 2.1 2.1
In other capacity
Certification 0.7 0.1
Others 6.0 1.0
Reimbursement of expenses and taxes 0.9 0.8
TOTAL 17.6 10.9
38. Donation to political parties
Particulars Year ended Year endedMarch 31, 2016 March 31, 2015
Communist Party of India (Marxist) 0.5 2.1
Communist Party of India – 1.2
Andhra Pradesh Congress Committee – 1.0
Bharatiya Janata Party – 2.0
Telangana Rashtra Samithi – 2.5
TOTAL 0.5 8.8
39. Related party disclosures
Names of related parties and description of relationship
Subsidiaries1. APL Pharma Thai Limited, Thailand2. All Pharma (Shanghai) Trading Company Limited, China3. Aurobindo Pharma USA Inc., U.S.A.4. Aurobindo Pharma Industria Farmaceutica Ltda, Brazil5. Helix Healthcare B.V., The Netherlands6. APL Holdings (Jersey) Limited, Jersey (Liquidated w.e.f. November 18, 2015)7. Aurobindo Pharma Produtos Farmaceuticos Ltda, Brazil8. APL Healthcare Limited, India9. Auronext Pharma Private Limited, India10. APL Research Centre Limited, India11. Auro Pharma Inc., Canada12. Aurobindo Pharma (Pty) Limited, South Africa13. Aurobindo Pharma (Australia) Pty Limited, Australia (Liquidated w.e.f. April 10, 2015)14. Agile Pharma B.V., The Netherlands15. Auro Healthcare (Nigeria) Limited, Nigeria16. Aurobindo Ilac Sanayi Ve Ticaret Limited, Turkey17. Aurobindo Pharma (Singapore) Pte Limited, Singapore (Liquidated w.e.f. December 31, 2015)18. Aurobindo Pharma Japan K.K., Japan19. Aurex B.V. (formerly Pharmacin B.V.), The Netherlands20. Aurobindo Pharma GmbH, Germany21. Aurobindo Pharma (Portugal) Unipessoal lda., Portugal22. Laboratorios Aurobindo S.L., Spain23. Agile Malta Holdings Limited, Malta (Merged with Aurobindo Pharma (Malta) Limited w.e.f. January 1, 2015)24. Aurobindo Pharma B.V., The Netherlands*25. Aurobindo Pharma (Romania) s.r.l., Romania26. Aurobindo Pharma (Italia) S.r.l., Italy27. Aurobindo Pharma (Malta) Limited, Malta28. APL IP Company Limited, Jersey (Liquidated w.e.f. November 18, 2015)
Notes to financial statements for the year ended March 31, 2016
(All amounts in Indian Rupees million, except share data and where otherwise stated)

Annual Report 2015-16
133
29. APL Swift Services (Malta) Limited, Malta30. Milpharm Limited, U.K.31. Aurolife Pharma LLC, U.S.A.32. Auro Peptides Limited, India33. Auro Medics Pharma LLC, U.S.A.34. Aurobindo Pharma NZ Limited, New Zealand (Liquidated w.e.f. April 10, 2015)35. Aurovida Farmaceutica S.A. DE C.V., Mexico36. Curepro Parenterals Limited, India37. Hyacinths Pharma Private Limited, India38. Silicon Life Sciences Private Limited, India39. AuroZymes Limited, India40. Eugia Pharma Specialities Limited, India41. Aurobindo Pharma Columbia S.A.S., Columbia42. Aurovitas Unipessioal LDA, Portugal43. Arrow Generiques SAS, France (w.e.f April 1, 2014)44. Actavis B.V., The Netherlands*45. Auro Health LLC, U.S.A.46. Aurobindo Antibiotics Limited, India47. Aurovitas S.L., Spain (Incorporated during previous year and closed w.e.f. December 2, 2014)48. Pharmacin B.V. (Formerly Aurex B.V.), The Netherlands49. Actavis France SAS, France (Merged with Arrow Generiques SAS w.e.f. April 1, 2015)50. 1980 Puren Pharma GmbH (Formerly Actavis Management GmbH), Germany (w.e.f. April 1, 2014)51. Puren Pharma GmbH & Co. KG (formerly Actavis Deutschland GmbH & Co. KG), Germany (w.e.f. April 1, 2014)52. Aurovitas Spain SA (formerly Actavis Spain SA) (w.e.f. April 1, 2014)53. Natrol LLC, U.S.A. (w.e.f. December 4, 2014)54. Tergene Biotech Private Limited, India (w.e.f. April 1, 2015)55. Aurobindo Pharma Limited S.R.L., Dominican Republic (Liquidated w.e.f. December 18, 2014)* Aurobindo Pharma B.V. was merged with Actavis B.V. Subsequently, the name of Actavis B.V. was changed to Aurobindo Pharma B.V. w.e.f. July 1, 2015.
Joint ventures1. Novagen Pharma (Pty) Limited, South Africa (Joint Venture of a Subsidiary)
Enterprises over which key management personnel or their relatives exercise significant influence1. Pravesha Industries Private Limited, India2. Sri Sai Packaging, India (Partnership firm)3. Trident Chemphar Limited, India4. Auropro Soft Systems Private Limited, India5. Axis Clinicals Limited, India6. Pranit Projects Private Limited, India7. Pranit Packaging Private Limited, India8. Cogent Glass Limited, India9. Orem Access Bio Inc, India10. Veritaz Healthcare Limited, India11. Alex Merchant Pte. Limited, Singapore12. Trident Petrochemicals DMCC, Dubai
Key managerial personnel1. Mr. K. Nithyananda Reddy, Whole-time Director2. Dr. M. Sivakumaran, Whole-time Director3. Mr. M. Madan Mohan Reddy, Whole-time Director4. Mr. N. Govindarajan, Managing Director5. Mr. Sudhir B. Singhi, Chief Financial Officer (upto June 30, 2014)6. Mr. Santhanam Subramanian, Chief Financial Officer (w.e.f. July 1, 2014)7. Mr. A. Mohan Rami Reddy, Company Secretary
Relatives to key managerial personnel1. Mr. P. Sarath Chandra Reddy (Son-in-law of Mr. K. Nithyananda Reddy, Whole-time Director)2. Mr. Vishnu M. Sriram (Son-in-law of Dr. M. Sivakumaran, Whole-time Director)
Notes to financial statements for the year ended March 31, 2016
(All amounts in Indian Rupees million, except share data and where otherwise stated)

134
Transactions with related parties
ParticularsYear ended Year ended
March 31, 2016 March 31, 2015
a. Loans given and repayment thereofTransactions with subsidiariesHelix Healthcare B.V., The Netherlands
Receipt against loan and interest – 781.4
Interest accrued – 6.2
Balance receivable – –
Auro Peptides Limited, IndiaReceipt against loan and interest – 502.1
Interest accrued – 34.3
Loan given – 174.1
Balance receivable – –
AuroZymes Limited, IndiaReceipt against loan and interest – 0.8
Interest accrued 2.8 0.8
Loan given 19.5 20.5
Balance receivable 42.8 20.5
Silicon Life Sciences Private Limited, IndiaReceipt against loan and interest – 0.1
Interest accrued 7.9 0.1
Loan given 195.0 7.5
Balance receivable 210.4 7.5
b. Sale/purchase of goods, services and other transactionsTransactions with subsidiariesAPL Pharma Thai Limited, Thailand
Sale of goods 485.9 261.6
Balance receivable 361.9 102.3
ALL Pharma (Shanghai) Trading Company Limited, ChinaPurchases 1,045.6 2,648.4
Reimbursement of expenses 12.5 10.8
Purchase of fixed assets 44.3 7.0
Sale of goods – 0.9
Balance receivable 1.0 1.0
Balance payable 21.3 885.3
Helix Healthcare B.V., The NetherlandsEquity contribution 820.2 373.0
Corporate guarantee for loans 2,337.2 2,082.9
Aurobindo Pharma Produtos Farmaceuticos Ltda, BrazilSale of goods 642.5 520.5
Reimbursement of expenses 1.7 2.5
Sales Commission 16.8 17.8
Balance receivable 532.7 509.0
Balance payable 1.9 3.2
APL Swift Services (Malta) Limited, MaltaSale of goods 2,412.1 2,512.5
Commission – 0.2
Reimbursement of expenses 19.9 9.0
Balance receivable 2,428.9 1,863.1
Balance payable 7.9 3.0
Aurobindo Pharma USA Inc., U.S.A.Sale of goods 22,023.5 21,471.0
Reimbursement of expenses 19.6 2.0
Notes to financial statements for the year ended March 31, 2016
(All amounts in Indian Rupees million, except share data and where otherwise stated)

Annual Report 2015-16
135
ParticularsYear ended Year ended
March 31, 2016 March 31, 2015
Purchases 28.7 –Balance receivable 15,132.6 16,815.2Balance payable 8.7 7.1Corporate guarantee for loans 7,155.5 –
Aurobindo Pharma Industria Farmaceutica Ltda, BrazilSale of goods 572.7 698.4Reimbursement of expenses 8.8 5.0Balance receivable 135.7 289.9Balance payable – 0.9
Auro Pharma Inc., CanadaSale of goods 364.4 180.1Reimbursement of expenses 0.9 0.8Balance receivable 317.8 111.5Balance payable 6.7 11.1
Aurobindo Pharma (Pty) Limited, South AfricaSale of goods 365.3 352.0Reimbursement of expenses paid 0.2 0.4Reimbursement of expenses received – 0.5Sales Commission 18.9 –Balance receivable 124.5 158.6Balance payable 18.9 –
Pharmacin B.V., The Netherlands (Formerly Aurex B.V.)Sale of goods 4.7 –Balance receivable 2.9 –
Aurex B.V., The Netherlands (Formerly Pharmacin B.V.)Sale of goods 88.3 54.3Sales Commission – 58.7Reimbursement of expenses 22.6 0.1Balance receivable 58.2 3.4
Milpharm Limited, U.K.Sale of goods 1,089.7 98.7Reimbursement of expenses 20.6 7.7Balance receivable 856.5 34.3Balance payable 12.6 5.0
Aurolife Pharma LLC, U.S.A.Sale of goods 2,879.1 1,704.6Reimbursement of expenses 1.2 0.1Reimbursement of expenses received – 13.1Balance receivable 1,265.5 931.6
Aurobindo Pharma Japan K.K., JapanSale of goods 302.4 31.0Reimbursement of expenses 0.1 0.3Sales Commission 25.1 36.4Balance receivable 201.4 18.4Balance payable – 4.0
Aurobindo Pharma (Malta) Limited, MaltaReimbursement of expenses 0.1 129.9Balance payable 0.8 –
Auronext Pharma Private Limited, IndiaSale of goods 87.6 44.8
Purchases 46.9 78.6
Rent received 1.8 1.6
Reimbursement of expenses 13.6 16.2
Notes to financial statements for the year ended March 31, 2016
(All amounts in Indian Rupees million, except share data and where otherwise stated)

136
ParticularsYear ended Year ended
March 31, 2016 March 31, 2015
Equity allotment 119.7 400.5Balance receivable 78.0 30.0Balance payable 5.7 –Investment in 9.5% cumulative redeemable preference shares 280.0 –
Aurobindo Pharma (Australia) Pty Limited, AustraliaSale of goods – 72.0Reimbursement of expenses – 9.7Balance receivable – 72.1Balance payable – 3.2
Laboratorios Aurobindo S.L., SpainSale of goods 715.3 532.2Reimbursement of expenses 1.5 2.1Reimbursement of expenses received 2.1 –Balance receivable 581.1 352.4
Auro Medics Pharma LLC, U.S.A.Sale of goods 5,778.2 3,358.2Reimbursement of expenses received 0.3 –Balance receivable 3,960.0 1,905.3
Auro Healthcare (Nigeria) Limited, NigeriaSales commission 3.3 2.1
APL Healthcare Limited, IndiaSale of goods – 0.4Sale of fixed assets – 3.3Reimbursement of expenses received 0.8 0.8Balance receivable 1.9 2.3Equity allotment 319.6 415.0
APL Research Centre Limited, IndiaEquity allotment 1.6 3.0
Curepro Parenterals Limited, IndiaEquity allotment 545.0 90.0
Hyacinths Pharma Private Limited, IndiaEquity allotment 12.5 3.8
Auro Peptides Limited, IndiaInvestment in 9.5% cumulative redeemable preference shares 160.0 500.0Rent received 6.3 5.4Reimbursement of expenses received 32.9 25.0Purchase of fixed assets 0.1 –Sale of goods 3.2 4.9Purchases 64.7 12.7Balance receivable 0.8 13.3Balance payable 9.0 –
Silicon Life Sciences Private Limited, IndiaSale of goods 170.7 156.3Sale of fixed assets 2.0 3.6Purchases 151.6 76.1Purchase of services 5.8 26.1Reimbursement of expenses received 0.2 3.7Balance receivable 186.3 157.9Balance payable 13.1 3.6Equity allotment 12.5 156.3
Eugia Pharma Specialities Limited, IndiaSale of goods 4.2 0.0
Sale of fixed assets 1.2 0.3
Notes to financial statements for the year ended March 31, 2016
(All amounts in Indian Rupees million, except share data and where otherwise stated)

Annual Report 2015-16
137
ParticularsYear ended Year ended
March 31, 2016 March 31, 2015
Reimbursement of Expenses Received – 1.1
Balance receivable – 0.9
Aurovida Farmaceutica, SA DE CV, MexicoSale of goods 2.9 7.0
Balance receivable 1.1 7.3
Aurobindo Pharma B.V., The Netherlands*Sale of goods – 73.6
Reimbursement of expenses – 0.3
Balance payable – 0.2
Balance receivable – 51.9
Aurobindo Pharma, PortugalReimbursement of expenses 27.6 0.0
Balance payable 4.7 –
Aurobindo Pharma France SARL, FranceReimbursement of expenses – 0.1
Aurobindo Colombia S.A.S., ColombiaSale of goods 39.1 72.6
Reimbursement of expenses 1.3 2.7
Balance receivable 54.9 75.0
Arrow Generiques S.A.S., FranceSale of goods – 38.7
Reimbursement of expenses 0.9 –
Reimbursement of expenses received 3.1 –
Balance receivable 2.9 8.9
Aurobindo Pharma B.V. (formerly Actavis B.V.), The Netherlands*Sale of goods 315.5 50.7
Reimbursement of expenses 13.0 2.1
Balance receivable 240.8 24.1
Balance payable 0.3 2.0
Agile Pharma B.V., The NetherlandsCorporate guarantee for loans 1,130.9 1,007.9
Aurovitas Spain SAS, SpainSale of goods 26.4 –
Reimbursement of expenses received 0.2 –
Balance receivable 26.6 –
Balance payable 0.2 –
Aurovitas Unipessol, PortugalReimbursement of expenses 40.9 –
Balance payable 2.9 –
Aurobindo Pharma GmbH, GermanyReimbursement of expenses 3.7 –
Balance receivable – –
Aurobindo Pharma Italia, ItalyPurchases 0.1 –
Balance payable 0.1 –
Tergene Biotech Private Limited, IndiaEquity allotment 33.9 –
Investment in 10.5% cumulative redeemable preference shares 40.0 –
Aurobindo Antibiotics Limited, IndiaShare application money 12.5 –
Note: For closing balance of investments and provision for diminution in value of investments, Refer Note 11.
Notes to financial statements for the year ended March 31, 2016
(All amounts in Indian Rupees million, except share data and where otherwise stated)

138
ParticularsYear ended Year ended
March 31, 2016 March 31, 2015
c. Sale/purchase of goods, services and other transactions
Transactions with joint venture
Novagen Pharma (Pty) Limited, South Africa
Sale of goods 558.1 164.9
Reimbursement of expenses received 0.2 0.1
Balance receivable 143.3 37.4
d. Transactions with enterprises over which key management personnel or
their relatives exercise significant influence
Pravesha Industries Private Limited, India
Sale of goods – 0.2
Purchases 1,755.5 1,471.9
Rent and electricity charges received 1.0 0.3
Balance payable – 0.6
Balance receivable 0.1 –
Sri Sai Packaging, India
Sale of goods 0.4 0.3
Purchases 195.6 168.9
Balance receivable 0.0 0.0
Axis Clinicals Limited, India
Purchase of services 438.9 308.0
Balance payable 79.0 22.7
Axis Clinicals LLC, U.S.A.
Purchase of services 10.5 –
Balance payable 5.2 –
Trident Chemphar Limited, India
Sale of goods – 77.3
Purchases 696.1 1,198.7
Balance payable 108.4 64.9
Auropro Soft Systems Private Limited, India
Purchases – 2.5
Purchase of services – 3.7
Pranit Packaging Private Limited, India
Purchases 165.3 121.4
Sale of goods – –
Balance receivable – 0.6
Pranit Projects Private Limited, India
Purchase of services (Civil services) 19.5 49.7
Cogent Glass Limited, India
Purchases 561.7 446.6
Balance payable 135.6 25.6
Orem Access Bio Inc, India
Purchases 114.3 85.5
Balance payable – –
Veritaz Healthcare Limited, India
Sale of goods 2.7 7.1
Purchase of services – 14.5
Rent received 0.3 0.3
Payables – 0.0
Balance receivable 2.7 4.6
Notes to financial statements for the year ended March 31, 2016
(All amounts in Indian Rupees million, except share data and where otherwise stated)

Annual Report 2015-16
139
ParticularsYear ended Year ended
March 31, 2016 March 31, 2015
Alex Merchant Pte. Limited, Singapore
Purchases – 309.1
Balance receivable – 8.4
Trident Petrochemicals DMCC, Dubai
Purchases 164.6 156.3
Balance receivable – 39.9
Balance payable 0.1 –
e. Transactions with key managerial personnel or their relatives
Mr. K. Nithyananda Reddy
Managerial remuneration 14.3 10.5
Rent expense 2.2 2.0
Dr. M. Sivakumaran
Managerial remuneration 14.3 10.5
Mr. M. Madan Mohan Reddy
Managerial remuneration 15.2 10.5
Mr. P. Sarath Chandra Reddy
Director sitting fees 0.4 0.4
Mr. Vishnu M. Sriram
Remuneration 4.4 4.1
Equity allotment–ESOP 0.2 0.2
Mr. N. Govindarajan
Managerial remuneration 90.5 59.7
Equity allotment – ESOP 22.9 11.5
Balance payable 65.0 40.0
Mr. Sudhir B. Singhi
Remuneration (upto June 30, 2014) – 2.5
Mr. Santhanam Subramanian
Remuneration (w.e.f. July 1, 2014) 11.9 6.6
Balance payable 2.0 –
Mr. A. Mohan Rami Reddy
Remuneration 3.3 3.9
Equity allotment – ESOP 0.3 0.2
Loan outstanding – 0.1
Note: Managerial remuneration does not include provision for gratuity and leave encashment, which is determined for the Company as a whole.
f. Loans and advances in the nature of loans to subsidiaries - Maximum amount outstanding
Maximum outstanding atClosing Balance any time during the yearas at March 31 ended March 31
Name of the companies 2016 2015 2016 2015
Auro Peptides Limited, India – – – 462.1
Helix Healthcare B.V., The Netherlands – – – 746.9
AuroZymes Limited, India 40.0 20.5 40.0 20.5
Silicon Life Sciences Private Limited, India 202.5 7.5 202.5 7.5
Notes to financial statements for the year ended March 31, 2016
(All amounts in Indian Rupees million, except share data and where otherwise stated)

140
40. Leases
a. Operating lease
i. Operating leases are mainly in the nature of lease of office premises with no restrictions and are renewable/cancellable at the option of either of
the parties except for details in (ii) below. There is no escalation clause in the lease agreement. There are no sub-leases. There are no restrictions
imposed by lease arrangements. The aggregate amount of operating lease payments recognized in the Statement of Profit and Loss is `71.1
(March 31, 2015: `74.3).
The Company has not recognized any contingent rent as expense in the Statement of Profit and Loss.
ii. The Company has entered into non-cancellable leases for office premises in current year and previous year. These leases have remaining non-
cancellable period of 17 months (March 31, 2015: 29 months). The lease includes an escalation clause in the lease agreement. Future minimum
lease rentals under non-cancellable operating leases are as follows:
Particulars March 31, 2016 March 31, 2015
a. Within one year 42.3 40.3
b. After one year and not more than three years 18.0 60.3
c. After three years and not more than five years – –
b. Finance lease
Building includes factory buildings acquired on finance lease. The agreement is silent on renewal terms and transfer of legal title at the end of lease term.
The lease agreement did not specify minimum lease payments over the future period. The factory building is acquired on lease at a consideration of `25.5(March 31, 2015: `25.5).
The net carrying amount of the buildings obtained on finance lease - `10.8 (March 31, 2015: `12.1).
41. In accordance with paragraph 10 of Notified Accounting Standard 9 on Revenue Recognition, excise duty on sales amounting to `1,565.8 (March 31, 2015:`1,497.4) has been reduced from sales in Statement of Profit and Loss and excise duty on increase/decrease in closing stock of finished goods amounting to`12.2 (March 31, 2015: `2.7) has been debited to the Statement of Profit and Loss.
42. Details of advances due from private companies in which Company's Director is a director:
Pranit Packaging Private Limited, India `Nil (March 31, 2015: `0.6).
43. i. Details of trade receivables due from private companies in which Company's Director is a director:
Pravesha Industries Private Limited, India `0.1 (March 31, 2015: `Nil)
ii. Details of trade receivables due from partnership firm in which Company's Director is a partner:
Sri Sai Packaging, India `0.02 (March 31, 2015: `0.02)
44. The Board of Directors at their meeting held on September 12, 2013 decided to transfer its injectable unit of the Company on a going concern basis comprisingassets and liabilities pertaining to the said unit to its wholly owned subsidiary Curepro Parenterals Limited with effect from April 1, 2014. The same is subjectto requisite consent, approval or permission of the statutory or regulatory authorities. Pending such approvals, no effect of this scheme has been given in thefinancial statements.
45. Interest in joint ventures
Details of interest in jointly controlled entities are given below:
Name of joint venture Share Assets Liabilities Income ExpenditureProfit after
tax
Novagen Pharma (Pty) Limited 50% 417.4 149.7 648.2 569.5 78.7 349.7 94.1 667.4 579.1 88.3
a. Contingent liabilities of the above joint ventures `Nil (March 31, 2015: `Nil).
b. Capital commitments of the above joint ventures `Nil (March 31, 2015: `Nil).
c. Novagen Pharma (Pty) Limited incorporated in South Africa, is engaged in distribution of pharmaceuticals products.
d. Previous year's figures have been disclosed in italics.
e. All figures presented above represents Company's share only.
Notes to financial statements for the year ended March 31, 2016
(All amounts in Indian Rupees million, except share data and where otherwise stated)

Annual Report 2015-16
141
46. Imported and indigenous raw materials, stores and spares and lab chemicals consumed (excluding expenses incurred during construction period)
Year ended Year endedMarch 31, 2016 March 31, 2015% ` % `
Raw materials and packing material
Imported 53 23,446.7 55 21,536.3
Indigenous 47 20,811.3 45 17,667.0
TOTAL 100 44,258.0 100 39,203.3
Stores and spares
Imported 11 151.5 8 97.7
Indigenous 89 1,227.6 92 1,062.0
TOTAL 100 1,379.1 100 1,159.7
Lab chemicals
Imported 18 280.6 16 184.2
Indigenous 82 1,247.6 84 965.1
TOTAL 100 1,528.2 100 1,149.3
47. Value of imports calculated on CIF basis
Year ended Year endedMarch 31, 2016 March 31, 2015
Raw materials and packing materials 22,688.2 21,210.5
Capital goods 2,418.5 1,210.8
Stores and spares 245.0 185.1
Lab chemicals 232.2 171.9
Coal 609.4 493.4
TOTAL 26,193.3 23,271.7
48. Expenditure in foreign currency (accrual basis)
Year ended Year endedMarch 31, 2016 March 31, 2015
Travelling and conveyance 11.3 18.0
Sales commission 339.1 298.9
Registration and filing charges 1,073.5 653.8
Legal and professional charges 328.1 256.5
Overseas representative office expenses 151.6 129.7
Interest on loans from banks 500.7 329.6
Others 200.9 370.4
TOTAL 2,605.2 2,056.9
Notes to financial statements for the year ended March 31, 2016
(All amounts in Indian Rupees million, except share data and where otherwise stated)

142
49. Earnings in foreign currency (accrual basis)
Year ended Year endedMarch 31, 2016 March 31, 2015
Exports on F.O.B. basis 70,926.8 62,514.1
Interest on loans to subsidiaries – 6.2
Interest others 1.2 50.4
Receipt on samples 7.0 4.5
Profit on sale of investment 63.8 –
Sale of dossiers/services 16.3 37.8
TOTAL 71,015.1 62,613.0
50. Segment reporting
In accordance with Accounting Standard 17 - Segment Reporting, segment information has been provided in the consolidated financial statements of the
Company and therefore no separate disclosure on segment information is given in these standalone financial statements.
51. The figures of previous year have been regrouped/rearranged, wherever necessary to conform to those of the current year.
As per our report of even date. For and on behalf of the Board of Directors of Aurobindo Pharma Limited
For S.R. BATLIBOI & ASSOCIATES LLPChartered AccountantsICAI Firm registration number:101049W/E300004 N. Govindarajan Dr. M. Sivakumaran
Managing Director DirectorDIN: 00050482 DIN: 01284320
per Vikas Kumar PansariPartnerMembership No. 93649 Santhanam Subramanian A. Mohan Rami Reddy
Chief Financial Officer VP (Legal) &Hyderabad, May 30, 2016 Company Secretary
Notes to financial statements for the year ended March 31, 2016
(All amounts in Indian Rupees million, except share data and where otherwise stated)

Annual Report 2015-16
143
To the Members of
Aurobindo Pharma Limited
Report on the Consolidated Financial
Statements
We have audited the accompanying consolidated
financial statements of Aurobindo Pharma Limited
(hereinafter referred to as 'the Holding Company'),
its subsidiaries (the Holding Company and its
subsidiaries together referred to as 'the Group')
and joint venture, comprising of the Consolidated
Balance Sheet as at March 31, 2016, the
Consolidated Statement of Profit and Loss and
Consolidated Cash Flow Statement for the year
then ended, and a summary of significant
accounting policies and other explanatory
information (hereinafter referred to as 'the
consolidated financial statements').
Management's Responsibility for the
Consolidated Financial Statements
The Holding Company's Board of Directors is
responsible for the preparation of these
consolidated financial statements in terms with
the requirement of the Companies Act, 2013 ('the
Act') that give a true and fair view of the
consolidated financial position, consolidated
financial performance and consolidated cash flows
of the Group in accordance with accounting
principles generally accepted in India, including
the Accounting Standards specified under Section
133 of the Act, read with Rule 7 of the Companies
(Accounts) Rules, 2014. The respective Board of
Directors of the companies included in the Group
and joint venture are responsible for maintenance
of adequate accounting records in accordance with
the provisions of the Act for safeguarding of the
assets of the Group and for preventing and
detecting frauds and other irregularities; the
selection and application of appropriate
accounting policies; making judgments and
estimates that are reasonable and prudent; and
the design, implementation and maintenance of
adequate internal financial control that were
operating effectively for ensuring the accuracy and
completeness of the accounting records, relevant
to the preparation and presentation of the
financial statements that give a true and fair view
and are free from material misstatement, whether
due to fraud or error, which have been used for the
purpose of preparation of the consolidated
financial statements by the Directors of the
Holding Company, as aforesaid.
Auditor's Responsibility
Our responsibility is to express an opinion on
these consolidated financial statements based on
our audit. While conducting the audit, we have
taken into account the provisions of the Act, the
accounting and auditing standards and matters
which are required to be included in the audit
report under the provisions of the Act and the
Rules made there under. We conducted our audit in
accordance with the Standards on Auditing, issued
by the Institute of Chartered Accountants of India,
as specified under Section 143(10) of the Act.
Those Standards require that we comply with
ethical requirements and plan and perform the
audit to obtain reasonable assurance about
whether the financial statements are free from
material misstatement.
An audit involves performing procedures to obtain
audit evidence about the amounts and disclosures
in the consolidated financial statements. The
procedures selected depend on the auditor's
judgment, including the assessment of the risks of
material misstatement of the consolidated
financial statements, whether due to fraud or error.
In making those risk assessments, the auditor
considers internal financial control relevant to the
Holding Company's preparation of the consolidated
financial statements that give a true and fair view
in order to design audit procedures that are
appropriate in the circumstances. An audit also
includes evaluating the appropriateness of
accounting policies used and the reasonableness of
the accounting estimates made by the Holding
Company's Board of Directors, as well as evaluating
the overall presentation of the consolidated
financial statements. We believe that the audit
evidence obtained by us and the audit evidence
obtained by the other auditors in terms of their
reports referred to in Other Matters below, is
sufficient and appropriate to provide a basis for
our audit opinion on the consolidated financial
statements.
Opinion
In our opinion and to the best of our information
and according to the explanations given to us, the
consolidated financial statements give the
information required by the Act in the manner so
required and give a true and fair view in
conformity with the accounting principles
generally accepted in India of the consolidated
state of affairs of the Group and joint venture as
at March 31, 2016, their consolidated profit, and
their consolidated cash flows for the year ended
on that date.
Report on Other Legal and Regulatory
Requirements
As required by Section 143 (3) of the Act, we
report, to the extent applicable, that:
a. We/the other auditors whose reports we have
relied upon have sought and obtained all the
information and explanations which to the
best of our knowledge and belief were
necessary for the purpose of our audit of the
aforesaid consolidated financial statements;
b. In our opinion proper books of account as
required by law relating to preparation of the
aforesaid consolidated financial statements
have been kept so far as it appears from our
examination of those books and the reports
of the other auditors;
c. The Consolidated Balance Sheet, Consolidated
Statement of Profit and Loss, and
Consolidated Cash Flow Statement dealt with
by this Report are in agreement with the
relevant books of account maintained for the
purpose of preparation of the consolidated
financial statements;
d. In our opinion, the aforesaid consolidated
financial statements comply with the
Accounting Standards specified under Section
133 of the Act, read with Rule 7 of the
Companies (Accounts) Rules, 2014;
e. On the basis of the written representations
received from the directors of the Holding
Company as on March 31, 2016 taken on
record by the Board of Directors of the
Independent Auditors' Report

144
Holding Company and the reports of the
auditors who are appointed under Section
139 of the Act, of its subsidiary companies
incorporated in India, none of the Directors
of the Group's companies incorporated in
India is disqualified as on March 31, 2016
from being appointed as a director in terms
of Section 164 (2) of the Act;
f. With respect to the adequacy and the
operating effectiveness of the internal
financial controls over financial reporting of
the Holding Company and its subsidiaries
incorporated in India, refer to our separate
report in 'Annexure 1' to this report;
g. With respect to the other matters to be
included in the Auditor's Report in
accordance with Rule 11 of the Companies
(Audit and Auditors) Rules, 2014, in our
opinion and to the best of our information
and according to the explanations given to
us:
i. The consolidated financial statements
disclose the impact of pending
litigations on its consolidated financial
position of the Group and joint venture
- Refer Note 29 to the consolidated
financial statements;
ii. The Group and joint venture did not
have any material foreseeable losses in
long-term contracts including derivative
contracts;
iii. There has been no delay in transferring
amounts, required to be transferred, to
the Investor Education and Protection
Fund by the Holding Company, and its
subsidiary companies incorporated in
India.
Other Matter
The accompanying consolidated financial
statements include total assets of
`76,479,975,683 as at March 31, 2016, and total
revenues and net cash inflows of `85,949,734,217
and `497,759,251 for the year ended on that date,
in respect of 52 subsidiaries, and a joint venture,
which have been audited by other auditors, which
financial statements, other financial information
and auditor's reports have been furnished to us by
the management. Our opinion on the consolidated
financial statements, in so far as it relates to the
amounts and disclosures included in respect of
these subsidiaries, and joint venture and our
report in terms of sub-sections (3) of Section 143
of the Act, in so far as it relates to the aforesaid
subsidiaries, and joint venture, is based solely on
the report(s) of such other auditors.
Our opinion on the consolidated financial
statements, and our report on Other Legal and
Regulatory Requirements above, is not modified in
respect of the above matters with respect to our
reliance on the work done and the reports of the
other auditors and the financial statements and
other financial information certified by the
management
For S.R. Batliboi & Associates LLPChartered AccountantsICAI Firm Registration Number: 101049W/E300004
per Vikas Kumar PansariPartnerMembership Number: 93649
HyderabadMay 30, 2016
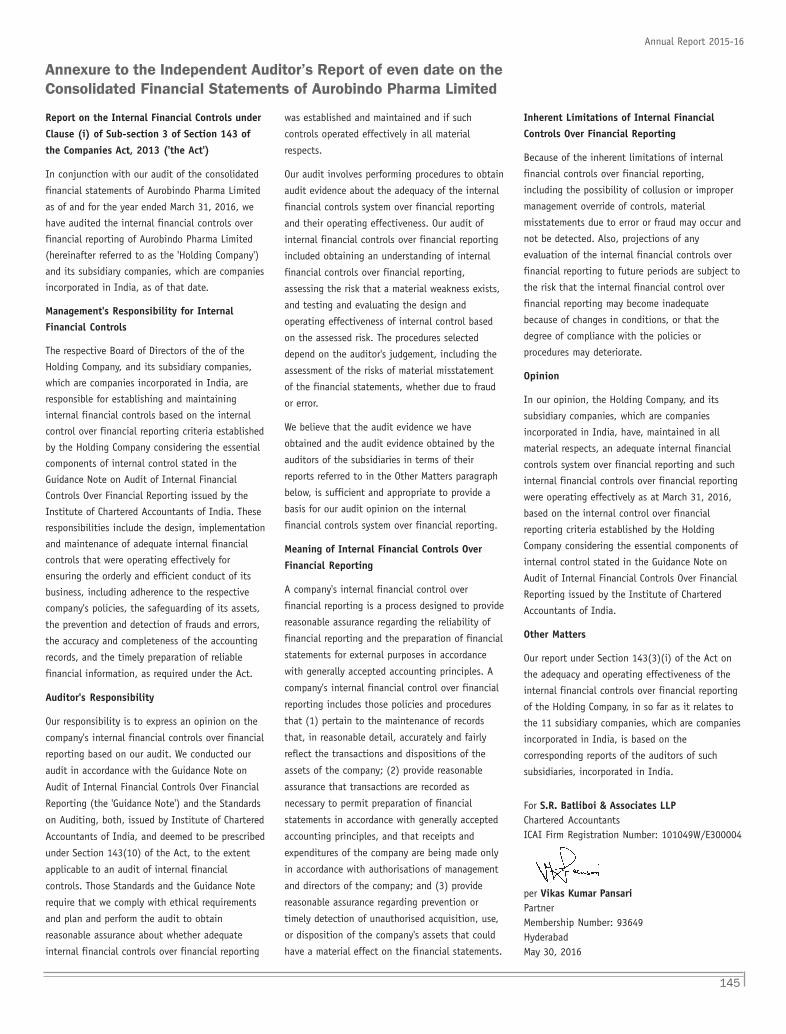
Annual Report 2015-16
145
Report on the Internal Financial Controls under
Clause (i) of Sub-section 3 of Section 143 of
the Companies Act, 2013 ('the Act')
In conjunction with our audit of the consolidated
financial statements of Aurobindo Pharma Limited
as of and for the year ended March 31, 2016, we
have audited the internal financial controls over
financial reporting of Aurobindo Pharma Limited
(hereinafter referred to as the 'Holding Company')
and its subsidiary companies, which are companies
incorporated in India, as of that date.
Management's Responsibility for InternalFinancial Controls
The respective Board of Directors of the of the
Holding Company, and its subsidiary companies,
which are companies incorporated in India, are
responsible for establishing and maintaining
internal financial controls based on the internal
control over financial reporting criteria established
by the Holding Company considering the essential
components of internal control stated in the
Guidance Note on Audit of Internal Financial
Controls Over Financial Reporting issued by the
Institute of Chartered Accountants of India. These
responsibilities include the design, implementation
and maintenance of adequate internal financial
controls that were operating effectively for
ensuring the orderly and efficient conduct of its
business, including adherence to the respective
company's policies, the safeguarding of its assets,
the prevention and detection of frauds and errors,
the accuracy and completeness of the accounting
records, and the timely preparation of reliable
financial information, as required under the Act.
Auditor's Responsibility
Our responsibility is to express an opinion on the
company's internal financial controls over financial
reporting based on our audit. We conducted our
audit in accordance with the Guidance Note on
Audit of Internal Financial Controls Over Financial
Reporting (the 'Guidance Note') and the Standards
on Auditing, both, issued by Institute of Chartered
Accountants of India, and deemed to be prescribed
under Section 143(10) of the Act, to the extent
applicable to an audit of internal financial
controls. Those Standards and the Guidance Note
require that we comply with ethical requirements
and plan and perform the audit to obtain
reasonable assurance about whether adequate
internal financial controls over financial reporting
Annexure to the Independent Auditor’s Report of even date on the
Consolidated Financial Statements of Aurobindo Pharma Limited
was established and maintained and if such
controls operated effectively in all material
respects.
Our audit involves performing procedures to obtain
audit evidence about the adequacy of the internal
financial controls system over financial reporting
and their operating effectiveness. Our audit of
internal financial controls over financial reporting
included obtaining an understanding of internal
financial controls over financial reporting,
assessing the risk that a material weakness exists,
and testing and evaluating the design and
operating effectiveness of internal control based
on the assessed risk. The procedures selected
depend on the auditor's judgement, including the
assessment of the risks of material misstatement
of the financial statements, whether due to fraud
or error.
We believe that the audit evidence we have
obtained and the audit evidence obtained by the
auditors of the subsidiaries in terms of their
reports referred to in the Other Matters paragraph
below, is sufficient and appropriate to provide a
basis for our audit opinion on the internal
financial controls system over financial reporting.
Meaning of Internal Financial Controls Over
Financial Reporting
A company's internal financial control over
financial reporting is a process designed to provide
reasonable assurance regarding the reliability of
financial reporting and the preparation of financial
statements for external purposes in accordance
with generally accepted accounting principles. A
company's internal financial control over financial
reporting includes those policies and procedures
that (1) pertain to the maintenance of records
that, in reasonable detail, accurately and fairly
reflect the transactions and dispositions of the
assets of the company; (2) provide reasonable
assurance that transactions are recorded as
necessary to permit preparation of financial
statements in accordance with generally accepted
accounting principles, and that receipts and
expenditures of the company are being made only
in accordance with authorisations of management
and directors of the company; and (3) provide
reasonable assurance regarding prevention or
timely detection of unauthorised acquisition, use,
or disposition of the company's assets that could
have a material effect on the financial statements.
Inherent Limitations of Internal FinancialControls Over Financial Reporting
Because of the inherent limitations of internal
financial controls over financial reporting,
including the possibility of collusion or improper
management override of controls, material
misstatements due to error or fraud may occur and
not be detected. Also, projections of any
evaluation of the internal financial controls over
financial reporting to future periods are subject to
the risk that the internal financial control over
financial reporting may become inadequate
because of changes in conditions, or that the
degree of compliance with the policies or
procedures may deteriorate.
Opinion
In our opinion, the Holding Company, and its
subsidiary companies, which are companies
incorporated in India, have, maintained in all
material respects, an adequate internal financial
controls system over financial reporting and such
internal financial controls over financial reporting
were operating effectively as at March 31, 2016,
based on the internal control over financial
reporting criteria established by the Holding
Company considering the essential components of
internal control stated in the Guidance Note on
Audit of Internal Financial Controls Over Financial
Reporting issued by the Institute of Chartered
Accountants of India.
Other Matters
Our report under Section 143(3)(i) of the Act on
the adequacy and operating effectiveness of the
internal financial controls over financial reporting
of the Holding Company, in so far as it relates to
the 11 subsidiary companies, which are companies
incorporated in India, is based on the
corresponding reports of the auditors of such
subsidiaries, incorporated in India.
For S.R. Batliboi & Associates LLPChartered AccountantsICAI Firm Registration Number: 101049W/E300004
per Vikas Kumar PansariPartnerMembership Number: 93649HyderabadMay 30, 2016

146
EQUITY AND LIABILITIES
SHAREHOLDERS' FUNDSShare capital 2 585.2 292.0Reserves and surplus 3 69,982.1 51,267.1
70,567.3 51,559.1Minority interest 595.5 258.2
NON-CURRENT LIABILITIESLong-term borrowings 4 8,472.0 13,614.7Deferred tax liabilities 5 2,364.5 2,105.3Long-term provisions 6 235.4 243.5
11,071.9 15,963.5CURRENT LIABILITIES
Short-term borrowings 7 32,290.2 25,020.8Trade payables 8 25,267.7 20,511.3Other current liabilities 9 15,373.7 13,649.5Short-term provisions 6 1,827.2 2,182.4
74,758.8 61,364.0TOTAL 156,993.5 129,144.8
ASSETSNON-CURRENT ASSETS
Fixed assets Tangible assets 10 33,973.0 28,649.7Intangible assets 11 8,424.8 8,406.7Tangible assets - Capital work-in-progress 10 9,952.5 4,041.8Intangible assets - Under development 11 285.1 154.5
Non-current investments 12 1.4 1.4Deferred tax assets 5 0.9 47.5Loans and advances 13 4,010.1 4,552.7Trade receivables 14 – –Other non-current assets 16 331.0 302.5
56,978.8 46,156.8CURRENT ASSETSCurrent investments 17 0.2 196.5Inventories 18 40,881.0 36,113.0Trade receivables 14 41,719.2 35,391.7Cash and bank balances 19 8,343.9 4,691.1Loans and advances 13 6,453.8 5,684.2Other current assets 15 2,616.6 911.5
100,014.7 82,988.0TOTAL 156,993.5 129,144.8
Summary of significant accounting policies 1
The accompanying notes are an integral part of the financial statements.
Consolidated Balance Sheet as at March 31, 2016
NotesAs at As at
March 31, 2016 March 31, 2015
(All amounts in Indian Rupees million, except share data and where otherwise stated)
As per our report of even date. For and on behalf of the Board of Directors of Aurobindo Pharma Limited
For S.R. BATLIBOI & ASSOCIATES LLPChartered AccountantsICAI Firm Registration No. 101049W/E300004 N. Govindarajan Dr. M. Sivakumaran
Managing Director DirectorDIN: 00050482 DIN: 01284320
per Vikas Kumar PansariPartnerMembership No. 93649 Santhanam Subramanian A. Mohan Rami Reddy
Chief Financial Officer VP (Legal) &Hyderabad, May 30, 2016 Company Secretary

Annual Report 2015-16
147
INCOME Revenue from operations (Gross) 20 140,566.5 122,725.3
Less: Excise duty 38 1,605.7 1,520.1
Revenue from operations (Net) 138,960.8 121,205.2
Other income 21 1,662.7 967.1
TOTAL INCOME 140,623.5 122,172.3
EXPENSES Cost of materials consumed 22 48,249.0 41,228.1
Purchase of traded goods 14,321.3 17,122.7
Increase in work-in-progress, traded and finished goods 23 (994.9) (3,294.8)
Employee benefit expenses 24 15,508.4 13,022.6
Other expenses 25 29,821.4 27,490.4
Depreciation/amortization 26 3,926.1 3,326.1
Finance costs 27 2,567.6 1,598.7
TOTAL EXPENSES 113,398.9 100,493.8
PROFIT BEFORE TAX 27,224.6 21,678.5
TAX EXPENSE Current tax 7,138.8 5,965.3
MAT credit – (99.5)
Deferred tax charge 304.9 (42.2)
Tax relating to earlier years
Current tax – 13.1
Deferred tax – 129.2
TOTAL TAX EXPENSE 7,443.7 5,965.9
PROFIT ATTRIBUTABLE TO 19,780.9 15,712.6
Minority interest (39.1) (45.1)
Equity holders of the parent 19,820.0 15,757.7
PROFIT FOR THE YEAR 19,820.0 15,757.7
EARNINGS PER EQUITY SHARE 30
Basic earnings per share (`) 33.93 27.03
Diluted earnings per share (`) 33.92 27.00
Nominal value per equity share (`) 1.00 1.00
Summary of significant accounting policies 1
The accompanying notes are an integral part of the financial statements.
Consolidated Statement of Profit and Loss for the year ended March 31, 2016
Notes Year ended Year ended
March 31, 2016 March 31, 2015
(All amounts in Indian Rupees million, except share data and where otherwise stated)
As per our report of even date. For and on behalf of the Board of Directors of Aurobindo Pharma Limited
For S.R. BATLIBOI & ASSOCIATES LLPChartered AccountantsICAI Firm Registration No. 101049W/E300004 N. Govindarajan Dr. M. Sivakumaran
Managing Director DirectorDIN: 00050482 DIN: 01284320
per Vikas Kumar PansariPartnerMembership No. 93649 Santhanam Subramanian A. Mohan Rami Reddy
Chief Financial Officer VP (Legal) &Hyderabad, May 30, 2016 Company Secretary

148
Consolidated Cash Flow Statement for the year ended March 31, 2016
Notes Year ended Year ended
March 31, 2016 March 31, 2015
CASH FLOW FROM
OPERATING ACTIVITIES Profit before tax 27,224.6 21,678.5
Adjustment to reconcile profit before tax to net cash flows:
Depreciation and amortization 3,926.1 3,326.1
Provision for doubtful receivables/advances/assets (Net) 467.5 365.0
Balances no longer required written back (Net) (79.0) (232.5)
Bad debts/advances written off 16.9 –
Unrealized foreign exchange loss (Net) 92.8 472.4
Loss on sale/write–off of fixed assets (Net) 49.9 156.9
Profit on investments (Net) (63.8) –
Loss on current investment 0.1 –
Interest expense 793.3 708.6
Interest income (103.7) (155.6)
Dividend income on current investment – trade – –
Operating profit before working capital changes 32,324.7 26,319.4
Foreign currency translation adjustments 12.1 (578.1)
Movements in working capital:
Increase/(decrease) in trade payables 5,039.2 (5,076.3)
Increase in inventories (4,768.0) (5,730.4)
Increase in trade receivables (6,735.9) (2,281.4)
(Increase)/decrease in other current/non–current assets (1,818.2) 34.5
(Increase)/decrease in loans and advances (333.5) 953.5
Increase in provision for retirement benefits 117.7 234.1
Increase in other current liabilities 1,115.4 3,448.7
Cash generated from operations 24,953.5 17,324.0
Direct taxes paid (Net of refunds) (7,357.8) (4,955.9)
NET CASH FLOW FROM OPERATING ACTIVITIES (A) 17,595.7 12,368.1
CASH FLOW USED IN
INVESTING ACTIVITIES Purchase of fixed assets, including capital
work–in–progress and capital advances (15,681.5) (7,682.9)
Proceeds from sale of fixed assets 189.1 223.9
Amount received on settlement of acquisition of subsidiary 1,379.6 –
Payment for net assets acquired of subsidiaries (Net of cash) – (6,860.3)
Proceeds from sale of current investments (Net) 260.0 –
Share application money to others – (33.9)
Intercorporate deposit 10.0 (10.0)
Investment in/redemption of bank deposits (Net) (59.8) 229.2
Interest received 102.0 154.3
Dividend received – –
Net cash flow used in investing activities (B) (13,800.6) (13,979.7)
(All amounts in Indian Rupees million, except share data and where otherwise stated)
(Contd.)

Annual Report 2015-16
149
Year ended Year ended March 31, 2016 March 31, 2015
CASH FLOW FROM
FINANCING ACTIVITIES Proceeds from issuance of share capital 72.0 67.6
Proceeds from long-term borrowings 702.7 5,232.9
Repayment of long-term borrowings (5,875.2) (1,352.2)
(Repayment) of/proceeds from short-term borrowings (Net) 7,341.0 (473.0)
Interest paid (823.3) (738.5)
Dividend (1,341.9) (1,527.0)
Tax on dividend (273.6) (277.7)
Net cash flow (used in)/generated from financing activities (C) (198.3) 932.1
Net increase/(decrease) in cash and cash equivalents (A+B+C) 3,596.8 (679.5)
CASH AND CASH EQUIVALENTS AT THE BEGINNING OF THE YEAR 4,611.0 1,480.2
Add: Cash and cash equivalents on acquisition 40.7 3,795.2
Effect of exchange differences on cash and cash equivalents (3.0) 15.1
CASH AND CASH EQUIVALENTS AT THE END OF THE YEAR 8,245.5 4,611.0
Components of cash and cash equivalents
Cash on hand 8.2 7.9
Balance with banks
on current account 6,726.7 4,316.0
on cash credit account 962.0 15.3
on deposit account 691.3 356.7
on unpaid dividend account* 14.4 12.5
Cash and bank balances as per Consolidated Balance Sheet 8,402.6 4,708.4
Less: Fixed deposits considered as investing activities (157.1) (97.4)
Cash and cash equivalents considered for cash flows (Refer Note 19) 8,245.5 4,611.0
Summary of significant accounting policies (Refer Note 1)
*The Group can utilize these balances only towards settlement of unpaid dividend.
(All amounts in Indian Rupees million, except share data and where otherwise stated)
As per our report of even date. For and on behalf of the Board of Directors of Aurobindo Pharma Limited
For S.R. BATLIBOI & ASSOCIATES LLPChartered AccountantsICAI Firm Registration No. 101049W/E300004 N. Govindarajan Dr. M. Sivakumaran
Managing Director DirectorDIN: 00050482 DIN: 01284320
per Vikas Kumar PansariPartnerMembership No. 93649 Santhanam Subramanian A. Mohan Rami Reddy
Chief Financial Officer VP (Legal) &Hyderabad, May 30, 2016 Company Secretary

150
1. Statement of significant accounting policies
a. Basis of consolidation
The Consolidated Financial Statements of
Aurobindo Pharma Limited ('APL' or 'the
Parent Company' or 'Holding Company')
together with its subsidiaries (collectively
termed as 'the Group') and joint venture
(collectively termed as 'the Consolidated
Entities') are prepared in accordance with
generally accepted accounting principles in
India (Indian GAAP). The Company has
prepared these financial statements to
comply in all material respects with the
accounting standards notified under Section
133 of the Companies Act, 2013, read
together with paragraph 7 of the Companies
(Accounts) Rules, 2014 using uniform
accounting policies for like transactions and
other events in similar circumstances and are
presented to the extent possible in the same
manner as the Company's separate financial
Notes to Consolidated Financial Statements for the year ended March 31, 2016statements. The accounting policies have
been consistently applied by the Company
and are consistent with those used in the
previous year except as disclosed in (b)
below.
Investments in subsidiaries, except where
investments are acquired exclusively with a
view to its subsequent disposal in the
immediate near future, are accounted in
accordance with accounting principles as
defined under AS 21 'Consolidated Financial
Statements' on a line by line basis.
Investments in joint venture has been
accounted using proportionate consolidation
method as per AS 27 'Financial Reporting of
Interests in Joint Ventures'.
All material inter-company balances and
inter-company transactions and resulting
unrealised profits or losses are eliminated on
consolidation.
Elimination of unrealized profits or losses in
joint venture entities is to the extent of
Group's share in the joint venture.
Minorities’ interest in net profits ofconsolidated subsidiaries for the year isidentified and adjusted against the income inorder to arrive at the net income attributableto the shareholders of the Group. Their shareof net assets is identified and presented inthe Consolidated Balance Sheet separately.Where accumulated losses attributable to theminorities are in excess of their equity in theabsence of the contractual obligation on theminorities, the same are accounted for by theGroup.
The financial statements of the entities usedfor the purpose of consolidation are drawn upto same reporting date as that of the parentcompany i.e. year ended March 31, 2016.
The Consolidated Financial Statements for theyear ended March 31, 2016 have beenprepared on the basis of the financial
statements of the following subsidiaries and
joint venture entities:
Sl. Country of Nature of % of interestNo. Name of the consolidated entities incorporation interest March 31,
2016 2015
1. APL Pharma Thai Limited Thailand Subsidiary 97.9 97.9
2. Aurobindo Pharma Industria Farmaceutica Ltda Brazil Subsidiary 99.97 99.97
3. Helix Healthcare B.V. The Netherlands Subsidiary 100 100
4. Aurobindo Pharma USA Inc. U.S.A. Subsidiary 100 100
5. Auro Pharma Inc. Canada Subsidiary 100 100
6. Aurobindo Pharma (Pty) Limited South Africa Subsidiary 100 100
7. Milpharm Limited U.K. Subsidiary 100 100
8. Agile Pharma B.V. The Netherlands Subsidiary 100 100
9. Aurobindo Pharma (Australia) Pty Limited1 Australia Subsidiary – 100
10. Auro Healthcare (Nigeria) Limited Nigeria Subsidiary 100 100
11. Aurex B.V. (Formerly Pharmacin B.V.) The Netherlands Subsidiary 100 100
12. Aurobindo Pharma Produtos Farmaceuticos Ltda Brazil Subsidiary 100 100
13. All Pharma (Shanghai) Trading Company Limited China Subsidiary 100 100
14. APL Holdings (Jersey) Limited2 Jersey Subsidiary – 100
15. APL IP Company Limited2 Jersey Subsidiary – 100
16. Aurobindo Pharma Japan K.K. Japan Subsidiary 100 100
17. Agile Malta Holdings Limited3 Malta Subsidiary – –
18. Aurobindo Pharma (Malta) Limited Malta Subsidiary 100 100
19. APL Swift Services (Malta) Limited Malta Subsidiary 100 100
20. Laboratorios Aurobindo, S.L. Spain Subsidiary 100 100
21. Aurobindo Pharma (Italia) S.r.l. Italy Subsidiary 100 100
22. Aurobindo Pharma (Portugal) Unipessoal Lda Portugal Subsidiary 100 100
23. Aurobindo Pharma France SARL4 France Subsidiary – –
24. Aurolife Pharma LLC USA Subsidiary 100 100
25. Aurobindo Pharma GmbH Germany Subsidiary 100 100
(Contd...)

Annual Report 2015-16
151
Sl. Country of Nature of % of interestNo. Name of the consolidated entities incorporation interest March 31,
2016 2015
26. Aurobindo Ilac Sanayi Ve Ticaret Limited Sirketi Turkey Subsidiary 100 100
27. APL Research Centre Limited India Subsidiary 100 100
28. APL Healthcare Limited India Subsidiary 100 100
29. Novagen Pharma (Pty) Limited South Africa Joint Venture 50 50
30. Auronext Pharma Private Limited5 India Subsidiary 100 83.42
31. Aurobindo Pharma (Singapore) Pte Limited6 Singapore Subsidiary – 100
32. Aurobindo Pharma B.V.7 The Netherlands Subsidiary – 100
33. Aurobindo Pharma (Romania) s.r.l. Romania Subsidiary 100 100
34. Aurobindo Pharma Limited, s.r.l.8 Dominican Republic Subsidiary – –
35. Auro Peptides Limited India Subsidiary 95 95
36. Auro Medics Pharma LLC U.S.A. Subsidiary 100 100
37. Aurobindo Pharma NZ Limited9 New Zealand Subsidiary – 100
38. Aurovida Farmaceutica S.A. de C.V. Mexico Subsidiary 100 100
39. Auro Health LLC U.S.A. Subsidiary 100 100
40. Aurobindo Antibiotics Limited India Subsidiary 100 100
41. Aurobindo Pharma Colombia S.A.S. Colombia Subsidiary 100 100
42. Aurovitas Unipessoal LDA Portugal Subsidiary 100 100
43. Curepro Parenterals Limited India Subsidiary 100 100
44. Eugia Pharma Specialities Limited India Subsidiary 60 60
45. Hyacinths Pharma Private Limited India Subsidiary 100 100
46. Silicon Life Sciences Private Limited India Subsidiary 100 100
47. AuroZymes Limited India Subsidiary 100 100
48. Aurovitas S.L.10 Spain Subsidiary – –
49. Pharmacin B.V. (Formerly Aurex B.V.)11 The Netherlands Subsidiary 100 100
50. Arrow Generiques SAS (w.e.f. April 1, 2014)12 France Subsidiary 100 100
51. Actavis France SAS (w.e.f. April 1, 2014)12 & 13 France Subsidiary – 100
52. 1980 Puren Pharma GmbH (Formerly Actavis
Management GmbH) (w.e.f. April 1, 2014)12 Germany Subsidiary 100 100
53. Puren Pharma GmbH & Co. KG (Formerly Actavis
Deutschland GmbH & Co. KG) (w.e.f. April 1, 2014)12 Germany Subsidiary 100 100
54. Aurovitas Spain SA (Formerly Actavis Spain S.A.)
(w.e.f. April 1, 2014)12 Spain Subsidiary 100 100
55. Aurobindo Pharma B.V. (Formerly Actavis B.V.)
(w.e.f. April 1, 2014)7 & 12 The Netherlands Subsidiary 100 100
56. Natrol LLC (w.e.f. December 4, 2014)12 U.S.A. Subsidiary 100 100
57. Tergene Biotech Private Limited (w.e.f. April 1, 2015)14 India Subsidiary 60 –
Notes:
1. Liquidated w.e.f. April 10, 2015.
2. Liquidated w.e.f. November 18, 2015.
3. Agile Malta Holdings Limited was merged with Aurobindo Pharma (Malta) Limited w.e.f. January 1, 2015.
4. Aurobindo Pharma France SARL merged with Arrow Generiques SAS w.e.f. April 1, 2014.
5. Auronext Pharma Private Limited has become wholly owned subsidiary of Aurobindo Pharma Limited, India w.e.f. September 16, 2015.
6. Liquidated w.e.f. December 31, 2015.
7. Aurobindo Pharma B.V. merged with Actavis B.V. Subsequently the name of Actavis B.V. was changed to Aurobindo Pharma B.V. w.e.f. July 1, 2015.
8. Liquidated w.e.f. December 18, 2014.
9. Aurobindo Pharma NZ Limited liquidated w.e.f. April 10, 2015. It was incorporated during the financial year 2011-12 and there was no activity during the current year andprevious year.
10. Aurovitas S.L. was incorporated during the previous year and closed w.e.f. December 2, 2014.
11. Pharmacin B.V. (Formerly known as Aurex B.V.) was incorporated during the previous year.
12. Acquired during the previous year.
13. Actavis France SAS was merged with Arrow Generiques SAS w.e.f. April 1, 2015.
14. Acquired during the year.
The figures for the subsidiaries have been considered from the date of acquisition/upto the date of disposal/liquidation as applicable.
Notes to Consolidated financial statements for the year ended March 31, 2016

152
b. Change in accounting policy
The group has adopted component
accounting as required under Schedule II to
the Companies Act, 2013, from April 1, 2015.
The group was previously not identifying
components of fixed assets separately for
depreciation purposes; rather, a single useful
life was used to depreciate each item of fixed
assets.
Due to application of Schedule II to the
Companies Act, 2013, the Company has
changed the manner of depreciation for its
fixed assets. Now, the group identifies and
determines cost of each component/part of
the asset separately, if the component/part
has a cost which is significant to the total
cost of the asset and has useful life that is
materially different from that of the
remaining asset. These components are
depreciated separately over their useful lives;
the remaining components are depreciated
over the life of the principal asset. The group
has also changed its policy on recognition of
cost of major inspection/overhaul. Earlier,
the Company used to charge such cost of
major inspection/overhaul directly to
consolidated statement of profit and loss, as
incurred. On application of component
accounting, the major inspection/overhaul is
identified as a separate component of the
asset at the time of purchase of new asset
and subsequently. The cost of such major
inspection/overhaul is depreciated separately
over the period till next major inspection/
overhaul. Upon next major inspection/
overhaul, the costs of new major inspection/
overhaul are added to the asset's cost and
any amount remaining from the previous
inspection/overhaul is derecognized. On the
date of component accounting becoming
applicable, i.e. 1 April, 2015, there were no
components whose cost was significant to
the total cost of the assets and whose useful
life was materially different from that of the
remaining assets. The change in accounting
for components did not have any impact on
financial statements of the group for the
current year.
c. Use of estimates
The preparation of consolidated financial
statements in conformity with Indian GAAP
requires the management to make judgments,
estimates and assumptions that affect the
reported amounts of revenues, expenses,
assets and liabilities and the disclosure of
contingent liabilities at the date of the
consolidated financial statements and the
results of operations during the reporting
period. Although these estimates are based
upon management’s best knowledge of
current events and actions, actual results
could differ from these estimates.
d. Revenue recognition
Revenue is recognized to the extent that it is
probable that the economic benefits will flow
to the Group/Consolidated Entities and the
revenue can be reliably measured.
i. Revenue from sale of goods is
recognized on dispatch (in respect of
exports on the date of the bill of lading
or airway bill) which coincides with
transfer of significant risks and rewards
to customer and is net of trade
discounts, sales returns and sales tax,
where applicable and recognized based
on the terms of the agreements entered
into with the customers. Excise duty
deducted from revenue (gross) is the
amount that is included in revenue
(gross) and not the entire amount of
liability arising during the year.
ii. Revenue from sale of dossiers/licenses/
services is recognized in accordance
with the terms of the relevant
agreements as accepted and agreed with
the customers.
iii. Interest is recognized on a time
proportion basis taking into account the
amount outstanding and the rate
applicable.
iv. Dividend is recognized as and when the
Group’s/Consolidated Entities right to
receive payment is established by the
reporting date.
e. Fixed assets and depreciation
i. Fixed assets are stated at cost less
accumulated depreciation, impairment
losses and specific grant/subsidies, if
any. Cost comprise of purchase price,
freight, non refundable taxes and duties
and any attributable cost of bringing
the asset to its working condition for its
intended use. Borrowing costs relating
to acquisition of fixed assets which take
substantial period of time to get ready
for use are included to the extent they
relate to the period till such assets are
ready for intended use. All other
borrowing costs are expensed in the
period they occur.
ii. Expenditure directly relating to
construction activity is capitalized.
Expenditure is capitalized to the extent
those are specifically attributable to the
construction activity or is incidental
thereto. Income earned during
construction period is deducted from the
total expenditure relating to
construction activity.
iii. Assets retired from active use and held
for disposal are stated at their
estimated net realizable values or net
book values, whichever is lower.
iv. Assets under finance leases, where there
is no reasonable certainty that the
Group/Consolidated Entities will obtain
the ownership by the end of the lease
term are capitalized and are depreciated
over the lease term or estimated useful
life of the asset, whichever is shorter.
v. The Group/Consolidated Entities
identifies and determines cost of each
component/part of the asset separately,
if the component/part has a cost which
is significant to the total cost of the
asset and has useful life that is
materially different from that of the
remaining asset.
vi. Premium paid on leasehold land is
amortized over the lease term.
vii. Depreciation is provided on the straight-
line method, based on the useful life of
the assets as estimated by the
management. The Group/Consolidated
Entities has estimated the following
useful lives to provide depreciation on
its fixed assets.
Notes to Consolidated financial statements for the year ended March 31, 2016

Annual Report 2015-16
153
The management based on internal technical
assessment has estimated, the useful lives of
the following classes of assets which is
different from the useful lives prescribed
under Schedule II:
• The useful lives of laboratory
equipment, electrical installations and
equipment and end user devices
estimated as 12 years, 15 years and 6
years, respectively. These lives are
higher than those indicated in Schedule
II.
• Vehicles, plant and machinery, reactors
glass line, general plant and machinery,
servers and networks and power plant
turbine are depreciated over the
estimated useful lives of 4 years, 15
years, 12 years, 10 years, 5 years and 20
years, respectively, which are lower than
those indicated in Schedule II.
f. Intangibles
Intangible assets consists of goodwill,
licenses, patents, brands and product
development costs.
Goodwill represents the excess of purchase
consideration over the net book value of
assets acquired of the subsidiary companies
as on the date of investment. Goodwill on
consolidation and acquisition is not
amortized but is tested for impairment on a
periodic basis and impairment losses are
recognized where applicable.
Cost relating to licenses, patents and brands
which are acquired, are capitalized and
amortized on a straight-line basis over the
useful life as estimated by the management.
Research costs are expensed as incurred.
Development expenditure incurred in respect
of internally generated intangible assets such
as product development is carried forward
when the future recoverability can reasonably
be regarded as assured. Any expenditure
carried forward is amortized on a straight-line
basis over the period of expected future
economic benefit from the related project,
not exceeding ten years.
The management has estimated following
useful life to amortize intangible assets:
Useful life as Nature of the assets estimated by the
management(in years)
Product development cost 10Licenses & patents 5-10Brands 10
g. Impairment of tangibles and intangibleassets
The carrying amounts of assets are reviewed
at each balance sheet date if there is any
indication of impairment based on internal/
external factors. An impairment loss is
recognized wherever the carrying amount of
an asset exceeds its recoverable amount. The
recoverable amount is the greater of the
asset’s net selling price and its value in use.
In assessing value in use, the estimated
future cash flows are discounted to their
present value using a pre-tax discount rate
that reflects current market assessments of
the time value of money and risks specific to
the asset.
After impairment, depreciation is provided on
the revised carrying amount of the asset over
its remaining useful life.
h. Government grants and subsidies
Grants and subsidies are recognized when
there is a reasonable assurance that the grant
or subsidy will be received and that all
underlying conditions thereto will be
complied with. When the grant or subsidy
relates to an asset, its value is deducted in
arriving at the carrying amount of the related
asset.
i. Investments
i. Investments that are readily realisableand intended to be held for not morethan one year from the date on whichsuch investments are made, areclassified as current investments. Allother investments are classified as long-term investments. Current investmentsare carried at lower of cost and fairvalue determined on individualinvestment basis.
ii. Long-term investments are carried atcost. However, diminution in value isprovided to recognize a decline, otherthan temporary, in the value of theinvestments.
j. Inventories
i. Raw materials, packing materials, stores,spares and consumables are valued atlower of cost, calculated on 'Weightedaverage' basis, and net realizable value.Items held for use in the production ofinventories are not written down belowcost if the finished product in whichthese will be incorporated are expectedto be sold at or above cost.
ii. Finished goods and work-in-progress arevalued at lower of cost and netrealizable value. Cost includes materials,labour and a proportion of appropriateoverheads based on normal operatingcapacity. Cost of finished goods includesexcise duty. Cost is determined on aweighted average basis.
iii. Trading goods are valued at lower ofcost and net realizable value. Costincludes cost of purchase and othercosts incurred in bringing theinventories to their present location andcondition. Cost is determined on a'Weighted average' basis.
iv. Net realizable value is the estimatedselling price in the ordinary course ofbusiness, reduced by the estimatedcosts of completion and costs to effectthe sale.
k. Employee benefits
i. Employee benefits in the form of
provident fund is a defined contribution
scheme and the contributions are
charged to the Consolidated Statement
of Profit and Loss in the year when anemployee renders the related service.There are no other obligations other
Nature of the assets Useful life as Useful life as statedestimated by the in the Companies
management (in years) Act, 2013 (in years)
Leasehold land 10 –Leasehold buildings 20 10-60Freehold land 25 –Freehold buildings 5-60 10-60Plant & equipment 3-20 3-40Furniture & fixtures 5-10 10Vehicles 4-8 8
Office equipment 3-10 5
Notes to Consolidated financial statements for the year ended March 31, 2016

154
than the contribution payable to therespective authorities.
ii. The Group's/Consolidated Entitiescontribution towards definedcontribution benefit plan is accrued incompliance with the requirements of thedomestic laws of the countries in whichthe consolidated entities operate in theyear of which the contributions are due.
iii. Gratuity liability is a defined benefitobligation and is provided for on thebasis of an actuarial valuation onproject unit credit method made at theend of each financial year.
iv. Short-term compensated absences areprovided for based on estimates. Long-term compensated absences areprovided for based on actuarialvaluation. The actuarial valuation isdone as per projected unit creditmethod at the end of each financialyear.
v. Actuarial gains/losses are immediatelytaken to consolidated statement ofprofit and loss and are not deferred.
vi. The Group/Consolidated Entitiespresents the entire leave as a currentliability in the balance sheet, since itdoes not have an unconditional right todefer its settlement for 12 months afterthe reporting date.
l. Income taxes
Tax expense comprises of current anddeferred tax. Current income tax is measuredat the amount expected to be paid to the taxauthorities in accordance with the domestictax laws of the countries in which theconsolidated entities operate. Deferredincome taxes reflect the impact of currentyear timing differences between taxableincome and accounting income for the yearand reversal of timing differences of earlieryears.
Deferred tax is measured based on the taxrates and the tax laws enacted orsubstantively enacted at the balance sheetdate. Deferred tax assets are recognized onlyto the extent that there is reasonablecertainty that sufficient future taxableincome will be available against which suchdeferred tax assets can be realized. Insituations where the Company hasunabsorbed depreciation or carry forward taxlosses, all deferred tax assets are recognizedonly if there is virtual certainty supported by
convincing evidence that they can be realizedagainst future taxable profits.
In the situations where the Group/Consolidated Entities is entitled to taxholiday under Income Tax Act, 1961, nodeferred tax is recognized in respect oftiming differences which reverse during thetax holiday period, to the extent Company'sgross total income is subject to the deductionduring the tax holiday period. Deferred tax inrespect of timing differences which reverseafter the tax holiday period is recognized inthe year in which timing difference originate.
Unrecognized deferred tax assets of earlieryears are re-assessed and recognized to theextent that it has become reasonably certainor virtually certain, as the case may be thatfuture taxable income will be availableagainst which such deferred tax assets can berealized.
Deferred tax assets and liabilities pertainingto consolidated entities are not set offagainst each other as the Group/ConsolidatedEntities does not have a legal right to do so.
The carrying amount of deferred tax assetsare reviewed at each balance sheet date. TheGroup/Consolidated Entities writes-down thecarrying amount of a deferred tax asset tothe extent that it is no longer reasonablycertain or virtually certain, as the case maybe, that sufficient future taxable income willbe available against which deferred tax assetcan be realized. Any such write-down isreversed to the extent that it becomesreasonably certain or virtually certain, as thecase may be, that sufficient future taxableincome will be available.
Minimum alternate tax (MAT) paid in a year ischarged to the consolidated statement ofprofit and loss as current tax. The Companyrecognizes MAT credit available as an assetonly to the extent that there is convincingevidence that the Company will pay normalincome tax during the specified period, i.e.the period for which MAT credit is allowed tobe carried forward. In the year in which theCompany recognizes MAT credit as an asset inaccordance with the Guidance Note onAccounting for Credit Available in respect ofMinimum Alternative Tax under the IncomeTax Act, 1961, the said asset is created byway of credit to the consolidated statementof profit and loss and shown as 'MAT CreditEntitlement'. The Company reviews the 'MATcredit entitlement' asset at each reportingdate and writes down the asset to the extent
the Company does not have convincingevidence that it will pay normal tax duringthe specified period.
m. Foreign exchange transactions
Initial recognition
Foreign currency transactions are recorded inthe reporting currency, by applying to theforeign currency amount the exchange ratebetween the reporting currency and foreigncurrency at the date of the transaction.
Conversion
Foreign currency monetary items are reportedat year-end rates. Non-monetary items whichare carried in terms of historical costdenominated in foreign currency are reportedusing the exchange rate at the date of thetransaction.
Exchange differences
Exchange differences arising on thesettlement of monetary items or on reportingmonetary items of Company at rates differentfrom those at which they were initiallyrecorded during the year, or reported inprevious financial statements, are recognizedas income or as expenses in the year in whichthey arise.
Forward exchange contracts entered into tohedge foreign currency risk of an existingasset/liability. The premium or discountarising at the inception of forward exchangecontract is amortized and recognized as anexpense/income over the life of the contract.Exchange differences on such contracts, arerecognized in the consolidated statement ofprofit and loss in the period in which theexchange rates change. Any profit or lossarising on cancellation or renewal of suchforward exchange contract is also recognizedas income or as expense for the period.
n. Translation of integral and non-integralforeign operation
In accordance with the accounting principlesas prescribed under the AS 11 (Revised) andbased on the analysis of relevant criteria, asexplained below, the Group/ConsolidatedEntities has designated the operations offollowing overseas consolidated entities vizAurobindo Pharma Industria FarmaceuticaLtda; APL Pharma Thai Limited; HelixHealthcare B.V.; Auro Pharma Inc.; AurobindoPharma (Pty) Limited; Aurobindo Pharma(Australia) Pty Limited; Auro Healthcare(Nigeria) Limited; Agile Pharma B.V.;Aurobindo Pharma Produtos Farmaceuticos
Notes to Consolidated financial statements for the year ended March 31, 2016

Annual Report 2015-16
155
Ltda; All Pharma (Shanghai) Trading CompanyLimited; APL Holdings (Jersey) Limited;Aurobindo Pharma Japan K.K.; LaboratoriosAurobindo Sociedad Limitada, S.L.; AurobindoPharma (Italia) S.r.l.; Aurobindo Pharma(Portugal) Unipessoal LDA; Aurobindo PharmaGmbH; Aurobindo Ilac Sanayi Ve TicaretLimited Sirketi; Novagen Pharma (Pty)Limited; Aurobindo Pharma (Singapore) PteLimited; Aurobindo Pharma B.V. (uptoJune 30, 2015); Aurobindo Pharma (Romania)s.r.l.; Aurovida Farmaceutica SA de CV;Aurobindo Pharma NZ Limited; AurobindoPharma Colombia S.A.S.; Aurovitas UnipessoalLDA and Pharmacin B.V. (formerly known asAurex B.V.) as 'integral foreign operations':
i. These foreign operations are under thedirect supervision and control of theparent company’s management;
ii. There are high proportions of inter-company transactions;
iii. These foreign operations are mainlyfinanced by the parent company; and
iv. Cash flows of these foreign operationshave direct impact on the cash flows ofthe parent company.
The financial statements of an integralforeign operation are translated as if thetransactions of the foreign operation havebeen those of the parent company itself.
In translating the financial statements of anon-integral foreign operation forincorporation in consolidated financialstatements, the assets and liabilities, bothmonetary and non-monetary, of the non-integral foreign operation are translated atthe closing rate; income and expense items ofthe non-integral foreign operation aretranslated using average exchange ratesprevailing during the reporting period sincethe same approximates to exchange rate ontransaction date. All resulting exchangedifferences are accumulated in a foreigncurrency translation reserve until the disposalof the net investment.
On the disposal/closure of a non-integralforeign operation, the cumulative amount ofthe exchange differences which have beendeferred and which relate to that operationare recognised as income or as expenses inthe same period in which the gain or loss ondisposal is recognised.
When there is a change in the classificationof a foreign operation, the translationprocedures applicable to the revised
classification are applied from the date of thechange in the classification.
o. Export benefits, incentives and licenses
Export benefits on account of duty drawbackand export promotion schemes are accruedand accounted in the year of export, and areincluded in other operating revenue. Otherbenefits in the form of advance authorisationfor imports are accounted for on purchase ofimported materials.
p. Leases
Where the Group/Consolidated Entities arelessee
Finance leases, where the substantial risksand benefits incidental to ownership of theleased items are transferred to the Group, arecapitalised at the lower of the fair value andpresent value of the minimum lease paymentsat the inception of the lease term anddisclosed as leased assets. Lease paymentsare apportioned between the finance chargesand reduction of the lease liability based onthe implicit rate of return. Finance chargesare charged to consolidated statement ofprofit and loss. Lease management fees, legalcharges and other initial direct costs arecapitalised.
Leases, where the lessor effectively retainssubstantially all the risks and benefits ofownership of the leased item are classified asoperating leases. Operating lease paymentsare recognised as an expense in theconsolidated statement of profit and loss ona straight-line basis over the lease term.
q. Earnings per share
Basic earnings per share is calculated bydividing the net profit for the yearattributable to equity shareholders by theweighted average number of equity sharesoutstanding during the year. The weightedaverage number of shares outstanding duringthe year is adjusted for events such as bonusissue that have changed the number ofshares outstanding, without a correspondingchange in resources.
For the purpose of calculating dilutedearnings per share, the net consolidatedprofit for the year attributable to equityshareholders and the weighted averagenumber of shares outstanding during the yearare adjusted for the effects of all dilutivepotential equity shares.
r. Provisions
A provision is recognised when the Group/Consolidated Entities has a present obligation
as a result of past event, it is probable thatan outflow of resources embodying economicbenefits will be required to settle theobligation and a reliable estimate can bemade of the amount of the obligation.Provisions are not discounted to their presentvalue and are determined based on the bestestimate required to settle the obligation atthe reporting date. These estimates arereviewed at each reporting date and adjustedto reflect the current best estimates.
s. Cash and cash equivalents
Cash and cash equivalents in the cash flowstatements comprise cash at bank and inhand and short-term investments with anoriginal maturity of three months or less.
t. Employee Stock Compensation Cost
Measurement and disclosure of the employeeshare-based payment plans is done inaccordance with Securities and ExchangeBoard of India (Share Based EmployeeBenefits) Regulations, 2014 and the GuidanceNote on Accounting for Employee ShareBased Payments Plans, issued by the Instituteof Chartered Accountants of India. TheGroup/Consolidated Entities measurescompensation cost relating to employee stockoptions using the intrinsic value method.Compensation expense, if any, is amortizedover the vesting period of the option on astraight line basis.
u. Contingent liabilities
A contingent liability is possible obligationthat arises from past events whose existencewill be confirmed by the occurrence or nonoccurrence of one or more uncertain futureevents beyond the control of Group/Consolidated Entities or a present obligationthat is not recognized because it is notprobable that an outflow of resources will berequired to settle the obligation. Acontingent liability also arises in extremelyrare cases where there is a liability that cannot be recognised because it can not bemeasured reliably. The Group/ConsolidatedEntities does not recognize the contingentliability but discloses its existence in theconsolidated financial statements.
v. Borrowing cost
Borrowing cost includes interest incurred inconnection with the arrangement ofborrowings and exchange differences arisingfrom foreign currency borrowings to theextent they are regarded as an adjustment tothe interest cost.
Notes to Consolidated financial statements for the year ended March 31, 2016

156
As at As atMarch 31, 2016 March 31, 2015
2. SHARE CAPITAL
AUTHORISED 660,000,000 (March 31, 2015: 660,000,000)
equity shares of `1 each 660.0 660.0
1,000,000 (March 31, 2015: 1,000,000)
preference shares of `100 each 100.0 100.0
760.0 760.0
ISSUED, SUBSCRIBED
AND FULLY PAID-UP SHARES
585,169,586 (March 31, 2015: 291,982,275)
equity shares of `1 each 585.2 292.0
TOTAL 585.2 292.0
a. Reconciliation of the equity shares outstanding at the beginning and at the end of the year
As at March 31, 2016 As at March 31, 2015
Numbers Value Numbers Value
Equity shares
At the beginning of the year 291,982,275 292.0 291,457,021 291.5
Issued during the year under bonus issue 291,982,275 292.0 – –
Issued during the year under Employee Stock Option plan 1,205,036 1.2 525,254 0.5
Outstanding at the end of the year 585,169,586 585.2 291,982,275 292.0
b. Terms/rights attached to equity shares
The parent company has only one class of equity shares having a par values of `1 per share. Each holder of equity shares is entitled to one voteper share.
The parent company declares and pays dividends in Indian rupees. The dividend proposed by the Board of Directors is subject to the approval ofshareholders in the ensuing Annual General Meeting.
During the year ended March 31, 2016, the amount of dividend per share recognized as distributions to equity shareholders was `2.50 (March 31,2015: `4.50) including interim dividend of `2.50 (March 31, 2015: `4.50).
In the event of liquidation of the parent company, the holders of equity shares will be entitled to receive remaining assets of the parent Company,after distribution of all preferential amounts. However, no such preferential amounts exist currently. The distribution will be in proportion to thenumber of equity shares held by the shareholders.
c. Details of shareholders holding more than 5% equity shares in the Company
As at March 31, 2016 As at March 31, 2015
Numbers % holding Numbers % holding
Mrs. P. Suneela Rani 205,036,760 35.04 100,661,990 34.48
205,036,760 100,661,990
As per records of the parent company, including its register of shareholders/members and other declarations received from shareholders regarding
beneficial interest, the above shareholding represents both legal and beneficial ownerships of shares.
d. Aggregate number of bonus shares issued, shares issued for consideration other than cash during the period of five years immediately
preceeding the reporting date:
As at March 31, 2016 As at March 31, 2015Numbers Numbers
Equity shares alloted as fully paid bonus shares bycapitalization of securities premium 291,982,275 –
e. For details of shares reserved for issue under Employee Stock Option Plan (ESOP) of the Company, Refer Note 31.
Notes to Consolidated financial statements for the year ended March 31, 2016
(All amounts in Indian Rupees million, except share data and where otherwise stated)

Annual Report 2015-16
157
As at As atMarch 31, 2016 March 31, 2015
3. RESERVES AND SURPLUS
CAPITAL RESERVE 818.9 91.1
Add: On acquisition of subsidiaries [Refer Note 34(iii)] – 727.8
Add: Exchange fluctuation on restatement of capital
reserve on acquisition 88.9 –
907.8 818.9
CAPITAL REDEMPTION RESERVE 90.0 90.0
SECURITIES PREMIUM
ACCOUNT As per last Balance Sheet 4,308.6 4,241.5
Add: Premium on exercise of employee stock options 70.7 67.1
Less: Amount utilised towards issue of fully paid bonus shares 292.0 –
4,087.3 4,308.6
GENERAL RESERVE 7,549.9 7,549.9
FOREIGN CURRENCY TRANSLATION RESERVE
As per last Balance Sheet 581.2 1,317.1
Add: Current year translation adjustment 786.3 (735.9)
1,367.5 581.2
SURPLUS IN THE CONSOLIDATED STATEMENT OF PROFIT AND LOSS
Balance as per last financial statements 37,918.5 23,920.4
Profit for the year 19,820.0 15,757.7
Less: Appropriations
On equity shares of `1 each
Interim dividend @ `2.50 (March 31, 2015: `4.50) 1,461.4 1,312.8
Tax on dividend 297.5 250.4
Depreciation [Net of deferred tax of `Nil
(March 31, 2015: `82.3)] Refer Note 1(b) – 196.4
Total appropriations 1,758.9 1,759.6
NET SURPLUS IN THE CONSOLIDATED STATEMENT OF PROFIT AND LOSS 55,979.6 37,918.5
TOTAL 69,982.1 51,267.1
Notes to Consolidated financial statements for the year ended March 31, 2016
(All amounts in Indian Rupees million, except share data and where otherwise stated)

158
4. LONG-TERM BORROWINGS
Non-current portion Current maturities
As at As at As at As at
March 31, 2016 March 31, 2015 March 31, 2016 March 31, 2015
From banks Secured
Term loans - Foreign currency 3,801.0 7,231.9 4,100.5 3,899.2
Term loans - Rupee loans 1,040.1 503.5 – –
From others - Secured
Term loans - Rupee loans 3.8 – 1.6 –
4,844.9 7,735.4 4,102.1 3,899.2
From banks - Unsecured
Term loans - Foreign currency 3,367.3 5,462.4 1,995.4 1,843.9
3,367.3 5,462.4 1,995.4 1,843.9
Other loans - Unsecured
Deferred sales tax loan 259.8 416.9 160.0 132.1
259.8 416.9 160.0 132.1
Amount disclosed under the head 'Other current liabilities' (Refer Note 9) (6,257.5) (5,875.2)
TOTAL 8,472.0 13,614.7 – –
The above amount includes
Secured borrowings 4,844.9 7,735.4 4,102.1 3,899.2
Unsecured borrowings 3,627.1 5,879.3 2,155.4 1,976.0
i. Secured term loans in foreign currency carry interest in the range of LIBOR plus 1% to 1.5%. Out of these loans, loans amounting to `1,104.3(March 31, 2015: `1,562.5) are repayable in two (March 31, 2015: three) equal installments in 5th and 6th (March 31, 2015: 4th, 5th and 6th) yearsfrom the respective final draw down, and loans amounting to `1,987.7 (March 31, 2015: `1,666.7) is repayable at the end of 4th, 5th and 6th yearsfrom the respective final draw down and loan amounting `Nil (March 31, 2015: `3,229.2) is repayable at the end of 5th year from the respective finaldraw down date. These loans are secured by first pari passu charge on all the present and future fixed assets, both movable and immoveable propertyof the parent company.
ii. Secured terms loan in foreign currency amounting to `35.1 carry an interest of 6 month LIBOR plus 5% with interest payments at monthly intervals(current interest rate being 5.09% per annum). The foreign currency term loans are repayable in 7 quarterly installments of `11.0 each startingApril 1, 2015. These loans are secured by a first charge on entire fixed assets of Auronext Pharma Private Limited (both present and future) andcollateral security of present and future current assets of Auronext Pharma Private Limited.
iii. Secured term loans in foreign currency amounting to `674.7 carry interest rate of LIBOR plus 0.9% and is payable over a period of 7 years in equalmonthly installments and the last installment is payable in October, 2021. These loans are secured by property, fixed assets, inventory and tradereceivable of Aurolife Pharma LLC, Aurobindo Pharma USA Inc and Auromedics Pharma LLC.
iv. Secured term loans in foreign currency amounting to `1.2 carry interest rate of 4.6% and is payable over a period of 5 years in equal monthlyinstallments and the last installment is payable in April, 2016. These loans are secured by property, fixed assets, inventory and trade receivable ofAurolife Pharma LLC, Aurobindo Pharma USA Inc and Auromedics Pharma LLC.
v. Secured term loans in foreign currency amounting to `13.9 carry interest rate of 3.86% and is payable over a period of 5 years in equal monthlyinstallments and the last installment is payable in September, 2016. These loans are secured by property, fixed assets, inventory and trade receivableof Aurolife Pharma LLC , Aurobindo Pharma USA Inc and Auromedics Pharma LLC.
vi. Secured term loans in foreign currency amounting to `5.7 carry interest rate of 3.92% and is payable over a period of 5 years in equal monthlyinstallments and the last installment is payable in December, 2016. These loans are secured by property, fixed assets, inventory and trade receivableof Aurolife Pharma LLC, Aurobindo Pharma USA Inc and Auromedics Pharma LLC.
vii. Secured term loans in foreign currency amounting to `32.0 carry interest rate of 4.1% and is payable over a period of 7 years in equal monthlyinstallments and the last installment is payable in November, 2019. These loans are secured by property, fixed assets, inventory and trade receivableof Aurolife Pharma LLC, Aurobindo Pharma USA Inc and Auromedics Pharma LLC.
viii. Secured term loans in foreign currency amounting to `57.2 carry interest rate of 4.69% and is payable over a period of 7 years in equal monthlyinstallments and the last installment is payable in June, 2020. These loans are secured by property, fixed assets, inventory and trade receivable ofAurolife Pharma LLC, Aurobindo Pharma USA Inc and Auromedics Pharma LLC.
Notes to Consolidated financial statements for the year ended March 31, 2016
(All amounts in Indian Rupees million, except share data and where otherwise stated)

Annual Report 2015-16
159
ix. Secured term loans in foreign currency amounting to `12.4 carry interest rate of 3.6% and is payable over a period of 3 years in equal monthlyinstallments and the last installment is payable in September, 2018. These loans are secured by equipments of Aurolife Pharma LLC, Aurobindo PharmaUSA Inc and Auromedics Pharma LLC.
x. Secured term loans in foreign currency amounting to `2.1 carry interest rate of 2.076% and is payable over a period of 6 years in equal monthlyinstallments and the last installment is payable in May, 2020. These loans are secured by equipments of Aurolife Pharma LLC, Aurobindo Pharma USAInc and Auromedics Pharma LLC.
xi. Secured term loan in Indian rupee amounting to `1,040.1 carries floating interest rate (currently 11% per annum) and is payable in 15 quarterlyinstallments starting from September, 2017. The loan is secured by first charge on entire fixed assets (including intangibles) both present and futureand second charge on the current assets, both present and future of Eugia Pharma Specialities Limited and also pledge of shares held by CelonLaboratories Limited, shareholder of Eugia Pharma Specialities Limited.
xii. Secured term loan in Indian rupee from Department of Biotechnology amounting to `5.4 carry interest rate of 2% having first charge on allequiptments, apparatus, machineries, spares, tools and other acessories, goods and/or other movable property of Tergene Biotech Private Limitedincluding those acquired for the project through contribution by Tergene Biotech Private Limited and/or by the Department of Biotechnology to avalue equivalent to the amount of loan and interest thereon, the loan is repayable in 10 equal half yearly installments commencing from one year afterthe closure of the project.
xiii Unsecured foreign currency term loans amounting to `3,507.6 carry interest rate of LIBOR plus 1.05% and is payable in equal quarterly installmentsand the last installment is payable in December, 2019. Unsecured foreign currency term loans amounting to `1,855.1 carry interest rate of LIBOR plus1.25% and is payable in equal quarterly installments and the last installment is payable in December, 2017.
xiv. Deferred sales tax loan is interest free and payable in various installments as per sales tax deferment scheme. The last installment is payable in2029-30 (March 31, 2015: 2028-29).
As at As atMarch 31, 2016 March 31, 2015
5. DEFERRED TAX ASSETS & LIABILITIES
Deferred tax liabilities consists of
Differences in depreciation as per tax books and financial books 3,061.6 2,390.8
Provision made towards doubtful trade receivables/loans and advances/other assets (480.4) (79.5)
Retirement benefits (242.2) (206.0)
Business loss 25.5 –
Total deferred tax liabilities 2,364.5 2,105.3
Deferred tax assets consists of
Others 0.9 47.5
Total deferred tax assets 0.9 47.5
6. PROVISIONSLong-term Short-term
As at As at As at As atMarch 31, 2016 March 31, 2015 March 31, 2016 March 31, 2015
For employee benefits
Gratuity [Refer Note 32 (b)] 234.1 243.1 65.8 30.5
Compensated absences 1.3 0.4 445.1 354.5
235.4 243.5 510.9 385.0
Other provisions
For proposed dividend – – 409.6 292.0
For tax on proposed dividend – – 83.4 59.4
Provision for income tax (Net of advance tax) – – 823.3 1,446.0
– – 1,316.3 1,797.4
TOTAL 235.4 243.5 1,827.2 2,182.4
Notes to Consolidated financial statements for the year ended March 31, 2016
(All amounts in Indian Rupees million, except share data and where otherwise stated)

160
Notes to Consolidated financial statements for the year ended March 31, 2016
(All amounts in Indian Rupees million, except share data and where otherwise stated)
As at As atMarch 31, 2016 March 31, 2015
7. SHORT-TERM BORROWINGS
Loans repayable on demand from banks - Working capital loans
Cash credit facilities (Secured) 469.1 372.7
Buyers credit (Unsecured) – 784.6
Packing credit loans (Secured) 2,490.9 8,259.0
Packing credit loans (Unsecured) 22,785.7 12,677.4
Bill discounting facility (Secured) 1,821.1 553.1
Bill discounting facility (Unsecured) 2,186.7 1,316.2
Short-term loans (Secured) 1,632.0 –
Short-term loans - Others (Unsecured) – 50.0
Short-term loans from Banks (Unsecured) 904.7 1,007.8
TOTAL 32,290.2 25,020.8
The above amount includes
Secured borrowings 6,413.1 9,184.8
Unsecured borrowings 25,877.1 15,836.0
32,290.2 25,020.8
i. Secured loans amounting to `4,781.1 are secured by first charge by way of hypothecation of all the stocks, book debts and other current assets (both present and future) of the
parent company.
ii. Secured loans amounting to `1,632.0 are secured by first charge by way of hypothecation of all the stocks and book debts of Aurolife Pharma LLC, Aurobindo Pharma USA Inc and
Auromedics Pharma LLC (both present and future).
As at As at
March 31, 2016 March 31, 2015
8. TRADE PAYABLES
Trade payables for supplies and services 25,267.7 20,511.3
9. OTHER CURRENT LIABILITIES
Current maturities of long-term borrowings (Refer Note 4) 6,257.5 5,875.2
Payables for capital goods 1,580.1 970.0
Trade deposits 32.1 9.8
Unclaimed dividend 14.4 12.5
Interest accrued but not due on borrowings 57.3 87.4
Advances from customers 57.3 44.6
Other payables
Statutory liabilities 734.4 414.4
Others 6,640.6 6,235.6
TOTAL 15,373.7 13,649.5

Annual Report 2015-16
161
10. FIXED ASSETS - TANGIBLE ASSETS
Leasehold Freehold Leasehold Freehold Plant & Furniture Vehicles Office Totalland land buildings buildings equipment & fixtures equipment
AT COST OR VALUATION
At April 1, 2014 60.7 995.9 157.6 8,285.5 26,542.6 813.0 164.1 398.2 37,417.6
Additions 88.8 259.1 60.6 922.0 4,871.8 167.9 12.9 49.7 6,432.8
Disposals/adjustments 0.1 0.3 – 5.0 297.4 23.3 4.5 6.8 337.4
Additions on acquisition – – 0.6 – 281.3 34.5 0.2 28.0 344.6
Other adjustments
Exchange differences – 12.1 (14.4) 91.0 84.1 (11.3) 0.1 (0.3) 161.3
At March 31, 2015 149.4 1,266.8 204.4 9,293.5 31,482.4 980.8 172.8 468.8 44,018.9
Additions 22.3 1,839.6 138.5 1,024.0 5,240.4 239.6 66.4 72.9 8,643.7
Disposals/adjustments – 3.0 (7.3) 1.4 334.0 44.0 45.7 8.9 429.7
Additions on acquisition – – – – 13.3 – – – 13.3
Other adjustments
Exchange differences – 33.6 9.5 145.9 221.9 13.2 (0.2) 9.9 433.8
At March 31, 2016 171.7 3,137.0 359.7 10,462.0 36,624.0 1,189.6 193.3 542.7 52,680.0
Depreciation
At April 1, 2014 9.6 0.1 24.4 1,276.5 10,387.4 388.0 59.5 151.9 12,297.4
Charge for the year 3.8 – 6.5 316.5 2,700.3 121.6 62.1 123.6 3,334.4
Disposals/adjustments – – – 2.3 258.8 9.2 3.8 4.9 279.0
Additions on acquisition – – – – – – – – –
Other adjustments
Exchange differences – – (1.9) 11.0 16.2 (8.2) (0.1) (0.6) 16.4
At March 31, 2015 13.4 0.1 29.0 1,601.7 12,845.1 492.2 117.7 270.0 15,369.2
Charge for the year 8.5 0.6 10.0 364.5 2,867.1 100.3 33.4 72.7 3,457.1
Disposals/adjustments – – (8.2) (5.1) 198.2 15.1 42.4 9.3 251.7
Additions on acquisition – – – – 2.0 – – – 2.0
Other adjustments
Exchange differences – – 1.3 20.6 95.1 6.9 (0.1) 6.6 130.4
At March 31, 2016 21.9 0.7 48.5 1,991.9 15,611.1 584.3 108.6 340.0 18,707.0
Net block
At March 31, 2015 136.0 1,266.7 175.4 7,691.8 18,637.3 488.6 55.1 198.8 28,649.7
At March 31, 2016 149.8 3,136.3 311.2 8,470.1 21,012.9 605.3 84.7 202.7 33,973.0
Capital work-in-progress `9,952.5 (March 31, 2015: `4,041.8) (Refer Note 33).
1. The title deeds of land and buildings aggregating to `161.9 (March 31, 2015: `161.9) are pending transfer to the Company's name.
2. Depreciation for the year include `3.3 (March 31, 2015: `2.3) taken as pre-operative capital expenditure on capital projects pending capitalization.
3. Depreciation for the year include `3.4 (March 31, 2015: `Nil) which has been capitalized.
4. Depreciation for the year include `4.8 (March 31, 2015: `Nil) taken as intangible assets under development.
5. Details of finance lease (Refer Note 36).
6. Land of one of the subsidiary to the extent of 100.44 acres amounting to `99.0 (March 31, 2015 `99.0) has been attached by the Directorate of Enforcementduring the financial year 2012-13 in a legal case pertaining to the parent company.
Notes to Consolidated financial statements for the year ended March 31, 2016
(All amounts in Indian Rupees million, except share data and where otherwise stated)

162
11. FIXED ASSETS - INTANGIBLE ASSETS
Goodwill on Goodwill on Brands Product Licences Totalconsolidation acquisition development cost and patents
GROSS BLOCK
At April 1, 2014 763.8 – – 286.6 3,361.6 4,412.0
Additions – – – 39.8 355.0 394.8
Disposals/adjustments – – – 185.3 254.7 440.0
Additions on acquisition – 4,692.8 1,837.5 – 269.9 6,800.2
Other adjustments
Exchange differences (123.6) – – (42.0) (559.0) (724.6)
At March 31, 2015 640.2 4,692.8 1,837.5 99.1 3,172.8 10,442.4
Additions – – 159.0 76.3 963.0 1,198.3
Disposals/adjustments – 1,371.2 – 62.4 1,641.8 3,075.4
Additions on acquisition* 181.3 – – – – 181.3
Other adjustments
Exchange differences 65.4 281.9 110.4 8.6 217.5 683.8
At March 31, 2016 886.9 3,603.5 2,106.9 121.6 2,711.5 9,430.4
Amortization
At April 1, 2014 – – – 129.0 2,186.5 2,315.5
Charge for the year – – 58.3 34.9 179.5 272.7
Disposals/adjustments – – – 57.0 73.5 130.5
Additions on acquisition – – – – – –
Other adjustments
Exchange differences – – 1.4 (21.1) (402.3) (422.0)
At March 31, 2015 – – 59.7 85.8 1,890.2 2,035.7
Charge for the year – – 207.7 61.6 211.2 480.5
Disposals/adjustments – – – 85.5 1,549.3 1,634.8
Additions on acquisition – – – – – –
Other adjustments
Exchange differences – – 6.6 (0.1) 117.7 124.2
At March 31, 2016 – – 274.0 61.8 669.8 1,005.6
Net block
At March 31, 2015 640.2 4,692.8 1,777.8 13.3 1,282.6 8,406.7
At March 31, 2016 886.9 3,603.5 1,832.9 59.8 2,041.7 8,424.8
Intangible assets under development `285.1 (March 31, 2015: `154.5) (Refer Note 33).
*Includes `178.4 of goodwill arising on acquisition of minority interest of Auronext Pharma Private Limited.
Notes to Consolidated financial statements for the year ended March 31, 2016
(All amounts in Indian Rupees million, except share data and where otherwise stated)

Annual Report 2015-16
163
As at As atMarch 31, 2016 March 31, 2015
12. NON-CURRENT INVESTMENTS
Trade investments
Long-term, unquoted, in fully paid equity shares
(at cost unless stated otherwise)
i. 753 (753) equity shares of Jeedimetla Effluent Treatment Limited of `100 each 0.1 0.1
ii. 103,709 (103,709) equity shares of Patancheru Envirotech Limited of `10 each 1.0 1.0
iii. 1,000 (1,000) equity shares of Progressive Effluent Treatment Limited of `100 each 0.1 0.1
TOTAL (A) 1.2 1.2
Non-trade investments
Long-term, unquoted and at cost, in government securities
i. Kisan Vikas Patra – –
ii. National Savings Certificate [includes `0.07 held by 0.2 0.2
income tax authorities (March 31, 2015: `0.07)]
TOTAL (B) 0.2 0.2
TOTAL (A+B) 1.4 1.4
Notes:
1. Aggregate value of unquoted investments 1.4 1.4
2. Aggregate provision for diminution in the value of investments – –
Notes to Consolidated financial statements for the year ended March 31, 2016
(All amounts in Indian Rupees million, except share data and where otherwise stated)

164
Non-current Current
As at As at As at As atMarch 31, 2016 March 31, 2015 March 31, 2016 March 31, 2015
13. LOANS AND ADVANCES
(Unsecured, considered good except stated otherwise)
Capital advances
Considered good 1,189.6 852.1 – –
Doubtful 0.8 0.8 – –
1,190.4 852.9 – –
Provision for doubtful advances 0.8 0.8 – –
TOTAL (A) 1,189.6 852.1 – –
Trade deposit
Considered good* 496.9 370.6 64.1 0.4
Doubtful 0.4 0.4 – –
497.3 371.0 64.1 0.4
Provision for doubtful deposit 0.4 0.4 – –
TOTAL (B) 496.9 370.6 64.1 0.4
Advances recoverable in cash or kind
Considered good 21.9 24.6 1,906.9 2,149.5
Doubtful 30.1 30.1 – –
52.0 54.7 1,906.9 2,149.5
Provision for doubtful advances 30.1 30.1 – –
TOTAL (C) 21.9 24.6 1,906.9 2,149.5
Other loans and advances
Advance income tax (Net of provision for taxation) 449.4 439.4 42.6 69.7
MAT credit entitlement 1,623.6 2,610.1 600.0 –
Share application money to others – 33.9 – –
Intercorporate deposit – – – 10.0
Loans to employees 54.5 55.3 103.1 83.7
Export rebate claims receivable – – 2,037.9 1,805.2
Balances with statutory/government authorities
Considered good 174.2 166.7 1,699.2 1,565.7
Doubtful 38.1 38.1 – –
212.3 204.8 1,699.2 1,565.7
Provision for doubtful advances 38.1 38.1 – –
174.2 166.7 1,699.2 1,565.7
TOTAL (D) 2,301.7 3,305.4 4,482.8 3,534.3
TOTAL (A+B+C+D) 4,010.1 4,552.7 6,453.8 5,684.2
Refer Note 40 for advances due from private companies/partnership firm in which parent company's director is a director/partner.*Non–current deposits include deposits pledged with Enforcement Directorate of `32.6 (March 31, 2015: `32.6).
Notes to Consolidated financial statements for the year ended March 31, 2016
(All amounts in Indian Rupees million, except share data and where otherwise stated)

Annual Report 2015-16
165
Non-current Current
As at As at As at As atMarch 31, 2016 March 31, 2015 March 31, 2016 March 31, 2015
14. TRADE RECEIVABLES
(Unsecured, considered good unless stated otherwise)
Outstanding for a period exceeding six months from the
date they are due for payment
Considered good – – 1,232.3 1,440.9
Doubtful 143.8 32.2 1,149.7 703.1
143.8 32.2 2,382.0 2,144.0
Provision for doubtful receivables 143.8 32.2 1,149.7 703.1
TOTAL (A) – – 1,232.3 1,440.9
Others
Considered good – – 40,486.9 33,950.8
Doubtful – – 80.9 144.9
– – 40,567.8 34,095.7
Provision for doubtful receivables – – 80.9 144.9
TOTAL (B) – – 40,486.9 33,950.8
TOTAL (A+B) – – 41,719.2 35,391.7
Refer Note 41 for trade receivables due from private companies or partnership firms in which parent company's director is a director or partner.
As at As atMarch 31, 2016 March 31, 2015
15. OTHER CURRENT ASSETS
(Unsecured, considered good unless stated otherwise)
Unamortized premium on forward contract 34.7 –
Insurance claim receivable 0.1 92.7
Export incentives receivable
Considered good 2,177.7 710.0
Doubtful 44.8 –
2,222.5 710.0
Provision for doubtful receivables (44.8) –
2,177.7 710.0
Assets held for sale – 83.2
Interest accrued on deposits 27.3 25.6
Receivables - Others 376.8 –
TOTAL 2,616.6 911.5
16. OTHER NON-CURRENT ASSETS
(Unsecured, considered good unless stated otherwise)
Export incentives receivable 272.3 285.2
Non-current bank balances (Refer Note 19) 58.7 17.3
TOTAL 331.0 302.5
Notes to Consolidated financial statements for the year ended March 31, 2016
(All amounts in Indian Rupees million, except share data and where otherwise stated)

166
As at As atMarch 31, 2016 March 31, 2015
17. CURRENT INVESTMENTS
Current portion of long-term investment (at cost)
Unquoted, in fully paid equity shares, at lower of cost and market value
70,000 (70,000) shares of Citadel Aurobindo Biotech Limited of `100 each – –
[Aggregate provision for diminution in value of `7.0 (March 31, 2015: `7.0)]
Nil (10%) of paid-in-capital of Sino-Pharma Group Weiqida Zhong Khag
Pharma Company Limited – 196.2
Quoted, in fully paid equity shares, at lower of cost and market value
4,520 (4,520) equity shares of Andhra Bank of `10 each 0.2 0.3
TOTAL 0.2 196.5
1. Aggregate value of unquoted investments – 196.2
2. Aggregate value of quoted investments 0.2 0.3
3. Market value of quoted investments 0.2 0.3
4. Aggregate provision for diminution in the value of investments 7.0 7.0
18. INVENTORIES
(Valued at lower of cost and net realizable value)
Raw materials [includes in-transit `228.6 (March 31, 2015: `334.0)] 15,077.8 12,342.4
Packing materials 1,435.6 1,621.3
Work-in-progress 9,246.6 7,616.8
Finished goods [includes in-transit `176.9 (March 31, 2015: `322.1)] 7,906.3 7,139.1
Trading goods 5,876.9 6,229.2
Stores, spares and consumables 1,337.8 1,164.2
TOTAL 40,881.0 36,113.0
Non-current Current
As at As at As at As atMarch 31, 2016 March 31, 2015 March 31, 2016 March 31, 2015
19. CASH AND BANK BALANCES
Cash and cash equivalents
Cash on hand – – 8.2 7.9
Balances with banks:
On current accounts – – 6,726.7 4,316.0
On cash credit accounts – – 962.0 15.3
Deposits with original maturity of less than 3 months – - 534.2 259.3
On unpaid dividend account – – 14.4 12.5
– – 8,245.5 4,611.0
Other bank balances
Deposits with original maturity for more than 12 months – – 42.1 39.5
Deposits with original maturity for more than 3 months
but less than 12 months – – 0.2 33.4
Margin money deposit * 58.7 17.3 56.1 7.2
58.7 17.3 98.4 80.1
Amount disclosed under non–current assets (Refer Note 16) (58.7) (17.3)
TOTAL – – 8,343.9 4,691.1
*Given against bank guarantees and performance guarantees
Notes to Consolidated financial statements for the year ended March 31, 2016
(All amounts in Indian Rupees million, except share data and where otherwise stated)

Annual Report 2015-16
167
Year ended Year endedMarch 31, 2016 March 31, 2015
20. REVENUE FROM OPERATIONS (GROSS)Sale of finished goods 113,869.2 95,888.2Sale of traded goods 23,980.5 25,769.2Sale of services 262.0 294.9Other operating revenue
Scrap sales 78.9 71.6Export incentives 2,375.9 701.4
TOTAL 140,566.5 122,725.3
21. OTHER INCOMEInterest income on
Bank deposits 12.5 16.5
Other deposits and receivables 91.2 139.1
Dividend income on current investments - trade – –
Balances no longer required written back (Net) 79.0 232.5
Bad debts written off recovered from trade receivables (Net) – 85.3
Foreign exchange gain (Net) 980.5 159.6
Profit on investments (Net) 63.8 –
Commission income 35.5 26.7
State subsidy received 215.2 135.1
Miscellaneous income 185.0 172.3
TOTAL 1,662.7 967.1
22. COST OF MATERIALS CONSUMEDRaw material consumed
Opening stock [Includes inventories on acquisition of
subsidiary `Nil (March 31, 2015: `384.3)] 12,342.4 10,163.9
Add: Purchases 45,381.3 39,299.4
57,723.7 49,463.3
Less: Closing stock 15,077.8 12,342.4
Cost of raw material consumed 42,645.9 37,120.9
Adjustment for fluctuation in exchange rates 93.0 47.4
Packing materials consumed 5,510.1 4,059.8
TOTAL 48,249.0 41,228.1
23. INCREASE IN WORK-IN-PROGRESS, TRADED AND FINISHED GOODSInventories at the beginning of the year
Traded goods includes inventories on acquisition of subsidiaries
`Nil (March 31, 2015: `6,703.6) 6,229.2 6,826.1 352.3
Work-in-progress [Includes inventories on acquisition of subsidiary
`Nil (March 31, 2015: `263.8)] 7,616.8 5,944.9 (1,629.8)
Finished goods [Includes inventories on acquisition of subsidiary
`Nil (March 31, 2015: `667.5)] 7,139.1 6,585.9 (767.2)
20,985.1 19,356.9 (2,044.7)
Inventories at the end of the year March 31, 2015
Traded goods 5,876.9 6,229.2 596.9
Work-in-progress 9,246.6 7,616.8 (1,671.9)
Finished goods 7,906.3 7,139.1 (553.2)
23,029.8 20,985.1 (1,628.2)
(2,044.7) (1,628.2)
On account of stock write off 247.3 574.4
Adjustment for fluctuation in exchange rates (1,297.1) 1,092.2
TOTAL (994.9) (3,294.8)
Year ended Year ended (Increase)/decreaseMarch 31, 2016 March 31, 2015 March 31, 2016
Notes to Consolidated financial statements for the year ended March 31, 2016
(All amounts in Indian Rupees million, except share data and where otherwise stated)

168
Year ended Year endedMarch 31, 2016 March 31, 2015
24. EMPLOYEE BENEFIT EXPENSES
Salaries, wages and bonus 13,474.1 11,289.2
Contribution to provident and other funds 624.1 560.8
Retirement benefits (Refer Note 32) 288.7 332.9
Staff welfare expenses 1,121.5 839.7
TOTAL 15,508.4 13,022.6
25. OTHER EXPENSES
Conversion charges 430.1 487.5
Consumption of stores and spares 1,442.0 1,233.9
Chemicals consumed 1,715.6 1,222.3
Power and fuel 4,192.6 3,596.0
Carriage inward 692.1 713.5
Factory maintenance 312.4 295.6
Effluent treatment expenses 137.0 125.5
Decrease of excise duty on inventory (Refer Note 38) 12.1 2.7
Repairs and maintenance
i. Plant and machinery 829.1 608.5
ii. Buildings 312.4 332.1
iii. Others 160.8 101.1
Rent 606.1 525.1
Rates and taxes 1,110.5 1,083.4
Printing and stationery 153.8 153.8
Postage and telephones 195.4 180.0
Insurance 418.5 417.3
Legal and professional charges 2,211.3 2,217.3
Directors sitting fees 2.7 2.4
Remuneration to auditors 17.6 10.9
Sales commission 738.2 398.1
Carriage outwards 4,596.4 4,610.9
Selling expenses 3,438.5 3,608.5
Rebates and discounts 229.9 172.3
Travelling and conveyance 597.4 542.1
Vehicle maintenance expenses 113.2 153.4
Analytical charges 767.1 640.8
Bad debts/advances written off 16.9 –
Donations 4.8 17.7
Registration, license and filing charges 1,998.9 1,452.2
Product development expenses 150.6 253.0
Product destruction expenses/stock written off 247.3 574.4
Software license and implementation expenses 104.1 79.3
Provision for doubtful receivables/advances/assets (Net) 467.5 365.0
Loss on sale/write-off of fixed assets (Net) 49.9 156.9
Loss on current investment 0.1 –
Corporate Social Responsibility (CSR) expenditure (Refer Note below) 187.6 81.3
Miscellaneous expenses 1,160.9 1,075.6
TOTAL 29,821.4 27,490.4
Notes to Consolidated financial statements for the year ended March 31, 2016
(All amounts in Indian Rupees million, except share data and where otherwise stated)

Annual Report 2015-16
169
Year ended Year endedMarch 31, 2016 March 31, 2015
Details of CSR expenditure Year ended Year ended
March 31, 2016 March 31, 2015
a. Gross amount required to be spent by the Company during the year 282.2 139.8
In cash Yet to be paid in cash Total
b. Amount spent during the year ending on March 31, 2016:
i. Construction/acquisition of any asset – – –
ii. On purposes other than (i) above 187.6 – 187.6
Amount spent during the year ending on March 31, 2015:
i. Construction/acquisition of any asset – – –
ii. On purposes other than (i) above 81.3 – 81.3
Year ended Year endedMarch 31, 2016 March 31, 2015
26. DEPRECIATION/AMORTIZATION
Depreciation of tangible assets 3,445.6 3,332.1
Less: Transfer to retained earnings – 278.7
3,445.6 3,053.4
Amortization of intangible assets 480.5 272.7
TOTAL 3,926.1 3,326.1
*During last year, based on transitional provisions, an amount of `196.4 (net of deferred tax) has been adjusted with opening retained earnings.
27. FINANCE COSTS
Interest 793.3 708.6
Bank charges 133.9 134.5
Exchange difference to the extent considered as an adjustment to borrowing costs 1,640.4 755.6
TOTAL 2,567.6 1,598.7
28. Capital and other commitments
a. Estimated amount of contracts (net of advances) remaining to be executed on capital account and not provided for `3,679.6(March 31, 2015: ` 4,085.1).
b. Export Commitment against import of machinery without duty `147.1 (March 31, 2015: `49.8).
29. Contingent liabilities
As at As atMarch 31, 2016 March 31, 2015
Outstanding bank guarantees 1,015.8 722.6
Claims arising from disputes not acknowledged as debts - direct taxes* 308.8 308.8
Claims arising from disputes not acknowledged as debts - indirect taxes
(excise duty, VAT and service tax)*# 296.2 772.1
Claims against the Group not acknowledged as debts - other duties/claims* 150.3 150.3
Bills discounted with banks 4,436.6 –
* in respect of above matters, future cash outflows in respect of contingent liabilities are determinable only by the occurrence or non occurrence of one ormore uncertain future events not wholly within the control of the Company.
# Excludes `13.4 (March 31, 2015: `152.0) where it is probable that an outflow of resources embodying economic benefits will be required to settle theobligation. All these cases are under litigation and are pending with various authorities, expected timing of resulting outflow of economic benefits cannotbe specified.
Notes to Consolidated financial statements for the year ended March 31, 2016
(All amounts in Indian Rupees million, except share data and where otherwise stated)

170
30. Earning per share
Year ended Year endedMarch 31, 2016 March 31, 2015
Consolidated profit after tax and minority interest considered for calculation ofbasic and diluted earnings per share 19,820.0 15,757.7
Weighted average number of equity shares considered for calculation ofbasic earnings per share (a)* 584,157,080 583,520,367
Effect of dilution on account of Employee Stock Options granted (b)* 162,549 245,810
Weighted average number of equity shares considered for calculation ofdiluted earnings per share (a+b)* 584,319,629 583,766,177
*Adjusted for bonus issue
31. Employee Stock Option Plan 'ESOP-2006'
The parent company instituted an Employee Stock Option Plan 'ESOP-2006' as per the special resolution passed in the 19th Annual General Meeting held on
September 18, 2006. This scheme has been formulated in accordance with the Securities Exchange Board of India (Employee Stock Option Scheme and
Employee Stock Purchase Scheme) Guidelines, 1999. The compensation committee accordingly, granted total 3,240,500 options under seven grants of
175,000; 25,000; 90,000; 1,205,000; 300,000; 500,000; 915,500 and 30,000 options to eligible employees on October 30, 2006; July 31, 2007; October 31,
2007; December 16, 2011; June 19, 2012; January 9, 2013; January 28, 2013 and August 9, 2013 respectively. The method of settlement under scheme is
by issue of equity shares of the Company. Each option comprises of one underlying equity share of `1 each. The said options vest on an annual basis at 10%,
15%, 25% and 50% over a period of four years and can be exercised over a period of six years from the date of grant of options. The options have been
granted at the then prevailing market price of `120.70, `132.35, `114.50, `91.60, `106.05, `200.70, `187.40 and `161.30 per share respectively and hence
the question of accounting for employee deferred compensation expenses does not arise as the parent company follows intrinsic value method.
The details of options outstanding of ESOP 2006 Scheme:
As at As atMarch 31, 2016 March 31, 2015
Options outstanding at the beginning of the year 1,556,145 2,131,369
Granted during the year – –
Additional options on adjustment of bonus issue @1:1 on July 22, 2015 1,143,470 –
Vested/exercisable during the year 1,497,564 474,570
Exercised during the year 1,205,036 525,254
Forfeited during the year subject to reissue 467,459 49,970
Options outstanding at end of the year 1,027,120 1,556,145
Exercisable at the end of the year 351,950 22,548
Weighted average exercise price for all the above options (`)* 60.27 107.52
Weighted average fair value of options at the date of grant (`)* 71.57 127.63
*For March 31, 2015 not adjusted for bonus issue.
Range of Number of options Weighted average remainingexercise prices (`) outstanding contractual life of options (in years)
As at March 31, 2016 45 to 101 1,027,120 2.59
As at March 31, 2015 91 to 201 1,556,145 3.41
Notes to Consolidated financial statements for the year ended March 31, 2016
(All amounts in Indian Rupees million, except share data and where otherwise stated)

Annual Report 2015-16
171
Disclosures as per Fair Value Method
The Group’s net profit and earnings per share would have been as under, had the compensation cost for employees’ stock options been recognized based on
the fair value at the date of grant in accordance with 'Black Scholes' model.
Year ended Year endedMarch 31, 2016 March 31, 2015
Profit after taxation
As reported in Consolidated Statement of Profit and Loss 19,820.0 15,757.7
Less: Additional employee compensation cost based on Fair Value 17.9 23.6
Profit after taxation as per Fair Value Method 19,802.1 15,734.1
Earnings per share
Basic
No. of shares* 584,157,080 583,520,367
EPS as reported (`) 33.93 27.00
EPS as per Fair Value Method (`) 33.90 26.96
Diluted
No. of shares* 584,319,629 583,766,177
EPS as reported (`) 33.92 26.99
EPS as per Fair Value Method (`) 33.89 26.95
*adjusted for bonus issue
The following assumptions were used for calculation of fair value of grants:
As at As atMarch 31, 2016 March 31, 2015
ESOP 2006 ESOP 2006
Risk-free interest rate (%) 8 8
Expected life of options (Years) 6 6
Expected volatility (%) 0.15 0.15
Dividend yield (%) 100 61
32. Retirement benefits
Year ended Year endedMarch 31, 2016 March 31, 2015
a. Disclosures related to defined contribution plan
Provident fund contribution recognized as expense in the Consolidated
Statement of Profit and Loss 225.1 155.5
b. Disclosures related to defined benefit plan
The parent company has a defined benefit gratuity plan. Every employee who has completed five years or more of service gets a gratuity on departure
at 15 days last drawn salary for each completed year of service.
The scheme is funded with an insurance company in the form of a qualifying insurance policy. The following tables summarise the components of net
benefit expense recognized in the consolidated statement of profit and loss, the fund status and consolidated balance sheet position:
Notes to Consolidated financial statements for the year ended March 31, 2016
(All amounts in Indian Rupees million, except share data and where otherwise stated)

172
Consolidated Statement of Profit and Loss
Year ended Year endedMarch 31, 2016 March 31, 2015
Net employee benefit expense (included under employee benefit expenses)
Current service cost 87.2 54.8
Interest cost on benefit obligation 45.5 36.0
Expected return on plan assets (20.2) (19.0)
Net actuarial (gain)/loss recognized in the year 22.0 101.6
Net benefit expense* 134.5 173.4
Actual return on plan assets 20.3 19.6
*Includes `6.2 (March 31, 2015: `1.4) transferred to capital work-in-progress.
Consolidated Balance Sheet
As at As atMarch 31, 2016 March 31, 2015
Details of provision for gratuity
Defined benefit obligation (DBO)* 618.1 503.4
Fair value of plan assets (FVPA)** 340.5 246.9
Net plan liability 277.6 256.5
* DBO as at March 31, 2014: `341.0; March 31, 2013: `317.7; March 31, 2012: `240.9.**FVPA as at March 31, 2014: `228.1; March 31, 2013: `202.7; March 31, 2012: `174.7.
Changes in the present value of the defined benefit obligation for gratuity are as follows:
Year ended Year endedMarch 31, 2016 March 31, 2015
Opening defined benefit obligation 503.4 341.1
Current service cost 87.2 54.8
Interest cost 45.5 36.0
Benefits paid (40.0) (30.8)
Actuarial losses on obligation* 22.0 102.3
Closing defined benefit obligation 618.1 503.4
* Experience adjustments on plan liabilities March 31, 2016: `11.8; March 31, 2015: `12.9; March 31, 2014: `9.7; March 31, 2013: `4.8 andMarch 31, 2012: `12.6.
Changes in fair value of plan assets
Year ended Year endedMarch 31, 2016 March 31, 2015
Opening fair value of plan assets 246.9 228.1
Expected return 20.2 19.0
Contributions by employer 113.3 30.0
Benefits paid (40.0) (30.8)
Actuarial gains* 0.1 0.6
Closing fair value of plan assets 340.5 246.9
* Experience adjustments on plan assets March 31, 2016: `0.00; March 31, 2015: `0.6; March 31, 2014: `(0.01); March 31, 2013: `0.3 andMarch 31, 2012: `3.3.
Notes to Consolidated financial statements for the year ended March 31, 2016
(All amounts in Indian Rupees million, except share data and where otherwise stated)

Annual Report 2015-16
173
The principal assumptions used in determining gratuity obligations for the parent company's plans are shown below:
As at As atMarch 31, 2016 March 31, 2015
Discount rate (p.a.) (%) 7.95 7.90
Expected return on assets (p.a.) (%) 8.00 8.00
Employee turnover:
Age (Years)
21-30 (%) 8 8
31-40 (%) 4 4
41-57 (%) 1 1
Notes:
1. The estimates of future salary increases, considered in actuarial valuation take account of inflation, seniority, promotion and other relevant factors,such as supply and demand in the employment market.
2. Percentage of plan assets as a percentage of the fair value of total plan assets with insurer is 100%.
3. The expected rate of return on assets is based on the expectation of the average long-term rate of return expected on investments of the fundduring the estimated term of the obligations.
4. The parent company expects to contribute `65.0 (March 31, 2015: `30.0) to the qualifying insurance policy in 2016-17.
5. Gratuity expense for the year has been included in retirement benefits under employee benefit expenses.
6. The above disclosure does not include net benefit expense of `2.4 (March 31, 2015: `12.0) and net plan liability of `22.2 (March 31, 2015: `17.2)relating to other components of the Group/Consolidated entities.
33. Expenditure during construction period pending capitalization
As at As atMarch 31, 2016 March 31, 2015
Balance brought forward 492.8 530.2
Add: Incurred during the year
Salaries, wages and bonus 406.6 96.1
Consumption of material for testing 273.3 –
Consumption of stores and spares 118.6 1.6
Carriage inward 2.3 0.5
Power and fuel 137.2 22.5
Conversion charges 29.9 1.7
Rates and taxes 3.2 11.0
Printing and stationery 10.1 0.4
Postage and telephones 2.0 1.7
Insurance 1.3 0.9
Legal and professional charges 3.4 0.7
Travelling and conveyance 19.4 4.6
Depreciation 3.3 2.4
Factory maintenance 25.4 5.9
Miscellaneous expenses 185.3 59.9
1,714.1 740.1
Less: Capitalized to fixed assets during the year 272.5 247.3
Less: Interest income (Net of tax) 7.3 –
Balance carried forward 1,434.3 492.8
Notes to Consolidated financial statements for the year ended March 31, 2016
(All amounts in Indian Rupees million, except share data and where otherwise stated)

174
34. Acquisition of subsidiaries
i. Effective April 1, 2015, Aurobindo Pharma Limited acquired 60% stake in the share capital of Tergene Biotech Private Limited (herein after referred as'acquired entity').
The acquisition of the interest in the acquired entity has been accounted in accordance with the accounting principles laid down under AS 21.Accordingly, excess of purchase price paid over the net assets acquired has been recorded as Goodwill in the Consolidated Financial Statements.Transactions relating to Statement of Profit and Loss of the acquired entity have been included in the Consolidated Statement of Profit and Loss from theeffective date of acquisition.
The interest of APL in the net assets of the acquired entity and resulting goodwill as on the date of acquisitions are as given hereunder:
Particulars March 31, 2016
Purchase consideration 33.9
Net assets as on the date of acquisition 31.0
Goodwill 2.9
a. Summary of post acquisition loss of the acquired entity included in the Consolidated Statement of Profit and Loss for the year ended March 31, 2016
Particulars March 31, 2016
Income 0.6
Expenses 54.9
Net loss considered in the Consolidated Statement of Profit and Loss (54.3)
b. The assets and liabilities of the acquired entity included in the Consolidated Balance Sheet as at March 31, 2016 are:
Particulars March 31, 2016
Liabilities
Non-current liabilities
Long-term borrowings 3.8
Current liabilities
Trade payables 1.6
Other current liabilities 3.3
Assets
Non-current assets
Fixed assets (Net) 30.4
Capital work-in-progress 1.3
Long-term loans and advances 7.9
Current assets
Cash and bank balances 5.9
Short-term loans and advances 0.6
ii. Effective December 4, 2014, Aurobindo Pharma USA Inc., U.S.A., the subsidiary of APL acquired the assets including bussiness of Natrol Inc, U.S.A. and
its affiliates under an auction process and continued operations under Natrol LLC, U.S.A. ('acquired entity').
The initial purchase price of the acquired entity on December 4, 2014 has been allocated based on estimated fair values at the date, for the various
assets and liabilities assumed under an Asset Purchase Agreement. The Company ascribed fair values based on its then estimates and third party
technical evaluation for the various tangible and intangible assets acquired. On April 6, 2015, the Company filed a complaint against the sellers group
regarding certain discrepancies in the value of acquired assets under the Asset Purchase Agreement and subsequently reached a settlement pursuant to
which the Company received consideration in the form of cash, certain global intellectual property rights and other assets. The seller was also obligated
to assume certain disputed liabilities (included in the initial purchase price allocation). The settlement was approved by the Bankruptcy Court of the
District of Delaware. The following table summarizes the preliminay and as adjusted, allocation of purchase price consideration, for the fair values of the
assets acquired and liabilities assumed and the determination of goodwill:
Notes to Consolidated financial statements for the year ended March 31, 2016
(All amounts in Indian Rupees million, except share data and where otherwise stated)

Annual Report 2015-16
175
Particulars As adjusted Preliminary
Purchase consideration 8,845.0 8,343.8
Liabilities assumed:
Accounts payable, accrued expenses and customer deposits 1,196.5 1,166.8
Total (A) 10,041.5 9,510.6
Fair value of net assets acquired:
Cash and cash equivalents 1,598.9 206.8
Accounts reveivables net 761.4 664.4
Inventory 1,431.1 1,350.0
Property and equipment 447.0 421.7
Intangibles - Customer relationships and brand products 2,106.9 1,837.5
Other assets 92.7 337.4
Total (B) 6,438.0 4,817.8
Goodwill (A-B) 3,603.5 4,692.8
As at March 31, 2016, the consolidated balance sheet reflects the purchase price allocated to the assets acquired and liabilities assumed based on revised
estimated fair values on December 4, 2014 and the effects of the legal settlement and additional adjustments. The excess of the purchase consideration over
the fair value of the net assets acquired has been allocated to goodwill. The Company has also been awarded or assigned the rights to receive certain
settlements, claims and tax refunds which are subject to conditions, the passage of time and third party approvals. Based on the inherent uncertainties in
ultimately receiving these funds, the Company has not ascribed a value to these items. Any further transactions, receipts or payments related to the ultimate
resolution of these matters are not expected to be material; however such items will be recognized in results of operations in future periods.
a. Summary of post acquisition profit of the acquired entity included in the Consolidated Statement of Profit and Loss for the year ended:
Net profit considered in theName of the acquired entity Income Expenses Consolidated Statement of
Profit and Loss
March 31, 2016 7,263.2 6,247.1 1,016.1
March 31, 2015 1,880.7 1,798.6 82.1
b. The assets and liabilities of the acquired entity included in the Consolidated Balance Sheet as at March 31, 2015 are:
Particulars Natrol LLC
Liabilities
Current liabilities
Trade payables 539.2
Other current liabilities 298.2
Assets
Non-current assets
Fixed assets (Net) 6,745.4
Capital work-in-progress 202.3
Current assets
Inventory 1,195.4
Trade receivables 548.7
Cash and bank balances 181.5
Short-term loans and advances 397.4
Notes to Consolidated financial statements for the year ended March 31, 2016
(All amounts in Indian Rupees million, except share data and where otherwise stated)

176
iii. Effective April 1, 2014, Agile Pharma B.V. acquired 100% stake in the share capital of Arrow Generiques SAS, France, Actavis France SAS, France, Actavis
Management GmbH, Germany, Actavis Deutschland GmbH & Co. KG, Germany, Aurovitas Spain S.A., Spain (formerly Actavis Spain S.A.) and Actavis B.V.,The Netherlands ('collectively herein after referred as acquired entities').
The acquisition of the interests in the acquired entities has been accounted in accordance with the accounting principles laid down under AS 21.Accordingly, excess of net assets acquired over the purchase price paid has been recorded as capital reserve in the Consolidated Financial Statements.Transactions relating to Statement of Profit and Loss of the acquired entities have been included in the Consolidated Statement of Profit and Loss fromthe effective dates of acquisition.
The interest of APL in the net assets of the acquired entities and resulting capital reserve as on the date of acquisitions are as given hereunder:
Particulars March 31, 2015
Purchase consideration 2,525.6
Net assets as on the date of acquisition 3,253.4
Capital reserve (727.8)
a. Summary of post acquisition profit (after elimination of inter company transactions) of the acquired entities included in the Consolidated Statement of
Profit and Loss for the year ended March 31, 2015
Particulars March 31, 2015
Income 22,573.7
Expenses 16,271.3
Net profit considered in the Consolidated Statement of Profit and Loss 6,302.4
b. The assets and liabilities of the acquired entities included in the Consolidated Balance Sheet as at March 31, 2015 are:
Particulars March 31, 2015
Liabilities
Non-current liabilities
Long-term provisions 4.3
Current liabilities
Trade payables 4,272.9
Other current liabilities 4,962.1
Short-term provisions 89.9
Assets
Non-current assets
Fixed assets (Net) 306.7
Capital work-in-progress 119.6
Longterm loans and advances 9.8
Current assets
Inventory 5,542.5
Trade receivables 3,673.6
Cash and bank balances 1,623.9
Short-term loans and advances 475.1
iv. The Consolidated Financial Statements include financial results of operations and financial position of the above acquisitions. The corresponding figures
of the previous year are not comparable.
Notes to Consolidated financial statements for the year ended March 31, 2016
(All amounts in Indian Rupees million, except share data and where otherwise stated)

Annual Report 2015-16
177
35. Related party disclosures
i. Names of related parties and description of relationship
a. Enterprises over which key management personnel or their relatives exercise significant influence
Pravesha Industries Private Limited, India
Sri Sai Packaging, India (Partnership firm)
Trident Chemphar Limited, India
Auropro Soft Systems Private Limited, India
Axis Clinicals Limited, India
Axis Clinicals LLC, U.S.A.
Pranit Projects Private Limited, India
Pranit Packaging Private Limited, India
Cogent Glass Limited, India
Orem Access Bio Inc, India
Veritaz Healthcare Limited, India
Alex Merchant Pte. Limited, Singapore
Trident Petrochemicals DMCC, Dubai
b. Key managerial personnel
Mr. K. Nithyananda Reddy, Whole-time Director
Dr. M. Sivakumaran, Whole-time Director
Mr. M Madan Mohan Reddy, Whole-time Director
Mr. N. Govindarajan, Managing Director
Mr. Sudhir B. Singhi, Chief Financial Officer (upto June 30, 2014)
Mr. Santhanam Subramanian, Chief Financial Officer (w.e.f. July 1, 2014)
Mr. A. Mohan Rami Reddy, Company Secretary
c. Relatives to key managerial personnel
Mr. P. Sarath Chandra Reddy (Son-in-law of Mr. K. Nithyananda Reddy, Whole-time Director)
Mr. Vishnu M. Sriram (Son-in-law of Dr. M. Sivakumaran, Whole-time Director)
ii. Transactions with related parties
a. Transactions with enterprises over which key management personnel or their relatives exercise significant influence
Particulars Year ended Year endedMarch 31, 2016 March 31, 2015
Pravesha Industries Private Limited, India
Sale of goods – 0.2
Purchase of goods 1,892.1 1,589.2
Rent and electricity charges received 1.0 0.3
Balance receivable 0.1 –
Balance payable 58.0 29.5
Sri Sai Packaging, India
Sale of goods 0.4 0.3
Purchase of goods 196.0 169.0
Balance receivable – –
Balance payable 0.3 0.2
Axis Clinicals Limited, India
Purchase of services 549.0 308.0
Balance payable 79.0 22.7
(Contd.)
Notes to Consolidated financial statements for the year ended March 31, 2016
(All amounts in Indian Rupees million, except share data and where otherwise stated)

178
Particulars Year ended Year endedMarch 31, 2016 March 31, 2015
Axis Clinicals LLC, USA
Purchase of services 10.5 –
Balance payable 5.2 –
Trident Chemphar Limited, India
Sale of goods – 77.3
Purchase of goods 696.1 1,202.5
Balance payable 108.4 65.0
Auropro Soft Systems Private Limited, India
Purchase of goods – 2.5
Purchase of services – 3.7
Pranit Packaging Private Limited, India
Purchase of goods 165.9 121.6
Sale of goods – –
Balance receivable 0.8 0.7
Balance payable – 0.1
Pranit Projects Private Limited, India
Purchase of services (Civil services) 19.5 49.7
Cogent Glass Limited, India
Purchase of goods 571.7 446.6
Balance payable 138.1 25.6
Orem Access Bio Inc, India
Purchase of goods 114.3 85.5
Balance payable – –
Veritaz Healthcare Limited, India
Sale of goods 8.4 25.0
Purchase of services – 14.5
Rent received 0.3 0.3
Balance payable – –
Balance receivable 2.7 17.8
Alex Merchant Pte. Limited, Singapore
Purchase of goods – 309.1
Balance receivable – 8.4
Trident Petrochemicals DMCC, Dubai
Purchase of goods 164.6 156.3
Balance payable 0.1 39.9
b. Transactions with key managerial personnel
Mr. K. Nithyananda Reddy
Managerial remuneration 14.3 10.5
Rent expense 2.2 2.0
Dr. M. Sivakumaran
Managerial remuneration 14.3 10.5
Mr. M. Madan Mohan Reddy
Managerial remuneration 15.2 10.5
Mr. P. Sarath Chandra Reddy
Directors sitting fees 0.4 0.4
Mr. Vishnu M. Sriram
Remuneration 4.4 4.1
Equity allotment – ESOP 0.2 0.2
(Contd.)
Notes to Consolidated financial statements for the year ended March 31, 2016
(All amounts in Indian Rupees million, except share data and where otherwise stated)

Annual Report 2015-16
179
Particulars Year ended Year endedMarch 31, 2016 March 31, 2015
Mr. N. Govindarajan
Managerial remuneration 90.5 59.7
Equity allotment – ESOP 22.9 11.5
Balance payable 65.0 40.0
Mr. Sudhir B. Singhi
Remuneration (upto June 30, 2014) – 2.5
Mr. Santhanam Subramanian
Remuneration (w.e.f. July 1, 2014) 11.9 6.6
Balance payable 2.0 –
Mr. A. Mohan Rami Reddy
Remuneration 3.3 3.9
Equity allotment – ESOP 0.3 0.2
Loan outstanding – 0.1
Note: Managerial remuneration does not include provision for gratuity and leave encashment, which is determined for the Company as a whole.
36. Leases
a. Operating lease
i. Operating leases are mainly in the nature of lease of office premises with no restrictions and are renewable/cancellable at the option of either ofthe parties except for details in (ii) below. There is no escalation clause in the lease agreement. There are no sub-leases. There are no restrictionsimposed by lease arrangements. The aggregate amount of operating lease payments recognised in the Consolidated Statement of Profit and Lossis `606.1 (March 31, 2015: `525.1).
The Group’s/Consolidated entities has not recognized any contingent rent as expense in the Consolidated Statement of Profit and Loss.
ii. The parent company has entered into non cancellable leases for office premises in current year and previous year. These leases have remaining noncancellable period of 17 months (March 31, 2015: 29 months). The lease includes an escalation clause in the lease agreement. Future minimumlease rentals under non cancellable operating leases are as follows:
Particulars March 31, 2016 March 31, 2015
a. Within one year 42.3 40.3
b. After one year and not more than three years 18.0 60.3
c. After three years and not more than five years – –
b. Finance lease
i. Buildings include factory buildings acquired on finance lease. The agreement is silent on renewal terms and transfer of legal title at the end oflease term.
ii. The lease agreement did not specify minimum lease payments over the future period. The factory building is acquired on lease at a considerationof `359.7 (March 31, 2015: `204.4).
iii. The net carrying amount of the buildings obtained on finance lease `311.2 (March 31, 2015: `175.4).
37. Disclosure regarding derivative financial instruments
a. The aggregate amount of forward contracts entered into by the parent company and remaining outstanding as at Balance Sheet date are:
Hedge - To sell against As at As at As at As atMarch 31, 2016 March 31, 2015 March 31, 2016 March 31, 2015
Receivable $7,000,095 – 463.8 –
Short-term borrowings $10,525,000 – 697.3 –
Receivable £4,800,000 – 458.3 –
Receivable €10,204,772 – 769.4 –
Notes to Consolidated financial statements for the year ended March 31, 2016
(All amounts in Indian Rupees million, except share data and where otherwise stated)

180
39. Additional statutory information in respect of the components of APL and its consolidated entities
March 31, 2016 March 31, 2015
Net assets i.e. total Share in Net assets i.e. total Share inassets minus total liabilities profit/(loss) assets minus total liabilities profit/(loss)
As % of Amount As % of Amount As % of Amount As % of Amountconsolidated consolidated consolidated consolidated
net assets profit/(loss) net assets profit/(loss)
Parent - Aurobindo Pharma Limited 96.51 68,105.2 81.72 16,196.7 103.95 53,595.4 96.23 15,163.5
Subsidiaries – IndianAPL Research Centre Limited 0.17 119.6 (0.01) (2.8) 0.23 120.9 (0.00) (0.1)
APL Healthcare Limited 1.16 816.8 (0.29) (56.6) 1.07 553.8 (0.01) (1.6)
Auronext Pharma Private Limited 1.19 843.5 (1.04) (205.6) 1.26 649.4 (1.29) (202.9)
Auro Peptides Limited 1.00 704.7 0.53 105.2 0.85 439.5 (0.39) (61.5)
Aurobindo Antibiotics Limited 0.01 4.7 (0.04) (8.2) 0.00 0.4 (0.00) (0.1)
Curepro Parenterals Limited 1.22 862.6 0.00 (0.2) 0.62 317.7 0.01 1.9
Eugia Pharma Specialities Limited 2.01 1,420.8 (0.06) (11.1) 0.92 473.6 (0.01) (1.4)
Hyacinths Pharma Private Limited 0.13 95.8 (0.01) (1.1) 0.16 84.4 (0.00) (0.1)
Silicon Life Sciences Private Limited 0.47 329.9 (0.33) (66.0) 0.74 383.4 (0.02) (3.1)
AuroZymes Limited (0.00) (0.2) (0.00) (0.6) 0.00 0.4 (0.00) (0.1)
Tergene Biotech Private Limited 0.05 37.3 (0.27) (54.3) – – – –
Subsidiaries – ForeignAPL Pharma Thai Limited 0.23 161.1 (0.07) (14.0) 0.35 178.5 (0.07) (11.4)
Aurobindo Pharma IndustriaFarmaceutica Ltda 0.96 677.7 1.20 237.2 0.92 471.9 2.87 455.0
Aurobindo Pharma ProdutosFarmaceuticos Ltda 0.13 91.5 0.61 121.1 (0.06) (31.8) (0.34) (53.2)
All Pharma (Shanghai)Trading Company Limited 0.22 154.3 0.05 10.4 0.27 141.6 0.06 9.5
Helix Healthcare B.V. 9.42 6,651.2 (2.06) (408.3) 10.70 5,518.0 (0.25) (38.8)
Agile Pharma B.V. 5.03 3,547.9 0.96 189.5 5.79 2,985.2 1.27 200.1
Auro Pharma Inc. 0.36 252.5 0.69 136.3 0.21 107.6 0.01 1.0
Aurobindo Pharma (Australia) Pty Limited – – (0.01) (2.4) 0.25 126.7 (0.69) (108.2)
APL Holdings (Jersey) Limited – – (0.01) (1.8) 0.39 201.6 (0.34) (54.2)
Aurobindo Pharma (Pty) Limited 0.59 417.0 0.36 72.2 0.77 396.5 0.86 134.8
Auro Healthcare (Nigeria) Limited 0.00 0.8 (0.02) (3.3) 0.01 3.9 0.00 0.3
Aurobindo Pharma Japan K.K. 0.15 105.5 0.03 6.0 0.17 87.4 0.03 4.1
Agile Malta Holdings Limited – – – – – – 0.00 0.4
Laboratorios Aurobindo, S.L. 0.08 56.8 0.07 14.8 0.07 36.9 (1.41) (221.5)
Aurobindo Pharma (Italia) S.r.l. 0.16 116.0 (1.20) (236.9) 0.21 109.0 (3.41) (536.7)
Aurobindo Pharma (Portugal)Unipessoal LDA (0.48) (338.0) (0.72) (143.7) (0.32) (167.4) (1.10) (173.3)
b. Particulars of unhedged foreign currency exposure are detailed below at the exchange rate prevailing as at the Balance Sheet date:
Particulars As at As atMarch 31, 2016 March 31, 2015
Loans availed (31,681.5) (32,007.4)
Trade receivables 26,051.5 29,783.7
Loans and advances (including other current assets) 275.0 401.7
Trade payables (including creditors for capital goods) (4,862.9) (3,737.8)
Interest accrued but not due (37.7) (87.4)
Investments 7,050.0 7,224.5
Bank balances 2,217.9 313.0
38. In accordance with paragraph 10 of Notified Accounting Standard 9 on Revenue Recognition, excise duty on sales amounting to `1,605.7(March 31, 2015: `1,520.1) has been reduced from sales in Consolidated Statement of Profit and Loss and excise duty on decrease in closing stock of finishedgoods amounting to `12.1 (March 31, 2015: `2.7) has been debited to the Consolidated Statement of Profit and Loss.
Notes to Consolidated financial statements for the year ended March 31, 2016
(All amounts in Indian Rupees million, except share data and where otherwise stated)
(Contd.)

Annual Report 2015-16
181
Aurobindo Pharma GmbH 0.43 301.1 0.19 37.9 0.45 233.1 0.65 101.7
Aurobindo Ilac Sanayi VeTicaret Limited Sirketi 0.12 86.8 (0.07) (13.1) 0.20 102.5 (0.09) (14.4)
Aurobindo Pharma B.V. – – (0.16) (31.5) 0.15 76.3 (0.20) (31.3)
Aurobindo Pharma (Singapore)Pte Limited – – (0.00) (0.7) 0.00 – (0.00) (0.6)
Aurobindo Pharma (Romania) s.r.l. 0.09 60.7 (0.04) (7.5) 0.12 62.7 (0.13) (19.9)
Aurobindo Pharma Limited, s.r.l. – – – – – – (0.00) (0.6)
Aurobindo Pharma NZ Limited – – – – – – – –
Aurovida Farmaceutica S.A. de C.V. 0.49 343.9 (0.31) (61.1) 0.58 301.3 (0.27) (42.0)
Aurobindo Pharma Colombia S.A.S. 0.02 15.8 (0.03) (6.3) 0.00 1.1 (0.08) (13.0)
Aurovitas Unipessoal LDA 0.11 76.6 0.13 25.2 0.09 44.8 0.32 51.2
Aurovitas S.L. – – – – – – (0.00) (0.4)
Pharmacin B.V. (Formerly Aurex B.V.) 0.02 11.5 0.02 4.5 0.01 6.1 – –
Aurobindo Pharma USA Inc. 10.04 7,086.6 3.63 719.9 14.26 7,349.9 5.10 803.1
Aurolife Pharma LLC 10.39 7,333.4 8.76 1,735.7 10.20 5,256.9 7.95 1,252.8
Auromedics Pharma LLC 0.60 427.0 1.37 270.8 0.28 143.7 0.18 27.8
Auro Health LLC (0.80) (565.2) (0.74) (147.1) (0.76) (392.4) (0.84) (133.0)
Natrol LLC 1.02 722.0 3.77 748.1 (0.07) (34.8) (0.41) (64.5)
Aurex B.V. (Formerly Pharmacin B.V.) 0.14 97.1 0.10 19.6 0.13 68.3 0.32 49.8
Milpharm Limited 1.19 842.9 0.62 123.2 1.36 700.7 0.06 9.4
Aurobindo Pharma (Malta) Limited 0.86 609.7 (0.41) (81.6) 1.20 619.4 (0.07) (10.9)
APL Swift Services (Malta) Limited 0.29 203.3 (0.14) (26.8) 0.40 206.2 0.08 11.9
APL IP Company Limited – – (0.00) (1.0) 0.01 7.2 (1.76) (276.9)
Arrow Generiques SAS 2.66 1,876.1 0.88 173.6 2.92 1,506.6 (0.30) (46.8)
Actavis France SAS – – – – 0.84 433.6 (0.38) (59.1)
1980 Puren Pharma GmbH(Formerly Actavis Management GmbH) 0.01 3.9 (0.00) (0.7) 0.01 4.2 0.00 0.2
Puren Pharma GmbH (Formerly ActavisDeutschland GmbH & Co. KG, Germany) 2.12 1,494.3 3.60 714.5 2.09 1,078.1 2.61 410.6
Aurovitas Spain SA 0.91 640.9 (0.26) (50.9) 1.20 618.6 0.03 4.3
Aurobindo Pharma B.V.(Formerly Actavis B.V.) (0.19) (137.1) (1.46) (289.1) 0.01 7.4 (0.97) (153.1)
Joint ventures (as per proportionateconsolidation)
Joint ventures – Foreign
Novagen Pharma (Pty) Limited 0.42 294.2 0.48 94.7 0.50 257.6 0.57 90.2
Minority interests in all subsidiaries 0.84 595.5 (0.20) (39.1) 0.50 258.2 (0.29) (45.1)
TOTAL 150.87 106,465.0 100.21 19,861.9 165.21 85,185.4 104.67 16,494.0
Consolidation adjustments (50.87) (35,897.7) (0.21) (41.9) (65.21) (33,626.3) (4.67) (736.3)
Net amount 100.00 70,567.3 100.00 19,820.0 100.00 51,559.1 100.00 15,757.7
Note :
1. The disclosure as above represents separate information for each of the consolidated entities before elimination of inter-company transactions. The netimpacts on elimination of inter company transactions/profits/consolidation adjustments have been disclosed separately. Based on the group structure, themanagement is of the view that the above disclosure is appropriate under requirements of the Companies Act, 2013.
2. Percentages below 0.01% have been disclosed as 0.00%.
Notes to Consolidated financial statements for the year ended March 31, 2016
(All amounts in Indian Rupees million, except share data and where otherwise stated)
Additional statutory information in respect of the components of APL and its consolidated entities (Contd.)
March 31, 2016 March 31, 2015
Net assets i.e. total Share in Net assets i.e. total Share inassets minus total liabilities profit/(loss) assets minus total liabilities profit/(loss)
As % of Amount As % of Amount As % of Amount As % of Amountconsolidated consolidated consolidated consolidated
net assets profit/(loss) net assets profit/(loss)

182
40. Details of advances due from private companies in which parent company's director is a director.
Pranit Packaging Private Limited, India `0.8 (March 31, 2015: `0.7).
41. i. Details of trade receivables due from private companies in which parent company's director is a director.
Pravesha Industries Private Limited, India `0.1 (March 31, 2015: `Nil).
ii. Details of trade receivables due from partnership firm in which parent company's director is a partner.
Sri Sai Packaging, India `0.02 (March 31, 2015: `0.02).
42. The amount of research and development expenditure charged to Consolidated Statement of Profit and Loss is `4,699.4 (March 31, 2015: `3,465.5).
43. Interest in joint ventures
The Group has joint control over one joint venture entity:
Novagen Pharma (Pty) Limited, incorporated in South Africa, is engaged in distribution of pharmaceuticals products.
Notes:
i. Contingent liabilities of the above joint venture entities `Nil (March 31, 2015: `Nil).
ii. Capital commitments of the above joint venture entities `Nil (March 31, 2015: `Nil).
The aggregate amount of the assets, liabilities, income and expenses related to the Group’s share in the joint venture included in these consolidated financialstatements as of and for the year ended March 31, 2016 are given below:
2015-16
Particulars Gross amount Adjustments/ Net amountEliminations
Balance Sheet
Current assets 338.8 72.0 266.8
Non–current assets 78.6 75.4 3.2
Total assets 417.4 147.4 270.0
Current liabilities 149.7 70.6 79.1
Non–current liabilities – – –
Total liabilities 149.7 70.6 79.1
Statement of Profit and Loss
Income
Revenue from operations 645.6 – 645.6
Other income 2.6 – 2.6
648.2 – 648.2
Expenditure
Purchase of traded goods 307.5 280.4 27.1
Increase in traded goods (104.8) (37.6) (67.2)
Employee benefit expenses 41.1 – 41.1
Other expenses 289.0 5.0 284.0
Depreciation 4.0 3.1 0.9
Finance costs 0.4 – 0.4
537.2 250.9 286.3
Profit before tax 111.0 (250.9) 361.9
Income tax expense 32.3 – 32.3
Profit after tax 78.7 (250.9) 329.6
Notes to Consolidated financial statements for the year ended March 31, 2016
(All amounts in Indian Rupees million, except share data and where otherwise stated)

Annual Report 2015-16
183
2014-15
Particulars Gross amount Adjustments/ Net amountEliminations
Balance Sheet
Current assets 260.5 34.5 226.0
Non–current assets 89.2 85.6 3.6
Total assets 349.7 120.1 229.6
Current liabilities 94.1 29.1 65.0
Non–current liabilities – – –
Total liabilities 94.1 29.1 65.0
Statement of Profit and Loss
Income
Revenue from operations 656.1 – 656.1
Other income 11.3 – 11.3
667.4 – 667.4
Expenditure
Purchase of traded goods 143.2 142.0 1.2
Decrease in traded goods 59.7 30.9 28.8
Employee benefit expenses 42.0 – 42.0
Other expenses 294.9 (20.3) 315.2
Depreciation 3.4 – 3.4
Finance costs 0.3 – 0.3
543.5 152.6 390.9
Profit before tax 123.9 (152.6) 276.5
Income tax expense 35.6 – 35.6
Profit after tax 88.3 (152.6) 240.9
44. Segment information
a. Identification of reportable segments:
Segments are identified in line with AS 17 'Segment Reporting', taking into consideration the internal organization and management structure as well as
the differential risk and returns of the segment.
Based on the Group’s/Consolidated Entities business model of vertical integration, pharmaceuticals have been considered as the only reportable business
segment and hence no separate financial disclosures provided in respect of its single business segment.
Operations of the Group/Consolidated Entities are managed from independent locations, which are located in different geographical locations. However,
each of these operating locations are further aggregated based on the following factors: (a) similarity of economic and political conditions;
(b) relationships between operations in different geographical areas; (c) proximity of operations; (d) special risks associated with operations in a
particular area; (e) exchange control regulations; and (f) the underlying currency risk. Accordingly, the following have been identified as operating and
reportable segments: (a) 'India', (b) 'USA' (c) 'Europe' and (d) 'Rest of the World'.
b. Method of pricing inter segment transfers:
Inter segment sales are generally accounted at fair values and the same have been eliminated in consolidation. The accounting policies of the segments
are substantially the same as those described in the 'Statement of Significant Accounting Policies' as under para 1 above.
Notes to Consolidated financial statements for the year ended March 31, 2016
(All amounts in Indian Rupees million, except share data and where otherwise stated)

184
c. Financial information as required in respect of operating and reportable segments is as given below:
For the year ended and as at March 31, 2016
Particulars India U.S.A. Europe Rest of Eliminations Consolidatedthe World
Revenue
External sales 53,279.2 51,299.2 29,160.8 5,221.6 – 138,960.8
Inter - segment sales 38,480.2 – 38.8 879.5 (39,398.5) –
Total revenue 91,759.4 51,299.2 29,199.6 6,101.1 (39,398.5) 138,960.8
Other information
Segment assets 114,464.1 41,563.2 25,127.1 5,142.6 (32,727.4) 153,569.6
Other assets 3,423.9
Total assets 156,993.5
Segment liabilities 16,163.0 22,533.5 20,604.7 2,813.5 (26,039.3) 36,075.4
Other liabilities 50,350.8
Total liabilities 86,426.2
Capital expenditure 13,655.1 1,354.2 971.9 96.7 – 16,077.9
Depreciation/amortization 2,782.1 893.9 378.5 40.5 (168.9) 3,926.1
Non-cash expenses other
than depreciation 417.7 1.7 35.2 0.7 – 455.3
For the year ended and as at March 31, 2015
Particulars India U.S.A. Europe Rest of Eliminations Consolidatedthe World
Revenue
External sales 48,668.1 37,479.3 30,812.1 4,245.7 – 121,205.2
Inter–segment sales 32,183.9 – 11.7 2,587.6 (34,783.2) –
Total revenue 80,852.0 37,479.3 30,823.8 6,833.3 (34,783.2) 121,205.2
Other information
Segment assets 93,628.5 36,726.1 20,463.6 4,985.5 (30,392.6) 125,411.1
Other assets 3,733.7
Total assets 129,144.8
Segment liabilities 14,045.2 21,472.7 16,049.9 2,357.1 (24,303.5) 29,621.4
Other liabilities 47,964.3
Total liabilities 77,585.7
Capital expenditure 6,657.5 7,595.4 693.8 124.8 – 15,071.5
Depreciation/amortization 2,559.1 507.2 588.3 66.5 (395.0) 3,326.1
Non–cash expenses otherthan depreciation 138.7 – 110.8 39.9 – 289.4
45. The figures of previous year have been regrouped/rearranged, wherever necessary to conform to those of the current year.
As per our report of even date. For and on behalf of the Board of Directors of Aurobindo Pharma Limited
For S.R. BATLIBOI & ASSOCIATES LLPChartered AccountantsICAI Firm Registration No. 101049W/E300004 N. Govindarajan Dr. M. Sivakumaran
Managing Director DirectorDIN: 00050482 DIN: 01284320
per Vikas Kumar PansariPartnerMembership No. 93649 Santhanam Subramanian A. Mohan Rami Reddy
Chief Financial Officer VP (Legal) &Hyderabad, May 30, 2016 Company Secretary
Notes to Consolidated financial statements for the year ended March 31, 2016
(All amounts in Indian Rupees million, except share data and where otherwise stated)

Annual Report 2015-16
185
"
"
Tear
Her
e
AUROBINDO PHARMA LIMITEDCIN - L24239TG1986PLC015190
Registered Office: Plot No.2, Maitri Vihar, Ameerpet, Hyderabad 500 038Tel. : +91 40 2373 6370 | Fax : +91 40 2374 7340
E-mail: [email protected] | Website : www.aurobindo.com29th Annual General Meeting - Wednesday, 24th August, 2016
Proxy Form(Pursuant to Section 105(6) of the Companies Act, 2013 and Rule 19(3) of the Companies (Management and Administration) Rules, 2014)
Name of the Shareholder(s): _______________________________________________________________________________________
Registered Address: _______________________________________________________________________________________________
E-mail ID: _________________________________Folio No./Client ID:____________________ DP ID:__________________________
I/We, being member(s) of Aurobindo Pharma Limited, holding _______________________ shares of the Company, hereby appoint:
1. Name: ____________________________________________________________________________________________________
Address: ____________________________________________________________________________________________________
E-mail ID: _______________________________________ Signature:_______________________________
Or failing him/her
2. Name: ____________________________________________________________________________________________________
Address: ____________________________________________________________________________________________________
E-mail ID: _______________________________________ Signature:_______________________________
Or failing him/her
3. Name: ____________________________________________________________________________________________________
Address: ____________________________________________________________________________________________________
E-mail ID: _______________________________________ Signature:_______________________________
as my/our proxy to attend and vote (on poll) for me/us, on my/our behalf at the Annual General Meeting of the Company to be held on Wednesday,24th August, 2016 at 3.30 p.m. at Hotel Taj Krishna, Road No.1, Banjara Hills, Hyderabad - 500 034 and at any adjournment thereof in respect of suchresolutions as are indicated below:
Resolution No. Resolution
Ordinary Business
1. To receive, consider and adopt the standalone Balance Sheet as at March 31, 2016, Statement of Profit and Loss and Cash FlowStatement for the financial year ended March 31, 2016 and reports of Directors and Auditors thereon.
2. To receive, consider and adopt the Consolidated Balance Sheet as at March 31, 2016, Consolidated Statement of Profit and Lossand Consolidated Cash Flow Statement for the financial year ended March 31, 2016 and report of Auditors thereon.
3. To confirm the first interim dividend of `0.50, second interim dividend of `0.60, third interim dividend of `0.70 and fourthinterim dividend of `0.70, in aggregate `2.50 per equity share of `1 each, as dividend for the year 2015-16.
4. To appoint a Director in place of Mr. K. Nithyananda Reddy, who retires by rotation and being eligible, seeksre-appointment.
5. To appoint a Director in place of Mr. M. Madan Mohan Reddy, who retires by rotation and being eligible, seeksre-appointment.
6. To ratify the appointment of M/s. S.R.Batliboi & Associates LLP, Chartered Accountants as Statutory Auditors of the Company andfix their remuneration.
Special Business
7. To revise the remuneration of Mr. N. Govindarajan, Managing Director of the Company.
8. To revise the remuneration of Mr. M. Madan Mohan Reddy, Whole-time Director of the Company.
9. To appoint Mr. P. Sarath Chandra Reddy as a Whole-time Director of the Company.
Signed this ________________ day of _________________ 2016
RevenueStamp
Signature of Member............................................
Signature of Proxy holder(s)..................................
Notes: a. Proxy need not be a member of the Company.b. The Proxy Form duly filled in and signed by the Member(s) across the revenue stamp should reach the Company's
Registered Office: Plot No. 2, Maitri Vihar, Ameerpet, Hyderabad 500 038 at least 48 hours before the commencement of the meeting.c. Corporate members intending to send their authorized representative(s) to attend the meeting are requested to send a certified copy of the Board resolution
authorizing their representative(s) to attend and vote on their behalf at the meeting.

186

Annual Report 2015-16
187
"
"
Tear
Her
e
AUROBINDO PHARMA LIMITEDCIN - L24239TG1986PLC015190
Registered Office: Plot No.2, Maitri Vihar, Ameerpet, Hyderabad 500 038Tel. : +91 40 2373 6370 | Fax : +91 40 2374 7340
E-mail: [email protected] | Website : www.aurobindo.com
29th Annual General Meeting - Wednesday, 24th August, 2016
Attendance Slip
Folio No./Client ID: No. of Shares:
DP ID:
Name and address of
First/sole shareholder:
I, hereby record my presence at the 29th Annual General Meeting of the Company to be held on - Wednesday, 24th August, 2016 at 3.30 p.m. at
Hotel Taj Krishna, Road No.1, Banjara Hills, Hyderabad - 500 034
Name of the Member/Proxy Signature of the Member/Proxy(Block Letters)
Notes:
a. Only Member/Proxy can attend the meeting. No minors would be allowed at the meeting.
b. Member/Proxy who wish to attend the meeting must bring this attendance slip to the meeting and hand over at the entrance duly filled in and signed.
c. Member/Proxy should bring his/her copy of Annual Report for reference at the meeting.

188
AGM Venue - Route MapHotel Taj Krishna, Road No. 1, Banjara Hills, Hyderabad - 500 034
Landmark: Between GVK One & City Center Mall
Road No. 1, Banjara H
ills

Forward Looking StatementsThis communication contains statements that constitute ‘forward looking statements’ including, without limitation, statements relating tothe implementation of strategic initiatives and other statements relating to our future business developments and economic performance.
While these forward looking statements represent our judgements and future expectations concerning the development of our business, anumber of risks, uncertainties and other important factors could cause actual developments and results to differ materially from ourexpectations.
These factors include, but are not limited to, general market, macro-economic, governmental and regulatory trends, movements in currencyexchange and interest rates, competitive pressures, technological developments, changes in the financial conditions of third parties dealingwith us, legislative developments, and other key factors that we have indicated could adversely affect our business and financialperformance.
Aurobindo undertakes no obligation to publicly revise any forward looking statements to reflect future events or circumstances.
Concept, Research, Design & Production CAPRICORN ASSOCIATES, Hyderabad
On the cover: Images of three new manufacturing facilities being commissioned.
Unit XV
Unit XVI
Building the future
Unit X
Auro Mission
Aurobindo's mission is to become the most valuedpharmaceutical partner to the world pharma fraternityby continuously researching, developing and manufacturinga wide range of pharmaceutical products that comply withthe highest regulatory standards.
Auro Values
BUSINESS CARE
Operational Excellence
Stakeholder Orientation
Quality
PEOPLE CARE
Fairness, Humility and Respect for Individuals
Teamwork
Applied Learning
ORGANIZATION CARE
Accountability
Integrity
Achievement
Prime Minister of Malta, Mr. Joseph Muscat at our Malta office after inauguration of the expansion project in February, 2016.

AUROBINDO PHARMA LIMITED
www.aurobindo.com
REGISTERED OFFICEPLOT NO. 2, MAITRI VIHARAMEERPETHYDERABAD - 500 038TELANGANA, INDIA
CORPORATE OFFICEWATER MARK BUILDINGPLOT NO. 11, SURVEY NO. 9KONDAPUR, HITECH CITYHYDERABAD - 500 084TELANGANA, INDIA
Aurobindo
Pharma
Limited
|
A
nnual Report
2015-16
ANNUAL REPORT 2015-16
Building the future