august 7, 2020 iha consultants tri signal report for ... · august 7, 2020 iha consultants...
TRANSCRIPT

December 2, 2020 IHA Consultants TRI‐SIGNAL Report for selected DJIA Stocks sorted by Highest Return
The Boeing Co. (BA) Stock Price TRI‐SIGNALS Prior to Market Open 12/2/2020 (BA)Date Date Close PriceShort‐run Buy/Sell Long‐run Buy/Sell Signal 1 Signal 3
12/2/2020 12/2/202012/1/2020 12/1/2020 213.01 No Action Buy
11/23/2020 11/23/2020 211.53 Sell11/19/2020 11/19/2020 205.67 Sell11/13/2020 11/13/2020 187.11 Sell11/11/2020 11/11/2020 182.15 Sell10/6/2020 10/6/2020 159.54 Sell9/30/2020 9/30/2020 165.26 Sell Buy9/9/2020 9/9/2020 160.78 Sell
8/12/2020 8/12/2020 175.44 Sell Buy8/11/2020 8/11/2020 180.13 Buy7/22/2020 7/22/2020 179.79 Sell7/16/2020 7/16/2020 178.7 Sell7/1/2020 7/1/2020 180.32 Sell Buy
6/29/2020 6/29/2020 194.49 Sell Buy6/24/2020 6/24/2020 176.69 Sell6/19/2020 6/19/2020 187.02 Sell Buy6/18/2020 6/18/2020 192.29 Buy6/17/2020 6/17/2020 192.54 Sell Buy6/12/2020 6/12/2020 189.51 Sell Buy
URL Information Links: https://www.barrons.com/quote/stock/BAhttps://quotes.wsj.com/BA?mod=md_home_hdr_searchhttps://finance.yahoo.com/quote/BA?p=BA&.tsrc=fin‐srch
0
20000000
40000000
60000000
80000000
100000000
120000000
0
50
100
150
200
250
300
350
400
450
The Boeing Co. (BA) Stock Price Time Series Prior to Market Open 12/2/2020: Est. ( L: 209.7, C: 213, H: 225.8 )
current_stock_price: trade_day_252_high: trade_day_252_low: volume: Linear (current_stock_price:)
0
0.2
0.4
0.6
0.8
1
1.2
1.4
The Boeing Co. (BA) Stock Price TRI‐SIGNALS Prior to Market Open 12/2/2020
daily_trend: stock_direction_signal_1: stock_direction_signal_2:
stock_direction_signal_3: Linear (daily_trend:) Linear (stock_direction_signal_1:)
Linear (stock_direction_signal_2:) Linear (stock_direction_signal_3:)
IHA Consultants page 1
TRI-SIG
NAL
Predict
ive Equ
ity Ana
lytics
IHA C
onsu
ltants
Inc.
ihaco
nsult
ants.
com
December 2, 2020 IHA Consultants TRI‐SIGNAL Report for selected DJIA Stocks sorted by Highest Return
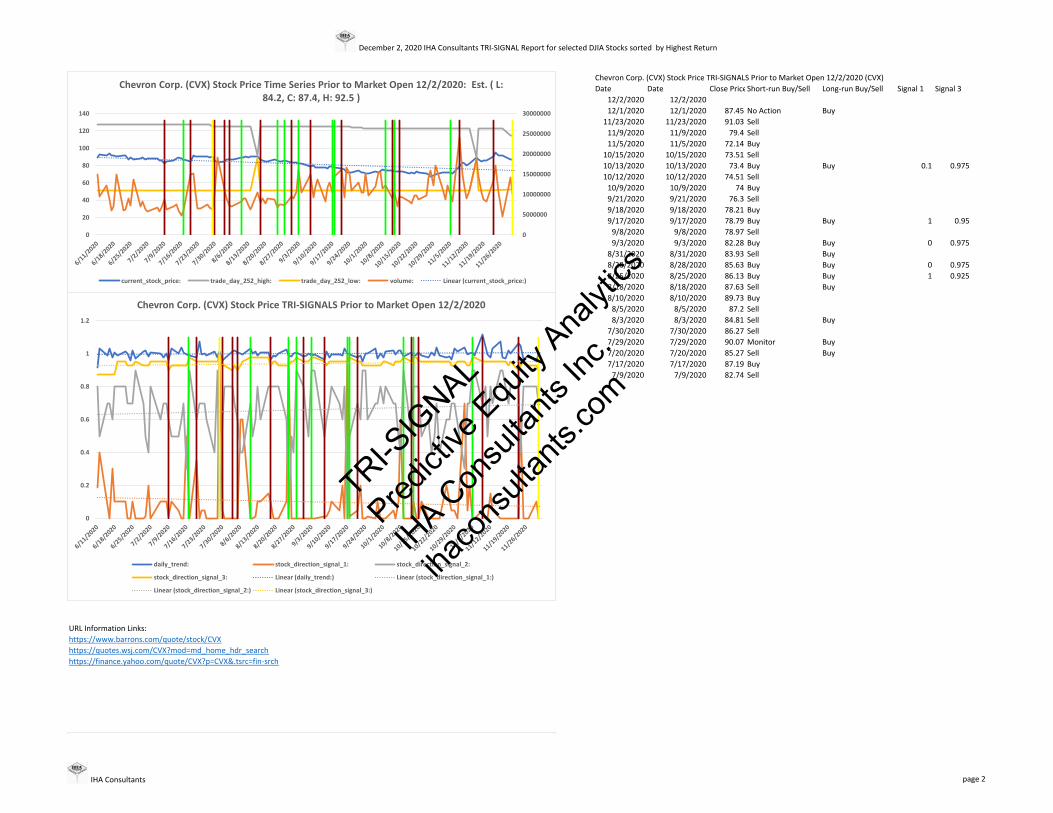
Chevron Corp. (CVX) Stock Price TRI‐SIGNALS Prior to Market Open 12/2/2020 (CVX)Date Date Close PriceShort‐run Buy/Sell Long‐run Buy/Sell Signal 1 Signal 3
12/2/2020 12/2/202012/1/2020 12/1/2020 87.45 No Action Buy
11/23/2020 11/23/2020 91.03 Sell11/9/2020 11/9/2020 79.4 Sell11/5/2020 11/5/2020 72.14 Buy
10/15/2020 10/15/2020 73.51 Sell10/13/2020 10/13/2020 73.4 Buy Buy 0.1 0.97510/12/2020 10/12/2020 74.51 Sell10/9/2020 10/9/2020 74 Buy9/21/2020 9/21/2020 76.3 Sell9/18/2020 9/18/2020 78.21 Buy9/17/2020 9/17/2020 78.79 Buy Buy 1 0.959/8/2020 9/8/2020 78.97 Sell9/3/2020 9/3/2020 82.28 Buy Buy 0 0.975
8/31/2020 8/31/2020 83.93 Sell Buy8/28/2020 8/28/2020 85.63 Buy Buy 0 0.9758/25/2020 8/25/2020 86.13 Buy Buy 1 0.9258/18/2020 8/18/2020 87.63 Sell Buy8/10/2020 8/10/2020 89.73 Buy8/5/2020 8/5/2020 87.2 Sell8/3/2020 8/3/2020 84.81 Sell Buy
7/30/2020 7/30/2020 86.27 Sell7/29/2020 7/29/2020 90.07 Monitor Buy7/20/2020 7/20/2020 85.27 Sell Buy7/17/2020 7/17/2020 87.19 Buy7/9/2020 7/9/2020 82.74 Sell
URL Information Links: https://www.barrons.com/quote/stock/CVXhttps://quotes.wsj.com/CVX?mod=md_home_hdr_searchhttps://finance.yahoo.com/quote/CVX?p=CVX&.tsrc=fin‐srch
0
5000000
10000000
15000000
20000000
25000000
30000000
0
20
40
60
80
100
120
140
Chevron Corp. (CVX) Stock Price Time Series Prior to Market Open 12/2/2020: Est. ( L: 84.2, C: 87.4, H: 92.5 )
current_stock_price: trade_day_252_high: trade_day_252_low: volume: Linear (current_stock_price:)
0
0.2
0.4
0.6
0.8
1
1.2
Chevron Corp. (CVX) Stock Price TRI‐SIGNALS Prior to Market Open 12/2/2020
daily_trend: stock_direction_signal_1: stock_direction_signal_2:
stock_direction_signal_3: Linear (daily_trend:) Linear (stock_direction_signal_1:)
Linear (stock_direction_signal_2:) Linear (stock_direction_signal_3:)
IHA Consultants page 2
TRI-SIG
NAL
Predict
ive Equ
ity Ana
lytics
IHA C
onsu
ltants
Inc.
ihaco
nsult
ants.
com

December 2, 2020 IHA Consultants TRI‐SIGNAL Report for selected DJIA Stocks sorted by Highest Return
Exxon Mobil Corp. (XOM) Stock Price TRI‐SIGNALS Prior to Market Open 12/2/2020 (XOM)Date Date Close PriceShort‐run Buy/Sell Long‐run Buy/Sell Signal 1 Signal 3
12/2/2020 12/2/202012/1/2020 12/1/2020 38.5 No Action Buy
11/30/2020 11/30/2020 38.13 Sell10/21/2020 10/21/2020 33.16 Buy Buy 0.1 0.9510/20/2020 10/20/2020 33.7 Buy Buy 0 0.97510/19/2020 10/19/2020 33.42 Buy Buy 0 0.9510/16/2020 10/16/2020 34.1 Buy Buy 1 0.97510/15/2020 10/15/2020 34.45 Sell10/13/2020 10/13/2020 34.22 Buy Buy 0 0.97510/8/2020 10/8/2020 35.26 Buy Buy 1 0.9259/9/2020 9/9/2020 37.95 Sell9/8/2020 9/8/2020 38.18 Sell Buy
8/25/2020 8/25/2020 40.88 Sell8/21/2020 8/21/2020 41.01 Buy Buy 0.1 0.9758/12/2020 8/12/2020 44.09 Sell8/7/2020 8/7/2020 43.44 Buy8/5/2020 8/5/2020 43.85 Sell
7/29/2020 7/29/2020 44.03 Buy Buy 1 0.957/1/2020 7/1/2020 43.71 Sell Buy
6/26/2020 6/26/2020 43.62 Sell
URL Information Links: https://www.barrons.com/quote/stock/XOMhttps://quotes.wsj.com/XOM?mod=md_home_hdr_searchhttps://finance.yahoo.com/quote/XOM?p=XOM&.tsrc=fin‐srch
0
10000000
20000000
30000000
40000000
50000000
60000000
70000000
80000000
90000000
0
10
20
30
40
50
60
70
80
90
Exxon Mobil Corp. (XOM) Stock Price Time Series Prior to Market Open 12/2/2020: Est. ( L: 37.2, C: 38.5, H: 40.7 )
current_stock_price: trade_day_252_high: trade_day_252_low: volume: Linear (current_stock_price:)
0
0.2
0.4
0.6
0.8
1
1.2
Exxon Mobil Corp. (XOM) Stock Price TRI‐SIGNALS Prior to Market Open 12/2/2020
daily_trend: stock_direction_signal_1: stock_direction_signal_2:
stock_direction_signal_3: Linear (daily_trend:) Linear (stock_direction_signal_1:)
Linear (stock_direction_signal_2:) Linear (stock_direction_signal_3:)
IHA Consultants page 3
TRI-SIG
NAL
Predict
ive Equ
ity Ana
lytics
IHA C
onsu
ltants
Inc.
ihaco
nsult
ants.
com

December 2, 2020 IHA Consultants TRI‐SIGNAL Report for selected DJIA Stocks sorted by Highest Return
3M Co. (MMM) Stock Price TRI‐SIGNALS Prior to Market Open 12/2/2020 (MMM)Date Date Close PriceShort‐run Buy/Sell Long‐run Buy/Sell Signal 1 Signal 3
12/2/2020 12/2/202012/1/2020 12/1/2020 170.52 No Action Buy
11/30/2020 11/30/2020 172.73 Sell Buy11/25/2020 11/25/2020 177.12 Buy Buy 1 0.97511/20/2020 11/20/2020 172.89 Buy Buy 0.1 0.97511/19/2020 11/19/2020 171.61 Sell11/18/2020 11/18/2020 171.4 Buy Buy 0.1 0.97511/16/2020 11/16/2020 173.86 Sell11/12/2020 11/12/2020 167.05 Buy11/3/2020 11/3/2020 165.51 Buy Buy 1 0.9511/2/2020 11/2/2020 162.94 Buy Buy 1 0.95
10/26/2020 10/26/2020 166.16 Sell Buy10/21/2020 10/21/2020 169.17 Buy10/20/2020 10/20/2020 170.95 Sell10/9/2020 10/9/2020 169.3 Buy10/8/2020 10/8/2020 167.71 Sell Buy9/29/2020 9/29/2020 159.81 Buy9/22/2020 9/22/2020 162.34 Sell9/17/2020 9/17/2020 172.38 Sell Buy9/14/2020 9/14/2020 168.46 Buy Buy 0.1 0.9759/8/2020 9/8/2020 163.17 Sell Buy9/4/2020 9/4/2020 165.77 Buy9/3/2020 9/3/2020 166.31 Sell9/1/2020 9/1/2020 164.8 Buy Buy 1 1
8/25/2020 8/25/2020 163.1 Buy Buy 0.9 18/7/2020 8/7/2020 158.33 Buy Buy 1 0.9758/6/2020 8/6/2020 156 Buy Buy 1 0.95
7/30/2020 7/30/2020 152.12 Sell7/20/2020 7/20/2020 156.37 Sell Buy7/17/2020 7/17/2020 159.83 Buy7/16/2020 7/16/2020 160.5 Sell Buy7/15/2020 7/15/2020 159.33 Buy7/14/2020 7/14/2020 158.54 Buy Buy 1 0.957/6/2020 7/6/2020 158.1 Sell7/2/2020 7/2/2020 157.04 Buy
6/24/2020 6/24/2020 152.22 Sell6/19/2020 6/19/2020 158.15 Buy Buy 0.2 0.975
URL Information Links: https://www.barrons.com/quote/stock/MMMhttps://quotes.wsj.com/MMM?mod=md_home_hdr_searchhttps://finance.yahoo.com/quote/MMM?p=MMM&.tsrc=fin‐srch
0
1000000
2000000
3000000
4000000
5000000
6000000
7000000
8000000
9000000
0
50
100
150
200
250
3M Co. (MMM) Stock Price Time Series Prior to Market Open 12/2/2020: Est. ( L: 167.4, C: 170.5, H: 177.7 )
current_stock_price: trade_day_252_high: trade_day_252_low: volume: Linear (current_stock_price:)
0
0.2
0.4
0.6
0.8
1
1.2
3M Co. (MMM) Stock Price TRI‐SIGNALS Prior to Market Open 12/2/2020
daily_trend: stock_direction_signal_1: stock_direction_signal_2:
stock_direction_signal_3: Linear (daily_trend:) Linear (stock_direction_signal_1:)
Linear (stock_direction_signal_2:) Linear (stock_direction_signal_3:)
IHA Consultants page 4
TRI-SIG
NAL
Predict
ive Equ
ity Ana
lytics
IHA C
onsu
ltants
Inc.
ihaco
nsult
ants.
com

December 2, 2020 IHA Consultants TRI‐SIGNAL Report for selected DJIA Stocks sorted by Highest Return
American Express Co. (AXP) Stock Price TRI‐SIGNALS Prior to Market Open 12/2/2020 (AXP)Date Date Close PriceShort‐run Buy/Sell Long‐run Buy/Sell Signal 1 Signal 3
12/2/2020 12/2/202012/1/2020 12/1/2020 119.93 No Action No Action
11/30/2020 11/30/2020 118.59 Sell Buy11/27/2020 11/27/2020 120.59 Buy Buy 0.2 0.97511/16/2020 11/16/2020 118.67 Sell11/11/2020 11/11/2020 111.12 Sell11/9/2020 11/9/2020 117.37 Sell11/5/2020 11/5/2020 98.11 Buy Buy 1 0.97511/4/2020 11/4/2020 96.4 Buy Buy 0.9 0.92511/3/2020 11/3/2020 96.29 Buy Buy 1 0.92511/2/2020 11/2/2020 93.4 Buy Buy 1 0.925
10/29/2020 10/29/2020 91.07 Sell Buy10/21/2020 10/21/2020 101.43 Sell10/20/2020 10/20/2020 103.14 Sell Buy10/16/2020 10/16/2020 104.91 Sell10/14/2020 10/14/2020 104.81 Buy10/6/2020 10/6/2020 101.76 Sell10/1/2020 10/1/2020 101.33 Buy9/30/2020 9/30/2020 100.25 Buy Buy 1 0.959/28/2020 9/28/2020 98.82 Buy Buy 1 0.99/21/2020 9/21/2020 98.17 Sell Buy9/16/2020 9/16/2020 105.98 Buy9/15/2020 9/15/2020 106.68 Buy Buy 1 0.959/9/2020 9/9/2020 103.78 Sell
8/25/2020 8/25/2020 99.05 Buy Buy 1 0.9758/24/2020 8/24/2020 99.33 Buy Buy 0.9 0.958/20/2020 8/20/2020 96.72 Sell8/19/2020 8/19/2020 96.89 Sell Buy8/12/2020 8/12/2020 101.68 Sell Buy8/10/2020 8/10/2020 101.62 Buy Buy 0.6 0.9758/6/2020 8/6/2020 95.92 Buy Buy 1 0.958/5/2020 8/5/2020 95.39 Sell8/4/2020 8/4/2020 93.19 Buy8/3/2020 8/3/2020 93.54 Sell Buy
7/31/2020 7/31/2020 93.32 Buy7/29/2020 7/29/2020 96.69 Sell7/28/2020 7/28/2020 94.42 Buy Buy 0 0.9757/24/2020 7/24/2020 95.33 Sell7/17/2020 7/17/2020 95.18 Buy7/14/2020 7/14/2020 94.84 Buy Buy 1 0.9257/2/2020 7/2/2020 94.33 Sell Buy
6/26/2020 6/26/2020 93.42 Sell6/24/2020 6/24/2020 95.48 Sell Buy
URL Information Links: https://www.barrons.com/quote/stock/AXPhttps://quotes.wsj.com/AXP?mod=md_home_hdr_searchhttps://finance.yahoo.com/quote/AXP?p=AXP&.tsrc=fin‐srch
0
2000000
4000000
6000000
8000000
10000000
12000000
14000000
16000000
18000000
20000000
0
20
40
60
80
100
120
140
160
American Express Co. (AXP) Stock Price Time Series Prior to Market Open 12/2/2020: Est. ( L: 118.2, C: 119.9, H: 124.1 )
current_stock_price: trade_day_252_high: trade_day_252_low: volume: Linear (current_stock_price:)
0
0.2
0.4
0.6
0.8
1
1.2
1.4
American Express Co. (AXP) Stock Price TRI‐SIGNALS Prior to Market Open 12/2/2020
daily_trend: stock_direction_signal_1: stock_direction_signal_2:
stock_direction_signal_3: Linear (daily_trend:) Linear (stock_direction_signal_1:)
Linear (stock_direction_signal_2:) Linear (stock_direction_signal_3:)
IHA Consultants page 5
TRI-SIG
NAL
Predict
ive Equ
ity Ana
lytics
IHA C
onsu
ltants
Inc.
ihaco
nsult
ants.
com

December 2, 2020 IHA Consultants TRI‐SIGNAL Report for selected DJIA Stocks sorted by Highest Return
Apple Inc. (AAPL) Stock Price TRI‐SIGNALS Prior to Market Open 12/2/2020 (AAPL)Date Date Close PriceShort‐run Buy/Sell Long‐run Buy/Sell Signal 1 Signal 3
12/2/2020 12/2/202012/1/2020 12/1/2020 122.72 No Action Buy
11/23/2020 11/23/2020 113.85 Sell Buy11/17/2020 11/17/2020 119.39 Buy11/2/2020 11/2/2020 108.77 Sell Buy
10/28/2020 10/28/2020 111.2 Sell10/27/2020 10/27/2020 116.6 Buy Buy 0.1 0.97510/13/2020 10/13/2020 121.1 Sell10/2/2020 10/2/2020 113.02 Sell10/1/2020 10/1/2020 116.79 Buy9/28/2020 9/28/2020 114.96 Sell9/9/2020 9/9/2020 117.32 Sell
8/31/2020 8/31/2020 129.04 No Action8/28/2020 8/28/2020 499.23 Sell8/24/2020 8/24/2020 503.43 No Action Buy8/21/2020 8/21/2020 497.48 No Action Buy8/19/2020 8/19/2020 462.83 No Action Buy8/7/2020 8/7/2020 444.45 Sell8/5/2020 8/5/2020 440.25 No Action
7/30/2020 7/30/2020 384.76 Sell Buy7/24/2020 7/24/2020 370.46 Sell Buy7/23/2020 7/23/2020 371.38 Sell7/22/2020 7/22/2020 389.09 Buy7/21/2020 7/21/2020 388 Sell7/7/2020 7/7/2020 372.69 No Action
6/24/2020 6/24/2020 360.06 Sell6/19/2020 6/19/2020 349.72 No Action6/17/2020 6/17/2020 351.59 Sell6/12/2020 6/12/2020 338.8 Sell
URL Information Links: https://www.barrons.com/quote/stock/AAPLhttps://quotes.wsj.com/AAPL?mod=md_home_hdr_searchhttps://finance.yahoo.com/quote/AAPL?p=AAPL&.tsrc=fin‐srch
0
50000000
100000000
150000000
200000000
250000000
300000000
350000000
0
100
200
300
400
500
600
Apple Inc. (AAPL) Stock Price Time Series Prior to Market Open 12/2/2020: Est. ( L: 115, C: 122.7, H: 126.5 )
current_stock_price: trade_day_252_high: trade_day_252_low: volume: Linear (current_stock_price:)
0
0.2
0.4
0.6
0.8
1
1.2
Apple Inc. (AAPL) Stock Price TRI‐SIGNALS Prior to Market Open 12/2/2020
daily_trend: stock_direction_signal_1: stock_direction_signal_2:
stock_direction_signal_3: Linear (daily_trend:) Linear (stock_direction_signal_1:)
Linear (stock_direction_signal_2:) Linear (stock_direction_signal_3:)
IHA Consultants page 6
TRI-SIG
NAL
Predict
ive Equ
ity Ana
lytics
IHA C
onsu
ltants
Inc.
ihaco
nsult
ants.
com
December 2, 2020 IHA Consultants TRI‐SIGNAL Report for selected DJIA Stocks sorted by Highest Return
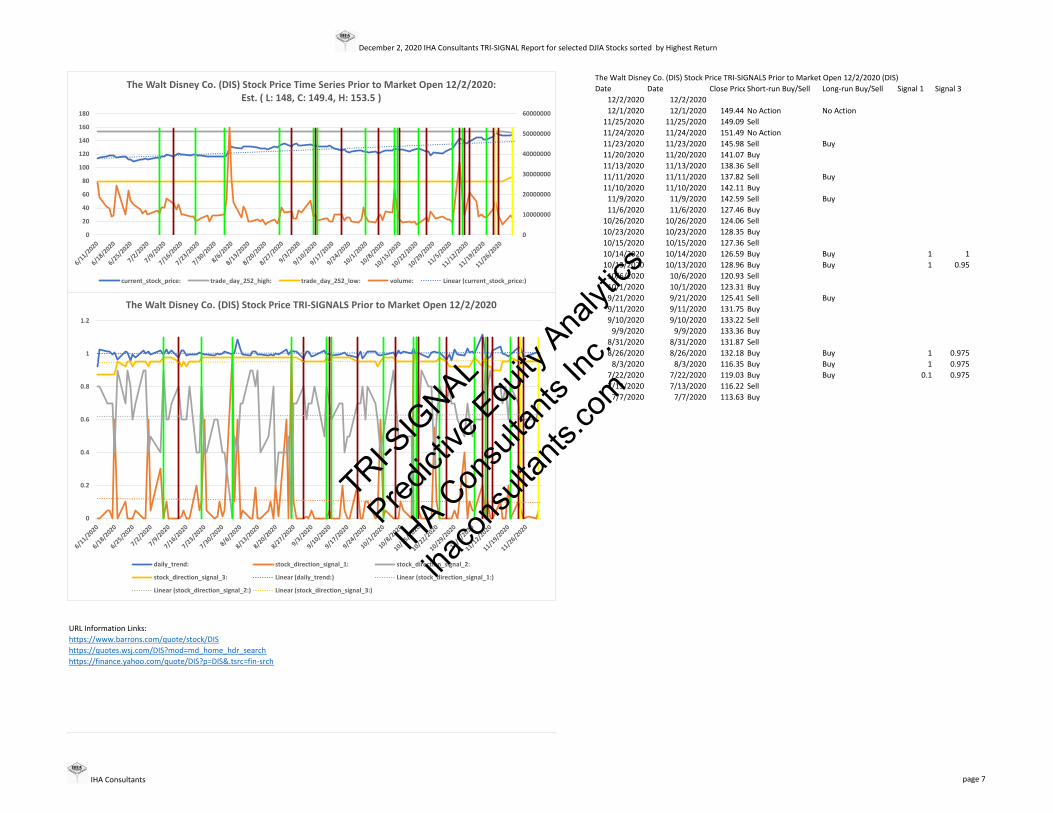
The Walt Disney Co. (DIS) Stock Price TRI‐SIGNALS Prior to Market Open 12/2/2020 (DIS)Date Date Close PriceShort‐run Buy/Sell Long‐run Buy/Sell Signal 1 Signal 3
12/2/2020 12/2/202012/1/2020 12/1/2020 149.44 No Action No Action
11/25/2020 11/25/2020 149.09 Sell11/24/2020 11/24/2020 151.49 No Action11/23/2020 11/23/2020 145.98 Sell Buy11/20/2020 11/20/2020 141.07 Buy11/13/2020 11/13/2020 138.36 Sell11/11/2020 11/11/2020 137.82 Sell Buy11/10/2020 11/10/2020 142.11 Buy11/9/2020 11/9/2020 142.59 Sell Buy11/6/2020 11/6/2020 127.46 Buy
10/26/2020 10/26/2020 124.06 Sell10/23/2020 10/23/2020 128.35 Buy10/15/2020 10/15/2020 127.36 Sell10/14/2020 10/14/2020 126.59 Buy Buy 1 110/13/2020 10/13/2020 128.96 Buy Buy 1 0.9510/6/2020 10/6/2020 120.93 Sell10/1/2020 10/1/2020 123.31 Buy9/21/2020 9/21/2020 125.41 Sell Buy9/11/2020 9/11/2020 131.75 Buy9/10/2020 9/10/2020 133.22 Sell9/9/2020 9/9/2020 133.36 Buy
8/31/2020 8/31/2020 131.87 Sell8/26/2020 8/26/2020 132.18 Buy Buy 1 0.9758/3/2020 8/3/2020 116.35 Buy Buy 1 0.975
7/22/2020 7/22/2020 119.03 Buy Buy 0.1 0.9757/13/2020 7/13/2020 116.22 Sell7/7/2020 7/7/2020 113.63 Buy
URL Information Links: https://www.barrons.com/quote/stock/DIShttps://quotes.wsj.com/DIS?mod=md_home_hdr_searchhttps://finance.yahoo.com/quote/DIS?p=DIS&.tsrc=fin‐srch
0
10000000
20000000
30000000
40000000
50000000
60000000
0
20
40
60
80
100
120
140
160
180
The Walt Disney Co. (DIS) Stock Price Time Series Prior to Market Open 12/2/2020: Est. ( L: 148, C: 149.4, H: 153.5 )
current_stock_price: trade_day_252_high: trade_day_252_low: volume: Linear (current_stock_price:)
0
0.2
0.4
0.6
0.8
1
1.2
The Walt Disney Co. (DIS) Stock Price TRI‐SIGNALS Prior to Market Open 12/2/2020
daily_trend: stock_direction_signal_1: stock_direction_signal_2:
stock_direction_signal_3: Linear (daily_trend:) Linear (stock_direction_signal_1:)
Linear (stock_direction_signal_2:) Linear (stock_direction_signal_3:)
IHA Consultants page 7
TRI-SIG
NAL
Predict
ive Equ
ity Ana
lytics
IHA C
onsu
ltants
Inc.
ihaco
nsult
ants.
com
December 2, 2020 IHA Consultants TRI‐SIGNAL Report for selected DJIA Stocks sorted by Highest Return
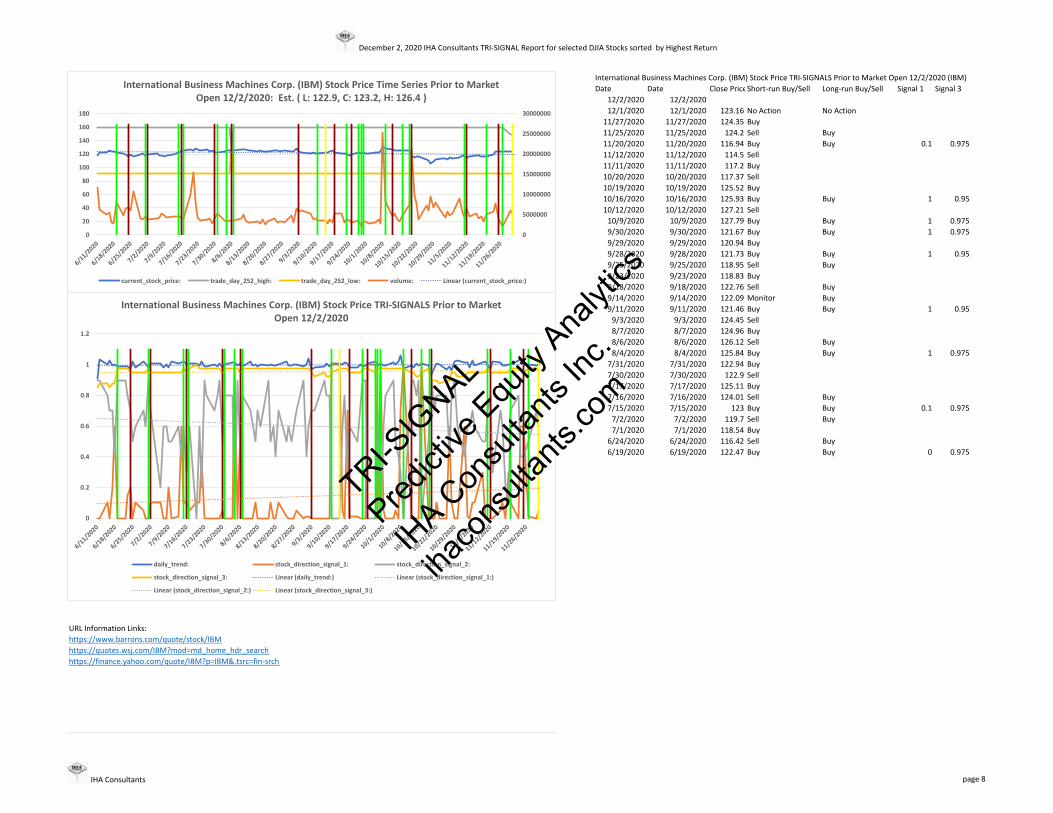
International Business Machines Corp. (IBM) Stock Price TRI‐SIGNALS Prior to Market Open 12/2/2020 (IBM)Date Date Close PriceShort‐run Buy/Sell Long‐run Buy/Sell Signal 1 Signal 3
12/2/2020 12/2/202012/1/2020 12/1/2020 123.16 No Action No Action
11/27/2020 11/27/2020 124.35 Buy11/25/2020 11/25/2020 124.2 Sell Buy11/20/2020 11/20/2020 116.94 Buy Buy 0.1 0.97511/12/2020 11/12/2020 114.5 Sell11/11/2020 11/11/2020 117.2 Buy10/20/2020 10/20/2020 117.37 Sell10/19/2020 10/19/2020 125.52 Buy10/16/2020 10/16/2020 125.93 Buy Buy 1 0.9510/12/2020 10/12/2020 127.21 Sell10/9/2020 10/9/2020 127.79 Buy Buy 1 0.9759/30/2020 9/30/2020 121.67 Buy Buy 1 0.9759/29/2020 9/29/2020 120.94 Buy9/28/2020 9/28/2020 121.73 Buy Buy 1 0.959/25/2020 9/25/2020 118.95 Sell Buy9/23/2020 9/23/2020 118.83 Buy9/18/2020 9/18/2020 122.76 Sell Buy9/14/2020 9/14/2020 122.09 Monitor Buy9/11/2020 9/11/2020 121.46 Buy Buy 1 0.959/3/2020 9/3/2020 124.45 Sell8/7/2020 8/7/2020 124.96 Buy8/6/2020 8/6/2020 126.12 Sell Buy8/4/2020 8/4/2020 125.84 Buy Buy 1 0.975
7/31/2020 7/31/2020 122.94 Buy7/30/2020 7/30/2020 122.9 Sell7/17/2020 7/17/2020 125.11 Buy7/16/2020 7/16/2020 124.01 Sell Buy7/15/2020 7/15/2020 123 Buy Buy 0.1 0.9757/2/2020 7/2/2020 119.7 Sell Buy7/1/2020 7/1/2020 118.54 Buy
6/24/2020 6/24/2020 116.42 Sell Buy6/19/2020 6/19/2020 122.47 Buy Buy 0 0.975
URL Information Links: https://www.barrons.com/quote/stock/IBMhttps://quotes.wsj.com/IBM?mod=md_home_hdr_searchhttps://finance.yahoo.com/quote/IBM?p=IBM&.tsrc=fin‐srch
0
5000000
10000000
15000000
20000000
25000000
30000000
0
20
40
60
80
100
120
140
160
180
International Business Machines Corp. (IBM) Stock Price Time Series Prior to Market Open 12/2/2020: Est. ( L: 122.9, C: 123.2, H: 126.4 )
current_stock_price: trade_day_252_high: trade_day_252_low: volume: Linear (current_stock_price:)
0
0.2
0.4
0.6
0.8
1
1.2
International Business Machines Corp. (IBM) Stock Price TRI‐SIGNALS Prior to Market Open 12/2/2020
daily_trend: stock_direction_signal_1: stock_direction_signal_2:
stock_direction_signal_3: Linear (daily_trend:) Linear (stock_direction_signal_1:)
Linear (stock_direction_signal_2:) Linear (stock_direction_signal_3:)
IHA Consultants page 8
TRI-SIG
NAL
Predict
ive Equ
ity Ana
lytics
IHA C
onsu
ltants
Inc.
ihaco
nsult
ants.
com

December 2, 2020 IHA Consultants TRI‐SIGNAL Report for selected DJIA Stocks sorted by Highest Return
Pfizer Inc. (PFE) Stock Price TRI‐SIGNALS Prior to Market Open 12/2/2020 (PFE)Date Date Close PriceShort‐run Buy/Sell Long‐run Buy/Sell Signal 1 Signal 3
12/2/2020 12/2/202012/1/2020 12/1/2020 39.41 No Action Buy
11/25/2020 11/25/2020 36.53 Buy11/2/2020 11/2/2020 36.23 Sell
10/28/2020 10/28/2020 35.45 Sell10/8/2020 10/8/2020 36.89 Buy10/7/2020 10/7/2020 36.47 Sell9/28/2020 9/28/2020 36.39 Buy Buy 1 0.9759/18/2020 9/18/2020 36.63 Buy9/17/2020 9/17/2020 36.82 Sell9/16/2020 9/16/2020 36.78 Buy9/15/2020 9/15/2020 36.96 Sell9/11/2020 9/11/2020 36.07 Buy Buy 0.8 0.9759/1/2020 9/1/2020 36.88 Sell
7/31/2020 7/31/2020 38.48 Buy7/24/2020 7/24/2020 37.66 Sell Buy7/15/2020 7/15/2020 35.72 Buy Buy 1 0.9757/14/2020 7/14/2020 35.23 Buy Buy 1 0.957/8/2020 7/8/2020 33.75 Buy Buy 0.1 0.9757/7/2020 7/7/2020 34.03 Sell7/2/2020 7/2/2020 34.51 Buy7/1/2020 7/1/2020 33.74 Sell Buy
6/19/2020 6/19/2020 33.42 Buy Buy 0 0.975
URL Information Links: https://www.barrons.com/quote/stock/PFEhttps://quotes.wsj.com/PFE?mod=md_home_hdr_searchhttps://finance.yahoo.com/quote/PFE?p=PFE&.tsrc=fin‐srch
0
50000000
100000000
150000000
200000000
250000000
0
10
20
30
40
50
60
Pfizer Inc. (PFE) Stock Price Time Series Prior to Market Open 12/2/2020: Est. ( L: 36.9, C: 39.4, H: 40.2 )
current_stock_price: trade_day_252_high: trade_day_252_low: volume: Linear (current_stock_price:)
0
0.2
0.4
0.6
0.8
1
1.2
Pfizer Inc. (PFE) Stock Price TRI‐SIGNALS Prior to Market Open 12/2/2020
daily_trend: stock_direction_signal_1: stock_direction_signal_2:
stock_direction_signal_3: Linear (daily_trend:) Linear (stock_direction_signal_1:)
Linear (stock_direction_signal_2:) Linear (stock_direction_signal_3:)
IHA Consultants page 9
TRI-SIG
NAL
Predict
ive Equ
ity Ana
lytics
IHA C
onsu
ltants
Inc.
ihaco
nsult
ants.
com

December 2, 2020 IHA Consultants TRI‐SIGNAL Report for selected DJIA Stocks sorted by Highest Return
UnitedHealth Group Inc. (UNH) Stock Price TRI‐SIGNALS Prior to Market Open 12/2/2020 (UNH)Date Date Close PriceShort‐run Buy/Sell Long‐run Buy/Sell Signal 1 Signal 3
12/2/2020 12/2/202012/1/2020 12/1/2020 341.19 No Action No Action
11/30/2020 11/30/2020 336.34 Buy11/18/2020 11/18/2020 344.51 Sell Buy11/12/2020 11/12/2020 354.41 Buy11/4/2020 11/4/2020 354.56 No Action Buy
10/26/2020 10/26/2020 323.06 Sell10/23/2020 10/23/2020 330.6 No Action10/14/2020 10/14/2020 321.85 Sell10/13/2020 10/13/2020 331.42 No Action10/12/2020 10/12/2020 329.97 Sell10/7/2020 10/7/2020 323.17 No Action Buy10/6/2020 10/6/2020 314.45 Sell9/30/2020 9/30/2020 311.77 Buy Buy 0.1 0.9759/29/2020 9/29/2020 304.15 Buy Buy 1 0.959/28/2020 9/28/2020 303.23 Buy Buy 1 0.959/21/2020 9/21/2020 299.19 Sell Buy9/18/2020 9/18/2020 308.02 Buy9/10/2020 9/10/2020 304.6 Buy Buy 0.1 0.959/3/2020 9/3/2020 316.23 Buy9/2/2020 9/2/2020 320.24 Sell Buy9/1/2020 9/1/2020 312.83 Buy
8/31/2020 8/31/2020 312.55 Sell8/28/2020 8/28/2020 314.37 Buy8/27/2020 8/27/2020 311.67 Sell8/25/2020 8/25/2020 312.22 Buy Buy 0.8 0.9758/24/2020 8/24/2020 308.84 Sell8/7/2020 8/7/2020 317.03 No Action Buy8/6/2020 8/6/2020 314.06 No Action Buy
7/30/2020 7/30/2020 305.23 Buy Buy 1 0.9757/23/2020 7/23/2020 302.97 Buy7/22/2020 7/22/2020 306.71 Sell7/17/2020 7/17/2020 306.53 Buy6/24/2020 6/24/2020 289.18 Sell Buy6/19/2020 6/19/2020 291.24 Buy Buy 0.1 0.975
URL Information Links: https://www.barrons.com/quote/stock/UNHhttps://quotes.wsj.com/UNH?mod=md_home_hdr_searchhttps://finance.yahoo.com/quote/UNH?p=UNH&.tsrc=fin‐srch
0
2000000
4000000
6000000
8000000
10000000
12000000
0
50
100
150
200
250
300
350
400
UnitedHealth Group Inc. (UNH) Stock Price Time Series Prior to Market Open 12/2/2020: Est. ( L: 337.7, C: 341.2, H: 347.2 )
current_stock_price: trade_day_252_high: trade_day_252_low: volume: Linear (current_stock_price:)
0
0.2
0.4
0.6
0.8
1
1.2
UnitedHealth Group Inc. (UNH) Stock Price TRI‐SIGNALS Prior to Market Open 12/2/2020
daily_trend: stock_direction_signal_1: stock_direction_signal_2:
stock_direction_signal_3: Linear (daily_trend:) Linear (stock_direction_signal_1:)
Linear (stock_direction_signal_2:) Linear (stock_direction_signal_3:)
IHA Consultants page 10
TRI-SIG
NAL
Predict
ive Equ
ity Ana
lytics
IHA C
onsu
ltants
Inc.
ihaco
nsult
ants.
com
December 2, 2020 IHA Consultants TRI‐SIGNAL Report for selected DJIA Stocks sorted by Highest Return
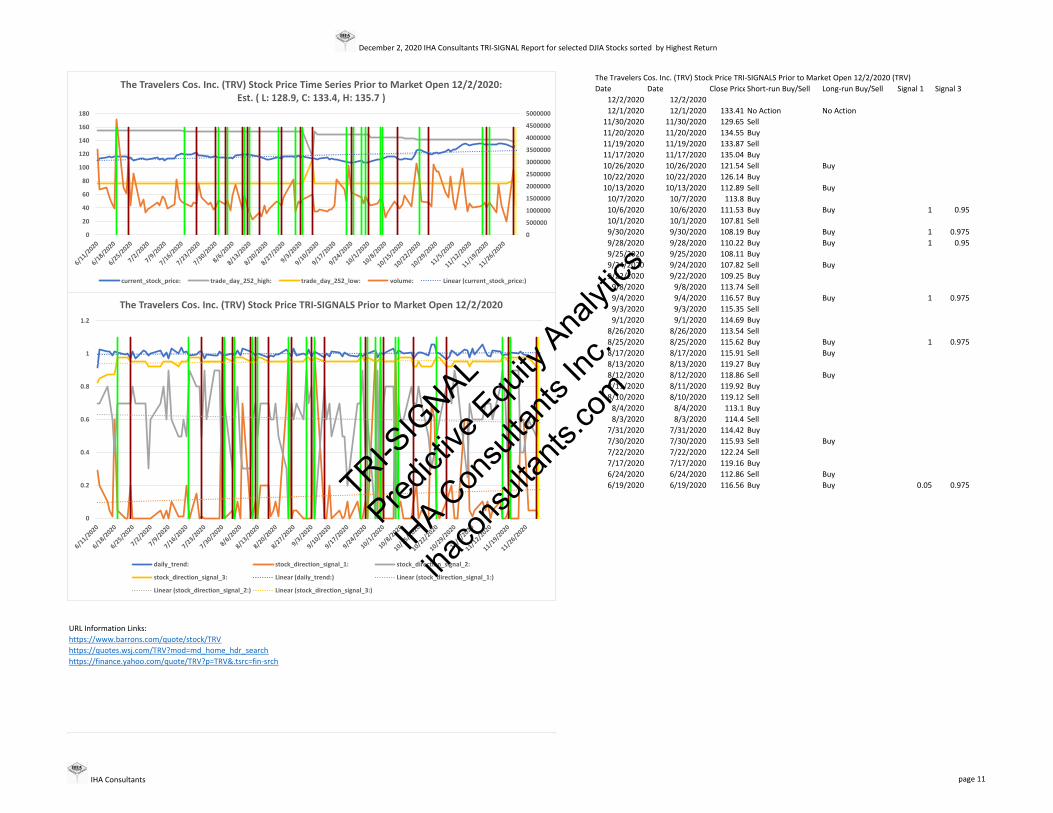
The Travelers Cos. Inc. (TRV) Stock Price TRI‐SIGNALS Prior to Market Open 12/2/2020 (TRV)Date Date Close PriceShort‐run Buy/Sell Long‐run Buy/Sell Signal 1 Signal 3
12/2/2020 12/2/202012/1/2020 12/1/2020 133.41 No Action No Action
11/30/2020 11/30/2020 129.65 Sell11/20/2020 11/20/2020 134.55 Buy11/19/2020 11/19/2020 133.87 Sell11/17/2020 11/17/2020 135.04 Buy10/26/2020 10/26/2020 121.54 Sell Buy10/22/2020 10/22/2020 126.14 Buy10/13/2020 10/13/2020 112.89 Sell Buy10/7/2020 10/7/2020 113.8 Buy10/6/2020 10/6/2020 111.53 Buy Buy 1 0.9510/1/2020 10/1/2020 107.81 Sell9/30/2020 9/30/2020 108.19 Buy Buy 1 0.9759/28/2020 9/28/2020 110.22 Buy Buy 1 0.959/25/2020 9/25/2020 108.11 Buy9/24/2020 9/24/2020 107.82 Sell Buy9/22/2020 9/22/2020 109.25 Buy9/8/2020 9/8/2020 113.74 Sell9/4/2020 9/4/2020 116.57 Buy Buy 1 0.9759/3/2020 9/3/2020 115.35 Sell9/1/2020 9/1/2020 114.69 Buy
8/26/2020 8/26/2020 113.54 Sell8/25/2020 8/25/2020 115.62 Buy Buy 1 0.9758/17/2020 8/17/2020 115.91 Sell Buy8/13/2020 8/13/2020 119.27 Buy8/12/2020 8/12/2020 118.86 Sell Buy8/11/2020 8/11/2020 119.92 Buy8/10/2020 8/10/2020 119.12 Sell8/4/2020 8/4/2020 113.1 Buy8/3/2020 8/3/2020 114.4 Sell
7/31/2020 7/31/2020 114.42 Buy7/30/2020 7/30/2020 115.93 Sell Buy7/22/2020 7/22/2020 122.24 Sell7/17/2020 7/17/2020 119.16 Buy6/24/2020 6/24/2020 112.86 Sell Buy6/19/2020 6/19/2020 116.56 Buy Buy 0.05 0.975
URL Information Links: https://www.barrons.com/quote/stock/TRVhttps://quotes.wsj.com/TRV?mod=md_home_hdr_searchhttps://finance.yahoo.com/quote/TRV?p=TRV&.tsrc=fin‐srch
0
500000
1000000
1500000
2000000
2500000
3000000
3500000
4000000
4500000
5000000
0
20
40
60
80
100
120
140
160
180
The Travelers Cos. Inc. (TRV) Stock Price Time Series Prior to Market Open 12/2/2020: Est. ( L: 128.9, C: 133.4, H: 135.7 )
current_stock_price: trade_day_252_high: trade_day_252_low: volume: Linear (current_stock_price:)
0
0.2
0.4
0.6
0.8
1
1.2
The Travelers Cos. Inc. (TRV) Stock Price TRI‐SIGNALS Prior to Market Open 12/2/2020
daily_trend: stock_direction_signal_1: stock_direction_signal_2:
stock_direction_signal_3: Linear (daily_trend:) Linear (stock_direction_signal_1:)
Linear (stock_direction_signal_2:) Linear (stock_direction_signal_3:)
IHA Consultants page 11
TRI-SIG
NAL
Predict
ive Equ
ity Ana
lytics
IHA C
onsu
ltants
Inc.
ihaco
nsult
ants.
com
December 2, 2020 IHA Consultants TRI‐SIGNAL Report for selected DJIA Stocks sorted by Highest Return
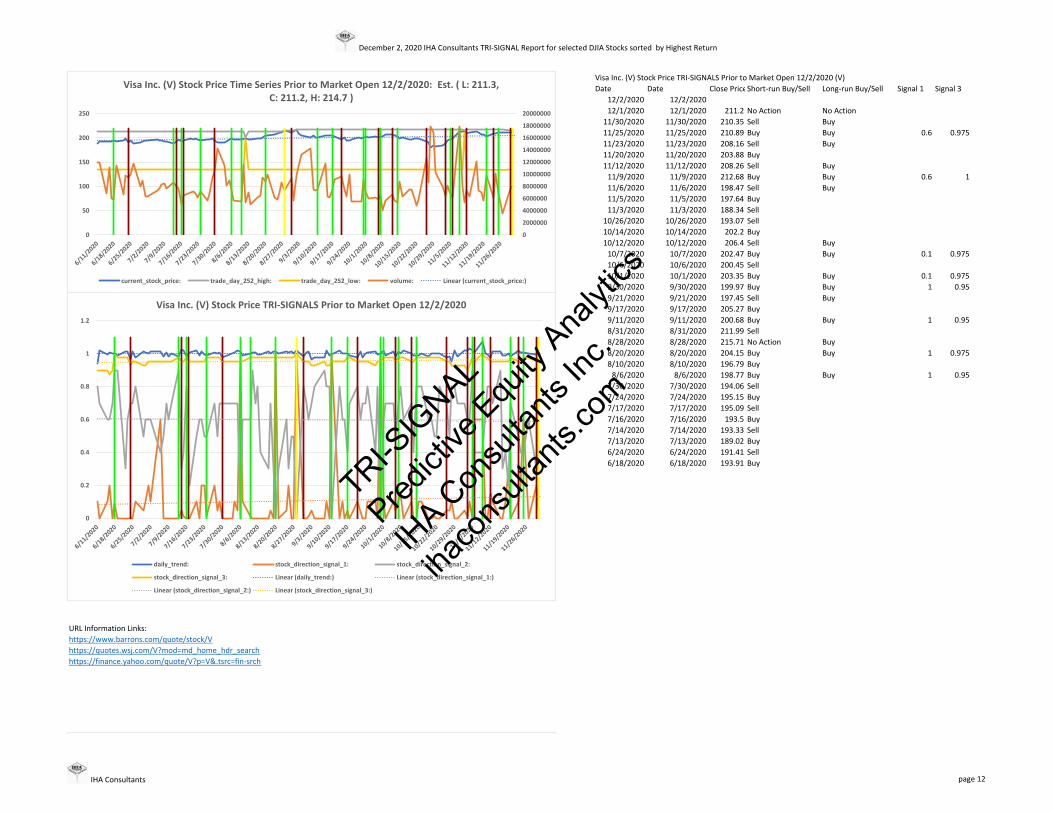
Visa Inc. (V) Stock Price TRI‐SIGNALS Prior to Market Open 12/2/2020 (V)Date Date Close PriceShort‐run Buy/Sell Long‐run Buy/Sell Signal 1 Signal 3
12/2/2020 12/2/202012/1/2020 12/1/2020 211.2 No Action No Action
11/30/2020 11/30/2020 210.35 Sell Buy11/25/2020 11/25/2020 210.89 Buy Buy 0.6 0.97511/23/2020 11/23/2020 208.16 Sell Buy11/20/2020 11/20/2020 203.88 Buy11/12/2020 11/12/2020 208.26 Sell Buy11/9/2020 11/9/2020 212.68 Buy Buy 0.6 111/6/2020 11/6/2020 198.47 Sell Buy11/5/2020 11/5/2020 197.64 Buy11/3/2020 11/3/2020 188.34 Sell
10/26/2020 10/26/2020 193.07 Sell10/14/2020 10/14/2020 202.2 Buy10/12/2020 10/12/2020 206.4 Sell Buy10/7/2020 10/7/2020 202.47 Buy Buy 0.1 0.97510/6/2020 10/6/2020 200.45 Sell10/1/2020 10/1/2020 203.35 Buy Buy 0.1 0.9759/30/2020 9/30/2020 199.97 Buy Buy 1 0.959/21/2020 9/21/2020 197.45 Sell Buy9/17/2020 9/17/2020 205.27 Buy9/11/2020 9/11/2020 200.68 Buy Buy 1 0.958/31/2020 8/31/2020 211.99 Sell8/28/2020 8/28/2020 215.71 No Action Buy8/20/2020 8/20/2020 204.15 Buy Buy 1 0.9758/10/2020 8/10/2020 196.79 Buy8/6/2020 8/6/2020 198.77 Buy Buy 1 0.95
7/30/2020 7/30/2020 194.06 Sell7/24/2020 7/24/2020 195.15 Buy7/17/2020 7/17/2020 195.09 Sell7/16/2020 7/16/2020 193.5 Buy7/14/2020 7/14/2020 193.33 Sell7/13/2020 7/13/2020 189.02 Buy6/24/2020 6/24/2020 191.41 Sell6/18/2020 6/18/2020 193.91 Buy
URL Information Links: https://www.barrons.com/quote/stock/Vhttps://quotes.wsj.com/V?mod=md_home_hdr_searchhttps://finance.yahoo.com/quote/V?p=V&.tsrc=fin‐srch
0
2000000
4000000
6000000
8000000
10000000
12000000
14000000
16000000
18000000
20000000
0
50
100
150
200
250
Visa Inc. (V) Stock Price Time Series Prior to Market Open 12/2/2020: Est. ( L: 211.3, C: 211.2, H: 214.7 )
current_stock_price: trade_day_252_high: trade_day_252_low: volume: Linear (current_stock_price:)
0
0.2
0.4
0.6
0.8
1
1.2
Visa Inc. (V) Stock Price TRI‐SIGNALS Prior to Market Open 12/2/2020
daily_trend: stock_direction_signal_1: stock_direction_signal_2:
stock_direction_signal_3: Linear (daily_trend:) Linear (stock_direction_signal_1:)
Linear (stock_direction_signal_2:) Linear (stock_direction_signal_3:)
IHA Consultants page 12
TRI-SIG
NAL
Predict
ive Equ
ity Ana
lytics
IHA C
onsu
ltants
Inc.
ihaco
nsult
ants.
com

December 2, 2020 IHA Consultants TRI‐SIGNAL Report for selected DJIA Stocks sorted by Highest Return
The Coca‐Cola Co. (KO) Stock Price TRI‐SIGNALS Prior to Market Open 12/2/2020 (KO)Date Date Close PriceShort‐run Buy/Sell Long‐run Buy/Sell Signal 1 Signal 3
12/2/2020 12/2/202012/1/2020 12/1/2020 52.04 No Action Buy
11/30/2020 11/30/2020 51.6 Sell11/27/2020 11/27/2020 52.7 Buy Buy 0 0.97511/24/2020 11/24/2020 53.22 Sell11/17/2020 11/17/2020 53.68 Buy11/13/2020 11/13/2020 53.45 Sell11/5/2020 11/5/2020 49.44 Buy Buy 1 1
10/28/2020 10/28/2020 47.96 Sell10/19/2020 10/19/2020 49.62 Buy10/16/2020 10/16/2020 50.03 Sell Buy10/14/2020 10/14/2020 50.12 Buy10/13/2020 10/13/2020 50.22 Sell10/1/2020 10/1/2020 49.18 Buy9/21/2020 9/21/2020 49.09 Sell Buy9/16/2020 9/16/2020 50.79 Buy Buy 0.1 0.9759/8/2020 9/8/2020 49.81 Sell9/4/2020 9/4/2020 51.04 Buy9/3/2020 9/3/2020 50.48 Sell
8/27/2020 8/27/2020 48.23 Buy8/26/2020 8/26/2020 48.16 Buy Buy 1 0.958/25/2020 8/25/2020 47.91 Sell8/24/2020 8/24/2020 47.97 Buy Buy 0.9 18/24/2020 8/24/2020 47.97 Buy Buy 0.9 18/19/2020 8/19/2020 47.37 Sell8/11/2020 8/11/2020 47.93 Buy Buy 0.4 18/10/2020 8/10/2020 47.72 Sell Buy8/7/2020 8/7/2020 47.8 Buy Buy 0.7 0.9758/6/2020 8/6/2020 47.48 Sell8/4/2020 8/4/2020 46.69 Buy8/3/2020 8/3/2020 46.3 Sell Buy
7/27/2020 7/27/2020 48.48 Buy Buy 0.2 0.9757/24/2020 7/24/2020 48.49 Sell7/22/2020 7/22/2020 48.48 Buy Buy 0.1 0.9757/21/2020 7/21/2020 47.2 Sell7/17/2020 7/17/2020 46.82 Buy Buy 0.1 0.9757/9/2020 7/9/2020 43.91 Sell Buy7/6/2020 7/6/2020 45.23 Buy
6/17/2020 6/17/2020 46.58 Sell
URL Information Links: https://www.barrons.com/quote/stock/KOhttps://quotes.wsj.com/KO?mod=md_home_hdr_searchhttps://finance.yahoo.com/quote/KO?p=KO&.tsrc=fin‐srch
0
5000000
10000000
15000000
20000000
25000000
30000000
35000000
40000000
45000000
50000000
0
10
20
30
40
50
60
70
The Coca‐Cola Co. (KO) Stock Price Time Series Prior to Market Open 12/2/2020: Est. ( L: 51.4, C: 52, H: 52.9 )
current_stock_price: trade_day_252_high: trade_day_252_low: volume: Linear (current_stock_price:)
0
0.2
0.4
0.6
0.8
1
1.2
The Coca‐Cola Co. (KO) Stock Price TRI‐SIGNALS Prior to Market Open 12/2/2020
daily_trend: stock_direction_signal_1: stock_direction_signal_2:
stock_direction_signal_3: Linear (daily_trend:) Linear (stock_direction_signal_1:)
Linear (stock_direction_signal_2:) Linear (stock_direction_signal_3:)
IHA Consultants page 13
TRI-SIG
NAL
Predict
ive Equ
ity Ana
lytics
IHA C
onsu
ltants
Inc.
ihaco
nsult
ants.
com
December 2, 2020 IHA Consultants TRI‐SIGNAL Report for selected DJIA Stocks sorted by Highest Return
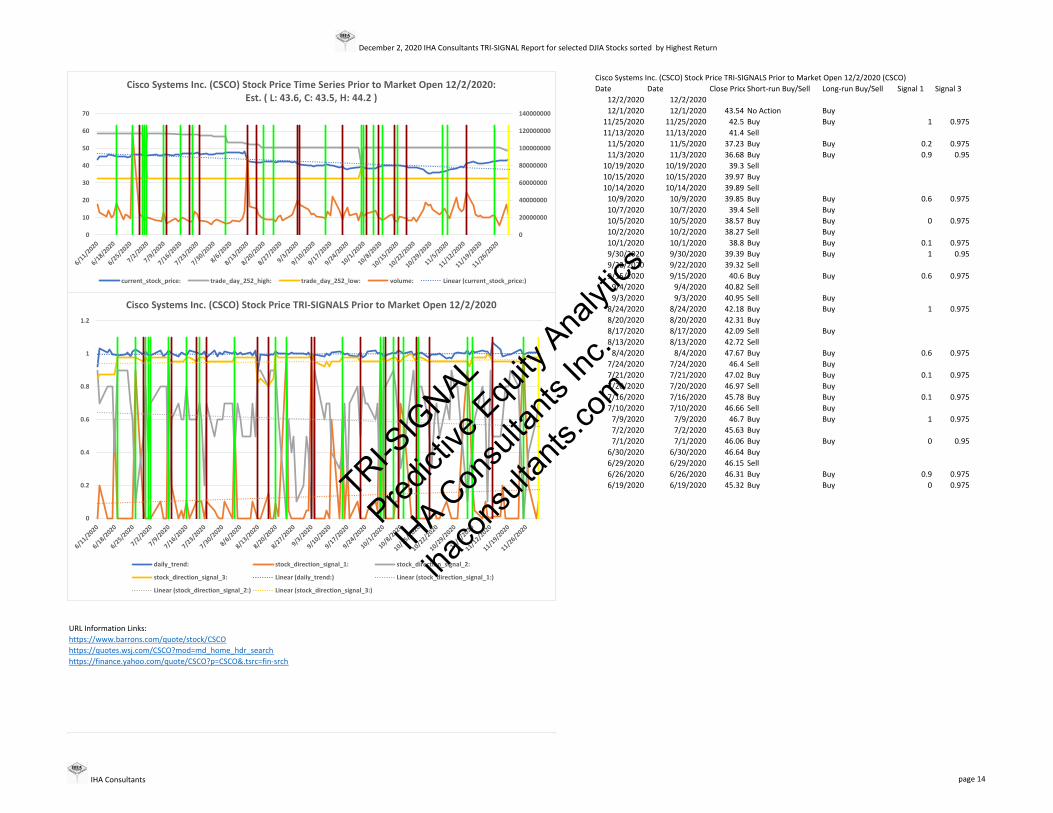
Cisco Systems Inc. (CSCO) Stock Price TRI‐SIGNALS Prior to Market Open 12/2/2020 (CSCO)Date Date Close PriceShort‐run Buy/Sell Long‐run Buy/Sell Signal 1 Signal 3
12/2/2020 12/2/202012/1/2020 12/1/2020 43.54 No Action Buy
11/25/2020 11/25/2020 42.5 Buy Buy 1 0.97511/13/2020 11/13/2020 41.4 Sell11/5/2020 11/5/2020 37.23 Buy Buy 0.2 0.97511/3/2020 11/3/2020 36.68 Buy Buy 0.9 0.95
10/19/2020 10/19/2020 39.3 Sell10/15/2020 10/15/2020 39.97 Buy10/14/2020 10/14/2020 39.89 Sell10/9/2020 10/9/2020 39.85 Buy Buy 0.6 0.97510/7/2020 10/7/2020 39.4 Sell Buy10/5/2020 10/5/2020 38.57 Buy Buy 0 0.97510/2/2020 10/2/2020 38.27 Sell Buy10/1/2020 10/1/2020 38.8 Buy Buy 0.1 0.9759/30/2020 9/30/2020 39.39 Buy Buy 1 0.959/22/2020 9/22/2020 39.32 Sell9/15/2020 9/15/2020 40.6 Buy Buy 0.6 0.9759/4/2020 9/4/2020 40.82 Sell9/3/2020 9/3/2020 40.95 Sell Buy
8/24/2020 8/24/2020 42.18 Buy Buy 1 0.9758/20/2020 8/20/2020 42.31 Buy8/17/2020 8/17/2020 42.09 Sell Buy8/13/2020 8/13/2020 42.72 Sell8/4/2020 8/4/2020 47.67 Buy Buy 0.6 0.975
7/24/2020 7/24/2020 46.4 Sell Buy7/21/2020 7/21/2020 47.02 Buy Buy 0.1 0.9757/20/2020 7/20/2020 46.97 Sell Buy7/16/2020 7/16/2020 45.78 Buy Buy 0.1 0.9757/10/2020 7/10/2020 46.66 Sell Buy7/9/2020 7/9/2020 46.7 Buy Buy 1 0.9757/2/2020 7/2/2020 45.63 Buy7/1/2020 7/1/2020 46.06 Buy Buy 0 0.95
6/30/2020 6/30/2020 46.64 Buy6/29/2020 6/29/2020 46.15 Sell6/26/2020 6/26/2020 46.31 Buy Buy 0.9 0.9756/19/2020 6/19/2020 45.32 Buy Buy 0 0.975
URL Information Links: https://www.barrons.com/quote/stock/CSCOhttps://quotes.wsj.com/CSCO?mod=md_home_hdr_searchhttps://finance.yahoo.com/quote/CSCO?p=CSCO&.tsrc=fin‐srch
0
20000000
40000000
60000000
80000000
100000000
120000000
140000000
0
10
20
30
40
50
60
70
Cisco Systems Inc. (CSCO) Stock Price Time Series Prior to Market Open 12/2/2020: Est. ( L: 43.6, C: 43.5, H: 44.2 )
current_stock_price: trade_day_252_high: trade_day_252_low: volume: Linear (current_stock_price:)
0
0.2
0.4
0.6
0.8
1
1.2
Cisco Systems Inc. (CSCO) Stock Price TRI‐SIGNALS Prior to Market Open 12/2/2020
daily_trend: stock_direction_signal_1: stock_direction_signal_2:
stock_direction_signal_3: Linear (daily_trend:) Linear (stock_direction_signal_1:)
Linear (stock_direction_signal_2:) Linear (stock_direction_signal_3:)
IHA Consultants page 14
TRI-SIG
NAL
Predict
ive Equ
ity Ana
lytics
IHA C
onsu
ltants
Inc.
ihaco
nsult
ants.
com

December 2, 2020 IHA Consultants TRI‐SIGNAL Report for selected DJIA Stocks sorted by Highest Return
Intel Corp. (INTC) Stock Price TRI‐SIGNALS Prior to Market Open 12/2/2020 (INTC)Date Date Close PriceShort‐run Buy/Sell Long‐run Buy/Sell Signal 1 Signal 3
12/2/2020 12/2/202012/1/2020 12/1/2020 49.56 No Action No Action
11/24/2020 11/24/2020 47.01 Buy Buy 1 0.97511/23/2020 11/23/2020 46.06 Buy Buy 0 0.9511/20/2020 11/20/2020 45.39 Buy Buy 0 0.97511/17/2020 11/17/2020 45.53 Buy Buy 0 0.9511/16/2020 11/16/2020 46.19 Monitor Buy11/13/2020 11/13/2020 45.46 Buy Buy 1 111/12/2020 11/12/2020 44.95 Buy Buy 1 111/5/2020 11/5/2020 45.68 Buy Buy 1 111/4/2020 11/4/2020 45.7 Buy Buy 1 0.9511/3/2020 11/3/2020 44.85 Buy Buy 1 0.95
10/26/2020 10/26/2020 46.72 Sell10/23/2020 10/23/2020 48.2 Buy10/20/2020 10/20/2020 53.43 Sell10/12/2020 10/12/2020 53.88 Buy10/2/2020 10/2/2020 51.01 Sell10/1/2020 10/1/2020 52.24 Buy Buy 0.1 0.9759/23/2020 9/23/2020 48.82 Sell9/16/2020 9/16/2020 50.37 Buy9/3/2020 9/3/2020 50.39 Sell
8/28/2020 8/28/2020 50.43 Buy Buy 1 18/21/2020 8/21/2020 49.28 Buy8/20/2020 8/20/2020 49.17 Sell8/17/2020 8/17/2020 48.93 Buy8/13/2020 8/13/2020 48.56 Sell8/12/2020 8/12/2020 49.19 Buy Buy 1 0.9758/11/2020 8/11/2020 48.19 Sell8/6/2020 8/6/2020 48.57 Buy Buy 0.1 0.9758/5/2020 8/5/2020 48.92 Sell Buy8/4/2020 8/4/2020 49.13 Buy Buy 1 0.9758/3/2020 8/3/2020 48.3 Buy Buy 1 0.975
7/24/2020 7/24/2020 50.59 Sell7/21/2020 7/21/2020 60.7 Buy Buy 1 17/20/2020 7/20/2020 61.15 Buy Buy 0.7 0.9757/17/2020 7/17/2020 60 Sell7/16/2020 7/16/2020 59.14 Buy7/10/2020 7/10/2020 59.53 Sell7/9/2020 7/9/2020 58.42 Buy7/7/2020 7/7/2020 58.31 Sell Buy7/6/2020 7/6/2020 59.54 Buy7/1/2020 7/1/2020 58.81 Sell
6/19/2020 6/19/2020 59.62 Buy6/16/2020 6/16/2020 60.4 Sell
URL Information Links: https://www.barrons.com/quote/stock/INTChttps://quotes.wsj.com/INTC?mod=md_home_hdr_searchhttps://finance.yahoo.com/quote/INTC?p=INTC&.tsrc=fin‐srch
0
20000000
40000000
60000000
80000000
100000000
120000000
140000000
160000000
180000000
200000000
0
10
20
30
40
50
60
70
80
Intel Corp. (INTC) Stock Price Time Series Prior to Market Open 12/2/2020: Est. ( L: 48.1, C: 49.6, H: 50.3 )
current_stock_price: trade_day_252_high: trade_day_252_low: volume: Linear (current_stock_price:)
0
0.2
0.4
0.6
0.8
1
1.2
Intel Corp. (INTC) Stock Price TRI‐SIGNALS Prior to Market Open 12/2/2020
daily_trend: stock_direction_signal_1: stock_direction_signal_2:
stock_direction_signal_3: Linear (daily_trend:) Linear (stock_direction_signal_1:)
Linear (stock_direction_signal_2:) Linear (stock_direction_signal_3:)
IHA Consultants page 15
TRI-SIG
NAL
Predict
ive Equ
ity Ana
lytics
IHA C
onsu
ltants
Inc.
ihaco
nsult
ants.
com

December 2, 2020 IHA Consultants TRI‐SIGNAL Report for selected DJIA Stocks sorted by Highest Return
Microsoft Corp. (MSFT) Stock Price TRI‐SIGNALS Prior to Market Open 12/2/2020 (MSFT)Date Date Close PriceShort‐run Buy/Sell Long‐run Buy/Sell Signal 1 Signal 3
12/2/2020 12/2/202012/1/2020 12/1/2020 216.21 No Action No Action
11/25/2020 11/25/2020 213.87 Buy Buy 1 0.97511/18/2020 11/18/2020 211.08 Buy Buy 0.15 0.97511/9/2020 11/9/2020 218.39 Sell Buy11/5/2020 11/5/2020 223.29 Buy11/4/2020 11/4/2020 216.39 Buy Buy 1 0.911/3/2020 11/3/2020 206.43 Sell
10/19/2020 10/19/2020 214.22 Sell Buy10/14/2020 10/14/2020 220.86 Buy Buy 0.2 0.97510/2/2020 10/2/2020 206.19 Sell10/1/2020 10/1/2020 212.46 Buy Buy 0.2 0.9759/21/2020 9/21/2020 202.54 Sell Buy9/18/2020 9/18/2020 200.39 Buy9/3/2020 9/3/2020 217.3 Sell Buy9/1/2020 9/1/2020 227.27 No Action
8/31/2020 8/31/2020 225.53 Sell8/28/2020 8/28/2020 228.91 No Action Buy8/28/2020 8/28/2020 228.91 No Action Buy8/27/2020 8/27/2020 226.58 Sell8/19/2020 8/19/2020 209.7 Buy Buy 0.1 0.9758/6/2020 8/6/2020 216.35 Sell8/5/2020 8/5/2020 212.94 Buy8/4/2020 8/4/2020 213.29 Sell
7/31/2020 7/31/2020 205.01 Buy7/27/2020 7/27/2020 203.85 Sell Buy7/13/2020 7/13/2020 207.07 Sell Buy7/7/2020 7/7/2020 208.25 Buy
6/24/2020 6/24/2020 197.84 Sell Buy6/19/2020 6/19/2020 195.15 Buy Buy 0.1 0.9756/16/2020 6/16/2020 193.57 Sell6/12/2020 6/12/2020 187.74 Sell
URL Information Links: https://www.barrons.com/quote/stock/MSFThttps://quotes.wsj.com/MSFT?mod=md_home_hdr_searchhttps://finance.yahoo.com/quote/MSFT?p=MSFT&.tsrc=fin‐srch
0
10000000
20000000
30000000
40000000
50000000
60000000
70000000
80000000
90000000
0
50
100
150
200
250
Microsoft Corp. (MSFT) Stock Price Time Series Prior to Market Open 12/2/2020: Est. ( L: 215.2, C: 216.2, H: 219.4 )
current_stock_price: trade_day_252_high: trade_day_252_low: volume: Linear (current_stock_price:)
0
0.2
0.4
0.6
0.8
1
1.2
Microsoft Corp. (MSFT) Stock Price TRI‐SIGNALS Prior to Market Open 12/2/2020
daily_trend: stock_direction_signal_1: stock_direction_signal_2:
stock_direction_signal_3: Linear (daily_trend:) Linear (stock_direction_signal_1:)
Linear (stock_direction_signal_2:) Linear (stock_direction_signal_3:)
IHA Consultants page 16
TRI-SIG
NAL
Predict
ive Equ
ity Ana
lytics
IHA C
onsu
ltants
Inc.
ihaco
nsult
ants.
com

December 2, 2020 IHA Consultants TRI‐SIGNAL Report for selected DJIA Stocks sorted by Highest Return
Caterpillar Inc. (CAT) Stock Price TRI‐SIGNALS Prior to Market Open 12/2/2020 (CAT)Date Date Close PriceShort‐run Buy/Sell Long‐run Buy/Sell Signal 1 Signal 3
12/2/2020 12/2/202012/1/2020 12/1/2020 173.26 No Action No Action
11/24/2020 11/24/2020 176.9 No Action Buy11/18/2020 11/18/2020 172.74 No Action Buy11/17/2020 11/17/2020 171.91 Buy11/16/2020 11/16/2020 173.19 Sell Buy11/13/2020 11/13/2020 171.71 Buy11/4/2020 11/4/2020 155.23 Sell
10/26/2020 10/26/2020 163.2 Sell10/14/2020 10/14/2020 163.61 No Action10/13/2020 10/13/2020 162.12 Sell10/8/2020 10/8/2020 156.66 No Action10/6/2020 10/6/2020 151.53 Sell10/5/2020 10/5/2020 153.49 No Action Buy10/2/2020 10/2/2020 149.94 Sell10/1/2020 10/1/2020 146.71 Buy9/30/2020 9/30/2020 149.15 Sell Buy9/29/2020 9/29/2020 147.41 Buy9/21/2020 9/21/2020 145.33 Sell9/14/2020 9/14/2020 153.51 Sell9/11/2020 9/11/2020 153.83 No Action Buy9/10/2020 9/10/2020 149.86 Sell9/9/2020 9/9/2020 152.69 No Action9/8/2020 9/8/2020 148.52 Sell9/4/2020 9/4/2020 148.18 No Action Buy9/3/2020 9/3/2020 146.76 Sell
8/18/2020 8/18/2020 138.37 Buy8/17/2020 8/17/2020 138.72 Sell8/14/2020 8/14/2020 139.96 Buy8/13/2020 8/13/2020 140.67 Sell8/10/2020 8/10/2020 142.02 Buy Buy 1 0.9758/7/2020 8/7/2020 134.92 Buy Buy 1 0.958/6/2020 8/6/2020 134.39 Buy Buy 1 0.95
7/30/2020 7/30/2020 136.73 Sell Buy7/22/2020 7/22/2020 136.98 Buy7/21/2020 7/21/2020 135.87 Sell7/17/2020 7/17/2020 136.9 Buy Buy 0.25 0.9757/14/2020 7/14/2020 136.88 Buy Buy 1 0.957/10/2020 7/10/2020 128.01 Sell7/8/2020 7/8/2020 128.13 Buy
6/23/2020 6/23/2020 126.25 Sell Buy6/22/2020 6/22/2020 125.79 Buy Buy 0 0.975
URL Information Links: https://www.barrons.com/quote/stock/CAThttps://quotes.wsj.com/CAT?mod=md_home_hdr_searchhttps://finance.yahoo.com/quote/CAT?p=CAT&.tsrc=fin‐srch
0
1000000
2000000
3000000
4000000
5000000
6000000
7000000
8000000
9000000
10000000
0
20
40
60
80
100
120
140
160
180
200
Caterpillar Inc. (CAT) Stock Price Time Series Prior to Market Open 12/2/2020: Est. ( L: 171.8, C: 173.3, H: 175.5 )
current_stock_price: trade_day_252_high: trade_day_252_low: volume: Linear (current_stock_price:)
0
0.2
0.4
0.6
0.8
1
1.2
Caterpillar Inc. (CAT) Stock Price TRI‐SIGNALS Prior to Market Open 12/2/2020
daily_trend: stock_direction_signal_1: stock_direction_signal_2:
stock_direction_signal_3: Linear (daily_trend:) Linear (stock_direction_signal_1:)
Linear (stock_direction_signal_2:) Linear (stock_direction_signal_3:)
IHA Consultants page 17
TRI-SIG
NAL
Predict
ive Equ
ity Ana
lytics
IHA C
onsu
ltants
Inc.
ihaco
nsult
ants.
com

December 2, 2020 IHA Consultants TRI‐SIGNAL Report for selected DJIA Stocks sorted by Highest Return
McDonald's Corp. (MCD) Stock Price TRI‐SIGNALS Prior to Market Open 12/2/2020 (MCD)Date Date Close PriceShort‐run Buy/Sell Long‐run Buy/Sell Signal 1 Signal 3
12/2/2020 12/2/202012/1/2020 12/1/2020 216.14 No Action Buy
11/19/2020 11/19/2020 215.11 Buy Buy 0.19 111/17/2020 11/17/2020 216.01 Sell11/16/2020 11/16/2020 216.73 Sell Buy11/11/2020 11/11/2020 218.02 Sell Buy11/5/2020 11/5/2020 216.31 Buy
10/26/2020 10/26/2020 224.27 Sell10/19/2020 10/19/2020 226 Sell Buy10/7/2020 10/7/2020 226.48 No Action Buy9/25/2020 9/25/2020 218.18 Buy Buy 0.9 0.9759/11/2020 9/11/2020 218 No Action Buy9/10/2020 9/10/2020 217.24 Sell9/4/2020 9/4/2020 211.73 Buy9/3/2020 9/3/2020 213.8 Sell Buy
8/27/2020 8/27/2020 212.19 Monitor Buy8/6/2020 8/6/2020 203.18 Buy Buy 1 0.9758/5/2020 8/5/2020 199.26 Buy8/4/2020 8/4/2020 199.36 Buy Buy 1 0.95
7/28/2020 7/28/2020 196.24 Sell7/24/2020 7/24/2020 198.72 Buy Buy 1 17/23/2020 7/23/2020 197.55 Buy Buy 1 0.9757/15/2020 7/15/2020 191.77 Buy Buy 1 0.9757/13/2020 7/13/2020 184.92 Buy7/10/2020 7/10/2020 184.88 Sell7/7/2020 7/7/2020 185.82 Buy7/6/2020 7/6/2020 188.5 Sell
6/18/2020 6/18/2020 189.49 Buy
URL Information Links: https://www.barrons.com/quote/stock/MCDhttps://quotes.wsj.com/MCD?mod=md_home_hdr_searchhttps://finance.yahoo.com/quote/MCD?p=MCD&.tsrc=fin‐srch
0
1000000
2000000
3000000
4000000
5000000
6000000
7000000
8000000
9000000
0
50
100
150
200
250
McDonald's Corp. (MCD) Stock Price Time Series Prior to Market Open 12/2/2020: Est. ( L: 215, C: 216.1, H: 218.9 )
current_stock_price: trade_day_252_high: trade_day_252_low: volume: Linear (current_stock_price:)
0
0.2
0.4
0.6
0.8
1
1.2
McDonald's Corp. (MCD) Stock Price TRI‐SIGNALS Prior to Market Open 12/2/2020
daily_trend: stock_direction_signal_1: stock_direction_signal_2:
stock_direction_signal_3: Linear (daily_trend:) Linear (stock_direction_signal_1:)
Linear (stock_direction_signal_2:) Linear (stock_direction_signal_3:)
IHA Consultants page 18
TRI-SIG
NAL
Predict
ive Equ
ity Ana
lytics
IHA C
onsu
ltants
Inc.
ihaco
nsult
ants.
com

December 2, 2020 IHA Consultants TRI‐SIGNAL Report for selected DJIA Stocks sorted by Highest Return
Johnson & Johnson (JNJ) Stock Price TRI‐SIGNALS Prior to Market Open 12/2/2020 (JNJ)Date Date Close PriceShort‐run Buy/Sell Long‐run Buy/Sell Signal 1 Signal 3
12/2/2020 12/2/202012/1/2020 12/1/2020 147.45 Buy Buy 1 0.97511/6/2020 11/6/2020 142.25 Buy Buy 1 111/5/2020 11/5/2020 139.76 Buy Buy 0.6 0.975
10/28/2020 10/28/2020 138.36 Sell10/27/2020 10/27/2020 143.15 Buy10/13/2020 10/13/2020 148.36 Sell10/1/2020 10/1/2020 147.32 Buy Buy 1 19/29/2020 9/29/2020 147.06 Buy Buy 0.8 0.9759/25/2020 9/25/2020 145.66 Sell Buy9/23/2020 9/23/2020 144.44 Sell Buy9/21/2020 9/21/2020 145.1 Sell9/17/2020 9/17/2020 147.17 Buy Buy 0.6 0.9759/16/2020 9/16/2020 148.4 Sell Buy9/14/2020 9/14/2020 148.35 Buy9/11/2020 9/11/2020 147.78 Buy Buy 1 0.959/3/2020 9/3/2020 149.55 Sell
7/16/2020 7/16/2020 149.25 Buy Buy 1 0.9757/2/2020 7/2/2020 140.97 Buy
6/30/2020 6/30/2020 140.63 Sell6/26/2020 6/26/2020 137.81 Buy6/24/2020 6/24/2020 139.82 Sell6/19/2020 6/19/2020 143.83 Buy6/12/2020 6/12/2020 142.15 Sell
URL Information Links: https://www.barrons.com/quote/stock/JNJhttps://quotes.wsj.com/JNJ?mod=md_home_hdr_searchhttps://finance.yahoo.com/quote/JNJ?p=JNJ&.tsrc=fin‐srch
0
2000000
4000000
6000000
8000000
10000000
12000000
14000000
16000000
18000000
0
20
40
60
80
100
120
140
160
180
Johnson & Johnson (JNJ) Stock Price Time Series Prior to Market Open 12/2/2020: Est. ( L: 142.4, C: 147.4, H: 149.2 )
current_stock_price: trade_day_252_high: trade_day_252_low: volume: Linear (current_stock_price:)
0
0.2
0.4
0.6
0.8
1
1.2
Johnson & Johnson (JNJ) Stock Price TRI‐SIGNALS Prior to Market Open 12/2/2020
daily_trend: stock_direction_signal_1: stock_direction_signal_2:
stock_direction_signal_3: Linear (daily_trend:) Linear (stock_direction_signal_1:)
Linear (stock_direction_signal_2:) Linear (stock_direction_signal_3:)
IHA Consultants page 19
TRI-SIG
NAL
Predict
ive Equ
ity Ana
lytics
IHA C
onsu
ltants
Inc.
ihaco
nsult
ants.
com

December 2, 2020 IHA Consultants TRI‐SIGNAL Report for selected DJIA Stocks sorted by Highest Return
JPMorgan Chase & Co. (JPM) Stock Price TRI‐SIGNALS Prior to Market Open 12/2/2020 (JPM)Date Date Close PriceShort‐run Buy/Sell Long‐run Buy/Sell Signal 1 Signal 3
12/2/2020 12/2/202012/1/2020 12/1/2020 119.74 No Action No Action
11/27/2020 11/27/2020 121.22 Sell11/20/2020 11/20/2020 114.57 Buy11/3/2020 11/3/2020 103.41 Buy Buy 1 0.95
10/23/2020 10/23/2020 103.81 Sell10/20/2020 10/20/2020 100.37 Buy10/13/2020 10/13/2020 100.78 Sell9/30/2020 9/30/2020 96.27 Buy Buy 1 0.9759/29/2020 9/29/2020 95.35 Buy Buy 1 0.9759/28/2020 9/28/2020 96.16 Buy Buy 1 0.959/9/2020 9/9/2020 100.87 Sell Buy
8/31/2020 8/31/2020 100.19 Sell8/27/2020 8/27/2020 102.35 Buy Buy 1 0.9758/25/2020 8/25/2020 100.5 Buy Buy 1 0.9758/24/2020 8/24/2020 100.06 Buy Buy 1 0.958/17/2020 8/17/2020 99.71 Sell8/11/2020 8/11/2020 103.82 Buy Buy 1 0.9758/10/2020 8/10/2020 100.64 Buy Buy 1 0.9758/7/2020 8/7/2020 99.38 Buy Buy 0.6 0.9758/6/2020 8/6/2020 97.24 Buy Buy 1 0.95
7/30/2020 7/30/2020 97.02 Sell7/23/2020 7/23/2020 98.98 Buy7/22/2020 7/22/2020 98.69 Sell7/21/2020 7/21/2020 99.41 Buy7/2/2020 7/2/2020 92.66 Sell Buy
6/30/2020 6/30/2020 94.06 Sell Buy6/26/2020 6/26/2020 92.59 Sell6/25/2020 6/25/2020 97.96 Buy Buy 0.6 0.975
URL Information Links: https://www.barrons.com/quote/stock/JPMhttps://quotes.wsj.com/JPM?mod=md_home_hdr_searchhttps://finance.yahoo.com/quote/JPM?p=JPM&.tsrc=fin‐srch
0
10000000
20000000
30000000
40000000
50000000
60000000
0
20
40
60
80
100
120
140
160
JPMorgan Chase & Co. (JPM) Stock Price Time Series Prior to Market Open 12/2/2020: Est. ( L: 116.5, C: 119.7, H: 120.9 )
current_stock_price: trade_day_252_high: trade_day_252_low: volume: Linear (current_stock_price:)
0
0.2
0.4
0.6
0.8
1
1.2
JPMorgan Chase & Co. (JPM) Stock Price TRI‐SIGNALS Prior to Market Open 12/2/2020
daily_trend: stock_direction_signal_1: stock_direction_signal_2:
stock_direction_signal_3: Linear (daily_trend:) Linear (stock_direction_signal_1:)
Linear (stock_direction_signal_2:) Linear (stock_direction_signal_3:)
IHA Consultants page 20
TRI-SIG
NAL
Predict
ive Equ
ity Ana
lytics
IHA C
onsu
ltants
Inc.
ihaco
nsult
ants.
com

December 2, 2020 IHA Consultants TRI‐SIGNAL Report for selected DJIA Stocks sorted by Highest Return
The Goldman Sachs Group Inc. (GS) Stock Price TRI‐SIGNALS Prior to Market Open 12/2/2020 (GS)Date Date Close PriceShort‐run Buy/Sell Long‐run Buy/Sell Signal 1 Signal 3
12/2/2020 12/2/202012/1/2020 12/1/2020 232.08 No Action No Action
11/30/2020 11/30/2020 230.58 Sell11/20/2020 11/20/2020 223.35 Buy Buy 0.2 0.97511/19/2020 11/19/2020 224.57 Sell11/18/2020 11/18/2020 224.3 Buy11/10/2020 11/10/2020 217.47 Sell11/5/2020 11/5/2020 202.96 Buy Buy 1 0.97511/4/2020 11/4/2020 197.87 Buy Buy 1 0.9511/3/2020 11/3/2020 197.93 Buy Buy 1 0.925
10/23/2020 10/23/2020 205.04 Sell Buy10/22/2020 10/22/2020 205.4 Monitor Buy10/20/2020 10/20/2020 208.03 Sell10/14/2020 10/14/2020 211.23 Buy10/13/2020 10/13/2020 210.81 Sell10/5/2020 10/5/2020 201.8 Buy9/24/2020 9/24/2020 195.11 Sell Buy9/17/2020 9/17/2020 194.83 Sell9/16/2020 9/16/2020 200.68 Buy9/14/2020 9/14/2020 201.34 Sell Buy9/2/2020 9/2/2020 210.04 Sell
8/25/2020 8/25/2020 206 Buy Buy 1 0.9758/24/2020 8/24/2020 207.34 Buy Buy 1 0.958/21/2020 8/21/2020 202.43 Sell8/20/2020 8/20/2020 201.85 Sell Buy8/19/2020 8/19/2020 203.02 Buy8/17/2020 8/17/2020 203.07 Sell Buy8/14/2020 8/14/2020 207.97 Buy8/13/2020 8/13/2020 208.39 Sell7/31/2020 7/31/2020 197.96 Buy7/29/2020 7/29/2020 202.58 Buy Buy 1 0.957/22/2020 7/22/2020 206 Sell7/20/2020 7/20/2020 211.71 Buy7/6/2020 7/6/2020 207.36 Sell Buy7/2/2020 7/2/2020 197.4 Buy
6/26/2020 6/26/2020 189.19 Sell6/24/2020 6/24/2020 198.02 Sell6/19/2020 6/19/2020 201.63 Buy Buy 0.09 0.975
URL Information Links: https://www.barrons.com/quote/stock/GShttps://quotes.wsj.com/GS?mod=md_home_hdr_searchhttps://finance.yahoo.com/quote/GS?p=GS&.tsrc=fin‐srch
0
2000000
4000000
6000000
8000000
10000000
12000000
14000000
0
50
100
150
200
250
300
The Goldman Sachs Group Inc. (GS) Stock Price Time Series Prior to Market Open 12/2/2020: Est. ( L: 227.4, C: 232.1, H: 234.2 )
current_stock_price: trade_day_252_high: trade_day_252_low: volume: Linear (current_stock_price:)
0
0.2
0.4
0.6
0.8
1
1.2
The Goldman Sachs Group Inc. (GS) Stock Price TRI‐SIGNALS Prior to Market Open 12/2/2020
daily_trend: stock_direction_signal_1: stock_direction_signal_2:
stock_direction_signal_3: Linear (daily_trend:) Linear (stock_direction_signal_1:)
Linear (stock_direction_signal_2:) Linear (stock_direction_signal_3:)
IHA Consultants page 21
TRI-SIG
NAL
Predict
ive Equ
ity Ana
lytics
IHA C
onsu
ltants
Inc.
ihaco
nsult
ants.
com
December 2, 2020 IHA Consultants TRI‐SIGNAL Report for selected DJIA Stocks sorted by Highest Return
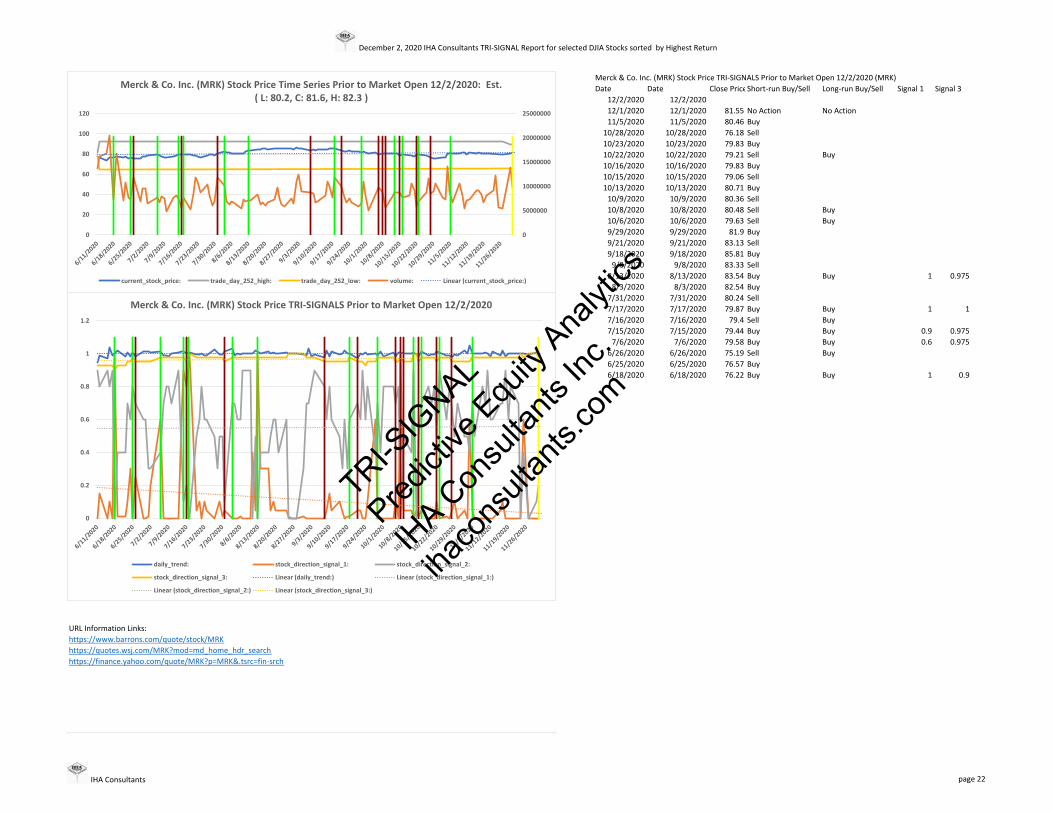
Merck & Co. Inc. (MRK) Stock Price TRI‐SIGNALS Prior to Market Open 12/2/2020 (MRK)Date Date Close PriceShort‐run Buy/Sell Long‐run Buy/Sell Signal 1 Signal 3
12/2/2020 12/2/202012/1/2020 12/1/2020 81.55 No Action No Action11/5/2020 11/5/2020 80.46 Buy
10/28/2020 10/28/2020 76.18 Sell10/23/2020 10/23/2020 79.83 Buy10/22/2020 10/22/2020 79.21 Sell Buy10/16/2020 10/16/2020 79.83 Buy10/15/2020 10/15/2020 79.06 Sell10/13/2020 10/13/2020 80.71 Buy10/9/2020 10/9/2020 80.36 Sell10/8/2020 10/8/2020 80.48 Sell Buy10/6/2020 10/6/2020 79.63 Sell Buy9/29/2020 9/29/2020 81.9 Buy9/21/2020 9/21/2020 83.13 Sell9/18/2020 9/18/2020 85.81 Buy9/8/2020 9/8/2020 83.33 Sell
8/13/2020 8/13/2020 83.54 Buy Buy 1 0.9758/3/2020 8/3/2020 82.54 Buy
7/31/2020 7/31/2020 80.24 Sell7/17/2020 7/17/2020 79.87 Buy Buy 1 17/16/2020 7/16/2020 79.4 Sell Buy7/15/2020 7/15/2020 79.44 Buy Buy 0.9 0.9757/6/2020 7/6/2020 79.58 Buy Buy 0.6 0.975
6/26/2020 6/26/2020 75.19 Sell Buy6/25/2020 6/25/2020 76.57 Buy6/18/2020 6/18/2020 76.22 Buy Buy 1 0.9
URL Information Links: https://www.barrons.com/quote/stock/MRKhttps://quotes.wsj.com/MRK?mod=md_home_hdr_searchhttps://finance.yahoo.com/quote/MRK?p=MRK&.tsrc=fin‐srch
0
5000000
10000000
15000000
20000000
25000000
0
20
40
60
80
100
120
Merck & Co. Inc. (MRK) Stock Price Time Series Prior to Market Open 12/2/2020: Est. ( L: 80.2, C: 81.6, H: 82.3 )
current_stock_price: trade_day_252_high: trade_day_252_low: volume: Linear (current_stock_price:)
0
0.2
0.4
0.6
0.8
1
1.2
Merck & Co. Inc. (MRK) Stock Price TRI‐SIGNALS Prior to Market Open 12/2/2020
daily_trend: stock_direction_signal_1: stock_direction_signal_2:
stock_direction_signal_3: Linear (daily_trend:) Linear (stock_direction_signal_1:)
Linear (stock_direction_signal_2:) Linear (stock_direction_signal_3:)
IHA Consultants page 22
TRI-SIG
NAL
Predict
ive Equ
ity Ana
lytics
IHA C
onsu
ltants
Inc.
ihaco
nsult
ants.
com

December 2, 2020 IHA Consultants TRI‐SIGNAL Report for selected DJIA Stocks sorted by Highest Return
Walmart Inc. (WMT) Stock Price TRI‐SIGNALS Prior to Market Open 12/2/2020 (WMT)Date Date Close PriceShort‐run Buy/Sell Long‐run Buy/Sell Signal 1 Signal 3
12/2/2020 12/2/202012/1/2020 12/1/2020 152.64 No Action Buy
11/25/2020 11/25/2020 151.83 No Action11/24/2020 11/24/2020 151.36 Sell11/23/2020 11/23/2020 150.93 No Action11/20/2020 11/20/2020 150.24 Sell Buy11/19/2020 11/19/2020 152.12 Monitor Buy11/17/2020 11/17/2020 149.37 Sell11/13/2020 11/13/2020 150.54 No Action11/10/2020 11/10/2020 145.56 Sell11/9/2020 11/9/2020 143.54 Buy11/6/2020 11/6/2020 145.77 Sell11/5/2020 11/5/2020 143.47 Buy Buy 0.2 0.97511/2/2020 11/2/2020 140.4 Sell
10/19/2020 10/19/2020 142.95 Buy10/16/2020 10/16/2020 144.71 Sell10/13/2020 10/13/2020 146.23 Buy Buy 1 0.97510/6/2020 10/6/2020 140.63 Buy10/2/2020 10/2/2020 140.5 Sell9/30/2020 9/30/2020 139.91 Buy Buy 0.7 0.9759/29/2020 9/29/2020 137.14 Sell9/18/2020 9/18/2020 135.29 Buy9/2/2020 9/2/2020 147.68 Sell9/1/2020 9/1/2020 147.59 No Action Buy
8/28/2020 8/28/2020 140.3 No Action Buy8/27/2020 8/27/2020 136.63 Buy Buy 1 0.958/26/2020 8/26/2020 130.7 Sell Buy8/24/2020 8/24/2020 131.33 Buy Buy 0 0.9758/19/2020 8/19/2020 132.41 Sell8/12/2020 8/12/2020 131.89 Buy Buy 1 0.9758/11/2020 8/11/2020 130.2 Buy Buy 0 0.9758/10/2020 8/10/2020 131.88 Sell8/5/2020 8/5/2020 129.81 Buy Buy 1 0.975
7/16/2020 7/16/2020 132.2 Buy7/8/2020 7/8/2020 124.44 Sell
6/19/2020 6/19/2020 119.85 Buy Buy 1 0.9756/16/2020 6/16/2020 119.65 Buy6/15/2020 6/15/2020 118.08 Sell
URL Information Links: https://www.barrons.com/quote/stock/WMThttps://quotes.wsj.com/WMT?mod=md_home_hdr_searchhttps://finance.yahoo.com/quote/WMT?p=WMT&.tsrc=fin‐srch
0
5000000
10000000
15000000
20000000
25000000
30000000
35000000
40000000
45000000
0
20
40
60
80
100
120
140
160
180
Walmart Inc. (WMT) Stock Price Time Series Prior to Market Open 12/2/2020: Est. ( L: 152.1, C: 152.6, H: 153.9 )
current_stock_price: trade_day_252_high: trade_day_252_low: volume: Linear (current_stock_price:)
0
0.2
0.4
0.6
0.8
1
1.2
Walmart Inc. (WMT) Stock Price TRI‐SIGNALS Prior to Market Open 12/2/2020
daily_trend: stock_direction_signal_1: stock_direction_signal_2:
stock_direction_signal_3: Linear (daily_trend:) Linear (stock_direction_signal_1:)
Linear (stock_direction_signal_2:) Linear (stock_direction_signal_3:)
IHA Consultants page 23
TRI-SIG
NAL
Predict
ive Equ
ity Ana
lytics
IHA C
onsu
ltants
Inc.
ihaco
nsult
ants.
com

December 2, 2020 IHA Consultants TRI‐SIGNAL Report for selected DJIA Stocks sorted by Highest Return
The Home Depot Inc. (HD) Stock Price TRI‐SIGNALS Prior to Market Open 12/2/2020 (HD)Date Date Close PriceShort‐run Buy/Sell Long‐run Buy/Sell Signal 1 Signal 3
12/2/2020 12/2/202012/1/2020 12/1/2020 276.6 No Action Buy
11/25/2020 11/25/2020 273.96 Buy11/24/2020 11/24/2020 273.31 Buy Buy 1 0.9511/17/2020 11/17/2020 272.47 Sell11/16/2020 11/16/2020 279.57 Buy11/12/2020 11/12/2020 276.24 Sell Buy11/9/2020 11/9/2020 269.97 Sell Buy11/5/2020 11/5/2020 285.85 No Action Buy11/4/2020 11/4/2020 282.72 Buy Buy 0.9 0.95
10/26/2020 10/26/2020 276.04 Sell10/13/2020 10/13/2020 290.36 No Action10/6/2020 10/6/2020 276.47 Sell Buy10/1/2020 10/1/2020 277.62 Buy9/28/2020 9/28/2020 272.33 Sell9/25/2020 9/25/2020 268.55 Sell Buy9/22/2020 9/22/2020 273.31 Sell Buy9/17/2020 9/17/2020 279.96 Buy9/16/2020 9/16/2020 281.63 Sell9/15/2020 9/15/2020 285.58 No Action9/11/2020 9/11/2020 276.33 Buy Buy 1 0.9259/9/2020 9/9/2020 277.04 Sell Buy9/3/2020 9/3/2020 274.63 Sell
8/19/2020 8/19/2020 282.86 Buy8/18/2020 8/18/2020 285 Sell Buy8/4/2020 8/4/2020 267.87 No Action Buy
7/14/2020 7/14/2020 257.79 No Action Buy7/1/2020 7/1/2020 248.15 Buy
6/30/2020 6/30/2020 250.51 Sell6/29/2020 6/29/2020 246.12 Buy6/26/2020 6/26/2020 241.01 Sell6/19/2020 6/19/2020 246.65 Buy
URL Information Links: https://www.barrons.com/quote/stock/HDhttps://quotes.wsj.com/HD?mod=md_home_hdr_searchhttps://finance.yahoo.com/quote/HD?p=HD&.tsrc=fin‐srch
0
2000000
4000000
6000000
8000000
10000000
12000000
0
50
100
150
200
250
300
350
The Home Depot Inc. (HD) Stock Price Time Series Prior to Market Open 12/2/2020: Est. ( L: 275.9, C: 276.6, H: 277.8 )
current_stock_price: trade_day_252_high: trade_day_252_low: volume: Linear (current_stock_price:)
0
0.2
0.4
0.6
0.8
1
1.2
The Home Depot Inc. (HD) Stock Price TRI‐SIGNALS Prior to Market Open 12/2/2020
daily_trend: stock_direction_signal_1: stock_direction_signal_2:
stock_direction_signal_3: Linear (daily_trend:) Linear (stock_direction_signal_1:)
Linear (stock_direction_signal_2:) Linear (stock_direction_signal_3:)
IHA Consultants page 24
TRI-SIG
NAL
Predict
ive Equ
ity Ana
lytics
IHA C
onsu
ltants
Inc.
ihaco
nsult
ants.
com

December 2, 2020 IHA Consultants TRI‐SIGNAL Report for selected DJIA Stocks sorted by Highest Return
NIKE Inc. (NKE) Stock Price TRI‐SIGNALS Prior to Market Open 12/2/2020 (NKE)Date Date Close PriceShort‐run Buy/Sell Long‐run Buy/Sell Signal 1 Signal 3
12/2/2020 12/2/202012/1/2020 12/1/2020 135.44 Monitor Buy11/9/2020 11/9/2020 128.95 Buy Buy 0.1 0.97511/3/2020 11/3/2020 124.59 Sell Buy11/2/2020 11/2/2020 122.39 Buy Buy 1 0.975
10/28/2020 10/28/2020 122.08 Sell10/9/2020 10/9/2020 130.98 No Action Buy10/7/2020 10/7/2020 130.06 No Action Buy10/1/2020 10/1/2020 126.64 Buy Buy 1 0.9759/23/2020 9/23/2020 127.11 Sell9/21/2020 9/21/2020 113.37 Buy9/18/2020 9/18/2020 114.66 Sell Buy9/14/2020 9/14/2020 119.28 No Action Buy9/4/2020 9/4/2020 112.4 Sell9/3/2020 9/3/2020 112.85 Buy Buy 1 1
8/13/2020 8/13/2020 106.52 No Action8/12/2020 8/12/2020 105.22 Sell8/3/2020 8/3/2020 98.33 Buy Buy 1 0.975
7/24/2020 7/24/2020 98.43 Buy7/23/2020 7/23/2020 98.3 Sell7/22/2020 7/22/2020 98.91 Buy7/21/2020 7/21/2020 98.36 Sell7/20/2020 7/20/2020 95.65 Buy7/17/2020 7/17/2020 96.28 Sell7/16/2020 7/16/2020 97.26 Buy Buy 1 0.9756/29/2020 6/29/2020 95.87 Sell Buy6/26/2020 6/26/2020 93.67 Sell
URL Information Links: https://www.barrons.com/quote/stock/NKEhttps://quotes.wsj.com/NKE?mod=md_home_hdr_searchhttps://finance.yahoo.com/quote/NKE?p=NKE&.tsrc=fin‐srch
0
5000000
10000000
15000000
20000000
25000000
30000000
35000000
40000000
0
20
40
60
80
100
120
140
160
NIKE Inc. (NKE) Stock Price Time Series Prior to Market Open 12/2/2020: Est. ( L: 134.5, C: 135.4, H: 135.9 )
current_stock_price: trade_day_252_high: trade_day_252_low: volume: Linear (current_stock_price:)
0
0.2
0.4
0.6
0.8
1
1.2
NIKE Inc. (NKE) Stock Price TRI‐SIGNALS Prior to Market Open 12/2/2020
daily_trend: stock_direction_signal_1: stock_direction_signal_2:
stock_direction_signal_3: Linear (daily_trend:) Linear (stock_direction_signal_1:)
Linear (stock_direction_signal_2:) Linear (stock_direction_signal_3:)
IHA Consultants page 25
TRI-SIG
NAL
Predict
ive Equ
ity Ana
lytics
IHA C
onsu
ltants
Inc.
ihaco
nsult
ants.
com

December 2, 2020 IHA Consultants TRI‐SIGNAL Report for selected DJIA Stocks sorted by Highest Return
Verizon Communications Inc. (VZ) Stock Price TRI‐SIGNALS Prior to Market Open 12/2/2020 (VZ)Date Date Close PriceShort‐run Buy/Sell Long‐run Buy/Sell Signal 1 Signal 3
12/2/2020 12/2/202012/1/2020 12/1/2020 60.58 No Action Buy11/5/2020 11/5/2020 58.15 Buy11/4/2020 11/4/2020 57.22 Sell
10/22/2020 10/22/2020 57.33 Buy10/21/2020 10/21/2020 56.75 Sell9/15/2020 9/15/2020 60.6 Buy Buy 1 0.9757/28/2020 7/28/2020 57.48 Buy Buy 1 17/27/2020 7/27/2020 56.87 Buy Buy 1 0.9757/17/2020 7/17/2020 56.3 Buy7/9/2020 7/9/2020 53.94 Sell7/6/2020 7/6/2020 55.24 Buy
6/26/2020 6/26/2020 53.16 Sell6/19/2020 6/19/2020 56.16 Buy
URL Information Links: https://www.barrons.com/quote/stock/VZhttps://quotes.wsj.com/VZ?mod=md_home_hdr_searchhttps://finance.yahoo.com/quote/VZ?p=VZ&.tsrc=fin‐srch
0
5000000
10000000
15000000
20000000
25000000
30000000
35000000
0
10
20
30
40
50
60
70
80
Verizon Communications Inc. (VZ) Stock Price Time Series Prior to Market Open 12/2/2020: Est. ( L: 60.6, C: 60.6, H: 60.7 )
current_stock_price: trade_day_252_high: trade_day_252_low: volume: Linear (current_stock_price:)
0
0.2
0.4
0.6
0.8
1
1.2
Verizon Communications Inc. (VZ) Stock Price TRI‐SIGNALS Prior to Market Open 12/2/2020
daily_trend: stock_direction_signal_1: stock_direction_signal_2:
stock_direction_signal_3: Linear (daily_trend:) Linear (stock_direction_signal_1:)
Linear (stock_direction_signal_2:) Linear (stock_direction_signal_3:)
IHA Consultants page 26
TRI-SIG
NAL
Predict
ive Equ
ity Ana
lytics
IHA C
onsu
ltants
Inc.
ihaco
nsult
ants.
com

December 2, 2020 IHA Consultants TRI‐SIGNAL Report for selected DJIA Stocks sorted by Highest Return
Procter & Gamble Co. (PG) Stock Price TRI‐SIGNALS Prior to Market Open 12/2/2020 (PG)Date Date Close PriceShort‐run Buy/Sell Long‐run Buy/Sell Signal 1 Signal 3
12/2/2020 12/2/202012/1/2020 12/1/2020 139.37 No Action No Action
11/19/2020 11/19/2020 139.53 Buy11/18/2020 11/18/2020 139.7 Sell Buy11/17/2020 11/17/2020 141.88 Buy11/9/2020 11/9/2020 137.99 Sell11/5/2020 11/5/2020 142.38 Buy
10/28/2020 10/28/2020 137.66 Sell10/21/2020 10/21/2020 143.25 Sell Buy9/28/2020 9/28/2020 138.01 Buy9/25/2020 9/25/2020 137.62 Sell9/24/2020 9/24/2020 136.92 Buy Buy 0.9 19/22/2020 9/22/2020 137.96 Buy Buy 1 19/11/2020 9/11/2020 138.14 Buy Buy 1 0.9759/9/2020 9/9/2020 138.15 Sell Buy9/4/2020 9/4/2020 137.96 Monitor Buy9/3/2020 9/3/2020 138.26 Monitor Buy
7/31/2020 7/31/2020 131.12 No Action Buy7/7/2020 7/7/2020 122.22 Buy
6/26/2020 6/26/2020 115.23 Sell6/19/2020 6/19/2020 118.92 Buy
URL Information Links: https://www.barrons.com/quote/stock/PGhttps://quotes.wsj.com/PG?mod=md_home_hdr_searchhttps://finance.yahoo.com/quote/PG?p=PG&.tsrc=fin‐srch
0
5000000
10000000
15000000
20000000
25000000
0
20
40
60
80
100
120
140
160
Procter & Gamble Co. (PG) Stock Price Time Series Prior to Market Open 12/2/2020: Est. ( L: 138.7, C: 139.4, H: 139.4 )
current_stock_price: trade_day_252_high: trade_day_252_low: volume: Linear (current_stock_price:)
0
0.2
0.4
0.6
0.8
1
1.2
Procter & Gamble Co. (PG) Stock Price TRI‐SIGNALS Prior to Market Open 12/2/2020
daily_trend: stock_direction_signal_1: stock_direction_signal_2:
stock_direction_signal_3: Linear (daily_trend:) Linear (stock_direction_signal_1:)
Linear (stock_direction_signal_2:) Linear (stock_direction_signal_3:)
IHA Consultants page 27
TRI-SIG
NAL
Predict
ive Equ
ity Ana
lytics
IHA C
onsu
ltants
Inc.
ihaco
nsult
ants.
com