augur consulting, s.r.o. final report „a study of the language skills of the czech population“...
TRANSCRIPT
Augur Consulting, s.r.o.Final report„A study of the language skills of the Czech population“ November 2008

Comparison of the Results – Knowledge of Foreign Languages
Knowledge of at least one foreign language – all levels
Source: Augur Consulting, s.r.o., 2008
Comparison of the Results – Knowledge of Foreign Languages
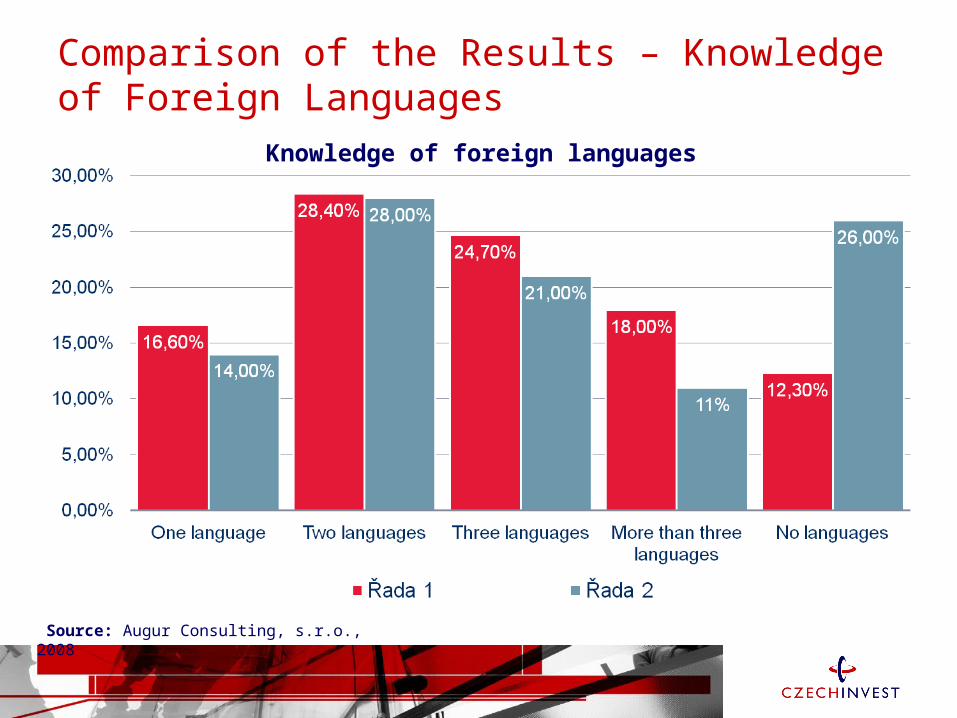
Knowledge of foreign languages
Source: Augur Consulting, s.r.o., 2008

Knowledge of Foreign Languages
More than a quarter of those interviewed (28.4 %) can speak two foreign languages well enough to be able to read and understand a simple text of a general nature, in addition to their native language. A quarter of respondents (24.7 %) can speak three foreign languages, while almost a fifth of respondents (18.0 %) can speak more than three languages. A sixth of those interviewed (16.6 %) can speak only one foreign language well enough to be able to read and understand a simple text of a general nature. More than a tenth of those interviewed (12.3 %) aged between 18 and 59 said that they do not speak any foreign language.The question was answered by 100 % respondents.
How many languages (in addition to your native language) do you speak well enough to be able to read and understand a simple text
of a general nature?
Source: Augur Consulting, s.r.o., 2008
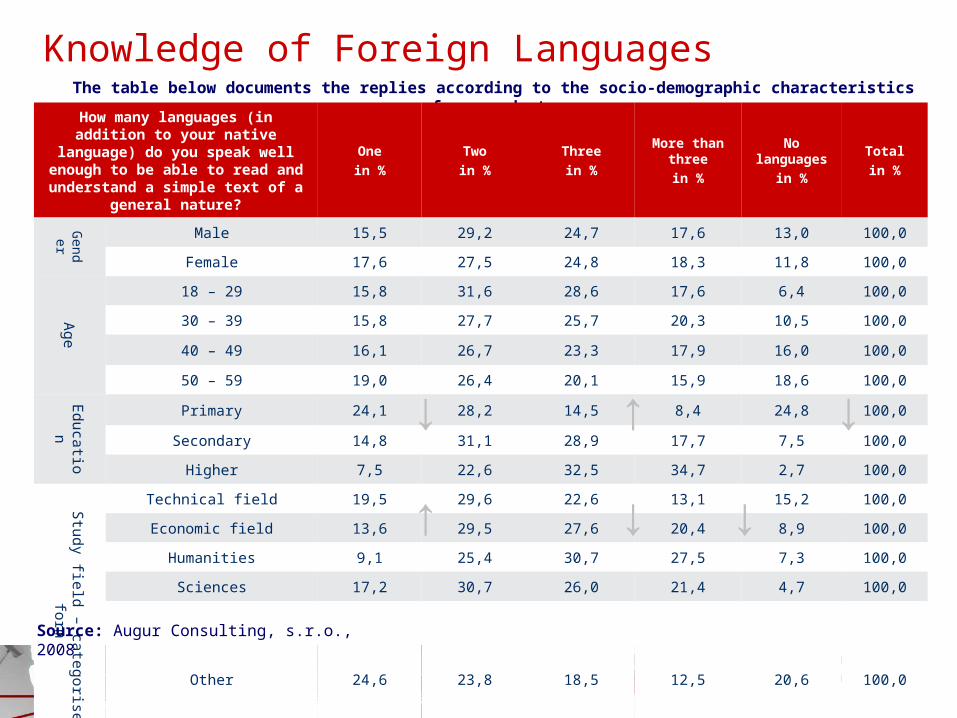
Knowledge of Foreign LanguagesThe table below documents the replies according to the socio-demographic characteristics of respondents.
How many languages (in addition to your native language) do you speak well enough to be able to read and
understand a simple text of a general nature?
One
in %
Two
in %
Three
in %
More than three
in %
No languages
in %
Total
in %
Gender
Male 15,5 29,2 24,7 17,6 13,0 100,0
Female 17,6 27,5 24,8 18,3 11,8 100,0
Age
18 – 29 15,8 31,6 28,6 17,6 6,4 100,0
30 – 39 15,8 27,7 25,7 20,3 10,5 100,0
40 – 49 16,1 26,7 23,3 17,9 16,0 100,0
50 – 59 19,0 26,4 20,1 15,9 18,6 100,0
Educatio
n
Primary 24,1 28,2 14,5 8,4 24,8 100,0
Secondary 14,8 31,1 28,9 17,7 7,5 100,0
Higher 7,5 22,6 32,5 34,7 2,7 100,0
Study field – categorised
form
Technical field 19,5 29,6 22,6 13,1 15,2 100,0
Economic field 13,6 29,5 27,6 20,4 8,9 100,0
Humanities 9,1 25,4 30,7 27,5 7,3 100,0
Sciences 17,2 30,7 26,0 21,4 4,7 100,0
Other 24,6 23,8 18,5 12,5 20,6 100,0
↓ ↑
↑ ↓ ↓
↓
Source: Augur Consulting, s.r.o., 2008
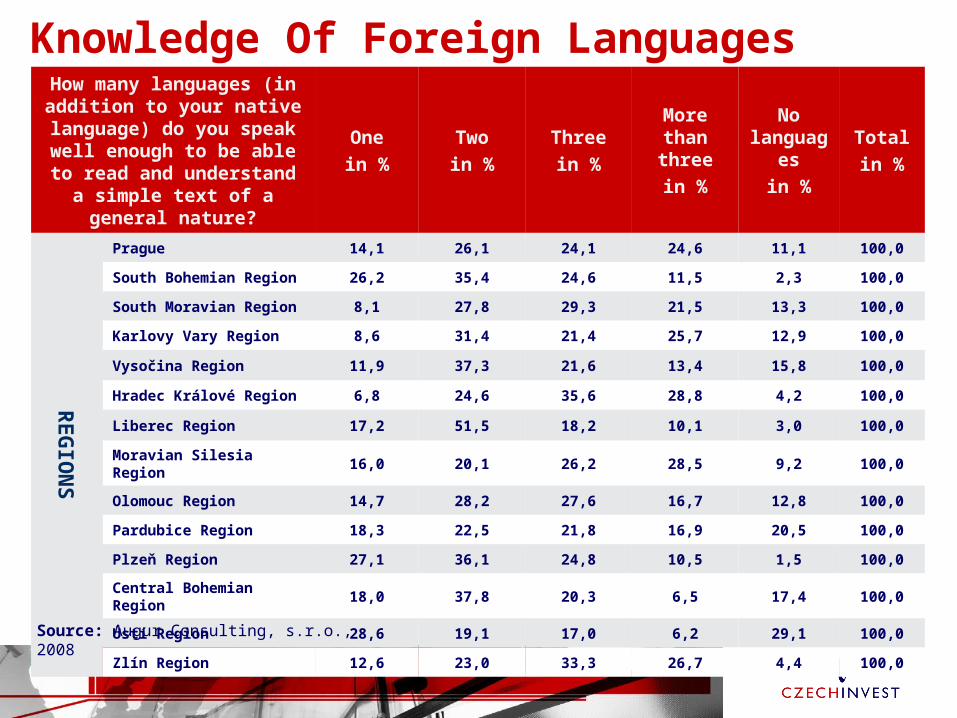
Knowledge Of Foreign LanguagesHow many languages (in addition to your native
language) do you speak well enough to be able to read
and understand a simple text of a general nature?
One
in %
Two
in %
Three
in %
More than three
in %
No language
s
in %
Total
in %
RE
GIO
NS
Prague 14,1 26,1 24,1 24,6 11,1 100,0
South Bohemian Region 26,2 35,4 24,6 11,5 2,3 100,0
South Moravian Region 8,1 27,8 29,3 21,5 13,3 100,0
Karlovy Vary Region 8,6 31,4 21,4 25,7 12,9 100,0
Vysočina Region 11,9 37,3 21,6 13,4 15,8 100,0
Hradec Králové Region 6,8 24,6 35,6 28,8 4,2 100,0
Liberec Region 17,2 51,5 18,2 10,1 3,0 100,0
Moravian Silesia Region 16,0 20,1 26,2 28,5 9,2 100,0
Olomouc Region 14,7 28,2 27,6 16,7 12,8 100,0
Pardubice Region 18,3 22,5 21,8 16,9 20,5 100,0
Plzeň Region 27,1 36,1 24,8 10,5 1,5 100,0
Central Bohemian Region 18,0 37,8 20,3 6,5 17,4 100,0
Ústí Region 28,6 19,1 17,0 6,2 29,1 100,0
Zlín Region 12,6 23,0 33,3 26,7 4,4 100,0
Source: Augur Consulting, s.r.o., 2008
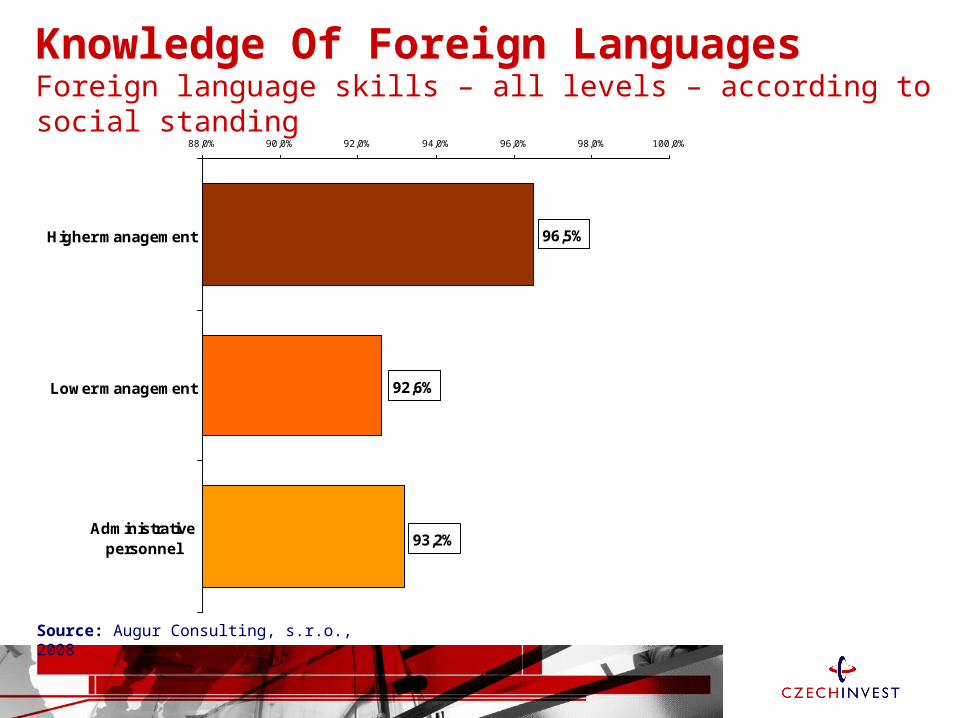
Knowledge Of Foreign LanguagesForeign language skills – all levels – according to social standing
Source: Augur Consulting, s.r.o., 2008
93,2%
92,6%
96,5%
88,0% 90,0% 92,0% 94,0% 96,0% 98,0% 100,0%
Higher management
Lower management
Administrativepersonnel
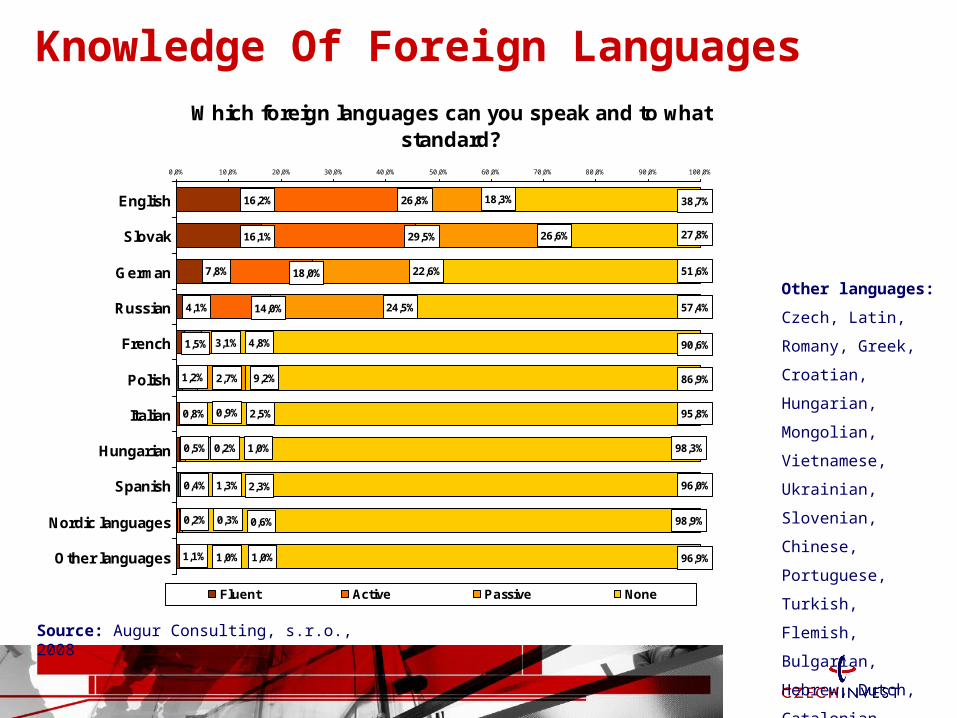
Knowledge Of Foreign Languages
Source: Augur Consulting, s.r.o., 2008
Which foreign languages can you speak and to what standard?
1,5%
4,1%
7,8%
16,1%
16,2%
1,2%
0,8%
0,5%
0,4%
0,2%
1,1%
26,8%
29,5%
18,0%
14,0%
3,1%
2,7%
0,9%
0,2%
1,3%
0,3%
1,0% 1,0%
0,6%
2,3%
1,0%
18,3%
26,6%
22,6%
24,5%
4,8%
9,2%
2,5%
96,9%
98,9%
96,0%
98,3%
38,7%
27,8%
51,6%
57,4%
90,6%
86,9%
95,8%
0,0% 10,0% 20,0% 30,0% 40,0% 50,0% 60,0% 70,0% 80,0% 90,0% 100,0%
English
Slovak
German
Russian
French
Polish
Italian
Hungarian
Spanish
Nordic languages
Other languages
Fluent Active Passive None
Other languages:
Czech, Latin,
Romany, Greek,
Croatian, Hungarian,
Mongolian,
Vietnamese,
Ukrainian, Slovenian,
Chinese, Portuguese,
Turkish, Flemish,
Bulgarian, Hebrew,
Dutch, Catalonian.

Knowledge of Foreign LanguagesThe table below documents the replies according to the socio-demographic characteristics of respondents.
Which foreign languages can you speak and to what standard?
English
in %
German
in %
Russian
in %
Fluent Active Fluent Active Fluent Active
Gen
der
Male 14,9 28,1 7,7 17,3 3,2 14,3
Female 17,4 25,6 8,0 18,6 4,8 13,8
Ag
e
18 – 29 24,7 41,5 9,0 23,8 1,2 3,0
30 – 39 18,8 28,0 7,0 16,9 3,1 12,6
40 – 49 10,6 21,3 8,7 13,4 6,6 22,6
50 – 59 6,3 8,8 6,1 15,4 6,8 22,9
Ed
ucation
Primary 7,7 16,4 2,3 9,7 2,1 8,6
Secondary 15,0 29,1 8,1 19,7 3,5 13,8
Higher 30,0 35,3 14,1 24,7 7,7 21,6
Stu
dy field
– catego
rised
form
Technical field 10,5 20,7 4,6 12,0 3,5 12,8
Economic field 20,2 31,3 10,5 22,7 4,4 14,4
Humanities 23,9 35,3 13,8 22,7 5,7 18,4
Sciences 12,6 29,5 5,5 23,5 6,0 15,8
Other 18,3 19,3 5,6 14,2 1,5 8,1
Source: Augur Consulting, s.r.o., 2008

Knowledge of Foreign LanguagesThe table below documents the replies according to the socio-demographic characteristics of respondents.
Which foreign languages can you speak and to what standard?
French
in %
Polish
in %
Italian
in %
Fluent Active Fluent Active Fluent Active
Gen
der
Male 0,7 2,8 1,4 3,4 0,7 0,6
Female 2,3 3,4 1,0 2,0 0,8 1,1
Ag
e
18 – 29 2,1 4,7 0,2 2,0 0,9 0,8
30 – 39 1,6 2,9 1,9 2,3 0,6 1,6
40 – 49 1,3 1,9 1,7 3,2 0,6 0,9
50 – 59 0,9 2,3 1,4 3,6 0,9 0,2
Ed
ucation
Primary 0,7 2,3 1,2 2,3 0,3 0,3
Secondary 0,9 3,0 1,0 3,1 0,8 1,1
Higher 4,2 4,6 1,8 2,4 1,3 1,1
Stu
dy field
– catego
rised
form
Technical field 0,4 1,8 1,5 2,9 0,3 0,4
Economic field 1,3 3,1 0,9 2,0 1,5 1,5
Humanities 5,5 5,5 0,6 4,0 1,1 0,9
Sciences 0,5 0,5 2,7 1,6 0,5 1,1
Other 1,0 6,1 0,5 2,0 0,0 1,0Source: Augur Consulting, s.r.o., 2008
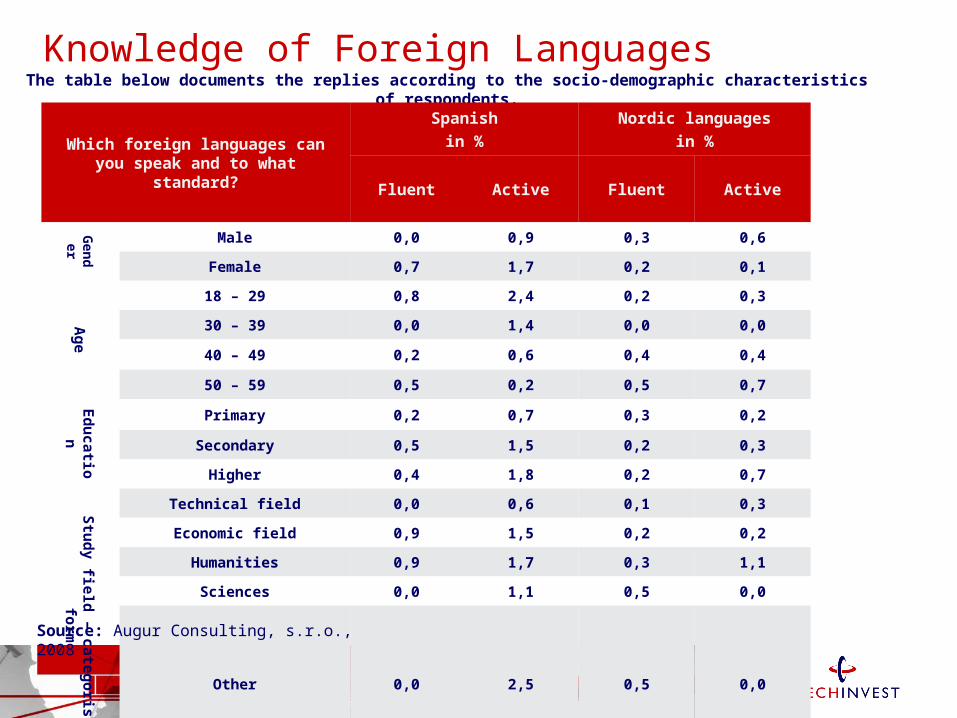
Knowledge of Foreign LanguagesThe table below documents the replies according to the socio-demographic characteristics of respondents.
Which foreign languages can you speak and to what standard?
Spanish
in %
Nordic languages
in %
Fluent Active Fluent Active
Gen
der
Male 0,0 0,9 0,3 0,6
Female 0,7 1,7 0,2 0,1
Ag
e
18 – 29 0,8 2,4 0,2 0,3
30 – 39 0,0 1,4 0,0 0,0
40 – 49 0,2 0,6 0,4 0,4
50 – 59 0,5 0,2 0,5 0,7
Ed
ucation
Primary 0,2 0,7 0,3 0,2
Secondary 0,5 1,5 0,2 0,3
Higher 0,4 1,8 0,2 0,7
Stu
dy field
– catego
rised
form
Technical field 0,0 0,6 0,1 0,3
Economic field 0,9 1,5 0,2 0,2
Humanities 0,9 1,7 0,3 1,1
Sciences 0,0 1,1 0,5 0,0
Other 0,0 2,5 0,5 0,0Source: Augur Consulting, s.r.o., 2008
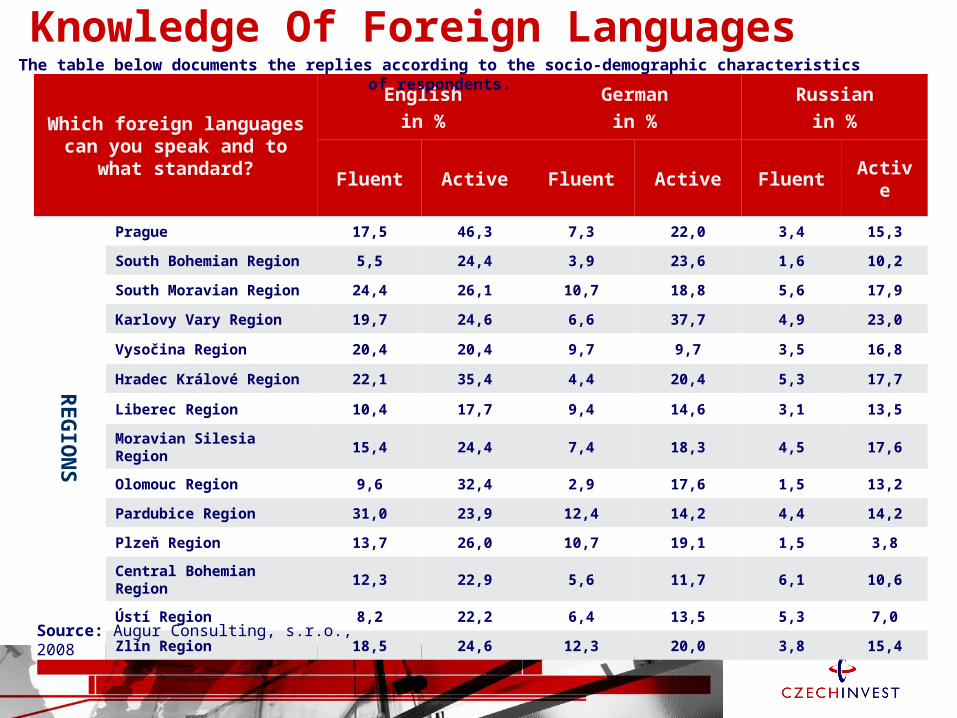
Knowledge Of Foreign Languages
Which foreign languages can you speak and to what
standard?
English
in %
German
in %
Russian
in %
Fluent Active Fluent Active Fluent Active
RE
GIO
NS
Prague 17,5 46,3 7,3 22,0 3,4 15,3
South Bohemian Region 5,5 24,4 3,9 23,6 1,6 10,2
South Moravian Region 24,4 26,1 10,7 18,8 5,6 17,9
Karlovy Vary Region 19,7 24,6 6,6 37,7 4,9 23,0
Vysočina Region 20,4 20,4 9,7 9,7 3,5 16,8
Hradec Králové Region 22,1 35,4 4,4 20,4 5,3 17,7
Liberec Region 10,4 17,7 9,4 14,6 3,1 13,5
Moravian Silesia Region 15,4 24,4 7,4 18,3 4,5 17,6
Olomouc Region 9,6 32,4 2,9 17,6 1,5 13,2
Pardubice Region 31,0 23,9 12,4 14,2 4,4 14,2
Plzeň Region 13,7 26,0 10,7 19,1 1,5 3,8
Central Bohemian Region 12,3 22,9 5,6 11,7 6,1 10,6
Ústí Region 8,2 22,2 6,4 13,5 5,3 7,0
Zlín Region 18,5 24,6 12,3 20,0 3,8 15,4
Source: Augur Consulting, s.r.o., 2008
The table below documents the replies according to the socio-demographic characteristics of respondents.

Knowledge Of Foreign Languages
Which foreign languages can you speak and to what
standard?
French
in %
Polish
in %
Italian
in %
Fluent Active Fluent Active Fluent Active
RE
GIO
NS
Prague 0,6 5,1 0,6 1,1 0,6 1,7
South Bohemian Region 0,0 1,6 0,8 0,8 0,8 0,0
South Moravian Region 2,6 2,6 0,9 0,4 0,9 0,9
Karlovy Vary Region 1,6 6,6 0,0 1,6 3,3 1,6
Vysočina Region 4,4 0,0 0,0 0,0 1,8 1,8
Hradec Králové Region 4,4 8,8 0,9 1,8 0,0 0,9
Liberec Region 0,0 1,0 0,0 1,0 0,0 2,1
Moravian Silesia Region 1,3 0,6 5,8 13,5 0,6 0,3
Olomouc Region 1,5 5,1 0,0 1,5 0,7 0,0
Pardubice Region 2,7 5,3 0,0 0,9 0,9 0,9
Plzeň Region 0,0 2,3 0,0 0,0 0,0 0,0
Central Bohemian Region 0,6 2,2 0,6 0,6 0,6 0,0
Ústí Region 0,6 2,9 0,6 0,0 1,8 0,6
Zlín Region 2,3 4,6 0,0 1,5 0,0 3,1
Source: Augur Consulting, s.r.o., 2008
The table below documents the replies according to the socio-demographic characteristics of respondents.
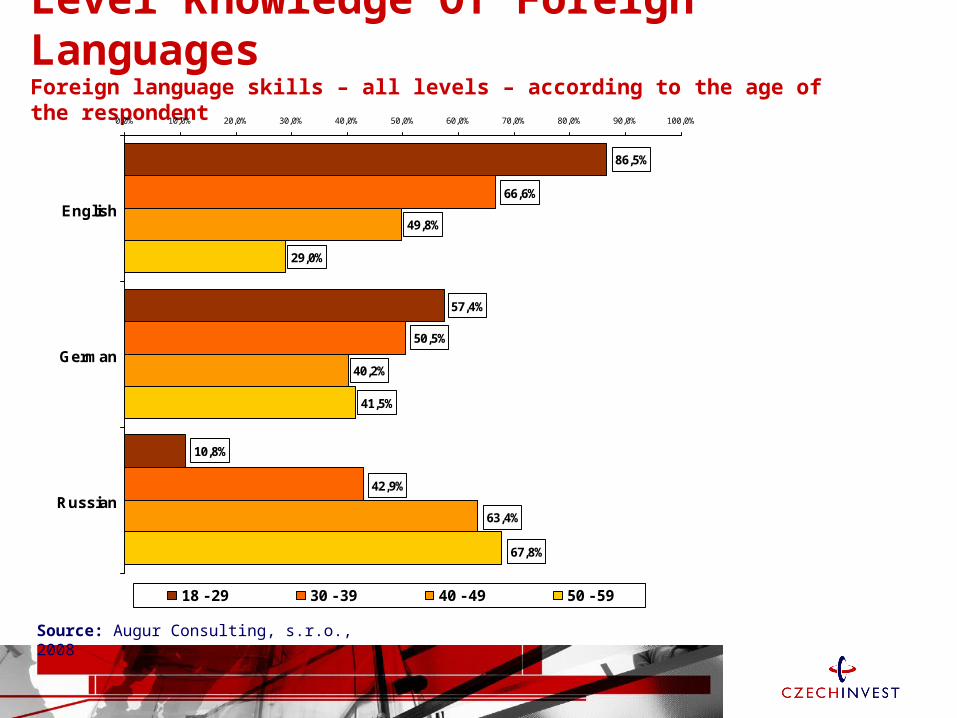
Level Knowledge Of Foreign LanguagesForeign language skills – all levels – according to the age of the respondent
Source: Augur Consulting, s.r.o., 2008
49,8%
40,2%
29,0%
41,5%
10,8%
57,4%
86,5%
42,9%
50,5%
66,6%
63,4%
67,8%
0,0% 10,0% 20,0% 30,0% 40,0% 50,0% 60,0% 70,0% 80,0% 90,0% 100,0%
English
German
Russian
18 - 29 30 - 39 40 - 49 50 - 59
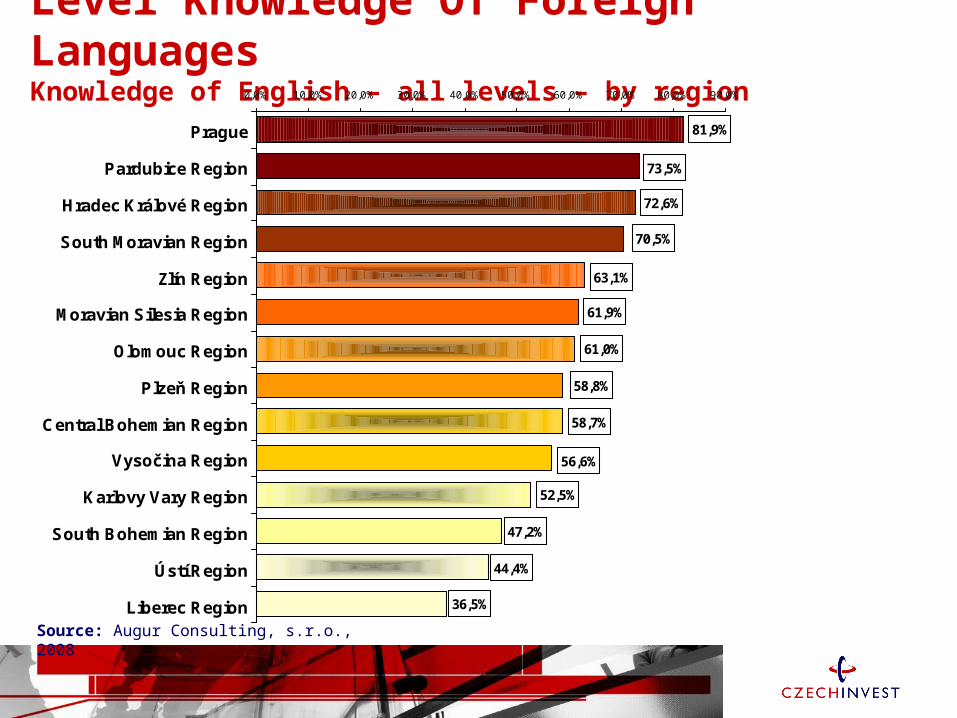
Level Knowledge Of Foreign LanguagesKnowledge of English – all levels – by region
Source: Augur Consulting, s.r.o., 2008
47,2%
44,4%
36,5%
63,1%
70,5%
72,6%
73,5%
81,9%
61,9%
61,0%
58,8%
58,7%
56,6%
52,5%
0,0% 10,0% 20,0% 30,0% 40,0% 50,0% 60,0% 70,0% 80,0% 90,0%
Prague
Pardubice Region
Hradec Králové Region
South Moravian Region
Zlín Region
Moravian Silesia Region
Olomouc Region
Plzeň Region
Central Bohemian Region
Vysočina Region
Karlovy Vary Region
South Bohemian Region
Ústí Region
Liberec Region
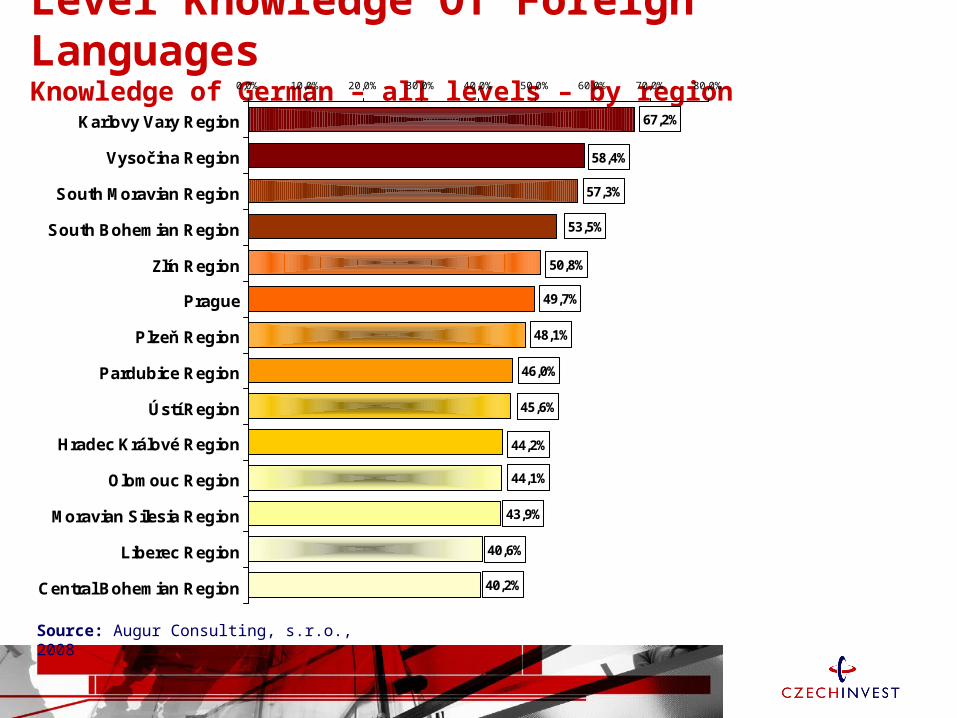
Level Knowledge Of Foreign LanguagesKnowledge of German – all levels – by region
Source: Augur Consulting, s.r.o., 2008
43,9%
40,6%
40,2%
50,8%
53,5%
57,3%
58,4%
67,2%
49,7%
48,1%
46,0%
45,6%
44,2%
44,1%
0,0% 10,0% 20,0% 30,0% 40,0% 50,0% 60,0% 70,0% 80,0%
Karlovy Vary Region
Vysočina Region
South Moravian Region
South Bohemian Region
Zlín Region
Prague
Plzeň Region
Pardubice Region
Ústí Region
Hradec Králové Region
Olomouc Region
Moravian Silesia Region
Liberec Region
Central Bohemian Region
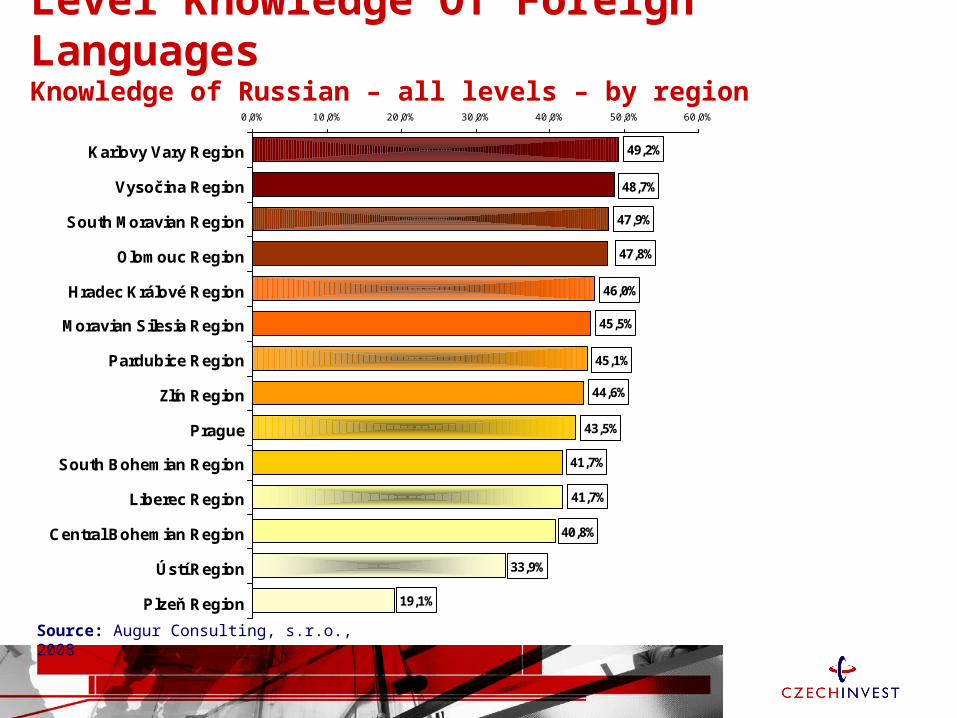
Level Knowledge Of Foreign LanguagesKnowledge of Russian – all levels – by region
Source: Augur Consulting, s.r.o., 2008
40,8%
33,9%
19,1%
46,0%
47,8%
47,9%
48,7%
49,2%
45,5%
45,1%
44,6%
43,5%
41,7%
41,7%
0,0% 10,0% 20,0% 30,0% 40,0% 50,0% 60,0%
Karlovy Vary Region
Vysočina Region
South Moravian Region
Olomouc Region
Hradec Králové Region
Moravian Silesia Region
Pardubice Region
Zlín Region
Prague
South Bohemian Region
Liberec Region
Central Bohemian Region
Ústí Region
Plzeň Region
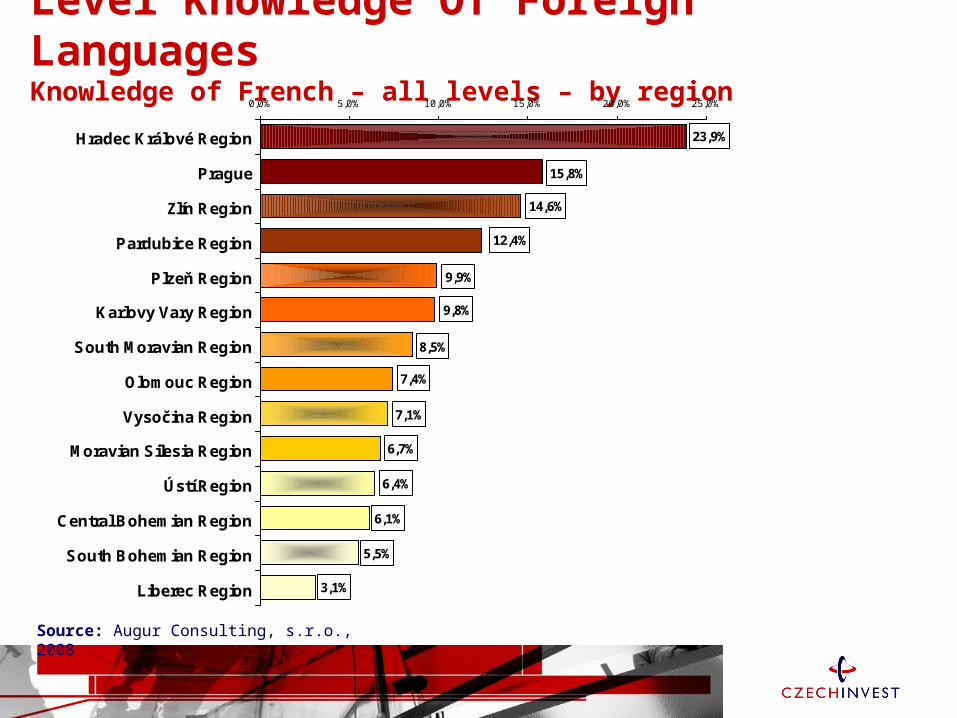
Level Knowledge Of Foreign LanguagesKnowledge of French – all levels – by region
Source: Augur Consulting, s.r.o., 2008
6,1%
5,5%
3,1%
9,9%
12,4%
14,6%
15,8%
23,9%
9,8%
8,5%
7,4%
7,1%
6,7%
6,4%
0,0% 5,0% 10,0% 15,0% 20,0% 25,0%
Hradec Králové Region
Prague
Zlín Region
Pardubice Region
Plzeň Region
Karlovy Vary Region
South Moravian Region
Olomouc Region
Vysočina Region
Moravian Silesia Region
Ústí Region
Central Bohemian Region
South Bohemian Region
Liberec Region
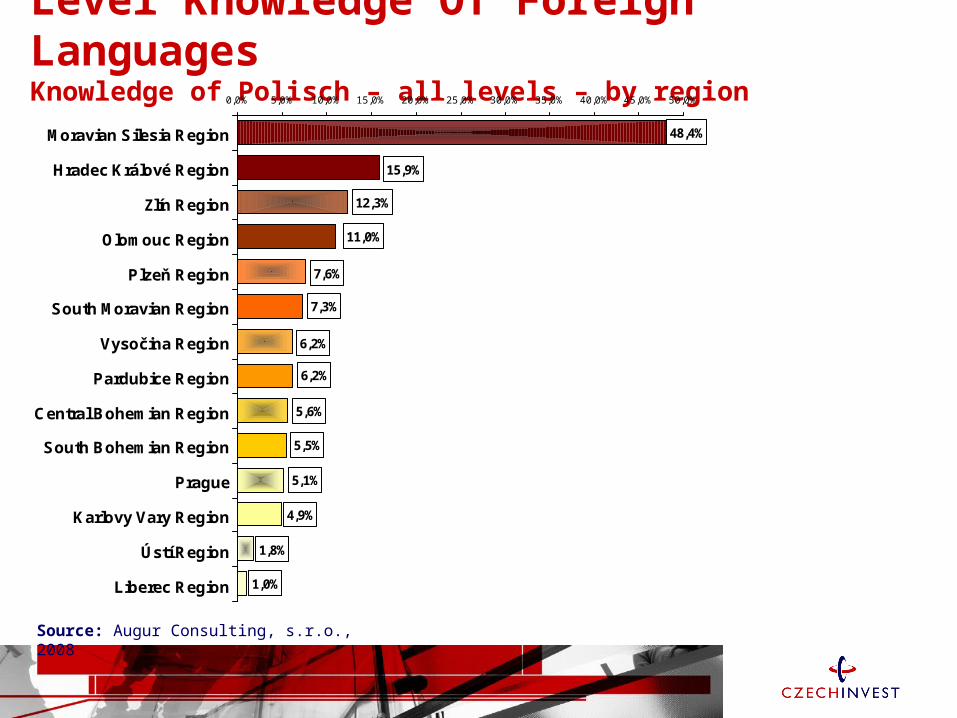
Level Knowledge Of Foreign LanguagesKnowledge of Polisch – all levels – by region
Source: Augur Consulting, s.r.o., 2008
4,9%
1,8%
1,0%
7,6%
11,0%
12,3%
15,9%
48,4%
7,3%
6,2%
6,2%
5,6%
5,5%
5,1%
0,0% 5,0% 10,0% 15,0% 20,0% 25,0% 30,0% 35,0% 40,0% 45,0% 50,0%
Moravian Silesia Region
Hradec Králové Region
Zlín Region
Olomouc Region
Plzeň Region
South Moravian Region
Vysočina Region
Pardubice Region
Central Bohemian Region
South Bohemian Region
Prague
Karlovy Vary Region
Ústí Region
Liberec Region
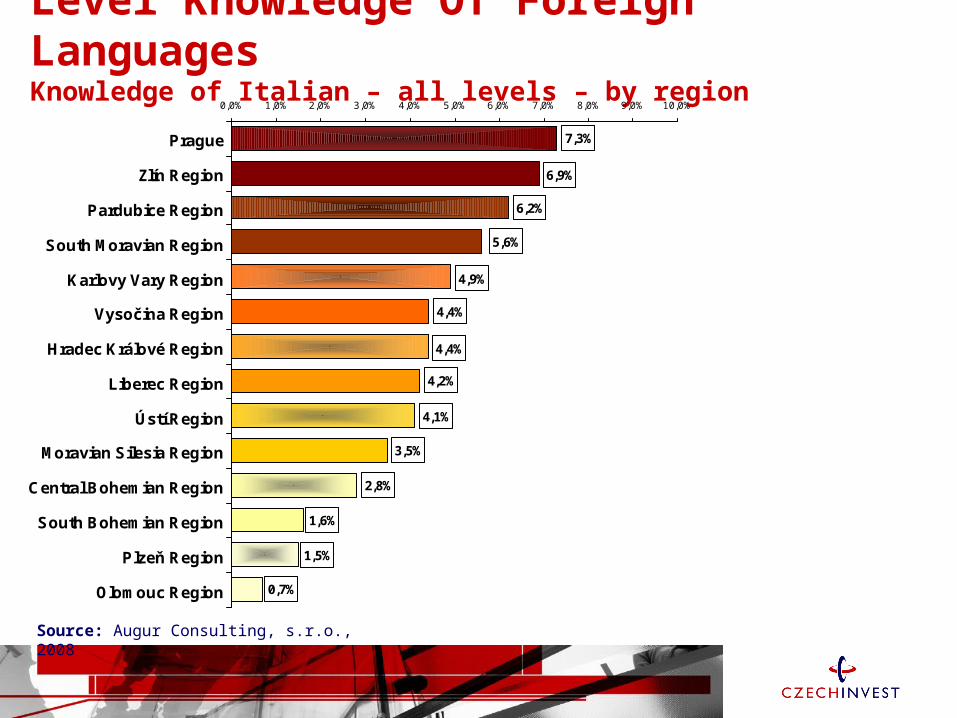
Level Knowledge Of Foreign LanguagesKnowledge of Italian – all levels – by region
Source: Augur Consulting, s.r.o., 2008
1,6%
1,5%
0,7%
4,9%
5,6%
6,2%
6,9%
7,3%
4,4%
4,4%
4,2%
4,1%
3,5%
2,8%
0,0% 1,0% 2,0% 3,0% 4,0% 5,0% 6,0% 7,0% 8,0% 9,0% 10,0%
Prague
Zlín Region
Pardubice Region
South Moravian Region
Karlovy Vary Region
Vysočina Region
Hradec Králové Region
Liberec Region
Ústí Region
Moravian Silesia Region
Central Bohemian Region
South Bohemian Region
Plzeň Region
Olomouc Region
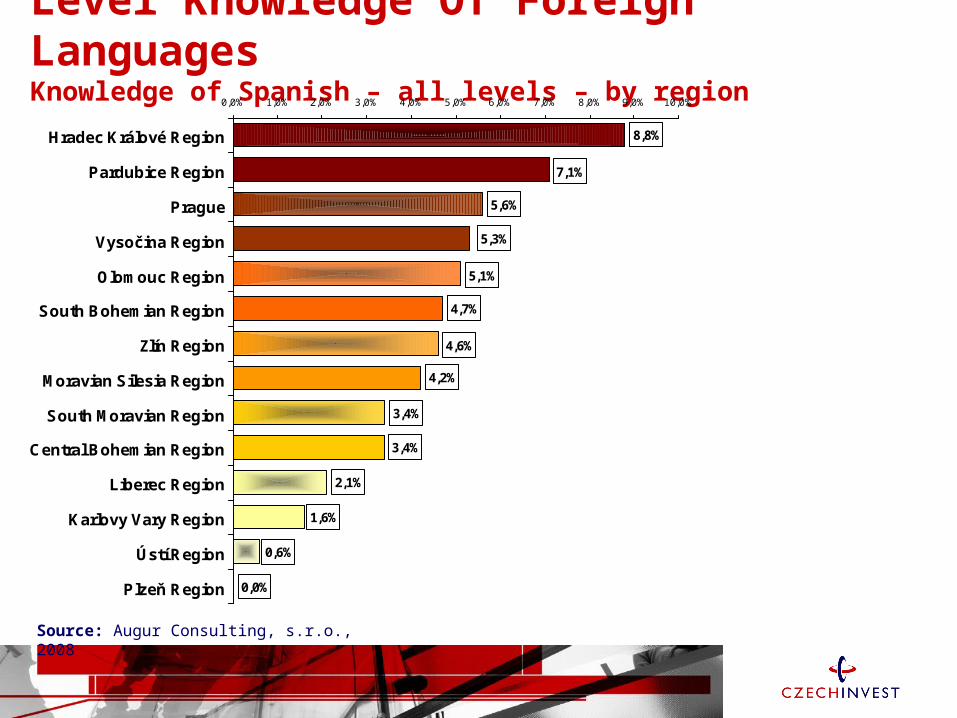
Level Knowledge Of Foreign LanguagesKnowledge of Spanish – all levels – by region
Source: Augur Consulting, s.r.o., 2008
1,6%
0,6%
0,0%
5,1%
5,3%
5,6%
7,1%
8,8%
4,7%
4,6%
4,2%
3,4%
3,4%
2,1%
0,0% 1,0% 2,0% 3,0% 4,0% 5,0% 6,0% 7,0% 8,0% 9,0% 10,0%
Hradec Králové Region
Pardubice Region
Prague
Vysočina Region
Olomouc Region
South Bohemian Region
Zlín Region
Moravian Silesia Region
South Moravian Region
Central Bohemian Region
Liberec Region
Karlovy Vary Region
Ústí Region
Plzeň Region
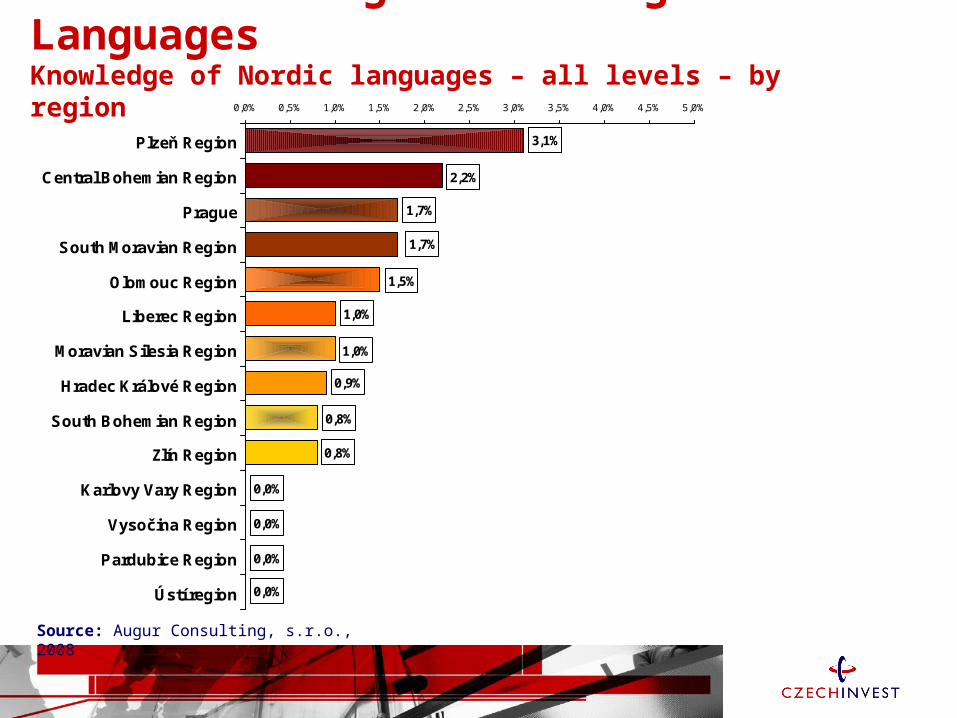
Level Knowledge Of Foreign LanguagesKnowledge of Nordic languages – all levels – by region
Source: Augur Consulting, s.r.o., 2008
0,0%
0,0%
0,0%
1,5%
1,7%
1,7%
2,2%
3,1%
1,0%
1,0%
0,9%
0,8%
0,8%
0,0%
0,0% 0,5% 1,0% 1,5% 2,0% 2,5% 3,0% 3,5% 4,0% 4,5% 5,0%
Plzeň Region
Central Bohemian Region
Prague
South Moravian Region
Olomouc Region
Liberec Region
Moravian Silesia Region
Hradec Králové Region
South Bohemian Region
Zlín Region
Karlovy Vary Region
Vysočina Region
Pardubice Region
Ústí region
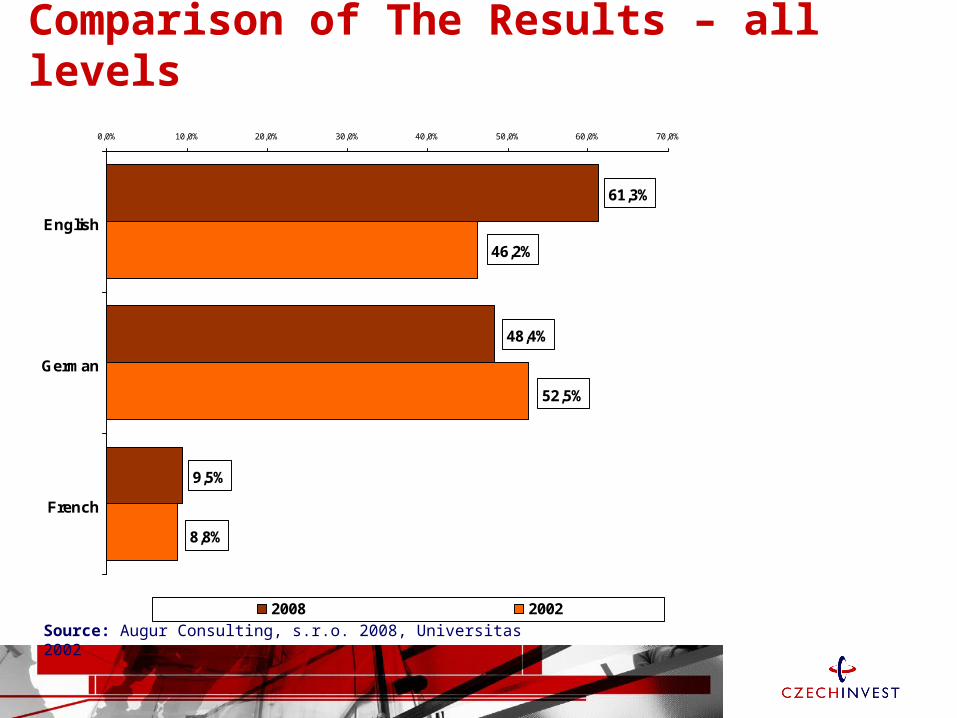
Comparison of The Results – all levels
Source: Augur Consulting, s.r.o. 2008, Universitas 2002
9,5%
48,4%
61,3%
8,8%
52,5%
46,2%
0,0% 10,0% 20,0% 30,0% 40,0% 50,0% 60,0% 70,0%
English
German
French
2008 2002
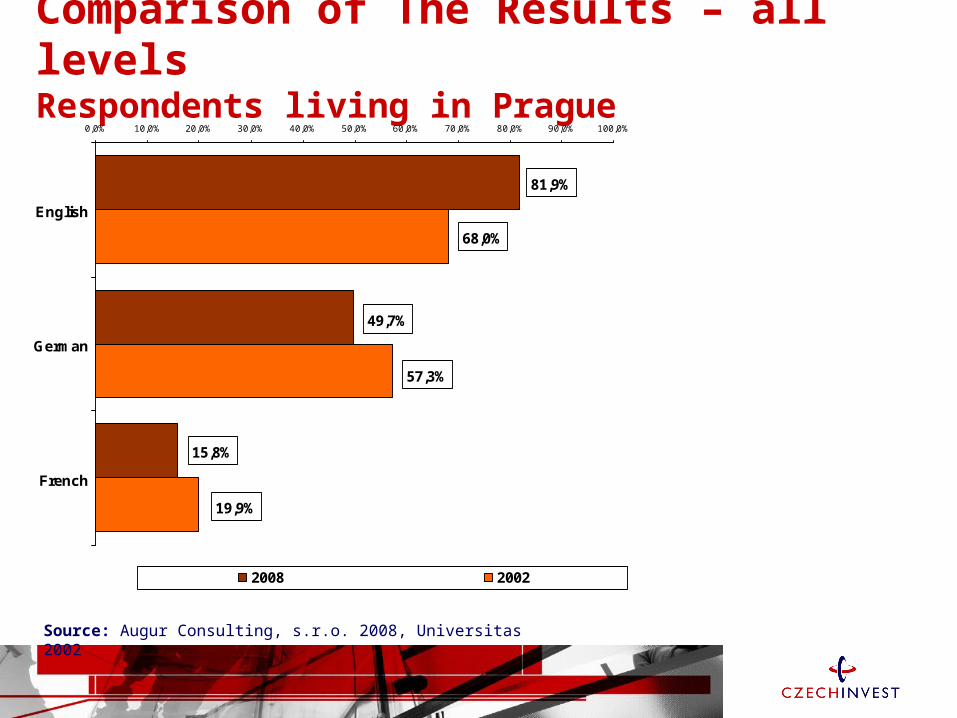
Comparison of The Results – all levelsRespondents living in Prague
Source: Augur Consulting, s.r.o. 2008, Universitas 2002
81,9%
49,7%
15,8%
57,3%
19,9%
68,0%
0,0% 10,0% 20,0% 30,0% 40,0% 50,0% 60,0% 70,0% 80,0% 90,0% 100,0%
English
German
French
2008 2002
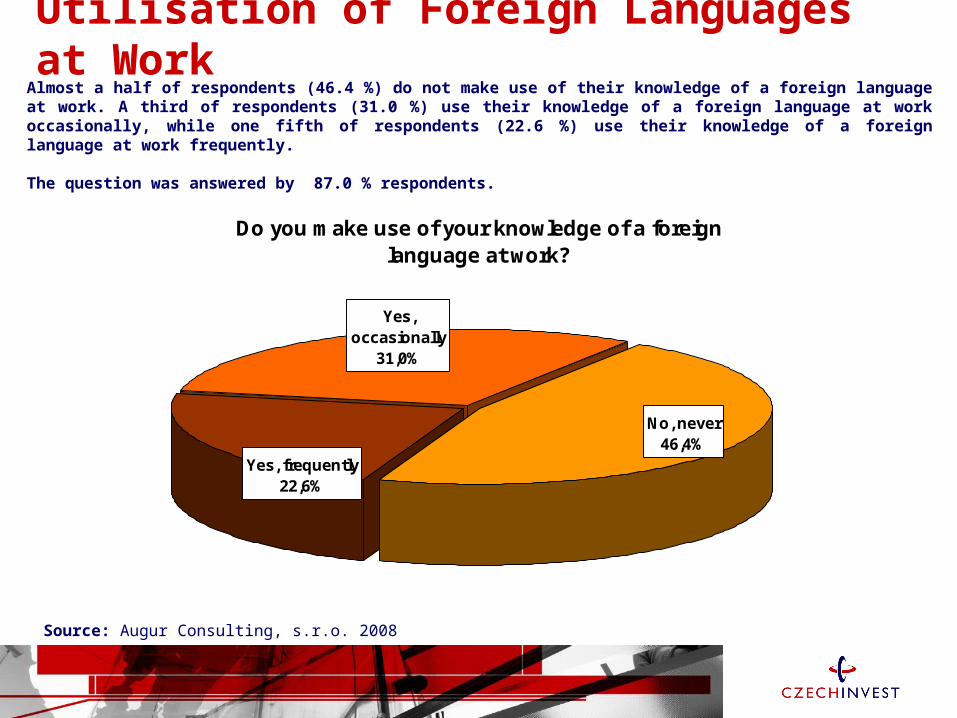
Utilisation of Foreign Languages at Work
Source: Augur Consulting, s.r.o. 2008
Almost a half of respondents (46.4 %) do not make use of their knowledge of a foreign language at work. A third of respondents (31.0 %) use their knowledge of a foreign language at work occasionally, while one fifth of respondents (22.6 %) use their knowledge of a foreign language at work frequently.
The question was answered by 87.0 % respondents.
Do you make use of your knowledge of a foreign language at work?
No, never46,4%
Yes, occasionally
31,0%
Yes, frequently22,6%
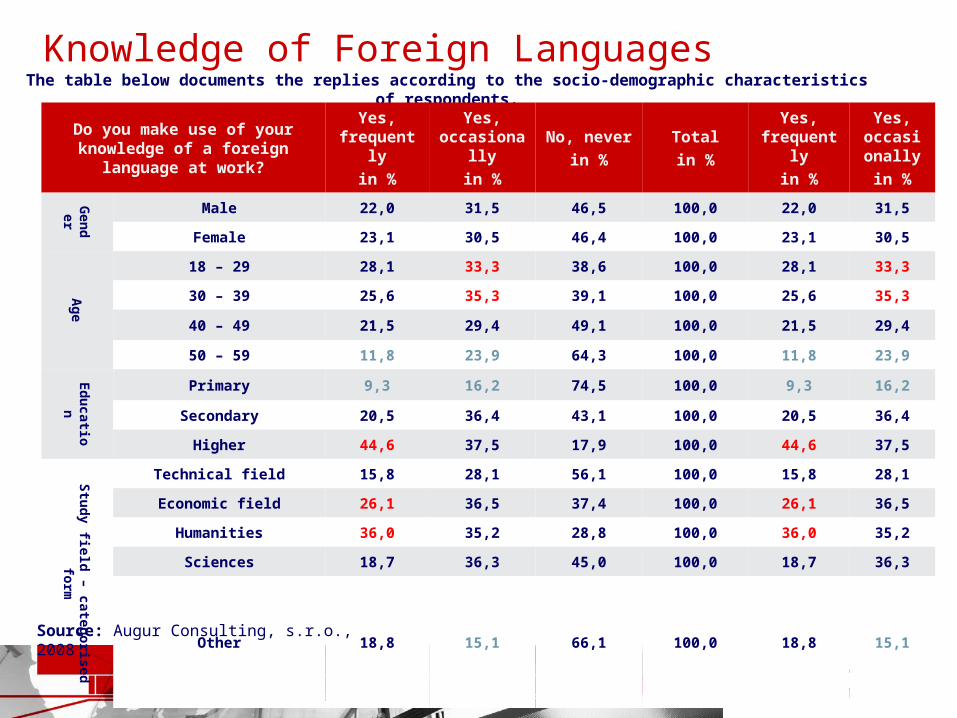
Knowledge of Foreign LanguagesThe table below documents the replies according to the socio-demographic characteristics of respondents.
Do you make use of your knowledge of a foreign language
at work?
Yes, frequently
in %
Yes, occasionall
y
in %
No, never
in %
Total
in %
Yes, frequently
in %
Yes, occasio
nally
in %
Gen
der
Male 22,0 31,5 46,5 100,0 22,0 31,5
Female 23,1 30,5 46,4 100,0 23,1 30,5
Ag
e
18 – 29 28,1 33,3 38,6 100,0 28,1 33,3
30 – 39 25,6 35,3 39,1 100,0 25,6 35,3
40 – 49 21,5 29,4 49,1 100,0 21,5 29,4
50 – 59 11,8 23,9 64,3 100,0 11,8 23,9
Ed
ucation
Primary 9,3 16,2 74,5 100,0 9,3 16,2
Secondary 20,5 36,4 43,1 100,0 20,5 36,4
Higher 44,6 37,5 17,9 100,0 44,6 37,5
Stu
dy field
– catego
rised
form
Technical field 15,8 28,1 56,1 100,0 15,8 28,1
Economic field 26,1 36,5 37,4 100,0 26,1 36,5
Humanities 36,0 35,2 28,8 100,0 36,0 35,2
Sciences 18,7 36,3 45,0 100,0 18,7 36,3
Other 18,8 15,1 66,1 100,0 18,8 15,1
Source: Augur Consulting, s.r.o., 2008
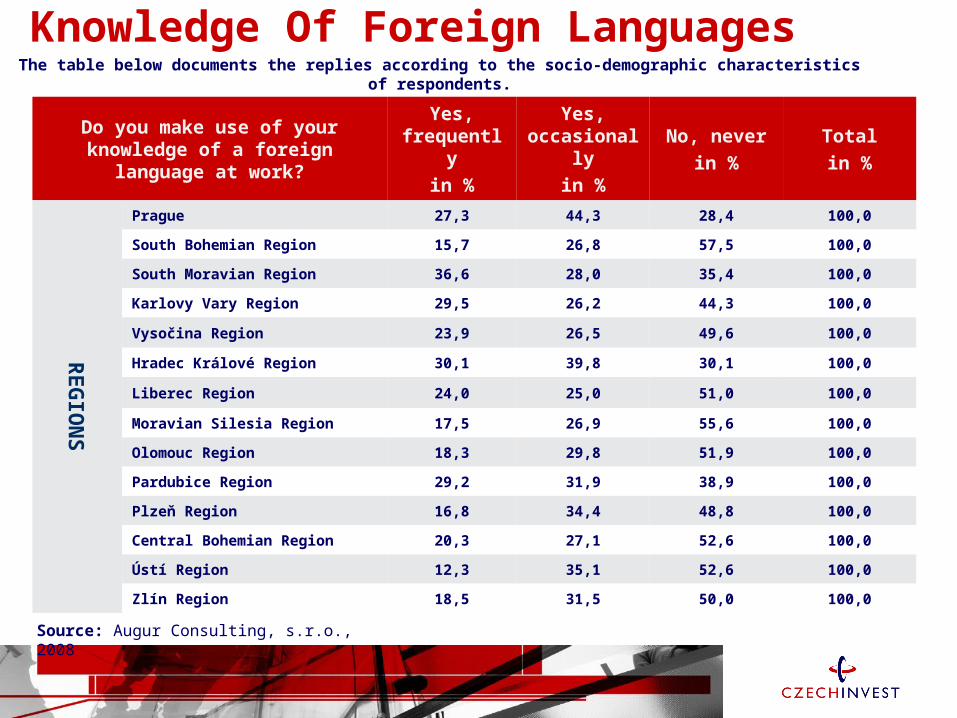
Knowledge Of Foreign Languages
Do you make use of your knowledge of a foreign language at work?
Yes, frequently
in %
Yes, occasionally
in %
No, never
in %
Total
in %
RE
GIO
NS
Prague 27,3 44,3 28,4 100,0
South Bohemian Region 15,7 26,8 57,5 100,0
South Moravian Region 36,6 28,0 35,4 100,0
Karlovy Vary Region 29,5 26,2 44,3 100,0
Vysočina Region 23,9 26,5 49,6 100,0
Hradec Králové Region 30,1 39,8 30,1 100,0
Liberec Region 24,0 25,0 51,0 100,0
Moravian Silesia Region 17,5 26,9 55,6 100,0
Olomouc Region 18,3 29,8 51,9 100,0
Pardubice Region 29,2 31,9 38,9 100,0
Plzeň Region 16,8 34,4 48,8 100,0
Central Bohemian Region 20,3 27,1 52,6 100,0
Ústí Region 12,3 35,1 52,6 100,0
Zlín Region 18,5 31,5 50,0 100,0
Source: Augur Consulting, s.r.o., 2008
The table below documents the replies according to the socio-demographic characteristics of respondents.
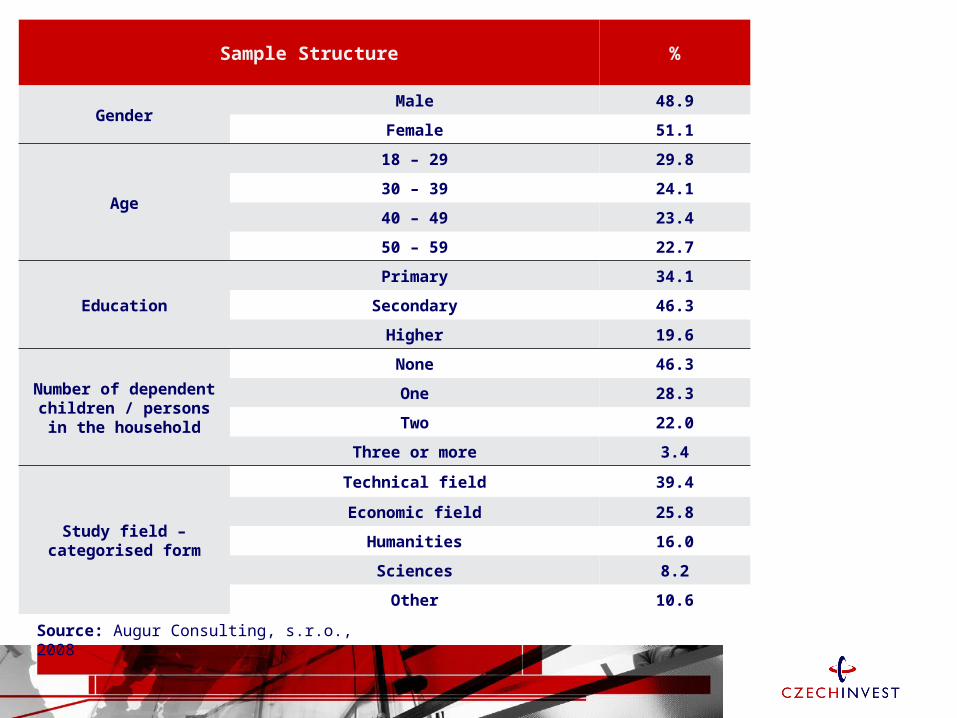
Sample Structure %
GenderMale 48.9
Female 51.1
Age
18 – 29 29.8
30 – 39 24.1
40 – 49 23.4
50 – 59 22.7
Education
Primary 34.1
Secondary 46.3
Higher 19.6
Number of dependent children / persons in the
household
None 46.3
One 28.3
Two 22.0
Three or more 3.4
Study field – categorised form
Technical field 39.4
Economic field 25.8
Humanities 16.0
Sciences 8.2
Other 10.6
Source: Augur Consulting, s.r.o., 2008

Sample Structure %
Employment – social position
Higher management 6.2
Lower management 18.4
Administrative personnel 22.6
Other 52.8
Employment – social position
Labourer (manual worker) 21.6
Administrative employee (in the commercial sphere) 16.0
Administrative employee (the state, state-funded organisation)
13.0
Managerial staff 9.5
Teacher, doctor, research worker, etc. 6.9
Entrepreneur 4.2
Small trader 4.2
Unemployed 2.7
Pensioner, including invalid pension, disabled persons 5.1
Maternity / paternity leave, in the home 2.6
Student, apprentice 12.4
Economically active - other 1.8
Source: Augur Consulting, s.r.o., 2008
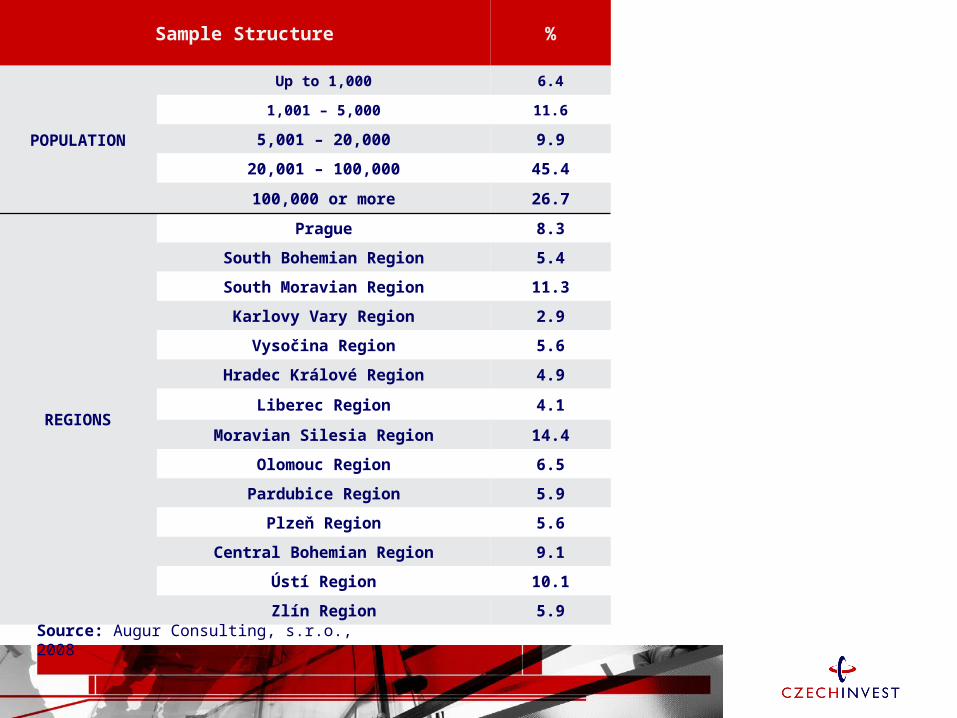
Sample Structure %
POPULATION
Up to 1,000 6.4
1,001 – 5,000 11.6
5,001 – 20,000 9.9
20,001 – 100,000 45.4
100,000 or more 26.7
REGIONS
Prague 8.3
South Bohemian Region 5.4
South Moravian Region 11.3
Karlovy Vary Region 2.9
Vysočina Region 5.6
Hradec Králové Region 4.9
Liberec Region 4.1
Moravian Silesia Region 14.4
Olomouc Region 6.5
Pardubice Region 5.9
Plzeň Region 5.6
Central Bohemian Region 9.1
Ústí Region 10.1
Zlín Region 5.9Source: Augur Consulting, s.r.o., 2008
Sample Structure
Source: Augur Consulting, s.r.o., 2008
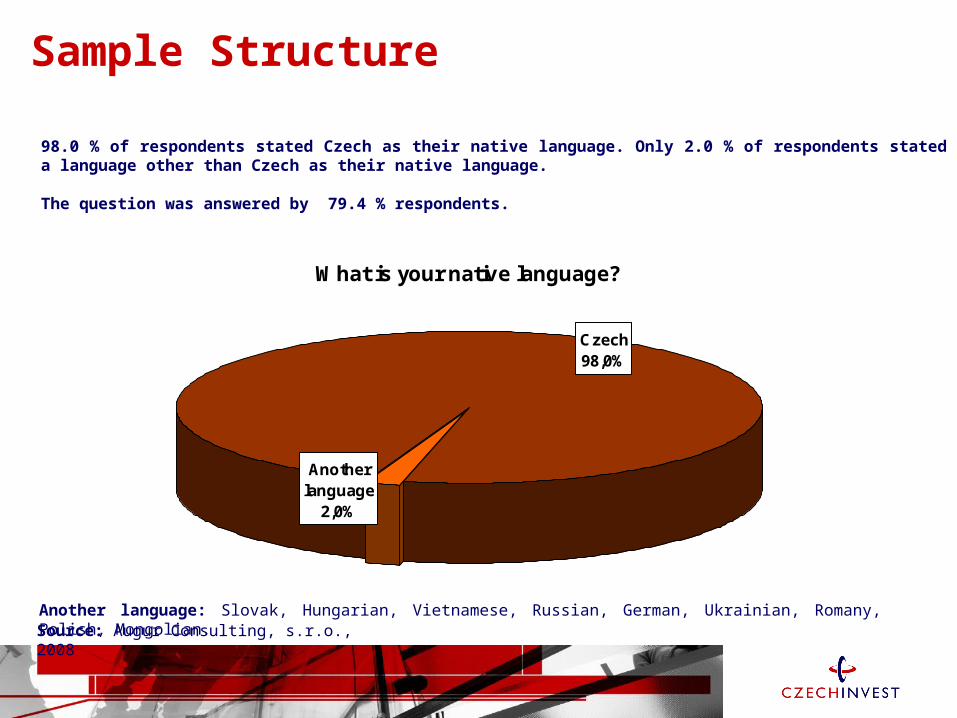
98.0 % of respondents stated Czech as their native language. Only 2.0 % of respondents stated a language other than Czech as their native language.
The question was answered by 79.4 % respondents.
What is your native language?
Another language
2,0%
Czech98,0%
Another language: Slovak, Hungarian, Vietnamese, Russian, German, Ukrainian, Romany, Polish, Mongolian.