auditors’use of brainstorming in the consideration of ...jfbrazel/myresearch/bstorming tar...
TRANSCRIPT

WcBHnSpCSE
E
THE ACCOUNTING REVIEW American Accounting AssociationVol. 85, No. 4 DOI: 10.2308/accr.2010.85.4.12732010pp. 1273–1301
Auditors’ Use of Brainstorming inthe Consideration of Fraud: Reports
from the Field
Joseph F. BrazelNorth Carolina State University
Tina D. CarpenterThe University of Georgia
J. Gregory JenkinsVirginia Polytechnic Institute and State University
ABSTRACT: Audit standards require auditors to conduct fraud brainstorming sessionson every audit. The Public Company Accounting Oversight Board has raised concernsabout auditors’ fraud judgments and the quality of their brainstorming sessions. Wedevelop a measure of brainstorming quality to examine how it affects auditors’ frauddecision-making processes. We test our measure using field survey data of auditors’actual brainstorming sessions for 179 audit engagements. Respondents report consid-erable variation in the quality of brainstorming in practice. We find some evidence thathigh-quality brainstorming improves the relations between fraud risk factors and fraudrisk assessments. We also determine that brainstorming quality positively moderatesthe relations between fraud risk assessments and fraud-related testing. Our resultssuggest that the benefits of brainstorming do not apply uniformly, because low-qualitysessions likely incur the costs of such interactions without receiving the attendant ben-efits. By documenting best practices from high-quality brainstorming sessions, our find-ings can inform auditors on how to improve their consideration of fraud.
Keywords: brainstorming quality; fraud; fraud risk assessments; fraud risk response.
e owe special thanks to Steve Kachelmeier �editor� and two anonymous reviewers. We are grateful for the helpfulomments provided by Chris Agoglia, Ben Ayers, Ann Backof, Linda Bamber, Michael Bamber, Mark Beasley, Jodiellovary, Grey Burnett, Rex Yuxing Du, Brooke Elliott, Jenny Gaver, Steve Glover, Rick Hatfield, Rich Houston, Kathyurtt, Karla Johnstone, Bill Messier, Mitch Oler, Tom Omer, Linda Parsons, Mark Peecher, Denis Pelletier, Robin Pen-ington, Dave Piercey, Velina Popova, Bob Ramsay, Jane Reimers, Steve Salterio, Jaime Schmidt, Marjorie Shelley, Chadimon, Jason Smith, CJ Song, Edward Swanson, Chris Wolfe, William Wright, Mark Zimbelman, and workshop partici-ants at the University of Illinois, Texas A&M University, University of Nevada, Las Vegas, Baylor University, Northarolina State University, The University of Alabama, the 2007 AAA Annual Meeting, the North Carolina Office of thetate Controller, First Citizens Bank, and the 2008 Auditing Section Midyear Meeting. We also thank Deloitte & Touche,rnst & Young, Grant Thornton, KPMG, and PricewaterhouseCoopers for their support and participation in this project.
ditor’s note: Accepted by Steven Kachelmeier.
Submitted: July 2008Accepted: December 2009
Published Online: June 2010
1273
FbetshacTedctcr
tabsojstai
bZbmbpbe
1
1274 Brazel, Carpenter, and Jenkins
TA
I. INTRODUCTIONraud detection is among the highest priorities for the accounting profession and standard-setters �Elliott 2002; PCAOB 2003, 2007, 2008�. Statement on Auditing Standards �SAS�No. 99 �AICPA 2002�, Consideration of Fraud in a Financial Statement Audit, requires
rainstorming sessions on every audit as a means of improving auditors’ fraud judgments. How-ver, the Public Company Accounting Oversight Board �PCAOB� has expressed concerns abouthe actual conduct and quality of brainstorming sessions in practice �PCAOB 2007�. Because theseessions are a relatively new requirement, little is known about how they occur in practice andow they influence fraud-related judgments. Accordingly, our study employs a field survey ofctual audit engagements to pursue three research objectives. First, we study how audit teams areonducting brainstorming sessions in practice and develop a measure of brainstorming quality.his descriptive analysis should provide a basis for further modeling of brainstorming and futurempirical research in team decision-making. Second, we investigate the comprehensive fraudecision-making process that audit teams are employing in practice, from the consideration oflient fraud risk factors to their development of fraud risk assessments and fraud-related auditesting. Third, we examine how the quality of these brainstorming sessions influences auditors’onsideration of fraud and whether variation in this quality has important consequences for theesulting fraud judgments.
This investigation is important for several reasons. First, prior psychology research suggestshat the effectiveness of judgments and decisions likely depends on the quality of a team’s inter-ction �e.g., Stasser 1999�. We leverage the survey method to collect complex and rich data aboutrainstorming session quality and its underlying characteristics. Our measure of brainstormingession quality is multifaceted �i.e., 21-item scale� and is developed from a review of the psychol-gy literature on brainstorming and team decision-making, the accounting literature on auditors’udgments and fraud, recent PCAOB inspection reports, and professional guidance. Our brain-torming session-quality measure consists of three overall elements: attendance and communica-ion, structure and timing, and engagement team effort. To our knowledge, this is the first study inccounting or elsewhere to develop a measure of brainstorming quality and empirically examinets effects on team judgments.
Second, prior experimental studies have examined certain parts of the brainstorming process,ut have not examined the entire decision-making process �e.g., Carpenter 2007; Hoffman andimbelman 2009�. Moreover, the accounting literature suggests that the benefits derived fromrainstorming depend on the brainstorming method used �Carpenter 2007; Hoffman and Zimbel-an 2009; Lynch et al. 2009; Hunton and Gold 2010�. Carpenter �2007� and Hoffman and Zim-
elman �2009� document benefits to brainstorming versus not brainstorming. However, contem-orary studies by Lynch et al. �2009� and Hunton and Gold �2010� suggest that the type ofrainstorming is an important consideration for the benefits to be realized, as they find that someffective brainstorming methods are not predominant in practice.1 While this prior research has
Lynch et al. �2009� conclude that brainstorming effectiveness is higher for teams using group support systems relativeto teams using traditional face-to-face brainstorming. In our sample, 80 percent of our observations used traditionalface-to-face brainstorming. Hunton and Gold �2010� find that both the nominal group �where there is no communicationamong team members� and round robin brainstorming techniques are more effective than open brainstorming. However,in our sample, we find that 91 percent of our engagements employed open brainstorming. Thus, while these two studiesprovide means in which brainstorming can be improved, our descriptive data suggest that such changes would besignificant and likely a substantial challenge for firms to undertake. Our finding of a preponderance of face-to-facecommunication and open brainstorming in practice likely suggests that unidentified institutional factors cause auditteams to employ these two potentially less effective methods �e.g., open brainstorming �versus round robin� allows apartner to better control the discussion�.
he Accounting Review July 2010merican Accounting Association
perrcoaeTe
rnPims2
tqawf
rraegTndwrmec
tZdaphocfib
Auditors’ Use of Brainstorming in the Consideration of Fraud: Reports from the Field 1275
T
rovided some evidence on auditor fraud judgments in experimental settings, there is no empiricalvidence on how audit teams are implementing brainstorming sessions in practice and whether theelations among their team judgments are improved by the quality of brainstorming sessionsequired by SAS No. 99. We contribute to the literature by using a field survey to collect auditors’lient-specific brainstorming session data and the related fraud judgments. Because this method-logy allows us to collect the underlying dynamics of audit teams’ actual brainstorming sessions,nd the resulting risk factors identified, fraud risk assessments, and related testing, we are able toxamine multiple fraud decisions and relationships across a number of diverse audit engagements.hus, we provide insight into the comprehensive fraud decision-making process that audit teamsmploy in practice.
Third, our investigation is important to auditors and standard-setters. PCAOB inspectioneports indicate variation among audit teams’ brainstorming sessions, and auditors’ testing is oftenot responsive to their fraud risk assessments �PCAOB 2007�. Our study empirically assesses theCAOB’s findings by documenting how auditors are implementing SAS No. 99 in practice and by
nvestigating the consequences of brainstorming quality on the link between fraud risk assess-ents and subsequent testing. Thus, this study’s findings can inform audit practice and standard-
etters as they reconsider the professional guidance on auditors’ consideration of fraud �PCAOB004, 2007�.
Our theoretical model is based on the psychology and accounting literatures, PCAOB inspec-ion reports, and professional guidance. Based on this model, we hypothesize that brainstorminguality positively moderates the relations between �1� fraud risk factors and related fraud riskssessments and �2� fraud risk assessments and subsequent audit testing. We test our hypothesesith data from 179 audit engagements for which highly experienced audit partners and managers
rom the Big 4 firms and an international firm completed a field survey.Prior experimental research has typically found that when fraud risk factors are present, fraud
isk assessments tend to be higher �e.g., Nieschwietz et al. 2000�. Further, prior experimentalesearch has documented that auditors have difficulty responding to fraud risk assessments byltering the nature of their testing �e.g., Zimbelman 1997; Glover et al. 2003�. Actual auditngagements are rich in context and the fraud risk assessment is typically determined after en-agement team deliberation. Such an environment is difficult to create in an experimental setting.herefore, there is a need to complement experimental fraud research with research employingon-experimental methods. Our field survey results indicate that fraud risk factors identified for aiverse sample of clients are positively correlated with auditor fraud risk assessments. In addition,e find some evidence that brainstorming quality positively moderates the relations between fraud
isk factors and fraud risk assessments. We also find that auditors’ responses to fraud risk assess-ents are contingent on the quality of brainstorming sessions. Specifically, when audit teams
ngage in higher quality brainstorming sessions, fraud risk assessments are more positively asso-iated with changes to the nature, staffing, timing, and extent of fraud-related audit procedures.
While several experimental studies have predicted a link between fraud risk and related auditesting, they have typically not found this link for the nature or type of procedures employed �e.g.,imbelman 1997; Glover et al. 2003; Asare and Wright 2004�. We complement this literature byocumenting the important role brainstorming quality can play in improving the link betweenuditors’ fraud risk assessments and their subsequent testing; including the choice of the nature ofrocedures. We consequently illustrate that important and tangible benefits can be derived fromigher quality brainstorming. On the other hand, our analyses suggest that under-auditing canccur when brainstorming session quality is low. Thus, some engagement teams likely incur theost of brainstorming without receiving the attendant benefits of such interactions. These newndings triangulate and extend prior studies by offering important insights on the costs andenefits of fraud brainstorming.
he Accounting Review July 2010American Accounting Association

sPhnlbtafoiba
t
A
mg�dsresfism
F
isddpB
F
ffida
1276 Brazel, Carpenter, and Jenkins
TA
Legal restrictions prohibit the PCAOB from distributing descriptive evidence about brain-torming sessions in practice �PCAOB 2007�. Thus, it is difficult for individuals outside theCAOB to discern if the PCAOB’s concerns about brainstorming quality are widespread or per-aps isolated to only a few audit engagements. Our study captures brainstorming data that is oftenot documented and thus not available for PCAOB inspection teams to review �e.g., participationevels of engagement team members�. Our survey data validate the concerns raised by the PCAOBy documenting considerable variation in the reported quality of brainstorming sessions in prac-ice. More importantly, we find evidence that there are consequential effects of conducting low-nd high-quality sessions. We also analyze data related to the misappropriation of assets andraudulent financial reporting that were detected by the audit teams in our sample �i.e., instancesf actual fraud detection�. In additional analyses, we examine audit team effectiveness by analyz-ng the links between ex ante fraud judgments and ex post fraud detection. Last, our data revealest practices for how auditors can improve the quality of their brainstorming sessions �e.g.,ttendance of an IT audit specialist, occurrence of the session early in the planning process�.
Section II describes the background and hypotheses development. Sections III and IV providehe methods and results of the study, respectively. Section V concludes the paper.
II. BACKGROUND AND HYPOTHESES DEVELOPMENTModel of Auditors’ Use of Brainstorming in the Consideration of Fraud
Based on SAS No. 99, as well as prior accounting and psychology research, we develop aodel of auditors’ use of brainstorming in the consideration of fraud. SAS No. 99 provides
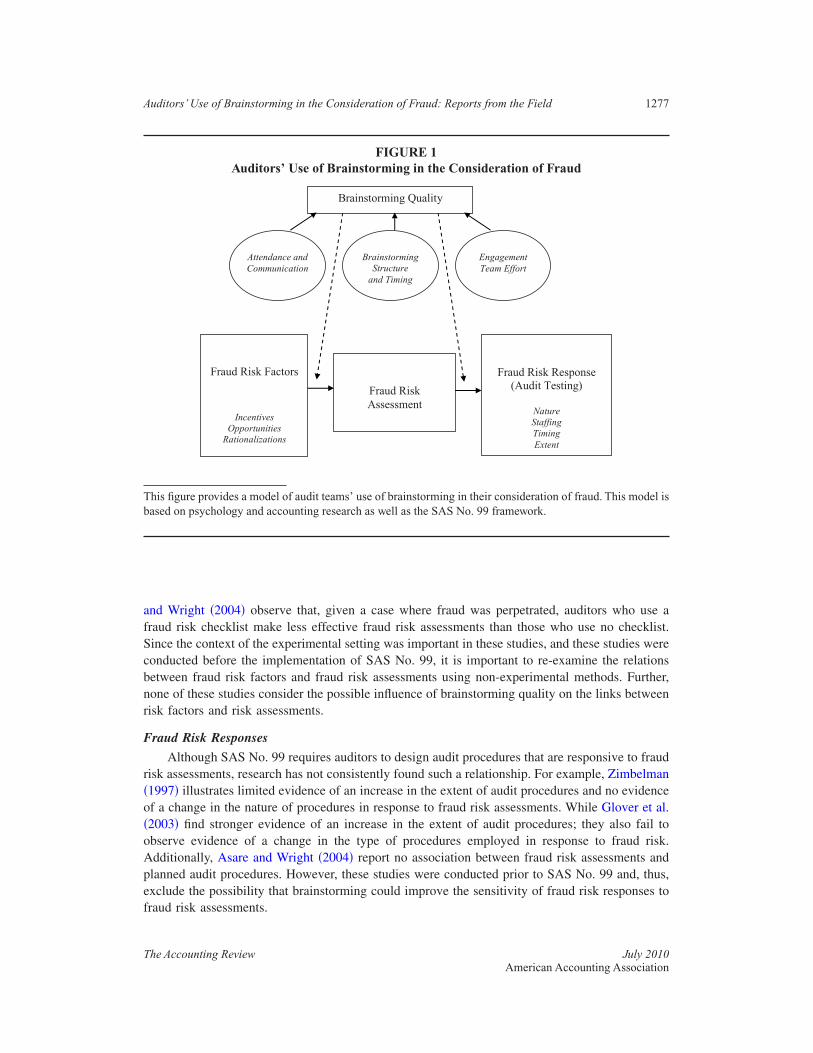
uidance to improve the likelihood that auditors will detect fraud using a multi-phase approachAICPA 2002, 2003�. First, auditors collect information related to the risk of material misstatementue to fraud �e.g., data on equity-based compensation�. Using such information, auditors brain-torm to identify fraud risk factors �e.g., incentives�, synthesize this information to develop a fraudisk assessment, and develop a response to the risk assessments such as altering the staffing of thengagement, or modifying the nature, timing, and extent of audit procedures. Brainstorming ses-ions are intended to aid auditors in linking fraud risk factors to risk assessments and, in turn,oster the development of appropriate audit responses. As such, the model depicted in Figure 1ndicates that brainstorming should influence both phases of the fraud decision-making processuch that the relations among fraud risk factors, risk assessments, and responses are positivelyoderated by the quality of the brainstorming session.
raud Risk FactorsFraud risk factors are commonly categorized along three dimensions of the fraud triangle:
ncentives, opportunities, and rationalizations �AICPA 2002�. Auditors synthesize their under-tanding of these risk factors with other information �e.g., preliminary analytical procedures� toevelop a fraud risk assessment �AICPA 2002�. Prior archival research on fraud risk factorsocuments relations between fraudulent financial reporting and financial statement elements, cor-orate governance quality, nonfinancial measures, and other observable data �e.g., Beasley 1996;eneish 1997; McVay 2006; Brazel et al. 2009�.
raud Risk AssessmentsExperimental studies have examined the relationships between fraud risk factors and auditors’
raud risk assessments. While auditors’ risk assessments are generally higher when fraud riskactors are present �Nieschwietz et al. 2000�, more recent studies report that context has anmportant influence on auditors’ judgments. Wilks and Zimbelman �2004� find that auditors whoecompose fraud risk assessments are more sensitive to incentive and opportunity risks thanuditors who provide holistic fraud risk assessments, but only in a low fraud risk context. Asare
he Accounting Review July 2010merican Accounting Association
afScbnr
F
r�o�oApef
Tb
Auditors’ Use of Brainstorming in the Consideration of Fraud: Reports from the Field 1277
T
nd Wright �2004� observe that, given a case where fraud was perpetrated, auditors who use araud risk checklist make less effective fraud risk assessments than those who use no checklist.ince the context of the experimental setting was important in these studies, and these studies wereonducted before the implementation of SAS No. 99, it is important to re-examine the relationsetween fraud risk factors and fraud risk assessments using non-experimental methods. Further,one of these studies consider the possible influence of brainstorming quality on the links betweenisk factors and risk assessments.
raud Risk Responses
Although SAS No. 99 requires auditors to design audit procedures that are responsive to fraudisk assessments, research has not consistently found such a relationship. For example, Zimbelman1997� illustrates limited evidence of an increase in the extent of audit procedures and no evidencef a change in the nature of procedures in response to fraud risk assessments. While Glover et al.2003� find stronger evidence of an increase in the extent of audit procedures; they also fail tobserve evidence of a change in the type of procedures employed in response to fraud risk.dditionally, Asare and Wright �2004� report no association between fraud risk assessments andlanned audit procedures. However, these studies were conducted prior to SAS No. 99 and, thus,xclude the possibility that brainstorming could improve the sensitivity of fraud risk responses toraud risk assessments.
FIGURE 1Auditors’ Use of Brainstorming in the Consideration of Fraud
Fraud Risk Factors
IncentivesOpportunitiesRationalizations
Fraud RiskAssessment
Fraud Risk Response(Audit Testing)
NatureStaffingTimingExtent
Brainstorming Quality
Attendance andCommunication
BrainstormingStructureand Timing
EngagementTeam Effort
his figure provides a model of audit teams’ use of brainstorming in their consideration of fraud. This model isased on psychology and accounting research as well as the SAS No. 99 framework.
he Accounting Review July 2010American Accounting Association

B
bb�mfwrbfln
af�oimHioopa
tpsaSstH�cb
edm
2
1278 Brazel, Carpenter, and Jenkins
TA
rainstorming QualityCarpenter �2007� and Hoffman and Zimbelman �2009� experimentally study the influence of
rainstorming sessions on the link between fraud risk and fraud risk assessment and the linketween risk assessment and the nature of the audit procedures selected, respectively. Carpenter2007� examines hierarchical teams that brainstorm and concludes that teams generate lists withore quality fraud risks than do individual auditors. Further, these teams provide more effective
raud risk assessments �i.e., higher when fraud was present than when it was not� than auditorsorking alone. Hoffman and Zimbelman �2009� investigate the role that brainstorming plays with
egard to audit managers’ planned audit procedures. They document that brainstorming �versus norainstorming� leads to more effective modification of standard audit procedures in a specific highraud risk case. While both of these studies provide important insights, neither captures the col-ective fraud process �i.e., the relations among fraud risk factors, risk assessments, and responses�,or do they examine actual audit teams where partners’ judgments are likely very important.2
More importantly, contemporary experimental research by Lynch et al. �2009� and Huntonnd Gold �2010� find that the brainstorming methods that are predominant in practice �e.g.,ace-to-face communication and open brainstorming� are less effective than alternative methodse.g., electronic communication and round robin brainstorming�. For a sample of audits wherepen brainstorming and face-to-face discussion were the norm, we examine if higher brainstorm-ng quality can mitigate the negative effects documented by these contemporary studies. Further-
ore, the PCAOB has expressed concern about brainstorming quality in practice �PCAOB 2007�.owever, because the PCAOB is legally restricted from distributing data from their inspections, it
s difficult for those outside the PCAOB to discern if brainstorming quality issues are widespreadr isolated, and the extent that session quality varies between engagements. Therefore, it is anpen empirical question as to whether differences in brainstorming quality actually found inractice are large enough to lead to meaningful differences in audit teams’ fraud risk assessmentsnd audit testing.
There is a substantial body of psychology literature on the role of brainstorming. In general,his research reports mixed findings, with evidence suggesting that brainstorming can lead to bothrocess gains and losses �e.g., Hill 1982; Diehl and Stroebe 1987�. Most of these experimentaltudies were conducted with college students who held no task-specific expertise or knowledgend were asked to brainstorm about mundane problems �e.g., Diehl and Stroebe 1987�. However,AS No. 99 requires auditors with specific training and experience to conduct brainstormingessions, a task with much at risk. Past studies of brainstorming also did not include hierarchicaleams, eliminating the potential costs and benefits of normal hierarchies �cf., Hinsz et al. 1997�.ierarchical teams of auditors are likely to develop synergies by building on one another’s ideas
e.g., Carpenter 2007�. Conversely, the hierarchy of an audit team might exacerbate problems thatan occur during brainstorming, such as evaluation apprehension, group think, and productionlocking �e.g., Beasley and Jenkins 2003�.
Psychology research has documented links between cooperative outcome interdependence,ffectiveness of team communications, and resultant decisions. Under cooperative outcome inter-ependence, team members succeed or fail together, directly benefiting from each other’s perfor-ance �De Dreu 2007�. Audit teams have cooperative outcome interdependence because their
Neither Carpenter �2007� nor Hoffman and Zimbelman �2009� include audit partners in their brainstorming teams.Given the authority level assigned to audit partners, it is likely that they wield substantial influence over fraud-relatedjudgments. In our sample, partners attended every brainstorming session and were the largest contributors to the sessions�see Table 3�. Also, whether the partner led the session and the amount of partner contribution were positively correlatedwith a number of fraud-related judgments �e.g., nature of testing; see Table 5�. Our use of survey data from actual auditengagements allows us to include the role of partners.
he Accounting Review July 2010merican Accounting Association

tCsad
irc
A
eetesatq
B
FrDittaii
E
ilfpti�grmiar
Auditors’ Use of Brainstorming in the Consideration of Fraud: Reports from the Field 1279
T
eam interaction in a brainstorming session depends on cooperation as opposed to competition.ooperative outcome interdependence is related to the teams’ ability to discuss shared and un-
hared information �Stasser 1999�. Thus, the quality of information sharing or brainstormingmong team members is likely to influence the effectiveness of the discussion and, in turn, theecisions of the team.
Building on professional guidance and the accounting and psychology literatures, our modeln Figure 1 posits that the quality of the brainstorming session �1� positively moderates theelations between auditors’ fraud judgments and �2� is based on three elements: attendance andommunication, brainstorming structure and timing, and engagement team effort.
ttendance and Communication
Attendance and communication affect the quality of team interaction and discussion. Postmest al. �2001� suggest that teams that promote critical thought are more likely to ensure carefulvaluation of information and arrive at higher quality decisions. Schippers et al. �2003� find thathe quality of team communication is enhanced when teams are more diverse and when theyncourage open communication. Stasser �1999� illustrates that openness to ideas improves deci-ion quality by encouraging the sharing of information. In line with this research, we expect thats more members of the engagement team attend and participate in the brainstorming session,here will be greater diversity and more sharing of information. This should improve the overalluality of the session and the responsiveness of fraud judgments.
rainstorming Structure and Timing
The structure and timing of team discussions are important to the quality of team judgments.or example, increased time pressure exacerbates the tendency of teams to seek cognitive closure,educes motivation, and increases reliance on heuristics �e.g., Kruglanski and Freund 1983; Dereu 2003�. Further, De Dreu �2003� suggests that pressure reduces team motivation to process
nformation in a systematic and deliberate way, leading to reduced team effectiveness. Althoughime pressure is ever-present in the audit environment, auditors can potentially mitigate its nega-ive effects by, for example, conducting brainstorming sessions early in the planning phase of theudit rather than later. Sessions held earlier in the planning process are expected to positivelynfluence auditors’ fraud judgments as the engagement team will have more time to implement thedeas endorsed during the session.
ngagement Team Effort
Engagement team effort is also an important determinant of the quality of teams’ brainstorm-ng sessions. There are two qualitatively different mechanisms of information processing: shallow,ess critical, heuristic information processing and more argument-based, effortful, systematic in-ormation processing �Chaiken and Trope 1999�. If the goal is to discover popular beliefs andreferences, team interaction tends to be preference-driven, leaving little opportunity for innova-ive decision making. In contrast, information-driven teams employ effortful systematic process-ng, communicating and integrating relevant information, to arrive at higher quality decisionsStasser and Birchmeier 2003�. Such an effortful process focus is evident in SAS No. 99-relateduidance, which suggests that, for example, auditors individually identify risks and potential auditesponses prior to brainstorming �AICPA 2003�. These requirements should enhance each teamember’s involvement in the fraud audit process, augment their client-specific knowledge, and
mprove their contribution to the brainstorming session. Therefore, we expect that the more effortuditors exert prior to and during brainstorming, the higher the quality of team interaction andesultant fraud-related judgments.
he Accounting Review July 2010American Accounting Association

bmr
P
pcorsDGap
R
�atvmg
F
pmmwWsas
r
3
1280 Brazel, Carpenter, and Jenkins
TA
In summary, higher quality brainstorming sessions are expected to improve �1� the linksetween fraud risk factors and related assessments and �2� the relations between fraud risk assess-ents and subsequent testing. That is, we expect session quality to positively moderate both
elations, as stated in the following hypotheses:
H1: Fraud risk factors are more positively related to fraud risk assessments in high-qualitybrainstorming sessions than in low-quality brainstorming sessions.
H2: Fraud risk assessments are more positively related to fraud risk responses in high-qualitybrainstorming sessions than in low-quality brainstorming sessions.
III. METHODarticipants
We approached contacts in the Big 4 firms and one other international firm to request partici-ation in the study. Each firm agreed to participate. A secure Internet survey link was sent to eachontact who distributed the survey to partners, directors, senior managers, and managers in theirffices. A total of 367 auditors received the survey link, of which 179 completed the survey,esulting in a response rate of 48.8 percent. This rate exceeds the response rates in other auditingurveys �e.g., 16 percent response rate by Nelson et al. �2002�; 29.7 percent response rate byowling �2009��; however, it is lower than the exceptionally high 70.5 percent achieved byibbins et al. �2001�.3 Participants held positions of partner �56�, director �2�, senior manager �60�,
nd manager �61�. All 179 brainstorming sessions in our study reported to have an engagementartner in attendance.
esearch InstrumentSimilar to the method used by Gibbins et al. �2001�, Nelson et al. �2002�, and Dowling
2009�, participants completed a field survey that required them to select one recently completedudit for which a fraud brainstorming session was held. They then responded to questions relatedo the consideration of fraud based upon their experiences on that engagement. Participants pro-ided measures of fraud risk factors, their overall fraud risk assessment for the engagement,easures of audit responses to the fraud risk assessment, and objective and subjective data re-
arding the quality of the audit’s fraud brainstorming session�s�.
raud Risk FactorsTable 1 provides descriptive data related to fraud risk factors. Fraud risk factors elicited from
articipants were measured according to SAS No. 99 and prior research �e.g., Wilks and Zimbel-an 2004� that characterize fraud risk factors as incentives, opportunities, or rationalizations. Weeasure incentives with seven questions related to market and debt incentives and opportunityith five measures of corporate governance quality, internal control strength, and accrual levels.e were unable to find research that suggests rationalization can be measured with multiple items,
o we use one measure consistent with the wording in SAS No. 99. To facilitate comparisonscross participants, we measure all but one of these items �i.e., public versus private companytatus� on a scale where 1 � extremely low and 10 � extremely high.
Factor analyses indicate that the items associated with market-related incentives and debt-elated incentives load on separate factors. Because participants were allowed to provide data from
Because not all individuals responded to our survey, we examine the potential for nonresponse bias. Oppenheim �1992�recommends comparing data from late respondents to early respondents as a way of assessing this bias. Accordingly, wecompare the responses from the first quartile of respondents to those of the last quartile of respondents. There are nostatistically significant differences between early and late responses on any of our hypothesized variables.
he Accounting Review July 2010merican Accounting Association

aio
F
emarpb
4
I
M
D
O
R
a
Auditors’ Use of Brainstorming in the Consideration of Fraud: Reports from the Field 1281
T
udits of both publicly traded and privately held companies, we decompose the incentive constructnto “market incentive” and “debt incentive.” We measure the four fraud risk factors as the meanf the participant’s responses to the items classified under each factor.4
raud Risk Assessment and Fraud Risk ResponsesSimilar to Carpenter �2007�, participants provided the overall fraud risk assessment for the
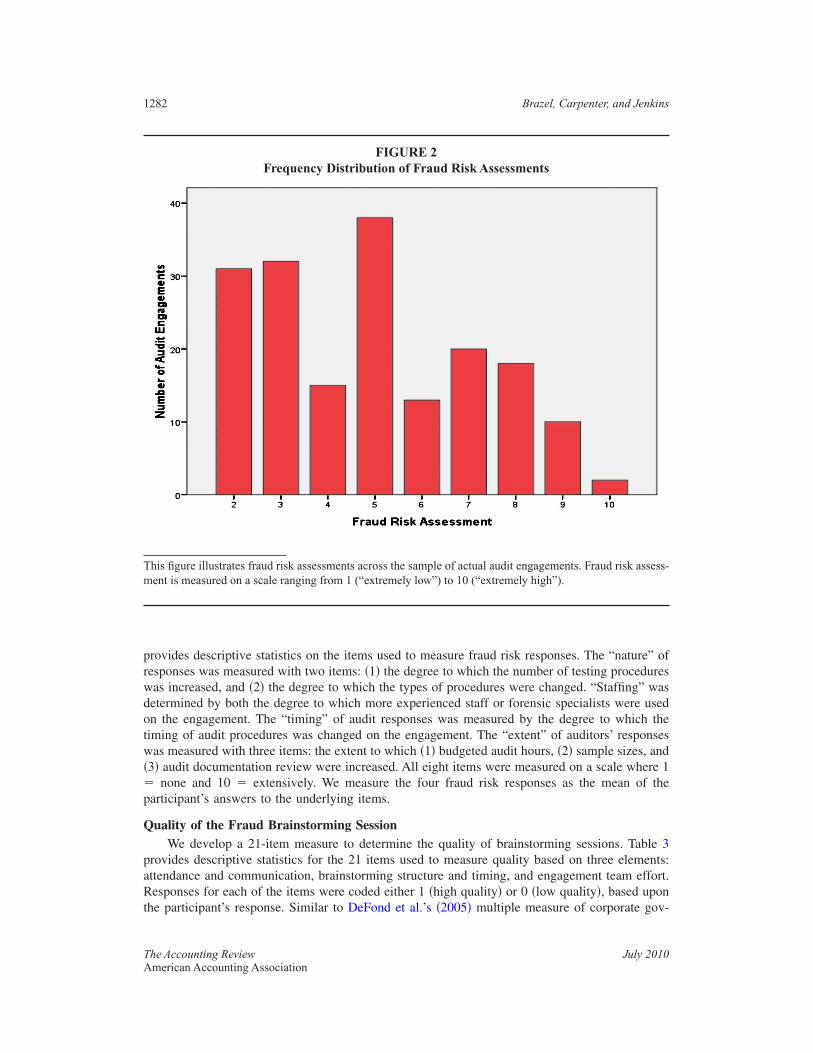
ngagement on a scale where 1 � extremely low and 10 � extremely high. The non-tabulatedean fraud risk assessment �standard deviation� for the sample was 4.92 �2.23�. Figure 2 providesfrequency distribution of fraud risk assessments and illustrates substantial variation among the
isk assessments, which ranged from 2 to 10 for our sample. After providing risk assessments,articipants were asked to provide data on how the engagement team responded to the assessmenty modifying the nature, staffing, timing, and extent of subsequent audit procedures. Table 2
With only three exceptions, factor analyses of items combined to create fraud risk factors and fraud risk responsesprovide factor loadings in excess of 0.50 and Cronbach’s alpha levels exceeding the generally accepted threshold of 0.70�Nunnally 1978�. For all combined measures, the percents of variances explained exceed 60.0 percent. With respect tothe exceptions: �1� the factor loading for a measure of total accruals �0.283� was unacceptable and therefore excludedfrom subsequent analyses, �2� the remaining four measures of opportunity provide a moderate reliability level �Cron-bach’s alpha � 0.62� that is acceptable for testing relationships �e.g., Bamber et al. 1989�, and �3� the Cronbach’s alphalevel for staffing �0.423� was low and we therefore provide results for staffing with the two staffing items combined andseparated.
TABLE 1
Descriptive Statistics: Fraud Risk Factors
tema
Response[n � 179]
Mean Std. Dev.
arket IncentivePercentage of publicly traded clients 67.03 �47.00�Incentives or pressures for client to commit fraud 4.48 �2.14�Pressure for client to meet earnings estimates 4.89 �2.57�Extent of equity-based management compensation 4.28 �2.52�Extent of budget-based management compensation 4.68 �2.40�
ebt IncentivePressure for client to meet debt covenants 3.72 �2.68�Amount of debt 4.93 �2.75�
pportunityOpportunity for fraud to be perpetrated at client 4.90 �1.92�Strength of corporate governance 6.85 �2.26�Likelihood of management override of controls 4.32 �2.12�Overall internal control effectiveness 6.74 �2.05�Difference between net income and cash flow from operations 4.58 �2.34�
ationalizationExtent to which management is enabled to rationalize fraud 3.57 �2.07�
With the exception of whether the client chosen was publicly traded �coded 1� or private �coded 0�, all items aremeasured on a scale where 1 � extremely low and 10 � extremely high. Also, due to the positive wording of twoopportunity items �strength of corporate governance and overall internal control effectiveness�, responses for these twoitems are reverse-coded for data analysis.
he Accounting Review July 2010American Accounting Association
prwdotw��p
Q
paRt
Tm
1282 Brazel, Carpenter, and Jenkins
TA
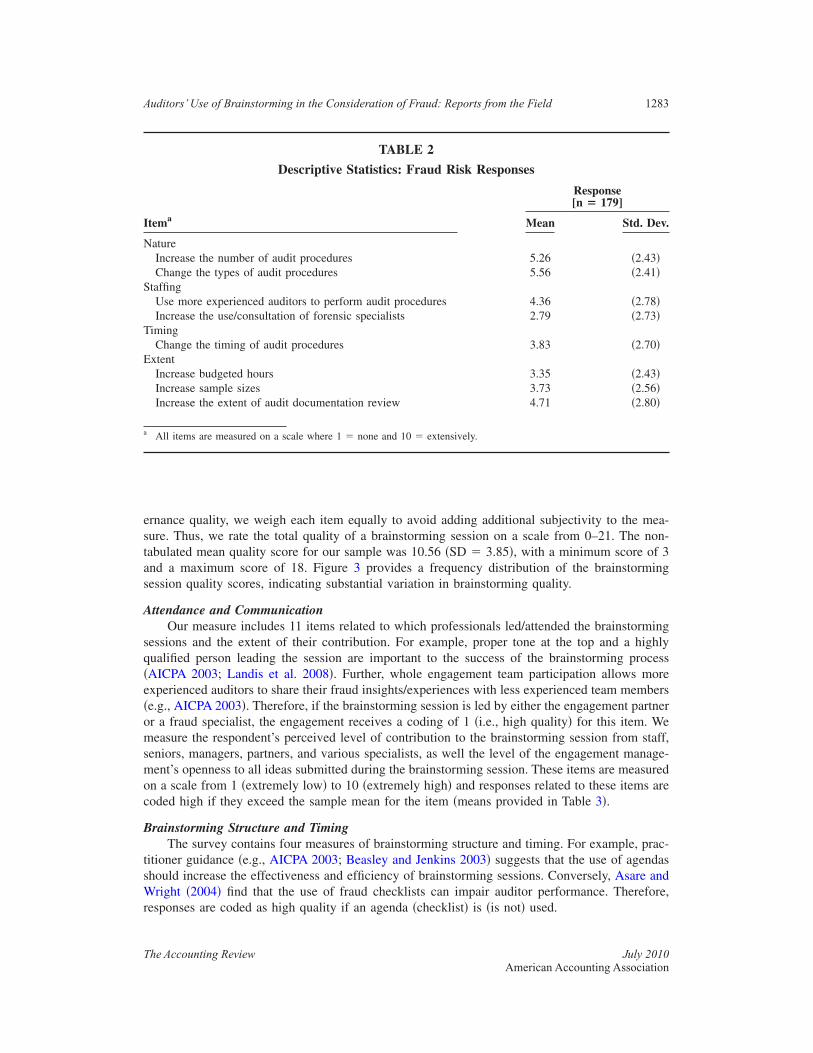
rovides descriptive statistics on the items used to measure fraud risk responses. The “nature” ofesponses was measured with two items: �1� the degree to which the number of testing proceduresas increased, and �2� the degree to which the types of procedures were changed. “Staffing” wasetermined by both the degree to which more experienced staff or forensic specialists were usedn the engagement. The “timing” of audit responses was measured by the degree to which theiming of audit procedures was changed on the engagement. The “extent” of auditors’ responsesas measured with three items: the extent to which �1� budgeted audit hours, �2� sample sizes, and
3� audit documentation review were increased. All eight items were measured on a scale where 1none and 10 � extensively. We measure the four fraud risk responses as the mean of the
articipant’s answers to the underlying items.
uality of the Fraud Brainstorming SessionWe develop a 21-item measure to determine the quality of brainstorming sessions. Table 3
rovides descriptive statistics for the 21 items used to measure quality based on three elements:ttendance and communication, brainstorming structure and timing, and engagement team effort.esponses for each of the items were coded either 1 �high quality� or 0 �low quality�, based upon
he participant’s response. Similar to DeFond et al.’s �2005� multiple measure of corporate gov-
FIGURE 2Frequency Distribution of Fraud Risk Assessments
his figure illustrates fraud risk assessments across the sample of actual audit engagements. Fraud risk assess-ent is measured on a scale ranging from 1 (“extremely low”) to 10 (“extremely high”).
he Accounting Review July 2010merican Accounting Association
estas
A
sq�e�omsmoc
B
tsWr
I
N
S
T
E
a
Auditors’ Use of Brainstorming in the Consideration of Fraud: Reports from the Field 1283
T
rnance quality, we weigh each item equally to avoid adding additional subjectivity to the mea-ure. Thus, we rate the total quality of a brainstorming session on a scale from 0–21. The non-abulated mean quality score for our sample was 10.56 �SD � 3.85�, with a minimum score of 3nd a maximum score of 18. Figure 3 provides a frequency distribution of the brainstormingession quality scores, indicating substantial variation in brainstorming quality.
ttendance and CommunicationOur measure includes 11 items related to which professionals led/attended the brainstorming
essions and the extent of their contribution. For example, proper tone at the top and a highlyualified person leading the session are important to the success of the brainstorming processAICPA 2003; Landis et al. 2008�. Further, whole engagement team participation allows morexperienced auditors to share their fraud insights/experiences with less experienced team memberse.g., AICPA 2003�. Therefore, if the brainstorming session is led by either the engagement partnerr a fraud specialist, the engagement receives a coding of 1 �i.e., high quality� for this item. Weeasure the respondent’s perceived level of contribution to the brainstorming session from staff,
eniors, managers, partners, and various specialists, as well the level of the engagement manage-ent’s openness to all ideas submitted during the brainstorming session. These items are measured
n a scale from 1 �extremely low� to 10 �extremely high� and responses related to these items areoded high if they exceed the sample mean for the item �means provided in Table 3�.
rainstorming Structure and TimingThe survey contains four measures of brainstorming structure and timing. For example, prac-
itioner guidance �e.g., AICPA 2003; Beasley and Jenkins 2003� suggests that the use of agendashould increase the effectiveness and efficiency of brainstorming sessions. Conversely, Asare and
right �2004� find that the use of fraud checklists can impair auditor performance. Therefore,esponses are coded as high quality if an agenda �checklist� is �is not� used.
TABLE 2
Descriptive Statistics: Fraud Risk Responses
tema
Response[n � 179]
Mean Std. Dev.
atureIncrease the number of audit procedures 5.26 �2.43�Change the types of audit procedures 5.56 �2.41�
taffingUse more experienced auditors to perform audit procedures 4.36 �2.78�Increase the use/consultation of forensic specialists 2.79 �2.73�
imingChange the timing of audit procedures 3.83 �2.70�
xtentIncrease budgeted hours 3.35 �2.43�Increase sample sizes 3.73 �2.56�Increase the extent of audit documentation review 4.71 �2.80�
All items are measured on a scale where 1 � none and 10 � extensively.
he Accounting Review July 2010American Accounting Association

E
iml
5
I
A1
2345678911B111
1
E1111
22
a
b
1284 Brazel, Carpenter, and Jenkins
TA
ngagement Team EffortWe measure engagement team effort with six items. To illustrate, we deem responses as high
f the time spent by the engagement team preparing for the brainstorming session exceeds theean for our sample, if the engagement has more than one brainstorming session, or if the total
ength of time for the brainstorming session�s� exceeds the mean for our sample.5
Factor analyses performed on the 21 categorical response items provide significant factor loadings �p � 0.05� for 20 ofthe 21 items on their respective constructs. Further, each of these 20 response items provide significant factor loadings�p � 0.05� on the overall construct of brainstorming quality. Both the Comparative Fit Index of 0.93 and the Tucker-Lewis Index of 0.93 are above 0.90, which is indicative of a good fit for our overall construct of brainstorming quality�Kline 2004�. Only one item, percentage of engagements where all levels of the engagement team attended sessions, did
TABLE 3
Descriptive Statistics: Quality of Fraud Brainstorming Session (21 Items)
tem
Response[n � 179]
Mean Std. Dev.
ttendance and Communication. % of engagements where the session was led by the partner or forensic
specialist59.78 �49.22�
. % of engagements where all levels of engagement team attended sessions 72.63 �44.50�
. % of engagements where a fraud specialist attended the primary session 31.29 �46.34�
. % of engagements where an IT audit specialist attended the primary session 69.27 �46.34�
. % of engagements where a tax professional attended the primary session 62.56 �48.59�
. Level of staff contribution to the session �n � 131�a,b 4.32 �2.13�
. Level of senior contribution to the session �n � 170�a,b 6.03 �1.91�
. Level of manager contribution to the sessiona 7.93 �1.48�
. Level of partner contribution to the sessiona 8.41 �1.48�0. Level of fraud specialist contribution to the session �n � 56�a,b 7.01 �2.31�1. Level of openness to ideas submitted during the sessiona 8.54 �1.42�rainstorming Structure and Timing2. % of engagements where an agenda was used during the session 83.80 �36.60�3. % of engagements where a checklist was not used during the session 28.49 �45.34�4. % of engagements where the primary session was held pre-planning or
early in planning64.81 �47.95�
5. % of engagements where a session was held at the end of the prior year’saudit
16.20 �36.03�
ngagement Team Effort6. Time spent by the engagement team preparing for the session �in hours� 9.10 �15.51�7. % of engagements that had more than one session 49.16 �50.13�8. Total length of time for the sessions �in minutes� 93.68 �99.16�9. % of engagements where team members were asked to identify risks prior
to the session67.60 �47.00�
0. Extent of discussion about how management might perpetrate frauda 7.25 �1.69�1. Extent of discussion about audit responses to fraud riska 7.38 �1.60�
Items are measured on a scale where 1 � extremely low and 10 � extremely high.Mean represents the average response in sessions where the professional�s� �e.g., staff, fraud specialist� was present�versus not present�. Manager�s� and partner�s� were present for all observations.
he Accounting Review July 2010merican Accounting Association

C
cOaBs1eca1ss
TBd
Auditors’ Use of Brainstorming in the Consideration of Fraud: Reports from the Field 1285
T
ontrol VariablesTable 4 provides descriptive statistics for our control variables. Prior research has found that
lient size, industry, and complexity impact auditor risk assessments and testing decisions �e.g.,’Keefe et al. 1994�. We control for size by including a measure of the client’s revenues in our
nalyses. We asked respondents to provide the client’s industry and, similar to Johnstone andedard �2003�, create dichotomous industry control variables to control for industry effects. As
uggested by the audit fee and resource allocation literatures �e.g., Hackenbrack and Knechel997�, we measure client complexity as the number of financial statement auditors assigned to thengagement divided by our size measure. Because we investigate fraud-related judgments, weontrol for whether fraud was detected on the engagement. We also control for the effects of otheruditor or engagement team-related variables that could influence audit judgments �e.g., Bonner990�. Specifically, with dichotomous firm control variables, we simultaneously control for thepecific audit firm which performed the audit and the inclusion of one non-Big 4 firm in ourample. Also, our model includes the participant’s general audit experience, position in the firm,
not load satisfactorily �p � 0.70�. Omitting this item from the factor analyses and our session-quality measure in ourregression analyses does not qualitatively change our results. We include this item in our analyses because the item wasspecifically identified as a deficiency by the PCAOB �PCAOB 2007�.
FIGURE 3Frequency Distribution of Brainstorming Session Quality Scores
Brainstorming Session Quality Score
1817161514131211109876543
NumberofEngagements
30
20
10
0
his figure illustrates brainstorming session quality scores across the sample of actual audit engagements.rainstorming quality scores are formed using a 21-item measure with each item being equally weighted toetermine a session’s quality. Consequently, session quality scores can range from 0 to 21 points.
he Accounting Review July 2010American Accounting Association

I
CMRGEHHFMCFAAAAAAPCIEFFRT
a
C�icn3ti�deEm0ssr
1286 Brazel, Carpenter, and Jenkins
TA
TABLE 4
Descriptive Statistics: Control Variables
tema
Response[n � 179]
Mean Std. Dev.
lient Size 3.06 �1.42�anufacturing industry 0.20 �0.40�etail industry 0.11 �0.31�overnment/not-for-profit industry 0.19 �0.39�nergy industry 0.08 �0.28�igh tech/communications industry 0.14 �0.35�ealthcare/pharmaceutical industry 0.07 �0.26�inancial services industry 0.07 �0.25�iscellaneous industry 0.14 �0.35�lient complexity 0.93 �0.65�raud detect 0.24 �0.42�udit firm A 0.14 �0.35�udit firm B 0.19 �0.39�udit firm C 0.32 �0.47�udit firm D 0.16 �0.37�udit firm E 0.19 �0.39�udit experience 1.70 �0.86�osition 2.29 �1.23�lient experience 3.35 �2.05�
ndustry experience 8.69 �6.73�ngagement team expertise 7.50 �1.81�raud training 1.42 �0.66�raud experience 1.92 �0.71�estart 0.08 �0.28�ime taken 22.29 �15.51�
Items were measured as follows:lient size is based on client revenues and coded as follows: 1 � � $100 million, 2 � $100 million �$500 million, 3 �$500 million �$1 billion, 4 � � $1 billion �$5 billion, 5 � � $ 5 billion. Industry variables are dichotomous �1,0�
ndustry variables for the following industries: manufacturing, retail, government/not-for-profit, energy, high tech/ommunications, healthcare/pharmaceuticals, financial services, and miscellaneous. Client complexity is measured asumber of financial statement auditors assigned to the engagement �coded as follows: 1 � 0–5 auditors, 2 � 6–10 auditors,� 11–15 auditors, 4 � 16–20 auditors, 5 � � 20 auditors�/client size. Fraud detect is coded 1 if the participant reported
hat fraud was detected at the client, 0 otherwise. Audit firm variables are dichotomous �1,0� firm variables for the fournternational and one national �i.e., non-Big 4� firm that participated in our study. Audit experience is coded as follows: 1
5–10 years, 2 � 11–15 years, 3 � � 15 years. Position is coded as follows: 1 � manager, 2 � senior manager, 3 �irector, 4 � partner. Client experience is measured as the number of years the respondent had served the client. Industryxperience is coded as follows: 1 � 0–5 years, 2 � 6–10 years, 3 � 11–15 years, 4 � 16–20 years, 5 � � 20 years.ngagement team expertise is measured on a scale where 1 � extremely low and 10 � extremely high. Fraud training iseasured by the number of hours of fraud training the respondent had received in the last year and coded as follows: 1 �
–8 hours, 2 � 9–16 hours, 3 � � 16 hours. Fraud experience is determined by the number of engagements the respondenterved on which frauds were identified and coded as follows: 1 � 0, 2 � 1–2, 3 � �2. Restart is coded 1 if the participanttopped and restarted the survey, 0 otherwise. Time taken is the time taken by the 164 respondents who did not stop andestart the survey.
he Accounting Review July 2010merican Accounting Association
eaw
R
e
w
CFPI
Auditors’ Use of Brainstorming in the Consideration of Fraud: Reports from the Field 1287
T
xperience with the client and the client’s industry, extent of fraud training, experience level withctual financial statement fraud, their perception of the entire engagement team’s expertise level,hether the respondent stopped and started the survey, and time taken to complete the survey.
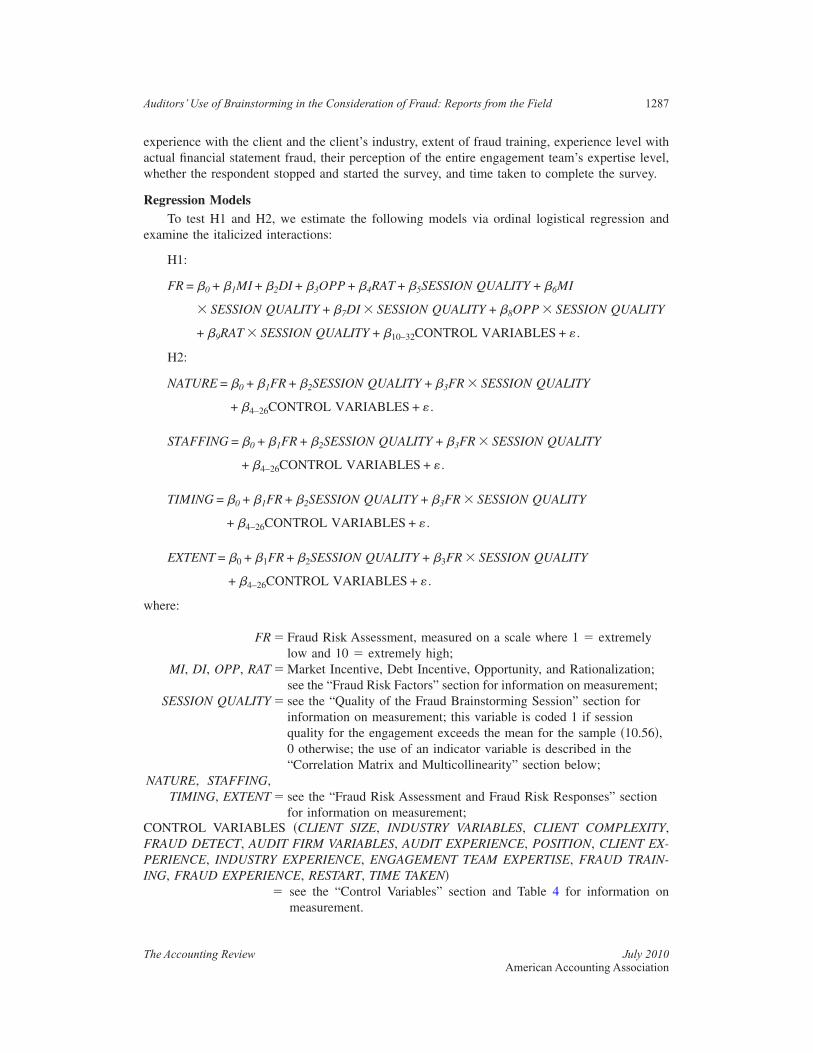
egression ModelsTo test H1 and H2, we estimate the following models via ordinal logistical regression and
xamine the italicized interactions:
H1:
FR = �0 + �1MI + �2DI + �3OPP + �4RAT + �5SESSION QUALITY + �6MI
� SESSION QUALITY + �7DI � SESSION QUALITY + �8OPP � SESSION QUALITY
+ �9RAT � SESSION QUALITY + �10–32CONTROL VARIABLES + � .
H2:
NATURE = �0 + �1FR + �2SESSION QUALITY + �3FR � SESSION QUALITY
+ �4–26CONTROL VARIABLES + � .
STAFFING = �0 + �1FR + �2SESSION QUALITY + �3FR � SESSION QUALITY
+ �4–26CONTROL VARIABLES + � .
TIMING = �0 + �1FR + �2SESSION QUALITY + �3FR � SESSION QUALITY
+ �4–26CONTROL VARIABLES + � .
EXTENT = �0 + �1FR + �2SESSION QUALITY + �3FR � SESSION QUALITY
+ �4–26CONTROL VARIABLES + � .
here:
FR � Fraud Risk Assessment, measured on a scale where 1 � extremelylow and 10 � extremely high;
MI, DI, OPP, RAT � Market Incentive, Debt Incentive, Opportunity, and Rationalization;see the “Fraud Risk Factors” section for information on measurement;
SESSION QUALITY � see the “Quality of the Fraud Brainstorming Session” section forinformation on measurement; this variable is coded 1 if sessionquality for the engagement exceeds the mean for the sample �10.56�,0 otherwise; the use of an indicator variable is described in the“Correlation Matrix and Multicollinearity” section below;
NATURE, STAFFING,TIMING, EXTENT � see the “Fraud Risk Assessment and Fraud Risk Responses” section
for information on measurement;ONTROL VARIABLES �CLIENT SIZE, INDUSTRY VARIABLES, CLIENT COMPLEXITY,RAUD DETECT, AUDIT FIRM VARIABLES, AUDIT EXPERIENCE, POSITION, CLIENT EX-ERIENCE, INDUSTRY EXPERIENCE, ENGAGEMENT TEAM EXPERTISE, FRAUD TRAIN-
NG, FRAUD EXPERIENCE, RESTART, TIME TAKEN�� see the “Control Variables” section and Table 4 for information on
measurement.
he Accounting Review July 2010American Accounting Association

D
fialsPissop4
C
sc
iqtafi�osr
sCit2sla�i
6
1288 Brazel, Carpenter, and Jenkins
TA
IV. RESULTSescriptive Statistics of Brainstorming Practices
Given our sample of 179 recently completed audit engagements across five public accountingrms, Table 3 provides descriptive evidence regarding how selected fraud brainstorming sessionsre being performed in practice. First, our participants report that a partner or forensic specialisted the session only 60 percent of the time, pointing toward the important role audit managers andeniors probably play in determining the quality of the session. Second, consistent with recentCAOB inspection team reports �PCAOB 2007�, we find evidence that the attendance of special-
sts �fraud, tax, IT� in sessions varies. Third, our results are consistent with the hierarchicaltructure of engagement teams in that the level of contribution to the session increases witheniority. Fourth, consistent with PCAOB inspection team findings �PCAOB 2007�, for 35 percentf engagements, sessions were held after the early stages of planning. Last, engagement teamreparation for the sessions tended to be substantial, sessions lasted an average of 1.5 hours, and9 percent of engagements conducted more than one session.
orrelation Matrix and MulticollinearityTable 5 presents a correlation matrix. To present a parsimonious correlation matrix, brain-
torming quality items and control variables are excluded from Table 5 if they are not significantlyorrelated �p � 0.05� with at least four of the hypothesized variables.
We test our hypotheses via interactions within five ordinal logistical regression models. Thesenteractions are the cross product term of two independent variables �e.g., fraud risk � sessionuality�. In such regressions, the interactive term is likely to covary with the main effects consti-uting the interaction term. These regressions often exhibit multicollinearity problems �Echambadind Hess 2007�. Likewise, when we interact our 21-item measure for session quality with riskactors �H1� and risk assessments �H2�, diagnostics suggest multicollinearity exists between thenteraction terms and the variables that constitute the interaction �e.g., variance inflation factorsVIFs� in excess of 10, condition indices in excess of 30 with more than 50 percent of the variancef coefficient estimates associated with these indices�. Multicollinearity, similar to a small sampleize, biases against finding statistically significant main effects and interactions in multivariateegression �e.g., Belsley et al. 1980; Hair et al. 1998; Wooldridge 2009�.
Prior studies have mitigated multicollinearity effects by transforming their continuous orcaled moderating variable into an indicator variable �e.g., Core et al. 2002; Ali et al. 2008;ardinaels 2008�. Thus, we transform our 21-item measure of brainstorming quality into an
ndicator variable, coding each engagement’s total session quality as high or 1 �low or 0� if theotal score for the engagement exceeds �is less than� the mean for our sample �versus using the1-item measure�.6 We use this indicator variable to examine the main and interactive effects ofession quality in all of our tabulated and non-tabulated regression analyses. Tests of multicol-inearity for our H1 regression analyses �with the session quality indicator variable� indicate thatll but one of the independent variables for H1 provide satisfactory multicollinearity diagnosticse.g., Belsley et al. 1980; Neter et al. 1996; Kennedy 2008�. The sole exception is the VIF for thenteraction between opportunity and session quality, which is 11.71. Using condition indices and
Alternatively, we could have split the sample at the median session quality score �11.00� and excluded firms at themedian from our analyses. However, we would then have eliminated 21 observations with a session quality of 11.00from our analyses. Given our relatively small sample size �179�, our large number of control variables �23�, that themean and median for our sample are approximately the same �10.56 and 11.00, respectively�, and partitioning thesample at the mean can be performed without eliminating observations �i.e., no observations had a session quality score� 10.56�, we use the mean session quality score to create the indicator variable for session quality.
he Accounting Review July 2010merican Accounting Association

E STAFFING TIMING EXTENT
DORFNST 0.43E 0.64 0.50P 0.25 0.19 0.18I 0.18 0.17 0.10E 0.15 0.19 0.17F 0.29 0.11 0.19R 0.26 0.17 0.28M 0.24 0.15 0.24P 0.20 0.15 0.14S 0.40 0.28 0.30E 0.21 0.12 0.06S 0.26 0.14 0.06
PC SQ EXP
IEFRMPS 0.42E 0.16 0.22S 0.09 0.31 0.32
(continued on next page)
Auditors’U
seofB
rainstorming
inthe
Consideration
ofFraud:
Reports
fromthe
Field
1289
The
Accounting
Review
July2010
Am
ericanA
ccountingA
ssociation
TABLE 5
Correlation Matrix
MIa DI OPP RAT FR NATUR
Ia Correlationb 0.22PPa Correlation 0.03 0.29ATa Correlation 0.22 0.13 0.42Ra Correlation 0.24 0.22 0.32 0.31ATUREa Correlation 0.23 0.09 0.07 0.17 0.39TAFFINGa Correlation 0.19 0.13 0.06 0.16 0.36 0.61IMINGa Correlation 0.22 0.10 0.13 0.20 0.31 0.45XTENTa Correlation 0.16 0.09 0.13 0.20 0.46 0.69TR Correlation 0.08 0.13 0.02 0.10 0.14 0.15
T Correlation 0.18 �0.07 �0.29 �0.06 0.00 0.09ARLY Correlation 0.00 0.08 �0.01 �0.05 0.15 0.18D Correlation 0.20 �0.02 �0.15 0.10 0.16 0.24D Correlation 0.18 �0.02 �0.17 0.08 0.13 0.31C Correlation 0.13 �0.06 �0.12 �0.04 0.17 0.25C Correlation 0.01 �0.05 �0.16 �0.03 0.14 0.19Qa Correlation 0.19 0.00 �0.16 0.05 0.13 0.30XP Correlation 0.16 �0.05 �0.29 �0.04 0.06 0.22IZE Correlation 0.27 �0.01 �0.18 �0.12 �0.08 0.12
PTR IT EARLY FD RD MC
T Correlation 0.29ARLY Correlation 0.23 0.07D Correlation 0.07 0.06 0.03D Correlation 0.11 0.07 0.01 0.74C Correlation �0.13 �0.03 0.03 0.34 0.43C Correlation 0.03 �0.04 0.06 0.35 0.32 0.52Qa Correlation 0.36 0.37 0.29 0.51 0.48 0.45XP Correlation �0.02 0.19 �0.01 0.24 0.20 0.18IZE Correlation 0.11 0.32 �0.05 0.17 0.17 0.11
Ca nity �OPP�, rationalization �RAT�, fraud risk assessment
aled �1–21� version of the SQ variable is presented in this
b
herwise�;tremely low and 10 � extremely high;and 10 � extremely high;
extremely high;tremely high;nd
million, 3 � � $500 million–$1 billion, 4 �� $1
1290B
razel,Carpenter,and
Jenkins
The
Accounting
Review
July2010
Am
ericanA
ccountingA
ssociation
TABLE 5 (continued)
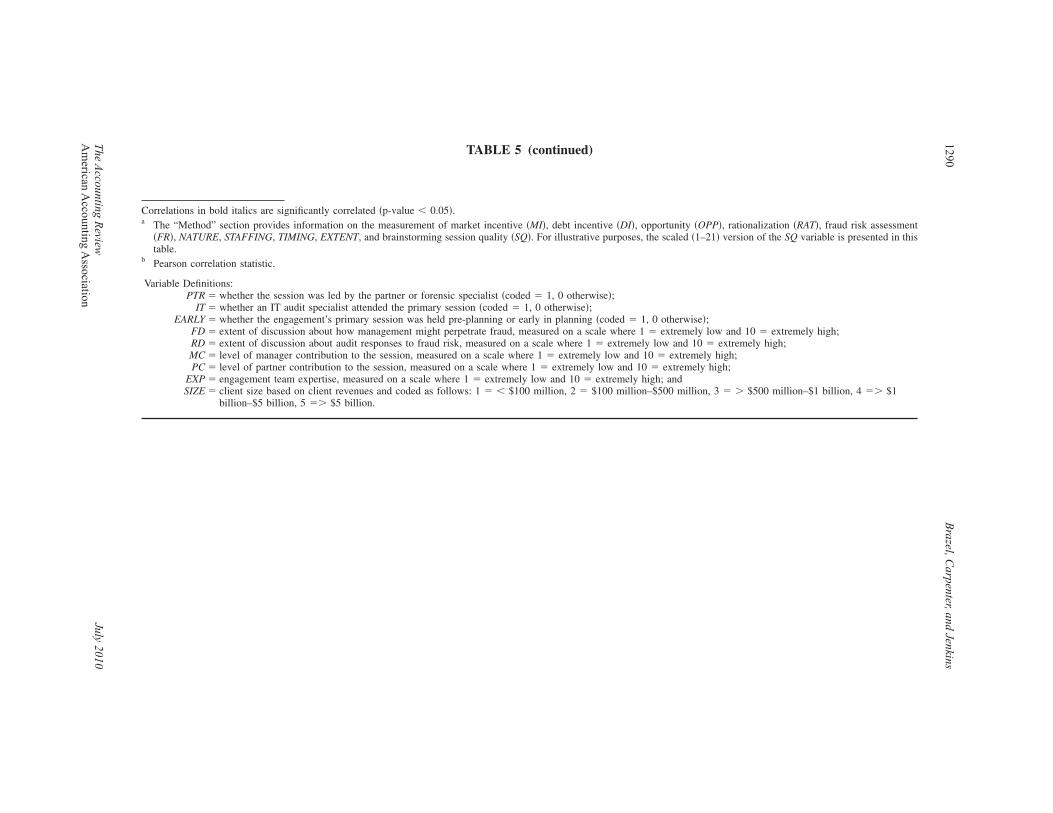
orrelations in bold italics are significantly correlated �p-value � 0.05�.The “Method” section provides information on the measurement of market incentive �MI�, debt incentive �DI�, opportu�FR�, NATURE, STAFFING, TIMING, EXTENT, and brainstorming session quality �SQ�. For illustrative purposes, the sctable.Pearson correlation statistic.
Variable Definitions:PTR � whether the session was led by the partner or forensic specialist �coded � 1, 0 otherwise�;
IT � whether an IT audit specialist attended the primary session �coded � 1, 0 otherwise�;EARLY � whether the engagement’s primary session was held pre-planning or early in planning �coded � 1, 0 ot
FD � extent of discussion about how management might perpetrate fraud, measured on a scale where 1 � exRD � extent of discussion about audit responses to fraud risk, measured on a scale where 1 � extremely lowMC � level of manager contribution to the session, measured on a scale where 1 � extremely low and 10 �PC � level of partner contribution to the session, measured on a scale where 1 � extremely low and 10 � ex
EXP � engagement team expertise, measured on a scale where 1 � extremely low and 10 � extremely high; aSIZE � client size based on client revenues and coded as follows: 1 � � $100 million, 2 � $100 million–$500
billion–$5 billion, 5 �� $5 billion.

voo1Hlcswe
H
F
mbapm�fin
ooospifbfintT
7
8
9
Auditors’ Use of Brainstorming in the Consideration of Fraud: Reports from the Field 1291
T
ariances to assess multicollinearity �e.g., Belsley et al. 1980; Core et al. 2002�, we find that onlyne of the 33 condition indices for H1 exceeds the standard threshold of 30, and over 50 percentf the variances for the intercept and session quality are associated with this index �Belsley et al.980; Kennedy 2008�. This is likely the result of session quality being included in the model for1 five times �one main effect and four interactions�.7 Thus, for testing H1, multicollinearity is
ikely to bias against finding significant main and interactive effects for session quality, andaution must be taken in interpreting null findings for this variable. For H2 analyses �with theession quality indicator variable�, both VIFs and condition indices/variances indicate no problemsith multicollinearity, as all measures are below acceptable thresholds �Neter et al. 1996; Belsley
t al. 1980; Kennedy 2008�.8
ypotheses Testing
raud Risk Factors, Fraud Risk Assessments, and Brainstorming Session QualityHypothesis 1 posits that fraud risk factors are more positively related to fraud risk assess-
ents in high-quality brainstorming sessions than in low-quality sessions. Thus, H1 is supportedy a regression result that provides positive and significant interactions between fraud risk factorsnd session quality on fraud risk assessments. Table 6 provides the results of H1 testing. Forarsimony, only control variables with p-values � 0.10 are included in Tables 6 and 7. While theain effects of market incentive, opportunity, and rationalization are all positive and significant
p-values � 0.05�, their interactions with brainstorming session quality are not. Thus, while wend that three of the four risk factors are positively associated with fraud risk assessments, we doot observe that these relations are stronger under higher quality brainstorming.
However, diagnostics suggest that multicollinearity influences the main and interactive effectsf session quality in the regression model for H1 �specifically related to its interaction withpportunity�. As suggested by Bradshaw et al. �2004� and Covrig et al. �2007�, we complementur analysis of H1 with two separate regressions with session quality as low and high �twoubsamples�. We partition the sample at the mean brainstorming quality score �10.56�, and re-erform the statistical tests described above for each of the two groups �removing the brainstorm-ng quality variable�. If session quality positively moderates the effect of fraud risk factors onraud risk assessments, then the main effects of fraud risk factors on fraud risk assessments shoulde more significant for the high-quality subsample. We find this to be the case for the fraud riskactors of debt incentive and opportunity. For the high-quality group, tests of H1 �not tabulated�ndicate at least marginally significant and positive relations between debt incentive and opportu-ity on fraud risk assessments �p-values � 0.06 and 0.04, respectively�. For the low-quality group,he relations between debt incentive and opportunity on fraud risk assessments are not significant.hus, there is limited evidence supporting H1.9
Given the significant correlations between our fraud risk factors �see Table 5� and that auditors simultaneously incor-porate fraud risk factors into one fraud risk assessment, not including all four fraud risk factors in the same multivariateregression could yield spurious results.To ensure that our interaction results are stable across various specifications, we analyze the following models: �1� withboth main and interactive effects for continuous hypothesized variables, �2� with both main and interactive effects forcontinuous hypothesized variables �mean-centered�, �3� with only interactive effects for continuous hypothesized vari-ables �no mean-centering�, and �4� with both main and interactive effects for continuous hypothesized variables �nomean-centering, but session quality as an indicator variable �the tabulated model��. Our primary inferences are similaracross all four models: the interactions for H1 are largely not supported and the interactions for H2 are largelysupported. It should be noted that Echambadi and Hess �2007� conclude that mean-centering does not alleviate col-linearity problems in multivariate regressions.Notwithstanding our expectation, we find only limited evidence that the quality of brainstorming sessions moderates therelations between risk factors and assessments. Anecdotal evidence from conversations with partners at the Big 4 firmssuggests one possible explanation for our results. These partners report that engagement team management come to
he Accounting Review July 2010American Accounting Association

F
rrasac
I
MDORSMDORCE
FRM
P
a
b
1292 Brazel, Carpenter, and Jenkins
TA
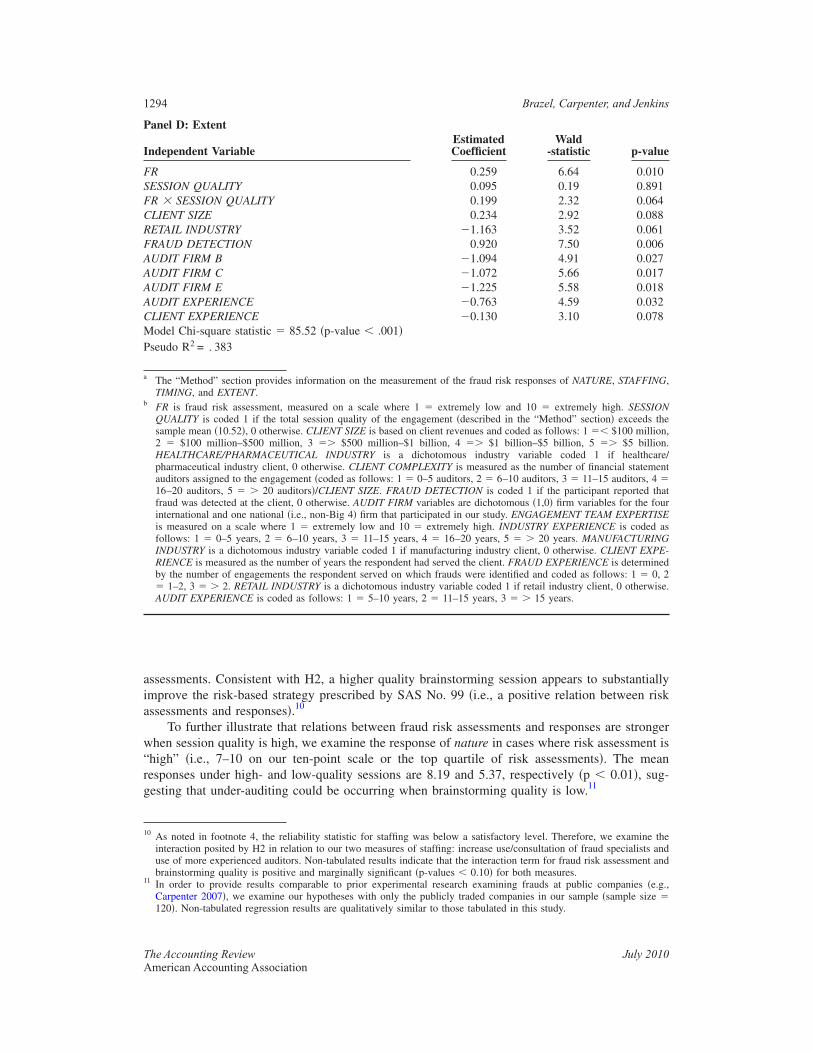
raud Risk Assessments, Fraud Risk Responses, and Brainstorming Session Quality
Hypothesis 2 posits that fraud risk assessments are more positively related to fraud riskesponses in high-quality brainstorming sessions than in low-quality sessions. Table 7 presentsesults related to H2. For nature, staffing, timing, and extent, the interaction terms for fraud riskssessment and session quality are all positive and at least marginally significant �p-values � 0.10,ee Panels A–D�, thus supporting H2. When brainstorming session quality is higher, audit teamsre more likely to add or change testing procedures, employ more senior staffing/fraud specialists,hange the timing of tests, and increase the extent of testing in response to higher fraud risk
brainstorming sessions with a lot of information about the likelihood of fraud based on prior years’ work and clientcontinuation discussions. Specifically, partners indicate that fraud risk assessments are often based on the presence orabsence of specific risk factors such that assessments are effectively predetermined by the partners prior to the brain-storming sessions. In such instances, brainstorming serves primarily to inform team members about the known riskfactors, to discuss other possible factors that might not have been pre-identified and, more importantly, to give them anopportunity to discuss how best to respond to fraud risk. How previous client experiences, client continuation discus-sions, and other factors affect the brainstorming process and fraud-related judgments is a question for future research.
TABLE 6
H1 Testing: Regression Results for Fraud Risk Assessmenta
ndependent VariablebEstimatedCoefficient
Wald-Statistic p-value
I 0.271 2.96 0.043I 0.095 1.07 0.150PP 0.317 3.13 0.039AT 0.249 4.35 0.019ESSION QUALITY 0.409 0.11 0.739I � SESSION QUALITY 0.001 0.00 0.499I � SESSION QUALITY 0.018 0.02 0.443PP � SESSION QUALITY 0.086 0.14 0.356AT � SESSION QUALITY �0.132 0.71 0.398LIENT SIZE �0.252 3.10 0.078NGAGEMENT TEAMEXPERTISE
0.200 3.75 0.053
RAUD TRAINING 0.649 7.23 0.007ESTART �1.580 3.51 0.061odel Chi-square statistic �79.60 �p-value � � .001�
seudo R2 = . 362
Fraud risk assessment �FR� is measured on a scale where 1 � extremely low and 10 � extremely high.The “Method” section provides information on the measurement of market incentive, debt incentive, opportunity,rationalization. SESSION QUALITY is coded 1 if the total session quality of the engagement �described in the “Method”section� exceeded the sample mean �10.56�, 0 otherwise. CLIENT SIZE is based on client revenues and coded asfollows: 1 �� $100 million, 2 � $100 million–$500 million, 3 �� $500 million–$1 billion, 4 �� $1 billion–$5billion, 5 �� $5 billion. ENGAGEMENT TEAM EXPERTISE is measured on a scale where 1 � extremely low and 10� extremely high. FRAUD TRAINING is measured by the number of hours of fraud training the respondent hadreceived in the last year and coded as follows: 1 � 0–8 hours, 2 � 9–16 hours, 3 � � 16 hours. RESTART is coded 1if the participant stopped and restarted the survey, 0 otherwise.
he Accounting Review July 2010merican Accounting Association

P
I
FSFCHCFAAAEIMP
P
I
FSFCCFMP
P
I
FSFMAACFMP
Auditors’ Use of Brainstorming in the Consideration of Fraud: Reports from the Field 1293
T
TABLE 7
H2 Testing: Regression Results for Fraud Risk Responsesa
anel A: Nature
ndependent VariablebEstimatedCoefficient
Wald-Statistic p-value
R 0.229 5.22 0.022ESSION QUALITY �0.148 0.05 0.832R � SESSION QUALITY 0.196 2.26 0.067LIENT SIZE 0.273 3.92 0.048EALTHCARE/PHARMACEUTICAL INDUSTRY �1.903 7.92 0.005LIENT COMPLEXITY 0.643 5.68 0.017RAUD DETECTION 0.667 3.98 0.046UDIT FIRM A �1.294 6.14 0.013UDIT FIRM C �0.888 3.88 0.049UDIT FIRM E �1.294 6.14 0.013NGAGEMENT TEAM EXPERTISE 0.162 3.38 0.066
NDUSTRY EXPERIENCE 0.055 3.42 0.064odel Chi-square statistic � 87.35 �p-value � .001�
seudo R2 = .390
anel B: Staffing
ndependent VariableEstimatedCoefficient
Wald-Statistic p-value
R 0.154 2.30 0.130ESSION QUALITY �0.130 0.03 0.854R � SESSION QUALITY 0.260 3.84 0.025LIENT SIZE 0.504 12.52 �0.001LIENT COMPLEXITY 0.599 5.00 0.025RAUD DETECTION 0.792 5.44 0.020odel Chi-square statistic � 94.62 �p-value � .001�
seudo R2 = . 414
anel C: Timing
ndependent VariableEstimatedCoefficient
Wald-Statistic p-value
R 0.101 0.95 0.330ESSION QUALITY �0.939 1.71 0.191R � SESSION QUALITY 0.328 5.96 0.008ANUFACTURING INDUSTRY 1.097 4.39 0.036UDIT FIRM A �1.29 5.13 0.023UDIT FIRM B �1.90 13.37 �0.001LIENT EXPERIENCE �0.137 3.19 0.074RAUD EXPERIENCE �0.426 3.23 0.072odel Chi-square statistic � 78.31 �p-value � .001�
seudo R2 = . 358
(continued on next page)
he Accounting Review July 2010American Accounting Association
aia
w“rg
1
1
Panel D: Extent
I
FSFCRFAAAACMP
a
b
1294 Brazel, Carpenter, and Jenkins
TA
ssessments. Consistent with H2, a higher quality brainstorming session appears to substantiallymprove the risk-based strategy prescribed by SAS No. 99 �i.e., a positive relation between riskssessments and responses�.10
To further illustrate that relations between fraud risk assessments and responses are strongerhen session quality is high, we examine the response of nature in cases where risk assessment is
high” �i.e., 7–10 on our ten-point scale or the top quartile of risk assessments�. The meanesponses under high- and low-quality sessions are 8.19 and 5.37, respectively �p � 0.01�, sug-esting that under-auditing could be occurring when brainstorming quality is low.11
0 As noted in footnote 4, the reliability statistic for staffing was below a satisfactory level. Therefore, we examine theinteraction posited by H2 in relation to our two measures of staffing: increase use/consultation of fraud specialists anduse of more experienced auditors. Non-tabulated results indicate that the interaction term for fraud risk assessment andbrainstorming quality is positive and marginally significant �p-values � 0.10� for both measures.
1 In order to provide results comparable to prior experimental research examining frauds at public companies �e.g.,Carpenter 2007�, we examine our hypotheses with only the publicly traded companies in our sample �sample size �120�. Non-tabulated regression results are qualitatively similar to those tabulated in this study.
ndependent VariableEstimatedCoefficient
Wald-statistic p-value
R 0.259 6.64 0.010ESSION QUALITY 0.095 0.19 0.891R � SESSION QUALITY 0.199 2.32 0.064LIENT SIZE 0.234 2.92 0.088ETAIL INDUSTRY �1.163 3.52 0.061RAUD DETECTION 0.920 7.50 0.006UDIT FIRM B �1.094 4.91 0.027UDIT FIRM C �1.072 5.66 0.017UDIT FIRM E �1.225 5.58 0.018UDIT EXPERIENCE �0.763 4.59 0.032LIENT EXPERIENCE �0.130 3.10 0.078odel Chi-square statistic � 85.52 �p-value � .001�
seudo R2 = . 383
The “Method” section provides information on the measurement of the fraud risk responses of NATURE, STAFFING,TIMING, and EXTENT.FR is fraud risk assessment, measured on a scale where 1 � extremely low and 10 � extremely high. SESSIONQUALITY is coded 1 if the total session quality of the engagement �described in the “Method” section� exceeds thesample mean �10.52�, 0 otherwise. CLIENT SIZE is based on client revenues and coded as follows: 1 �� $100 million,2 � $100 million–$500 million, 3 �� $500 million–$1 billion, 4 �� $1 billion–$5 billion, 5 �� $5 billion.HEALTHCARE/PHARMACEUTICAL INDUSTRY is a dichotomous industry variable coded 1 if healthcare/pharmaceutical industry client, 0 otherwise. CLIENT COMPLEXITY is measured as the number of financial statementauditors assigned to the engagement �coded as follows: 1 � 0–5 auditors, 2 � 6–10 auditors, 3 � 11–15 auditors, 4 �16–20 auditors, 5 � � 20 auditors�/CLIENT SIZE. FRAUD DETECTION is coded 1 if the participant reported thatfraud was detected at the client, 0 otherwise. AUDIT FIRM variables are dichotomous �1,0� firm variables for the fourinternational and one national �i.e., non-Big 4� firm that participated in our study. ENGAGEMENT TEAM EXPERTISEis measured on a scale where 1 � extremely low and 10 � extremely high. INDUSTRY EXPERIENCE is coded asfollows: 1 � 0–5 years, 2 � 6–10 years, 3 � 11–15 years, 4 � 16–20 years, 5 � � 20 years. MANUFACTURINGINDUSTRY is a dichotomous industry variable coded 1 if manufacturing industry client, 0 otherwise. CLIENT EXPE-RIENCE is measured as the number of years the respondent had served the client. FRAUD EXPERIENCE is determinedby the number of engagements the respondent served on which frauds were identified and coded as follows: 1 � 0, 2� 1–2, 3 � � 2. RETAIL INDUSTRY is a dichotomous industry variable coded 1 if retail industry client, 0 otherwise.AUDIT EXPERIENCE is coded as follows: 1 � 5–10 years, 2 � 11–15 years, 3 � � 15 years.
he Accounting Review July 2010merican Accounting Association

S
S
tas2iiahpma
is�bfaplsii
C
ostpsFtp
eoe�s
1
1
Auditors’ Use of Brainstorming in the Consideration of Fraud: Reports from the Field 1295
T
upplemental Discussion and Analyses
pecific Brainstorming Quality Items Driving EffectsWhile our 21-item measure of brainstorming quality is motivated by the literature and appears
o improve the responsiveness of fraud judgments, it might not be practical for audit teams todjust all 21 items at once to improve their brainstorming sessions. We therefore examine if amaller number of items could be identified that would produce the same moderating effects as our1-item measure. As the correlation matrix �Table 5� indicates, it appears that seven brainstormingtems are significantly correlated with a number of the hypothesized variables in this study. Thesetems are: �1� whether the session was led by the partner or forensic specialist, �2� whether an ITudit specialist attended the primary session, �3� whether the engagement’s primary session waseld pre-planning or early in planning, �4� the extent of discussion about how management mighterpetrate fraud, �5� the extent of discussion about audit responses to fraud risk, �6� the level ofanager contribution to the session, and �7� the level of partner contribution to the session. These
re all controllable inputs that can be easily fostered by engagement management.In testing H1 and H2, we replace the brainstorming quality indicator variable based upon 21
tems with one based upon these seven items. Non-tabulated regression results reveal that thiseven-item measure positively moderates the effect of rationalization on fraud risk assessments �p
0.03�. Recall that in Table 6, using a session-quality measure based on 21 items, all interactionsetween fraud risk factors and session quality are not significant. Similarly, the indicator variableor session quality based upon seven items positively moderates the relations between fraud riskssessments and the response factors of nature and staffing �p-values � 0.05�. It is especiallyromising that concentrating on the aforementioned seven items could improve the often tenuousink between fraud risk assessments and the nature of testing. While our results using only theeven items do not provide exactly the same results as those tabulated with the 21-item measure,t appears that ensuring these seven items occur is a practical first step, or set of best practices, tomprove the quality of brainstorming.12
ontrol VariablesWith respect to the direct effects of control variables on fraud risk assessment in Table 6, we
bserve a negative relation between client size and fraud risk assessments. Consistent with Bea-ley et al. �1999�, who find that fraud can be more prevalent at smaller companies; auditors tendo assess fraud risk higher for smaller clients. We find that engagement team expertise has aositive association with risk assessments, suggesting that auditors with more expertise are as-igned to riskier engagements. We also find a positive effect for fraud training on risk assessment.inally, participants who stopped and restarted the survey provided lower fraud risk assessments
han other participants. Given this result, we re-perform our analyses of H1 and H2 without thearticipants who stopped and restarted and observe qualitatively similar results.13
The mean fraud risk assessment for our sample �4.92 on a ten-point scale� could be consid-red high, as the base rate for fraud is fairly low. On the other hand, given the relatively high ratef fraud detection in our sample �24 percent�, a higher mean fraud risk assessment might bexpected. In fact, the mean fraud risk assessment for the subset of audits where fraud was detectedn � 43� is a surprisingly low 5.44, and is only marginally higher than the mean for the non-fraudubset �mean � 4.75; p � 0.09; non-tabulated t-test�. Moreover, fraud detection is not signifi-
2 When we perform the same analyses with the remaining 14 items, there are no significant results for H1 or H2. Thissuggests that the seven items described above are driving our results.
3 It is unclear why these participants provided lower fraud risk assessments. A review and analysis of the data for theseparticipants reveal no clear explanation of the variable’s significance.
he Accounting Review July 2010American Accounting Association
caai
aftttwi
tdiwcrctaam
aHitetdqwc
O
m2pdpaagpct
1296 Brazel, Carpenter, and Jenkins
TA
antly associated with fraud risk assessment in Table 6 �non-tabulated p � 0.50�. Thus, whileuditors in our sample were generally adept at incorporating fraud risk factors into fraud riskssessments, given ex post evidence of fraud detection, our results suggest that auditors still couldmprove the accuracy of their fraud risk assessments.
With respect to fraud responses, Table 7 illustrates that, as client size increases, auditorsppear to be more likely to adjust the nature, staffing, and extent of testing. The larger auditees/budgets for bigger clients typically allow for more testing when needed. Larger clients alsoend to be more prestigious and, if needed to respond to fraud risks, engagement leaders canypically acquire additional audit professionals for the engagement. The negative relation betweenhe healthcare/pharmaceutical industry and the nature of testing likely reflects that this industryas the only industry in our sample not to have fraud detected during the audit �possibly due to the
ndustry being heavily regulated�.As one would expect, as client complexity increases, audit teams tend to alter the nature of
esting and use more competent staff. Of particular interest is the positive link between theetection of fraud and the nature, staffing, and extent of procedures. These responses appear to bentegral to detecting fraud, and it could be important for auditors to adjust their testing in multipleays to improve fraud detection. It is also interesting to note that fraud detection is not signifi-
antly associated with the timing of tests. Consistent with this finding, we observe negativeelations between both client experience and fraud experience and the timing of testing. Theseombined findings suggest that experienced auditors likely question the effectiveness of changinghe timing of testing to detect fraud. However, this relation could be industry specific, as we findpositive association between the manufacturing industry and the timing of tests. Given the risks
ssociated with manipulating ending inventory, auditors of manufacturing clients appear to beore apt to change the timing of their inventory examinations.
We find that audit firms are related to a number of our responses. Firms have different auditpproaches or structures, and these differences can lead to different audit judgments �Prawitt 1995;yatt and Prawitt 2001�. As one would expect, higher levels of engagement team expertise and
ndustry experience are positively associated with the difficult task of changing the nature ofesting. Last, we observe negative associations between both audit experience and client experi-nce and the extent of the response. Given the positive relationship between fraud detection andhe extent of testing �i.e., evidence that changing the extent of procedures can be an effective fraudetection tool�, these combined findings suggest a negative effect of longer auditor tenure on audituality. Such relations could, to some extent, be mitigated by the Sarbanes-Oxley Act of 2002,hich mandates a five-year rotation for the lead and concurring audit partners on publicly traded
lients �U.S. House of Representatives 2002�.
ther Data IssuesAs previously noted, fraud was detected on 24 percent of the engagements in our sample, a
uch higher rate than reported by previous studies �e.g., Loebbecke et al. 1989; Nieschwietz et al.000�. This high rate of fraud could be due to the fact that fraud cases were more salient toarticipants when they selected an audit as the basis for responding to our survey. We asked foretailed information on the types and sizes of the frauds that were detected. However, fewarticipants chose to provide this information. One respondent reported a fraud related to man-gement’s manipulation of payroll reports, while another reported a fraud related to payments to
fictitious vendor. In comparison to the other industries in our sample, both retail andovernmental/not-for-profit entities had unusually high rates of fraud detection �36 percent and 32ercent, respectively�. In retail, the misappropriation of retail inventory, whether material or not,ould have contributed to its high rate. For governmental and not-for-profit entities, the incentiveo fraudulently misstate financial statements is lower than in other industries. Thus, it is possible
he Accounting Review July 2010merican Accounting Association
tfi
rwdDaa
smcvbe�npsa
pmlwroeatl
hsd
maaMmA
1
Auditors’ Use of Brainstorming in the Consideration of Fraud: Reports from the Field 1297
T
hat some frauds in our sample were related to misappropriations of assets �versus fraudulentnancial reporting� and were likely immaterial from the auditor’s perspective.
Given the high rate of fraud in our sample, we consider whether our primary results hinge onecalled audits that detected fraud. We examine this concern in two ways. First, we control forhether fraud was detected in all of our analyses. We find support for H2 even though the fraudetection control variable is significant in several of our analyses �see Table 7, Panels A, B, and�. Second, in non-tabulated analyses, we remove the 43 engagements where fraud was detected
nd find qualitatively similar results �i.e., H1 �H2� is not �is� supported�.14 Thus, our results do notppear to be an artifact of engagements for which fraud was detected.
We also examine whether our brainstorming data presented in Table 3 are significantlykewed by these engagements. Non-tabulated t-tests for each of the 21 items find that none of theeans are significantly different between audits where fraud was or was not detected. Likewise,
orrelations between the fraud detection control variable and the 21-item measure and indicatorersions of brainstorming session quality are not significant �p-values � 0.50�. Last, the meanrainstorming quality score for the fraud sample �10.56� is actually equal to the mean for ourntire sample �10.56� and is not significantly different than the mean for the non-fraud sample10.57; p � 0.50�. Thus, it appears that the descriptive brainstorming data presented in Table 3 isot significantly skewed by our fraud observations and that, for audits where fraud was detected,articipants were not biased toward providing responses reflecting high-quality brainstormingessions. In summary, these additional analyses suggest that our results are not primarily attribut-ble to the audits in our sample where fraud was detected.
From an association perspective, it might be that audits with higher fraud risk assessmentsrompt auditors to conduct higher quality brainstorming sessions and carefully link fraud judg-ents as precautionary measures. Consequently, our results might not be reflective of audits with
ower fraud risk assessments. In Table 5, we find that session quality is only marginally correlatedith fraud risk assessments �p � 0.09� and, in a multivariate setting �Table 6�, we find that fraud
isk assessments and session quality are not significantly related �p � 0.50�. Still, we re-performur regressions with only audits where the fraud risk assessment ranged from 2–6 �removingngagements with the highest fraud risk assessments �7–10 or the top quartile of fraud riskssessments��. As noted in Figure 2, no respondents provided a fraud risk assessment of 1. Non-abulated results related to this subset of less risky audits are qualitatively similar to those tabu-ated. Thus, our results do not appear to be driven by the riskier audit engagements in our sample.
V. CONCLUSIONSAS No. 99 requires brainstorming sessions on every audit �AICPA 2002�, but the PCAOB
as raised concerns about the quality of these sessions in practice �PCAOB 2007�. This is the firsttudy, to our knowledge, to consider whether and how the quality of brainstorming influences teamecision-making.
Our study makes several contributions to research and practice. Leveraging the field surveyethod, we develop and test a measure of brainstorming quality using data collected from 179
ctual audit engagements. We find that fraud risk factors are positively correlated with fraud riskssessments, and we find some evidence that brainstorming quality moderates these relations.ore importantly, we find that when brainstorming quality is perceived to be higher, risk assess-ents are more positively related to the nature, staffing, timing, and extent of audit procedures.chieving a high level of brainstorming quality appears to improve the audit team’s consideration
4 In tests of H1, excluding the 43 engagements where fraud was detected, all independent variables of interest are notsignificant �p-values � 0.50�. In tests of H2, all independent variables of interest are significant �p-values � 0.10�.
he Accounting Review July 2010American Accounting Association

oo
b2npitmb
ssbaha
cwqsaUlthh
A
—
A
A
B
B
—
—
1298 Brazel, Carpenter, and Jenkins
TA
f fraud by cultivating a broader set of responses to identified fraud risks. However, we alsobserve that under-auditing can occur when brainstorming quality is low.
Prior and contemporary studies provide evidence that the extent that auditors benefit fromrainstorming depends on the brainstorming method employed �Carpenter 2007; Hunton and Gold010�. Archival research on fraud has investigated data from multiple public companies, but hasot examined auditors’ judgments in practice �e.g., Beasley 1996�. Our results thus triangulaterior experimental and archival research and extend the fraud literature by providing new andmportant insights on the costs and benefits of fraud brainstorming for actual audit teams. Further,he descriptive data contained herein further enhance our understanding of the fraud decision-
aking and brainstorming processes. These data should provide a basis for further modeling ofrainstorming and future empirical research in team decision-making.
While it might seem obvious �and arguably required by SAS No. 99� that high-quality brain-torming sessions should exist in practice, our results and recent PCAOB findings indicate sub-tantial variation in brainstorming quality �PCAOB 2007�. Indeed, auditors continue to seek betterrainstorming methods �Landis et al. 2008�. Thus, we contribute to practice by providing auditorsnd regulators with descriptive data that �1� complement previous PCAOB inspections and �2�ighlight best practices for auditors to improve their fraud judgments �e.g., attendance of an ITudit specialist, and occurrence of the session early in planning�.
Our study is subject to several limitations. Allowing participants to select their own auditsould have biased their responses toward engagements that were memorable, such as when fraudas found. Our approach might have also led participants to select sessions they perceived as highuality or to report in such a way as to bolster their perception of having conducted a high-qualityession. Our sample contains a fraud detection rate of 24 percent, which is likely higher than thectual rate of fraud in the population and is higher than the rate reported in earlier studies.nfortunately, few participants reported details related to the frauds they identified, so we have
ittle understanding of their nature. Sensitivity analyses to control for these engagements suggesthat reported results are not driven by engagements on which fraud was detected or fraud risk wasigh. We also find that, for audits where fraud was detected, participants were not biased to reportigher quality brainstorming sessions.
REFERENCES
merican Institute of Certified Public Accountants �AICPA�. 2002. Consideration of Fraud in a FinancialStatement Audit. Statement on Auditing Standards No. 99. New York, NY: AICPA.
—–. 2003. AICPA Practice Aid Series, Fraud Detection in a GAAS Audit. SAS No. 99 ImplementationGuide. New York, NY: AICPA.
li, A., S. Klasa, and O. Z. Li. 2008. Institutional stakeholdings and better-informed traders at earningsannouncements. Journal of Accounting and Economics 46 �1�: 47–61.
sare, S. K., and A. M. Wright. 2004. The effectiveness of alternative risk assessment and program planningtools in a fraud setting. Contemporary Accounting Research 21 �2�: 325–352.
amber, E. M., D. Snowball, and R. M. Tubbs. 1989. Audit structure and its relation to role conflict and roleambiguity: An empirical investigation. The Accounting Review 64 �2�: 285–299.
easley, M. S. 1996. An empirical analysis of the relation between board of director composition andfinancial statement fraud. The Accounting Review 71 �4�: 443–465.
—–, J. V. Carcello, and D. R. Hermanson. 1999. Fraudulent Financial Reporting: 1987–1997 An Analysisof U.S. Public Companies. New York, NY: Committee of Sponsoring Organizations of the TreadwayCommission.
—–, and J. G. Jenkins. 2003. A primer for brainstorming fraud risks. Journal of Accountancy 196 �6�:32–38.
he Accounting Review July 2010merican Accounting Association
B
B
B
B
B
C
C
C
C
C
D
—
D
D
D
E
E
G
G
H
H
H
H
H
H
Auditors’ Use of Brainstorming in the Consideration of Fraud: Reports from the Field 1299
T
elsley, D. A., E. Kuh, and R. E. Welsch. 1980. Regression Diagnostics: Identifying Influential Data andSources of Collinearity. New York, NY: John Wiley.
eneish, M. 1997. Detecting GAAP violations: Implications for assessing earnings management among firmswith extreme financial performance. Journal of Accounting and Public Policy 16 �3�: 271–309.
onner, S. E. 1990. Experience effects in auditing: The role of task-specific knowledge. The AccountingReview 65 �1�: 72–92.
radshaw, M. T., B. J. Bushee, and G. S. Miller. 2004. Accounting choice, home bias, and U.S. investmentin non-U.S. firms. Journal of Accounting Research 42 �5�: 795–841.
razel, J. F., K. Jones, and M. F. Zimbelman. 2009. Using nonfinancial measures to assess fraud risk. Journalof Accounting Research 47 �5�: 1135–1166.
ardinaels, E. 2008. The interplay between cost accounting knowledge and presentation formats in cost-based decision-making. Accounting, Organizations and Society 33 �6�: 582–602.
arpenter, T. D. 2007. Audit team brainstorming, fraud risk identification, and fraud risk assessment: Impli-cations of SAS No. 99. The Accounting Review 82 �5�: 1119–1140.
haiken, S., and Y. Trope. 1999. Dual-Process Theories in Social Psychology. New York, NY: GuilfordPress.
ore, J. E., W. R. Guay, and S. P. Kothari. 2002. The economic dilution of employee stock options: DilutedEPS for valuation and financial reporting. The Accounting Review 77 �3�: 627–652.
ovrig, V. M., M. L. DeFond, and M. Y. Hung. 2007. Home bias, foreign mutual fund holdings, and thevoluntary adoption of international accounting standards. Journal of Accounting Research 45 �1�:41–70.
e Dreu, C. K. W. 2003. Time pressure and closing of the mind in negotiation. Organizational Behavior andHuman Decision Processes 91 �2�: 280–295.
—– 2007. Cooperative outcome interdependence, task reflexivity, and team effectiveness: A motivatedinformation processing perspective. The Journal of Applied Psychology 92 �3�: 628–638.
eFond, M. L., R. N. Hann, and X. Hu. 2005. Does the market value financial expertise on audit committeesof boards of directors? Journal of Accounting Research 43 �2�: 153–193.
iehl, M., and W. Stroebe. 1987. Productivity loss in brainstorming groups: Toward the solution of the riddle.Journal of Personality and Social Psychology 53 �3�: 497–509.
owling, C. 2009. Appropriate audit support system use: The influence of auditor, audit team, and firmfactors. The Accounting Review 84 �3�: 771–810.
chambadi, R., and J. D. Hess. 2007. Mean-centering does not alleviate collinearity problems in moderatedmultiple regression models. Marketing Science 26 �3�: 438–445.
lliott, R. K. 2002. Twenty-first century assurance. Auditing: A Journal of Practice & Theory 21 �1�:139–146.
ibbins, M., S. Salterio, and A. Webb. 2001. Evidence about auditor-client management negotiation con-cerning client’s financial reporting. Journal of Accounting Research 39 �3�: 535–563.
lover, S. M., D. F. Prawitt, J. J. Schultz, Jr., and M. F. Zimbelman. 2003. A test of changes in auditors’fraud-related planning judgments since the issuance of SAS No. 82. Auditing: A Journal of Practice &Theory 22 �2�: 237–251.
air, J. F., R. E. Anderson, R. L. Tatham, and W. C. Black. 1998. Multivariate Data Analysis. 5th edition.Upper Saddle River, NJ: Prentice Hall.
ackenbrack, K., and W. R. Knechel. 1997. Resource allocation decisions in audit engagements. Contempo-rary Accounting Research 14 �3�: 481–499.
ill, G. W. 1982. Group versus individual performance: Are N�1 heads better than one? PsychologicalBulletin 91 �3�: 517–539.
insz, V. B., R. S. Tindale, and D. A. Volrath. 1997. The emerging conceptualization of groups as informa-tion processors. Psychological Bulletin 121 �1�: 43–64.
offman, V. B., and M. F. Zimbelman. 2009. Do strategic reasoning and brainstorming help auditors changetheir standard audit procedures in response to fraud risk? The Accounting Review 84 �3�: 811–837.
unton, J., and A. Gold. 2010. A field experiment comparing the outcomes of three fraud brainstormingprocedures: Nominal group, round robin and open discussion. The Accounting Review 85 �3�: 911–935.
he Accounting Review July 2010American Accounting Association
H
J
KK
K
LL
L
M
N
N
N
NO
O
P
P
P
—
—
—
S
S
—
1300 Brazel, Carpenter, and Jenkins
TA
yatt, T. A., and D. F. Prawitt. 2001. Does congruence between audit structure and auditors’ locus of controlaffect job performance? The Accounting Review 76 �2�: 263–274.
ohnstone, K. M., and J. C. Bedard. 2003. Risk management in client acceptance decisions. The AccountingReview 78 �4�: 1003–1025.
ennedy, P. 2008. A Guide to Econometrics. 6th edition. Cambridge, MA: MIT Press.line, R. B. 2004. Principles and Practice of Structural Equation Modeling. 2nd edition. New York, NY:
Guilford Publications.ruglanski, A. W., and T. Freund. 1983. The freezing and unfreezing of lay inferences: Effects of impres-
sional primacy, ethnic stereotyping, and numerical anchoring. Journal of Experimental Social Psychol-ogy 19 �5�: 448–468.
andis, M., S. I. Jerris, and M. Braswell. 2008. Better brainstorming. Journal of Accountancy 206 �4�: 70–73.oebbecke, J. K., M. M. Eining, and J. J. Willingham. 1989. Auditors’ experience with material irregularities:
Frequency, nature, and detectability. Auditing: A Journal of Practice & Theory 9 �1�: 1–28.ynch, A. L., U. S. Murthy, and T. J. Engle. 2009. Fraud brainstorming using computer-mediated commu-
nication: The effects of brainstorming technique and facilitation. The Accounting Review 84 �4�:1209–1232.
cVay, S. E. 2006. Earnings management using classification shifting: An examination of core and specialitems. The Accounting Review 81 �3�: 501–531.
elson, M. W., J. A. Elliott, and R. L. Tarpley. 2002. Evidence from auditors about managers’ and auditors’earnings management decisions. The Accounting Review 77 �Supplement�: 175–202.
eter, J., M. H. Kutner, C. J. Nachtsheim, and W. Wasserman. 1996. Applied Linear Statistical Models. 4thedition. New York, NY: McGraw-Hill.
ieschwietz, R. J., J. J. Schultz, and M. F. Zimbelman. 2000. Empirical research on external auditors’detection of financial statement fraud. Journal of Accounting Literature 19: 190–246.
unnally, J. D. 1978. Psychometric Theory. New York, NY: McGraw-Hill.’Keefe, T. B., D. A. Simunic, and M. T. Stein. 1994. The production of audit services: Evidence from a
major public accounting firm. Journal of Accounting Research 32 �2�: 241–261.ppenheim, A. N. 1992. Questionnaire Design, Interviewing, and Attitude Measurement. New York, NY:
Pinter Publishers.ostmes, T., R. Spears, and S. Cihangir. 2001. Quality of decision making and group norms. Journal of
Personality and Social Psychology 80 �6�: 918–930.rawitt, D. F. 1995. Staffing assignments for judgment-oriented audit tasks: The effects of structured audit
technology and environment. The Accounting Review 70 �3�: 443–465.ublic Company Accounting Oversight Board �PCAOB�. 2003. Professionalism is primary. Remarks deliv-
ered by Douglas R. Carmichael at AICPA National Conference, Washington, D.C., December 12.—–. 2004. PCAOB standing advisory group meeting: Meeting agenda, September 8–9. Available at:
http://pcaobus.org/News_and_Events/Events/2004/09-08-09.aspx.—–. 2007. Observations on auditors’ implementation of PCAOB standards relating to auditors’ responsi-
bilities with respect to fraud. Available at: http://pcaob.org/inspections/other/01-22_release_2007-001.pdf.
—–. 2008. Report on the PCAOB’s 2004, 2005, 2006, and 2007 inspections of domestic annually inspectedfirms. Available at: http://pcaobus.org/Inspections/Documents/2008_12-05_Release_2008-008.pdf.
chippers, M. C., D. N. Den Hartog, P. L. Koopman, and J. A. Wienk. 2003. Diversity and team outcomes:The moderating effects of outcome interdependence and group longevity and the mediating effect ofreflexivity. Journal of Organizational Behavior 24 �6�: 779–802.
tasser, G. 1999. The uncertain role of unshared information in collective choice. In Shared Cognition inOrganizations: The Management of Knowledge, edited by Thompson, L., J. M. Levine, and D. M.Messick, 49–69. Hillsdale, NJ: Erlbaum.
—–, and Z. Birchmeier. 2003. Group creativity and collective choice. In Group Creativity: Innovationthrough Collaboration, edited by Paulus, P. B., and B. A. Nijstad, 85–109. New York, NY: OxfordUniversity Press.
he Accounting Review July 2010merican Accounting Association
U
W
W
Z
Auditors’ Use of Brainstorming in the Consideration of Fraud: Reports from the Field 1301
T
.S. House of Representatives. 2002. Sarbanes-Oxley Act of 2002. Public Law 107–204 �H. R. 3763�.Washington, D.C.: Government Printing Office.
ilks, T. J., and M. F. Zimbelman. 2004. Decomposition of fraud-risk assessments and auditors’ sensitivityto fraud cues. Contemporary Accounting Research 21 �3�: 719–745.
ooldridge, J. M. 2009. Introductory Econometrics: A Modern Approach. 4th edition. Mason, OH: South-Western.
imbelman, M. F. 1997. The effects of SAS No. 82 on auditors’ attention to fraud risk factors and auditplanning decisions. Journal of Accounting Research 35 �Supplement�: 75–97.
he Accounting Review July 2010American Accounting Association