audited group and company annual financial statements at … audited group and company annual...
TRANSCRIPT

GRA
ND
PARA
DE IN
VESTM
ENTS LIM
ITED A
NN
UA
L FINA
NC
IAL STA
TEMEN
TS 2017
AUDITED GROUP AND COMPANY ANNUAL FINANCIAL STATEMENTS
AT 30 JUNE 2017

CONTENTS
Page
Company information 1Statement of responsibility by the Directors and Company Secretary 2Preparation of annual financial statements 2Independent auditor’s report 3 – 5Report of the Audit and Risk Committee 6Report of the Directors 7– 12
CONSOLIDATED ANNUAL FINANCIAL STATEMENTSConsolidated statement of comprehensive income 13Consolidated statement of financial position 14Consolidated statement of changes in equity 15Consolidated statement of cash flows 16Notes to the consolidated annual financial statements 17 – 76
COMPANY ANNUAL FINANCIAL STATEMENTSStatement of comprehensive income 77Statement of financial position 78Statement of changes in equity 79Statement of cash flows 80Notes to the Company annual financial statements 81– 90
APPENDICESAppendix 1: Principal subsidiary companies 91Appendix 2: Investments, associates and joint ventures 92Appendix 3: Directors’ interests in shares 93Appendix 4: Analysis of ordinary shareholders 94– 95

GRAND PARADE INVESTMENTS LIMITED ANNUAL FINANCIAL STATEMENTS 2017
CONSOLIDATED ANNUAL FINANCIAL STATEMENTS 1
COMPANY INFORMATION
DIRECTORS H Adams (Executive Chairman)
A Abercrombie
W Geach
R Hargey
T Karriem (Chief Executive Officer)
NV Maharaj
N Mlambo
C Priem
S Barends (Group Financial Director) (appointed 1 July 2017)
D Pienaar
NATURE OF BUSINESS Investment holding company
COMPANY SECRETARY LC Parton
PUBLIC OFFICER D Pienaar
PREPARER OF THE FINANCIAL STATEMENTS
The annual financial statements were prepared under supervision of Grand Parade Investments’ (GPI) Group Financial Director, S Barends CA(SA)
TRANSFER SECRETARIES Computershare Investor Services (Pty) Ltd
PO Box 61051
Marshalltown
2107
AUDITORS Ernst & Young Inc.
PO Box 656, Cape Town, 8000
ATTORNEYS Bernadt Vukic Potash & Getz
PO Box 252, Cape Town, 8000
BANKERS The Standard Bank of South Africa Limited
SPONSORS PSG Capital (Pty) Ltd
PO Box 7403
Stellenbosch
7600
REGISTERED OFFICE 10th Floor, 33 on Heerengracht
Heerengracht Street
Cape Town
8001
REGISTRATION NUMBER 1997/003548/06
DOMICILE AND COUNTRY OF INCORPORATION South Africa

2 CONSOLIDATED ANNUAL FINANCIAL STATEMENTS
STATEMENT OF RESPONSIBILITY BY THE DIRECTORS AND COMPANY SECRETARY for the year ended 30 June 2017
DIRECTORS’ APPROVALThe Directors are responsible for the preparation of the Annual Financial Statements (AFS) and other information contained in this report. In their opinion, the AFS set out in this report fairly represent the state of affairs of the Group and of the Company. The AFS have been prepared in accordance with International Financial Reporting Standards (IFRS) and in the manner required by the Companies Act No. 71 of 2008 (Companies Act).
The external auditors are responsible for conducting an independent audit of the AFS of the Company and its subsidiaries in accordance with International Standards on Auditing (ISA) and reporting their opinion to shareholders. Their report is presented on pages 3 to 5.
The Directors have reviewed the Group’s and Company’s budget and cash flow forecast for the year to 30 June 2018. On the basis of this review, and in light of the current financial position and existing borrowing facilities, the Directors are satisfied that the Group and Company are going concerns and have continued to adopt the going-concern basis in preparing the AFS.
The AFS were approved by the Board on 13 September 2017 and are signed on its behalf by:
HASSEN ADAMS TASNEEM KARRIEMExecutive Chairman Chief Executive Officer
DECLARATION BY THE COMPANY SECRETARYto the members of Grand Parade Investments Limited
Pursuant to section 88(2)(e) of the Companies Act, I certify that, to the best of my knowledge and belief, all returns required of the Company, in terms of said Act, have been duly lodged with the Companies Intellectual Property Commission (CIPC), and all such returns are true, correct and are up to date.
LAZELLE PARTONCompany Secretary
13 September 2017
PREPARATION OF ANNUAL FINANCIAL STATEMENTS
The AFS have been prepared under the supervision of the Group Financial Director.
SHAUN BARENDSGroup Financial Director
13 September 2017

GRAND PARADE INVESTMENTS LIMITED ANNUAL FINANCIAL STATEMENTS 2017
CONSOLIDATED ANNUAL FINANCIAL STATEMENTS 3
INDEPENDENT AUDITOR’S REPORT to the shareholders of Grand Parade Investments Limited
Report on the audit of the consolidated and separate financial statements
OPINIONWe have audited the consolidated and separate financial statements of Grand Parade Investments Limited set out on pages 13 to 90, which comprise the consolidated and separate statements of financial position as at 30 June 2017, and the consolidated and separate statements of profit or loss and other comprehensive income, the consolidated and separate statements of changes in equity and the consolidated and separate statements of cash flows for the period then ended, and notes to the consolidated and separate financial statements, including a summary of significant accounting policies.
In our opinion, the consolidated and separate financial statements present fairly, in all material respects, the consolidated and separate financial position of Grand Parade Investments Limited as at 30 June 2017, and its consolidated and separate financial performance and consolidated and separate cash flows for the period then ended in accordance with International Financial Reporting Standards and the requirements of the Companies Act of South Africa.
BASIS FOR OPINIONWe conducted our audit in accordance with International Standards on Auditing (ISAs). Our responsibilities under those standard s are further described in the Auditor’s Responsibilities for the Audit of the Consolidated and Separate Financial Statements section of our report. We are independent of Grand Parade Investments Limited in accordance with the Independent Regulatory Board for Auditors Code of Professional Conduct for Registered Auditors (IRBA Code), the International Ethics Standards Board for Accountants Code of Ethics for Professional Accountants (IESBA code) and other independence requirements applicable to performing the audit of Grand Parade Investments Limited. We have fulfilled our other ethical responsibilities in accordance with the IRBA Code, IESBA Code, and in accordance with other ethical requirements applicable to performing the audit of Grand Parade Investments Limited. We believe that the audit evidence we have obtained is sufficient and appropriate to provide a basis for our opinion.
KEY AUDIT MATTERSKey audit matters are those matters that, in our professional judgement, were of most significance in our audit of the consolidated and separate financial statements of the current year. These matters were addressed in the context of our audit of the consolidated and separate financial statements as a whole, and in forming our opinion thereon, and we do not provide a separate opinion on these matters. For each matter below, our description of how our audit addressed the matter is provided in that context.
We have fulfilled the responsibilities described in the Auditor’s Responsibilities for the Audit of the Consolidated and Separate Financial Statements section of our report, including in relation to these matters. Accordingly, our audit included the performance of procedures designed to respond to our assessment of the risks of material misstatement of the financial statements. The results of our audit procedures, including the procedures performed to address the matters below, provide the basis for our audit opinion on the accompanying financial statements.
Key audit matter How the matter was addressed in the audit
Valuation of deferred tax assets on assessed losses
The Group has recorded net deferred tax assets amounting to R141.8 million in the financial statements resulting from losses carried forward as disclosed in note 8 of the financial statements. The significant assumptions relating to the recoverability of these deferred tax assets are disclosed in note 1.4.2 of the financial statements.
The recognition of a deferred tax asset in respect of tax losses is permitted only to the extent that it is probable that future taxable profits will be available to utilise the tax losses carried forward.
The revenue growth, cost control and other assumptions in determining forecast profits for the future utilisation of deferred tax assets in separate legal entities where the losses reside is an area of significant management judgement. In addition, the utilisation of losses in the Burger King group is dependent on the allocation of profitable new stores to poorer performing statutory entities.
Our procedures included, among others:
• Assessing whether management has historically achieved budget by comparing previous year’s results to the budget for that period;
• Evaluating the assumptions used in preparing the budgets. This included assessing whether the information used was derived from the Group’s business plans, is consistent with performance to date, and whether these plans have been subject to internal reviews and approved by those charged with governance. It also included evaluating critical assumptions including forecast gross margin and planned store rollout;
• Testing the arithmetical accuracy of the calculations within the respective models;
• Determining the adequacy and accuracy of the related disclosures in the financial statements.

4 CONSOLIDATED ANNUAL FINANCIAL STATEMENTS
INDEPENDENT AUDITOR’S REPORT (continued)to the shareholders of Grand Parade Investments Limited
Key audit matter How the matter was addressed in the audit
Valuation of goodwill balances
The Group is required to assess the recoverable amount of its Goodwill on an annual basis in accordance with IAS 36: Impairment of Assets. The carrying value of Goodwill amounted to R92.5 million at 30 June 2017 as disclosed in note 17.
The valuation process is complex and involves judgment regarding certain assumptions when concluding on inputs to the calculation.
The inputs include: the determination of appropriate discount rates; the assessment of forecast average revenue growth rates and terminal growth rates.
These assumptions are disclosed in note 17.2.
Our procedures included, among others:
• Evaluating the forecasts and approved budgets provided by management against historical data and other relevant information;
• Assessment of the principles and method applied to the discounted cash flow valuations for appropriateness;
• Vouching the key inputs used in the calculation (e.g. discount rates, sales growth rates) with reference to actual experience to date and external data and our own expertise;
• Testing the arithmetical accuracy of the calculations within the respective models;
• Performing sensitivity analyses regarding key assumptions to determine the impact on potential impairment;
• We included a valuation specialist on our team to assist in the assessments of these forecasts applied by management;
• Assessing the competence and relevant experience of the valuations expert engaged by management; and
• Determining the adequacy and accuracy of the related disclosures in the financial statements.
OTHER INFORMATIONThe directors are responsible for the other information. The other information comprises the Company Information, Statement of Responsibility by the Directors and Company Secretary, Report of the Audit and Risk Committee, Report of the Directors and Shareholder Information, which we obtained prior to the date of this report, and the Integrated Annual Report and Corporate Governance Report, which is expected to be made available to us after that date. Other information does not include the consolidated and separate financial statements and our auditor’s report thereon.
Our opinion on the consolidated and separate financial statements does not cover the other information and we do not express an audit opinion or any form of assurance conclusion thereon.
In connection with our audit of the consolidated and separate financial statements, our responsibility is to read the other information and, in doing so, consider whether the other information is materially inconsistent with the consolidated and separate financial statements or our knowledge obtained in the audit, or otherwise appears to be materially misstated. If, based on the work we have performed on the other information obtained prior to the date of this auditor’s report, we conclude that there is a material misstatement of this other information, we are required to report that fact. We have nothing to report in this regard. When we read the Integrated Annual Report and the Corporate Governance Report, if we conclude that there is a material misstatement therein, we are required to communicate the matter to those charged with governance.
RESPONSIBILITIES OF THE DIRECTORS FOR THE CONSOLIDATED AND SEPARATE FINANCIAL STATEMENTSThe directors are responsible for the preparation and fair presentation of the consolidated and separate financial statements i n accordance with International Financial Reporting Standards and the requirements of the Companies Act of South Africa, and for such internal control as the directors determine is necessary to enable the preparation of consolidated and separate financial statements that are free from material misstatement, whether due to fraud or error.
In preparing the consolidated and separate financial statements, the directors are responsible for assessing the Grand Parade Investments Limited group’s and company’s ability to continue as a going concern, disclosing, as applicable, matters related to going concern and using the going concern basis of accounting unless the directors either intend to liquidate the Grand Parade Investments Limited group or company or to cease operations, or have no realistic alternative but to do so.
AUDITOR’S RESPONSIBILITIES FOR THE AUDIT OF THE CONSOLIDATED AND SEPARATE FINANCIAL STATEMENTSOur objectives are to obtain reasonable assurance about whether the consolidated and separate financial statements as a whole a re free from material misstatement, whether due to fraud or error, and to issue an auditor’s report that

GRAND PARADE INVESTMENTS LIMITED ANNUAL FINANCIAL STATEMENTS 2017
CONSOLIDATED ANNUAL FINANCIAL STATEMENTS 5
includes our opinion. Reasonable assurance is a high level of assurance, but is not a guarantee that an audit conducted in accordance with ISAs will always detect a material misstatement when it exists. Misstatements can arise from fraud or error and are considered material if, individually or in the aggregate, they could reasonably be expected to influence the economic decisions of users taken on the basis of these consolidated and separate financial statements.
As part of an audit in accordance with ISAs, we exercise professional judgement and maintain professional scepticism throughout the audit. We also:
• Identify and assess the risks of material misstatement of the consolidated and separate financial statements, whether due to fraud or error, design and perform audit procedures responsive to those risks, and obtain audit evidence that is sufficient and appropriate to provide a basis for our opinion. The risk of not detecting a material misstatement resulting from fraud is higher than for one resulting from error, as fraud may involve collusion, forgery, intentional omissions, misrepresentations, or the override of internal control.
• Obtain an understanding of internal control relevant to the audit in order to design audit procedures that are appropriate in the circumstances, but not for the purpose of expressing an opinion on the effectiveness of the group’s or company’s internal control.
• Evaluate the appropriateness of accounting policies used and the reasonableness of accounting estimates and related disclosures made by the directors.
• Conclude on the appropriateness of the directors’ use of the going concern basis of accounting and based on the audit evidence obtained, whether a material uncertainty exists related to events or conditions that may cast significant doubt on the group’s or company’s ability to continue as a going concern. If we conclude that a material uncertainty exists, we are required to draw attention in our auditor’s report to the related disclosures in the consolidated or separate financial statements or, if such disclosures are inadequate, to modify our opinion. Our conclusions are based on the audit evidence obtained up to the date of our auditor’s report. However, future events or conditions may cause the group or company to cease to continue as a going concern.
• Evaluate the overall presentation, structure and content of the consolidated and separate financial statements, including the disclosures, and whether the consolidated and separate financial statements represent the underlying transactions and events in a manner that achieves fair presentation.
• Obtain sufficient appropriate audit evidence regarding the financial information of the entities or business activities within the group to express an opinion on the consolidated and separate financial statements. We are responsible for the direction, supervision and performance of the group audit. We remain solely responsible for our audit opinion.
We communicate with the directors regarding, among other matters, the planned scope and timing of the audit and significant audit findings, including any significant deficiencies in internal control that we identify during our audit.
We also provide the directors with a statement that we have complied with relevant ethical requirements regarding independence, and to communicate with them all relationships and other matters that may reasonably be thought to bear on our independence, an d where applicable, related safeguards.
From the matters communicated with the directors, we determine those matters that were of most significance in the audit of the consolidated and separate financial statements of the current period and are therefore the key audit matters. We describe these matters in our auditor’s report unless law or regulation precludes public disclosure about the matter or when, in extremely rare circumstances, we determine that a matter should not be communicated in our report because the adverse consequences of doing so would reasonably be expected to outweigh the public interest benefits of such communication.
REPORT ON OTHER LEGAL AND REGULATORY REQUIREMENTSIn terms of the IRBA Rule published in Government Gazette Number 39475 dated 4 December 2015, we report that Ernst & Young Inc. has been the auditor of Grand Parade Investments Limited for 21 years.
ERNST & YOUNG INC.Director: Christopher Clyde Sickle Registered AuditorChartered Accountant (SA)
3rd Floor, Waterway House3 Dock Road, V&A Waterfront Cape Town8001
13 September 2017

6 CONSOLIDATED ANNUAL FINANCIAL STATEMENTS
REPORT OF THE AUDIT AND RISK COMMITTEEfor the year ended 30 June 2017
The Audit and Risk Committee is a formally constituted committee of the Board. It is appointed by the shareholders to assist the Board with its corporate governance oversight duties. The Committee operates independently of management and acts in accordance with its statutory duties and the delegated authority of the Board as documented in a formal Charter.
During the reporting period, the Committee attended to the following:
• considered the nomination of the independent external auditor, their terms of engagement, fees for audit services, the extent and scope of the audit as well as the timing thereof, and prior to commencement of the audit, considered and approved the audit fees payable;
• considered and pre-approved the scope of non-audit services performed by the external auditors and the fees relating to such services;
• evaluated the independence, effectiveness and performance of the internal audit function and approval and review of the internal audit annual work plan, as well as the quarterly internal audit report;
• reviewed and made recommendations to the Board in respect of the publicly disclosed financial information including the interim results for the six months ended 31 December 2016 and the audited annual results for the 2017 financial year;
• reviewed the Annual Financial Statements, including the valuation of unlisted investments and loans, prior to submission to the Board. In the course of the review the Audit and Risk Committee ensured that the AFS are prepared in accordance with IFRS and the Companies Act, and considered and made recommendations, where appropriate, on internal controls;
• reviewed the adequacy of the systems of internal control and any legal matters which could significantly impact on the Group’s financial statements;
• legislative and regulatory compliance within the scope of its mandate; and
• reviewed the risk management framework and made recommendations, where appropriate, to the Board.
COLIN PRIEMChairmanAudit and Risk Committee
13 September 2017

GRAND PARADE INVESTMENTS LIMITED ANNUAL FINANCIAL STATEMENTS 2017
CONSOLIDATED ANNUAL FINANCIAL STATEMENTS 7
REPORT OF THE DIRECTORSfor the year ended 30 June 2017
The Directors present their report on the activities of the Group and Company for the year ended 30 June 2017.
NATURE OF THE BUSINESSThe Company is an investment holding company and derives its income mainly from dividends and interest.
The consolidated annual financial statements of the Company and its subsidiaries also incorporate the equity accounted profit or loss of associated companies and joint ventures.
DIVIDENDSOn 25 November 2016 GPI declared a dividend of 25.0 cents per share in respect of the 2016 financial year, which amounted to R122.2 million of which R10.2 million related to GPI shares held in treasury. GPI is committed to remaining dividend-active. Any distribution relating to 2017 profits will be considered once future cash flows can be determined with more certainty.
GROUP EARNINGS
Year ended Note
30 June
201730 June
2016
Headline (loss)/earnings (R’000s) 9 (20 126) 9 385 – Headline (loss)/earnings per share (cents) 9 (4.59) 1.99 – Diluted headline (loss)/earnings per share (cents) 9 (4.59) 1.98
Basic earnings– net profit for the year (R’000s) 9 19 281 202 809 – Basic earnings per share (cents) 9 4.39 43.01 – Diluted earnings per share (cents) 9 4.39 42.80
Dividends net of treasury shares (R’000s) 113 070 71 455 – ordinary dividend per share (cents) 25.00 15.00
INVESTMENT ACTIVITIESDuring the past financial year, the Group continued to restructure its investment portfolio in line with its strategy of increasing its investments in food, moving towards strategic investments in gaming and leisure and completely divesting from its non-core investments. Details of these transactions are set out below.
FoodThe recently acquired brands, namely Dunkin’ Donuts and Baskin-Robbins, were successfully launched in the Western Cape and were received exceptionally well by the local consumer.
Gaming and Leisure“The Group’s exit from its gaming assets is indicative of the Group’s intention to remain a strategic investment player with significant minority stakes in its Assets. The final disposal of Sun Slots during the year, reduced the Group’s holding down to 30% with Sun International holding 70%.
The transaction to dispose of a 10.0% holding in both SunWest and Worcester Casino to Tsogo Sun Gaming (Pty) Ltd (Tsogo), concluded in the prior year was concluded in the current year through an acceleration of the deferred payment arrangement as contained in the terms of the sale. The details of these transactions are as follows:
Sun Slots DisposalOn 16 November 2016, GPI concluded the disposal of a 19.9% equity interest in Sun Slots, being the third and final tranche of the staged deal to dispose of a 70% equity investment in Sun Slots to Sun. GPI received proceeds of R262.5 million and recognised a profit on disposal of R32.4 million, net of Capital Gains Tax, in profit or loss for the period.
Payment of deferred proceeds from disposal of casino assetsIn terms of the disposal of 10.0% of SunWest and Worcester, Tsogo had agreed to pay a total of R675.0 million for the investments by way of an upfront payment of R112.5 million and the balance by way of 15 equal monthly instalments of R37.5 million ending September 2017. GPI received the R112.5 million upfront payment during the prior financial period and R187.5 million in instalments up to 30 November 2016. On 30 November 2016, GPI concluded an agreement with Tsogo to accelerate the payment of the remaining R375.0 million in deferred proceeds. A total payment of R360.0 million was made by Tsogo, which represented a R15 million discount on the outstanding balance of R375.0 million.
Non-core investmentsDuring the year the Group entered into an agreement to dispose of the Mac Brothers properties located in Epping and Sebenza. Both properties were sold for a total consideration of R59.5 million. This resulted in a profit on sale of R4.5 million before tax, net of attorneys fees of R1.5 million and other costs to sell of R1.6 million.
The Group also disposed of its property situated in Atlantis for a total consideration of R35 million, resulting in a profit before tax, after selling costs, of R12.9 million.

8 CONSOLIDATED ANNUAL FINANCIAL STATEMENTS
REPORT OF THE DIRECTORS (continued)for the year ended 30 June 2017
GPI exited two non-core investments during the period by concluding sale agreements in respect of Grand Linkstate (Pty) Ltd and Grand Sport (Pty) Ltd. Subsequent to year end GPI also concluded an agreement to sell its 51% share in Grand Tellumat Manufacturing (Pty) Ltd. Furthermore the Group also entered into a agreement to swap its stake in Atlas Gaming Australia for a 26% stake in a local company called Infinity Gaming Africa (Pty) Ltd (IGA). The sale of these non-core investments will enable GPI to dedicate resources efficiently to its core investments.
GROUP FINANCIAL REVIEWThe Group uses headline earnings to assess the underlying investment contributions to the Group’s earnings. The reason for using headline earnings is that it eliminates the once-off effects of the Group’s investment activities and therefore provides a comparable view of the Group’s continuing earnings.
The Group’s headline earnings have continued to come under pressure since its initial investment into food during the 2013 financial year with the total headline earnings per share declining from 17.10 cents per share for the year ended 30 June 2013 to a headline loss of 4.59 cents per share in the current year. The decline in headline earnings is largely due to the commencement of trading in respect of Dunkin’ Donuts and Baskin-Robbins which collectively contributed a R35.7 million headline loss for the period but was offset by an improvement in Burger King for the period which reduced its loss by R11.0 million. The decreased holding in SunWest of 15.1% (2016: 25.1%) also contributed to the decline in earnings, with SunWest contributions decreasing by R40.3 million to R70.3 million.
GPI showed an overall decrease in its headline earnings from core investments for the year, which declined by R60.0 million from a profit of R96.3 million last year to R36 million this year. The core investment headline earnings decrease is attributed to the sale of the 10% stake in SunWest.
During the current year, Grand Sport and Grand Linkstate was sold which is in line with the Group’s strategy to divest of non-core investments and subsequent to year end GPI signed a sale agreement in respect of Grand Tellumat subject to certain conditions. These non-core investments collectively contributed R12.4 million losses to the headline loss in the financial year.
The table below shows the contribution each investment made to the Group headline earnings:
30 June 2017
R’000s
30 June 2016Restated
R’000sMovement
R’000s %
Food (67 657) (33 895) (33 762) (100)Burger King(1) (10 953) (29 938) 18 985 63Dunkin’ Donuts (22 254) (3 713) (18 541) (499)Baskin-Robbins (13 481) (1 856) (11 625) (626)Mac Brothers (8 051) 7 493 (15 544) 207Spur (4 939) (5 816) 877 15Grand Foods Meat Plant (7 979) (65) (7 914) (12 175)
Gaming 103 755 130 209 (26 454) (20)SunWest 70 354 110 665 (40 311) (36)Sun Slots 30 102 27 734 2 368 9Worcester Casino 3 299 (8 190) 11 489 140
Central costs (43 816) (73 508) 29 692 40GPI Properties 2 158 (6 241) 8 399 135Central costs (45 974) (67 267) 21 293 32
Non-core Investments (12 408) (13 421) 1 013 8GTM (9 350) (5 118) (4 232) (83)Grand Sport (3 058) (7 455) 4 397 59Grand Linkstate – (848) 848 100
Headline (loss)/earnings (20 126) 9 385 (29 511) (314)
(1) The headline contribution from Burger King includes Grand Foods Meat Plant’s contribution. This has been restated in the prior year for comparability.

GRAND PARADE INVESTMENTS LIMITED ANNUAL FINANCIAL STATEMENTS 2017
CONSOLIDATED ANNUAL FINANCIAL STATEMENTS 9
INTRINSIC NET ASSET VALUE (INAV) AT 30 JUNE 2017As at 30 June 2017, GPI’s management has valued the GPI Group on a sum of the parts (SOTP) basis at 698 cents per share (excluding head office costs and CGT impact). This represents a 2.5% increase in the intrinsic net asset value in the year since 30 June 2016, where management’s valuation of the Group was 681 cents per share (excluding head office costs and CGT impact).
The GPI closing share price at 30 June 2017 was 291 cents per share, which when compared against the year-end iNAV implies it is trading at a 58% share price discount.
The values of most of the investments held by GPI are not regarded as complex valuations. The Group attributes the discount to its share mainly to the early stage food investment which is still at the bottom of the J-curve, save for Burger King, which recently has started to move into the early growth phase of its life cycle. The GPI management team are confident that the forecasts used in determining the discounted cash flows for Food Assets are both conservative and achievable.
The table below provides a detailed breakdown of the 30 June 2017 iNAV by investment:
Company
Valuation
methodo-
logy
100%
Equity
value
R’000s
GPI
Holding
%
GPI
Equity
value
R’000s
Related
Holding Co
borrowings
R’000s
Intrinsic NAV
R’000s
% of
portfolio
Food 1 514 212 (240 742) 1 273 470 42Burger King DCF 854 236 91.1 778 209 – 778 209 26Dunkin’ Donuts NAV 35 681 100.0 35 681 – 35 681 1Baskin-Robbins NAV 16 371 100.0 16 371 – 16 371 1Spur Traded price 3 048 314 17.5 514 650 (240 742) 273 908 9Mac Brothers DCF 120 429 100.0 120 429 – 120 429 4Grand Foods Meat Plant DCF 50 435 96.9 48 872 – 48 872 2
Gaming 1 539 142 – 1 539 142 51SunWest EV/EBITDA 5 737 496 15.1 866 362 – 866 362 29Worcester Casino EV/EBITDA 180 571 15.1 27 266 – 27 266 1Sun Slots EV/EBITDA 2 151 715 30.0 645 514 – 645 514 22
Other investments 235 800 (74 903) 160 897 5GPI Properties Various 235 800 100.0 235 800 (74 903) 160 897 5
Other Group Companies’ cash and cash equivalents 22 020 Other Group Companies’ net assets 5 946 iNAV: Ordinary shareholders (pre-head office cost) 3 001 475 Number of issued ordinary shares (’000s) excluding treasury shares 429 989 iNAV per share (cents) 698
CAPITAL STRUCTUREThe Group has recognised that while its food investments are in its early or start-up phase and currently not contributing significantly to the Group’s earnings, the Group will continue to adopt a conservative approach on its gearing for existing operations. Over the past 36 months the Group decreased its gearing levels from 35.5% to 16.8% as a result of part disposals in its gaming and leisure investments. The proceeds received from its part disposal of SunWest were utilised to repay the full Standard Bank revolving credit facility of R225.0 million. The Group’s targeted debt equity range is set between 20.0% and 35.0%. At 30 June 2017, the debt equity ratio decrease by 10.3% from 27.1% last year to 16.8%, which is below the targeted range and will potentially allow the Group to raise funding at more preferential rates.
The continued local political and economic environment has resulted in uncertainty in the local credit markets and the Group’s exposure to the South African consumer has created further uncertainty which has resulted in a significant increase over the past year in the cost of debt available. Therefore as part of the debt reduction process, the Group has identified the facilities which are relatively cheap in comparison to the prevailing market rates and will look to retain those facilities, such as the Spur preference share facilities. The facilities which are being reduced are the Group’s most expensive facilities and are costly in comparison to the prevailing market rates.

10 CONSOLIDATED ANNUAL FINANCIAL STATEMENTS
30 June 2017
R’000s
30 June 2016
R’000s
Movement
R’000s %
Holding company facilities 240 401 459 671 (219 270) (48)SunWest Credit facilities – 225 000 (225 000) (100)Spur Preference shares 240 401 234 671 5 730 2Subsidiary facilities 113 973 183 191 (69 218) (38)GPI Properties Term loans (Mortgage) 74 641 131 999 (57 358) (43)Mac Brothers Finance leases 12 880 16 486 (3 606) (22)GF Meat Plant Finance leases 24 246 32 235 (7 989) (25)Burger King Finance leases 1 594 1 898 (304) (16)Baskin-Robbins Finance leases 146 – 146 100Dunkin’ Donuts Finance leases 357 434 (77) (18)GPIMS Finance leases 109 139 (30) (22)Total debt 354 374 642 862 (288 488) (45)Debt/equity 16.8 27.1 10.3 38
REVIEW OF INVESTMENT OPERATIONSFOODBurger KingStand-alone results for the yearThe total number of Burger King restaurants at 30 June 2017 closed at 61. The net restaurant movement included the opening of four new restaurants and closure of five unprofitable restaurants, located in the Johannesburg CBD and KwaZulu-Natal. The average monthly restaurant revenues (ARS) increased by 9.26% from R0.785 million last year to R0.865 million this year, largely as a result of positive restaurant comparative sales of 1.82% (2016:– 27.23%) and a proportional increase in revenue from Drive Thru sites opened towards the end of the 2016 financial year. Despite a reduction in the net restaurant count, Burger King’s total revenue for the year increased by 22.19% from R485.2 million in the prior year to R623.5 million in the current year.
Burger King continued to improve the restaurant operating model during the financial year with active food cost management and labour cost control. This resulted in an increase in the restaurant EBITDA margin from 3% in the prior year to 9% in the current year.
Of significant importance is the improvement of Company EBITDA from a loss of R37.5 million to a profit of R11.1 million in the current financial period. Included in the Company EBITDA are charges that relate to once off lease settlement and de-commission costs of R3.7 million in respect of stores closed during the year.
The depreciation and amortisation costs for the year of R60.9 million was R15.2 million higher than the R45.4 million cost incurred in the prior year. This includes impairment costs of R11.8 million, before taxation, in respect of the stores closed. The interest expense increased significantly during the year from R20.8 million last year to R49.3 million this year as a result of interest being charged on the shareholder loan from GPI with effect from 1 January 2016. After the tax charge for the year this resulted in an increase in the net loss for the year from R76.6 million to R80.9 million.
Investment’s contribution to Group headline earnings for the yearBurger King’s contribution to the Group headline earnings for the year amounts to a loss of R11.0 million (2016: R29.9 million loss), which is after the elimination of depreciation and equity accounted earnings of R8.0 million (2016: R12.5 million) and inter-group interest of R45.6 million (2016: R20.4 million); adding back non-controlling interests of R7.9 million (2016: R12.4 million), losses on property, plant and equipment of R0.3 million (2016: R0.7 million) and impairment of property, plant and equipment of R8.5 million.
Dunkin’ DonutsDunkin’ Donuts opened its first outlet on 13 October 2016 and the response from the local consumer was overwhelming with over 330 000 doughnuts sold in the outlet’s first month of trade. A further five outlets were opened subsequently; bringing the total outlets to six at 30 June 2017. All the outlets are corporate-owned.
The outlets reported sales of R24 million and a gross profit of R6.2 million for the period. The gross margin achieved for the period of 25.7% is well below the target as a result of doughnuts being imported via airfreight due to higher than anticipated demand. Dunkin’ Donuts achieved an EBITDA loss of R24.5 million for the period which was due to the initial marketing and launch costs to build brand awareness and the importation of the majority of the product offerings. Dunkin’ Donuts has subsequently embarked on a programme of localisation to reduce the reliance on foreign suppliers and has commenced the construction of a local bakery to lower the overall doughnut unit cost.
Baskin-RobbinsFollowing on the success of the Dunkin’ Donuts launch, Baskin-Robbins opened its first store on 9 December 2016. Two additional stores were subsequently opened taking the total number of stores to three at 30 June 2017.
REPORT OF THE DIRECTORS (continued)for the year ended 30 June 2017

GRAND PARADE INVESTMENTS LIMITED ANNUAL FINANCIAL STATEMENTS 2017
CONSOLIDATED ANNUAL FINANCIAL STATEMENTS 11
The three stores reported revenue of R5.5 million and collectively contributed to a Company EBITDA loss for the period of R14.4 million. Similar to Dunkin’ Donuts the majority of the costs incurred in the current year was in relation to marketing and launch cost to build brand awareness.
Spur GPI increased its shareholding in Spur by 7.48% to 17.48% by year end. A total dividend of R16.9 million was received during the period with a related finance charge of R21.7 million resulting in a R4.9 million reported net loss for the period.
Grand Foods Meat Plant Stand-alone results for the yearGrand Foods Meat Plant is exposed to Burger King indirectly through their agreement with Burger King’s main supplier, Vector. As a result of Burger Kings’ 30% increase in revenue, Grand Foods Meat Plant’s revenue increased by 33% from R69.1 million last year to R92 million this year. Cost of sales in the current year increased by 55.6% from R53.9 million to R83.9 million. This is a direct result of higher input costs due to increased food inflation. Grand Foods Meat Plant’s earnings for the year resulted in a R9.3 million loss after tax, which was 107% higher than the R1.5 million net loss after tax incurred last year.
Investment’s contribution to Group headline earnings for the yearGrand Foods Meat Plant’s net loss after tax for the year of R9.3 million (2016: R1.5 million loss) was increased by R1.3 million after eliminating the inter-group interest expense. As a result of this adjustment, Grand Foods Meat Plant contributed a loss of R8.0 million (2016: R0.1 million loss) to the Group headline earnings for the year.
Mac Brothers Catering EquipmentStand-alone results for the yearAmid tough trading conditions experienced in the manufacturing sector, Mac Brothers revenue decreased by 21.8% to R209.4 million (2016: R267.7 million). Mainly as a result of a 2% decrease in local catering equipment sales (excluding Grand Foods) which decreased from R71.1 million last year to R27.9 million this year, and a 51.1% decrease in cold room & extraction sales which decreased from R25.3 million last year to R12.4 million this year. The operating costs for the year amounted to R59.6 million which is 10.0% lower than the operating costs of R66.2 million incurred last year. The decrease in costs is mainly attributable to decreases in head count.
The EBITDA for the year of R1.4 million is 92.5% lower than the R18.2 million EBITDA from last year. Depreciation for the year of R4.2 million increased slightly by R95k and the interest costs of R4.7 million increased by R1.0 million when compared to last year.
Mac Brothers recorded a loss after tax for the year of R5.3 million, representing a 173% decrease from the net profit after tax of R7.3 million in the prior year.
Investment’s contribution to Group headline earnings for the yearMac Brothers net loss after tax for the year of R5.3 million was increased by R5.2 million to eliminate inter-group profits for the year and decreased by R2.4 million to eliminate the inter-group interest expense. After these adjustments, Mac Brothers contributed a loss of R8.1 million to the Group headline earnings.
GAMINGSunWestStand-alone results for the yearSunWest’s revenue for the year decreased by 0.4% from R2 488.0 million last year to R2 478.0 million this year. Its EBITDA decreased by 3.1% to R912.2 million for the year (2016: R941.8 million) and its net profit after tax decreased by 6.4% to R465.9 million for the year (2016: R497.9 million).
Investment’s contribution to Group headline earnings for the yearGPI’s remaining 15.1% share of SunWest’s earnings for the year amounts to R70.3 million compared to R110.7 million in the prior year. The decrease is due to the sale of 10% in SunWest in the prior year.
Sun Slots Stand-alone results for the yearSun Slots increased their revenue by 9% from R934.7 million last year to R1 019.5 million this year. This was as a result of an addition of 153 Limited Pay-out Machines (LPMs) being added to the national network during the year and a 4.7% increase in the average Gross Gaming Revenue (GGR) per machine per day from R721.52 last year to R755.40 this year. Sun Slots EBITDA increased by 10% from R217.2 million in the prior year to R239.6 million in the current year. This resulted in a marginal increase in their EBITDA percentage increasing from 23.4% last year to 23.5% this year. Their depreciation for the year of R89 million was 19% higher than last year due to the increase in the number of active LPMs. Their finance costs for the year of R20.1 million decreased by 22.4% when compared to last years’ costs of R25.9 million, which is due to a decrease in the shareholder loans of R120 million in respect of repayments during the year. Sun Slots Net Profit After Tax decreased by 14% from R108 million in the prior year to R92.8 million in the current year.
Investment’s contribution to Group headline earnings for the yearGPI’s 30.0% share of Sun Slot’s earnings for the year amounted to R30.1 million, which increased by R2.9 million from the prior year of R27.7 million. The current year earnings includes an impairment recognised for Grand Sport of R2.3 million which was added back in respect of headline earnings.

12 CONSOLIDATED ANNUAL FINANCIAL STATEMENTS
REPORT OF THE DIRECTORS (continued)for the year ended 30 June 2017
OTHERCentral costs The Group’s net central costs for the year amounted to R46.0 million, which is 31% lower than the central costs of R67.3 million last year as a result of the continued optimisation of the Group’s head office costs and lowered interest expense from reduced gearing for the financial year.
Share capitalThe Company bought back 15.0 million shares during the year at a average price of R3.52. These shares were subsequently cancelled. No new shares were issued during the year. Details of the share and the share capital of the Company both authorised and issued have been disclosed in Note 23.1 of the Consolidated Annual Financial Statements.
Treasury shares At 30 June 2017 a total of 43.8 million GPI shares were held as treasury shares by the Grand Parade Share Incentive Trust, GPI Management Services and the GPI Women’s BBBEE Empowerment Trust. These entities are controlled by the Group, with the Grand Parade Share Incentive Trust holding 4.98 million treasury shares, GPI Management Services holding 24 million shares and the GPI Women’s BBBEE Empowerment Trust holding 14.82 million treasury shares. Details of the Group’s treasury shares have been disclosed in Note 23.2 of the Consolidated Annual Financial Statements.
Preference sharesNo preference shares were issued by the Group during the year and the Group voluntarily redeemed 8 000 ‘A’ preference shares owing to Standard Bank on 30 April 2017. As a result, at 30 June 2017, the Group had 79 000 ‘A’ preference shares and 60 000 ‘B’ preference shares issued to Standard Bank and 72 328 ‘C’ preference shares issued to Spur Corporation Limited. The terms of the respective preference shares have been disclosed in Note 25.2 and Note 25.3 of the Consolidated Annual Financial Statements.
Borrowings The terms of Group’s borrowings are fully disclosed in Note 26 of the Consolidated Annual Financial Statements. In terms of the Memorandum of Incorporation of the Company and its subsidiaries, the borrowing powers of the Directors of these companies are unlimited.
Capital commitments and contingent liabilities Details of the Group’s capital commitments are disclosed in Note 37 of the Consolidated Annual Financial Statements.
Subsidiary companies and investments Particulars of subsidiary companies, equity accounted investments and other investments are disclosed in Appendix 1 and Appendix 2 of the Consolidated Annual Financial Statements.
Directors and Company SecretaryTasneem Karriem was previously appointed to the GPI board on 9 September 2016 and on 1 July 2017 has been appointed as Chief Executive Officer of the Group. Alan Keet resigned as Chief Executive Officer and Director of the Group on 3 April 2017. Dylan Pienaar, who stepped down from Financial Director was appointed as the Chief Executive Officer of the Food Group while still remaining on the GPI Board of Directors as an Executive Director effective 1 July 2017. On 1 July 2017, Shaun Barends was appointed as Financial Director of the Group.
Particulars of the present Directors and Company Secretary are given on page 1.
Directors’ interest in contractsDetails of the directors’ interests in contracts and transactions with the Group are disclosed in Note 36 of the Consolidated Annual Financial Statements.
Directors’ shareholdingDetails of the directors’ interests in the shares of the Company are disclosed in Appendix 3 of the Consolidated Annual Financial Statements.
Going concern These Annual Financial Statements have been prepared on the going concern basis.
Subsequent eventsThe details of events occurring subsequent to the reporting date but prior to the date of issue of this report are detailed in Note 38 of the Consolidated Annual Financial Statements.
Related partiesThe Group, in the ordinary course of business, entered into various transactions with related parties consistent with those as reported at 30 June 2017. Details of related parties and transactions are disclosed in note 36 of the Consolidated Annual Financial Statements.

GRAND PARADE INVESTMENTS LIMITED ANNUAL FINANCIAL STATEMENTS 2017
CONSOLIDATED ANNUAL FINANCIAL STATEMENTS 13
Note
2017
R’000s2016
R’000s
Revenue 5 962 998 772 344 Cost of sales (508 724) (385 229)Gross profit 454 274 387 115 Operating costs (515 342) (462 788)Loss from operations (61 068) (75 673)Profit from equity-accounted investments 10, 11 96 094 144 168 Profit on disposal of investments 4.3 91 929 270 565 Reversal of impairment of investment 10 – 21 362 Impairment of property, plant, equipment and intangible assets 15, 16. 6 (18 549) – Impairment of investment 10.1 (8 271) (3 468)Impairment of loans (4 701) – Remeasurement of investments 4 – 18 687 Depreciation 15 (66 083) (45 876)
Amortisation 16 (4 906) (2 975)Profit before finance costs and taxation 6 24 445 326 790 Finance income 5 31 583 23 660 Finance costs 7 (50 093) (72 537)Profit before taxation 5 935 277 913 Taxation 8 5 018 (85 394)Profit for the year 10 953 192 519
Other comprehensive (loss)/incomeItems that will be reclassified subsequently to profit or lossUnrealised fair value adjustments on available-for-sale investments, net of tax 24.1 (51 099) (37 009)Total comprehensive (loss)/income for the year (40 146) 155 510
Profit/(loss) for the year attributable to:– Ordinary shareholders 19 281 202 809 – Non-controlling interest 13 (8 328) (10 290)
10 953 192 519
Total comprehensive (loss)/income attributable to:– Ordinary shareholders (31 818) 165 800 – Non-controlling interest 13 (8 328) (10 290)
(40 146) 155 510
Cents Cents
Basic earnings per share 9 4.39 43.01 Diluted basic earnings per share 9 4.39 42.80 Headline (loss)/earnings per share 9 (4.59) 1.99 Diluted headline (loss)/earnings per share 9 (4.59) 1.98 Ordinary dividend per share 25.00 15.00
CONSOLIDATED STATEMENT OF COMPREHENSIVE INCOMEfor the year ended 30 June 2017

14 CONSOLIDATED ANNUAL FINANCIAL STATEMENTS
CONSOLIDATED STATEMENT OF FINANCIAL POSITIONas at 30 June 2017
Note
2017
R’000s
2016
R’000s
ASSETSNon-current assets 2 361 016 2 189 326 Investments in jointly controlled entities 10 616 099 629 635 Investments in associates 11 358 157 327 768 Available-for-sale investment 12 520 435 307 355 Investment properties 14 6 821 69 798 Property, plant and equipment 15 575 789 626 045 Intangible assets 16 44 079 40 599 Goodwill 17 92 508 92 885 Deferred tax assets 8 147 128 95 241 Assets classified as held-for-sale 3 40 175 192 479 Current assets 230 023 842 970 Inventory 18 88 763 91 231 Deferred proceeds 19 – 528 445 Trade and other receivables 20.1 64 135 106 794 Related-party loans 21.1 44 774 36 452 Cash and cash equivalents 22.1 22 911 65 594 Income tax receivable 34.2 9 440 14 454
Total assets 2 631 214 3 224 775
EQUITY AND LIABILITIESCapital and reservesTotal equity 2 141 147 2 397 492 Ordinary share capital 23.1 806 707 859 517 Treasury shares 23.2 (166 286) (105 971)Accumulated profit 1 532 361 1 626 255 Available-for-sale reserve at fair value 24.1 (43 044) 8 055 Share-based payment reserve 11 409 9 636 Non-controlling interest 13 (29 754) (28 038)Total shareholder’s equity 2 111 393 2 369 454 Non-current liabilities 337 912 381 448 Preference shares 25 238 390 232 560 Interest-bearing borrowings 26 67 238 102 096 Finance lease liabilities 27 25 023 38 103 Deferred tax liabilities 8 4 469 6 245 Provisions 28 2 792 2 444 Liabilities associated with assets held-for-sale 3 – 16 690 Current liabilities 181 909 457 183 Trade and other payables 29 103 877 149 955 Provisions 28 17 833 16 636 Bank overdraft 22.2 25 474 7 919 Preference shares 25 2 011 2 111 Interest-bearing borrowings 26 7 403 254 903 Finance lease liabilities 27 14 309 13 089 Dividends payable 34.3 9 744 8 826 Income tax payable 34.2 1 258 3 744
Total equity and liabilities 2 631 214 3 224 775

GRAND PARADE INVESTMENTS LIMITED ANNUAL FINANCIAL STATEMENTS 2017
CONSOLIDATED ANNUAL FINANCIAL STATEMENTS 15
CONSOLIDATED STATEMENT OF CHANGES IN EQUITYfor the year ended 30 June 2017
Ordinary
share
capital
(Note 23.1)
R’000s
Treasury
shares
(Note 23.2)
R’000s
Accumu-
lated
profits
R’000s
Available-
for-sale
reserve
at fair
value
(Note 24.1)
R’000s
Share-
based
payment
reserve
R’000s
Capital
redemp-
tion
reserve
fund
(Note 24.3)
R’000s
Non-
controlling
interest
(Note 13)
R’000s
Total
equity
R’000s
Balance at 30 June 2015 859 517 (76 222) 1 494 635 45 064 10 289 301 (17 575) 2 316 009 Total comprehensive income/(loss) for the year – – 202 809 (37 009) – – (10 290) 155 510 – Profit/(loss) for the year
from continuing operations – – 202 809 – – – (10 290) 192 519
– Other comprehensive loss – – – (37 009) – – – (37 009)Dividends declared – – (71 455) – – – – (71 455)Treasury shares acquired – (40 330) – – – – – (40 330)Share-based payment reserve expense – – – – 1 915 – – 1 915 IFRS 2 charge relating to equity accounted investments – – – – 329 – – 329 Acquisition of non-controlling interest – – (6 700) – – – 4 700 (2 000)Decrease of interest in subsidiary – – 4 873 – – – (4 873) – Treasury shares allocated to employees – 10 581 1 792 – (2 897) – – 9 476 Release of capital redempton reserve – – 301 – – (301) – – Balance at 30 June 2016 859 517 (105 971) 1 626 255 8 055 9 636 – (28 038) 2 369 454 Total comprehensive income/(loss) for the year – – 19 281 (51 099) – – (8 328) (40 146)– Profit/(loss) for the year
from continuing operations – – 19 281 – – – (8 328) 10 953
– Other comprehensive loss – – – (51 099) – – – (51 099)Dividends declared – – (113 070) – – – – (113 070)Shares cancelled* (52 810) – – – – – – (52 810)Treasury shares acquired – (69 317) – – – – – (69 317)Share-based payment reserve expense – – – – 3 453 – – 3 453 Sale of subsidiary – – – – – – 6 612 6 612 Treasury shares allocated to employees – 9 002 (105) – (1 680) – – 7 217 Balance at 30 June 2017 806 707 (166 286) 1 532 361 (43 044) 11 409 – (29 754) 2 111 393
* Shares bought back are deducted from share capital at cost.

16 CONSOLIDATED ANNUAL FINANCIAL STATEMENTS
CONSOLIDATED STATEMENT OF CASH FLOWSfor the year ended 30 June 2017
Note
2017
R’000s
2016
R’000s
Cash flows from operating activitiesNet cash utilised from operations 34.1 (95 787) (86 697)Income tax paid 34.2 (60 501) (145 145)Finance income 5 31 583 23 660 Net cash outflow from operating activities (124 705) (208 182)
Cash flows from investing activitiesAcquisition of plant and equipment (80 941) (179 926)Acquisition of land and buildings 15 (7 799) (23 027)Acquisition of investment properties 14 (15) (7 127)Acquisition of intangibles 16 (8 694) (30 269)Proceeds from disposal of property, plant and equipment 61 862 1 724 Proceeds from disposal of investment property 56 000 – Loans advanced 34.6 (6 849) (4 842)Loan repayment received 34.7 1 128 192 367 Cash paid through business combinations 34.8 – (39 259)Investments made 34.9 (266 555) (35 906)Consideration received from the disposal of subsidiaries 34.10 10 215 – Consideration received from the disposal of equity accounted investment 34.11 790 937 382 760 Dividends received 34.12 87 829 170 855 Net cash inflow from investing activities 637 118 427 350
Cash flows from financing activitiesDividends paid 34.3 (112 152) (70 905)Consideration on exercise of employee options – 1 658 Treasury shares acquired 23 (69 317) (40 330)Shares bought back for cancellation 23 (52 810) – Acquisition of minority interest – (2 000)Loans received 34.4 – 400 000 Repayment of loans 34.5 (301 754) (631 439)Finance costs (36 618) (60 786)Net cash outflow from financing activities (572 651) (403 802)
Net decrease in cash and cash equivalents (60 238) (184 634)Cash and cash equivalents at the beginning of the year 57 675 242 309 Total cash and cash equivalents at the end of the year (2 563) 57 675
Total cash and cash equivalents at year end comprises: (2 563) 57 675 Cash and cash equivalents 22.1 22 911 65 594 Overdraft 22.2 (25 474) (7 919)

GRAND PARADE INVESTMENTS LIMITED ANNUAL FINANCIAL STATEMENTS 2017
CONSOLIDATED ANNUAL FINANCIAL STATEMENTS 17
NOTES TO THE CONSOLIDATED ANNUAL FINANCIAL STATEMENTSfor the year ended 30 June 2017
1. ACCOUNTING POLICIES1.1 Basis of preparation of financial results
The consolidated and separate financial statements have been prepared on the historical cost basis, except where otherwise stated or disclosed, and as a going concern. The consolidated financial statements are presented in South African Rand, which is also the functional currency of the entity, and all values are rounded to the nearest thousand (R’000s), except where otherwise indicated.
The accounting policies applied are consistent with those applied in the prior year.
Company financial statementsInvestments in subsidiaries, associates and joint ventures in the separate financial statements presented by the Company are recognised at cost less accumulated impairment loss.
1.2 Statement of complianceThese Group Annual Financial Statements have been prepared in accordance with the framework concepts and the measurement and recognition requirements of International Financial Reporting Standards (IFRS), Interpretations issued by the International Accounting Standards Board, the SAICA Financial Reporting Guides as issued by the Accounting Practices Committee, the Financial Reporting Pronouncements as issued by the Financial Reporting Standards Council, the JSE Listing Requirements and the requirements of the Companies Act, 71 of 2008 of South Africa.
1.3 Basis of consolidationThe consolidated financial statements comprise the financial statements of the Group and its subsidiaries as at 30 June 2017 and the year then ended.
Subsidiaries are fully consolidated from the date of acquisition, being the date on which the Group obtains control, and continue to be consolidated until the date when such control ceases. The financial statements of the subsidiaries are prepared for the same reporting period as the parent Company, using consistent accounting policies. All intra-group balances, transactions, income, expenses and unrealised profits and losses resulting from intra-group transactions and dividends are eliminated in full on consolidation.
A change in the ownership interest of an existing subsidiary, without a loss of control, is accounted for as an equity transaction. If the Group relinquishes control over a subsidiary, it:
• de-recognises the assets (including goodwill) and liabilities of the subsidiary;
• de-recognises the carrying amount of any non-controlling interest;
• recognises the fair value of the consideration received;
• recognises the fair value of the investment retained;
• recognises any surplus or deficit in profit or loss; and
• reclassifies the parent’s share of components previously recognised in other comprehensive income to profit or loss or retained income as appropriate.
a) Business combinations and goodwillBusiness combinations are accounted for by using the acquisition method. The cost of the acquisition is measured as the aggregate of the consideration transferred measured at acquisition date fair value and the amount of any non-controlling interest in the acquiree. For each business combination, the Group elects whether to measure the non-controlling interest in the acquiree either at fair value or at the proportionate share of the acquirer’s identifiable net assets. Acquisition costs incurred are expensed and included in profit or loss.
When the Group acquires a business, it assesses the financial assets and liabilities assumed for appropriate classification and designation in accordance with the contractual terms, economic circumstances and pertinent conditions as at the acquisition date.
If a business combination is achieved in stages, the previously held equity interest is re-measured at its acquisition date fair value and any resulting gain or loss is recognised in profit or loss. It is then considered in the determination of goodwill.
A contingent consideration to be transferred by the acquirer will be recognised at fair value at the acquisition date. Subsequent changes to the fair value of the contingent consideration which is deemed to be an asset or liability, that is a financial instrument, is measured at fair value with changes in fair value being recognised in profit or loss. If the contingent consideration is classified as equity, it is not re-measured until it is finally settled in equity.

18 CONSOLIDATED ANNUAL FINANCIAL STATEMENTS
1. ACCOUNTING POLICIES CONTINUED
1.3 Basis of consolidation (continued)a) Business combinations and goodwill (continued)
Goodwill is initially measured at cost, being the excess of the aggregate of the consideration transferred, the amount recognised for non-controlling interest and the fair value of the existing interest prior to obtaining control over the net identifiable assets and liabilities assumed. If the consideration is lower than the fair value of the net assets of the subsidiary acquired, the difference is recognised in profit or loss as a bargain purchase.
After initial recognition, goodwill is measured at cost less any impairment losses. For the purpose of impairment testing, goodwill acquired in a business combination from the acquisition date is allocated to each of the Group’s cash-generating units that are expected to benefit from the combination, irrespective of whether other assets or liabilities of the acquiree are assigned to those units.
Where goodwill forms part of a cash-generating unit and part of the operation within that unit is disposed of, the goodwill associated with the operation disposed of is included in the carrying amount of the operation when determining the gain or loss on disposal of the operation. Goodwill disposed of in this circumstance is measured based on the relative values of the operation disposed of and the portion of the cash-generating unit retained.
b) Interest in joint ventures and associates The Group has interests in joint ventures, whereby the joint ventures have a contractual arrangement that establishes control over the economic activities of the entity. The contractual arrangement implies unanimous agreement for financial and operating decisions amongst the joint ventures.
The Group also has investments in associates. An associate is an entity over which the Group has significant influence.
The Group recognises its interests in joint ventures and associates using the equity method. The financial statements of the joint ventures and associates are prepared for the same reporting period as the parent company.
Under the equity method, the investments in joint ventures and associates are carried in the statement of financial position at cost plus post acquisition changes in the Group’s share of net assets of the joint ventures or associates. Goodwill relating to joint ventures and associates is included in the carrying amount of the investment and is neither amortised nor individually tested for impairment.
Losses of a joint venture or associates in excess of the Group’s interest therein (which includes any long-term interest that, in substance, forms part of the Group’s net investment in the joint venture and associate) are not recognised unless the Group has a legal or constructive obligation in respect of those joint ventures or associates. If a joint venture or associate subsequently reports profits, the Group resumes recognising it share of those profits only after its share of the profits equals the share of losses not recognised.
After application of the equity method, the Group assesses whether there is any objective evidence that the investment in joint ventures and associates is impaired. If any such indicators exist, the entire carrying amount of the investment in joint ventures and associates is tested for impairment by comparing the recoverable amount with its carrying amount, to determine whether it is necessary to recognise any impairment losses.
The Group makes an assessment at each reporting date as to whether there is any indication that previously recognised impairment losses may no longer exist or may have decreased. If such indicators exist, the Group estimates the investment in joint venture or associate’s recoverable amount and reverses the impairment to the lower of the recoverable amount or carrying amount, that would have been determined had no impairment losses been recognised in prior periods. Such reversals are recognised in profit or loss.
The statement of comprehensive income reflects the share of the results of operation of joint ventures and associates. Where there has been a change recognised directly in the other comprehensive income or equity of the joint venture or associate’s, the Group recognises its share of any changes and discloses this, where applicable, in other comprehensive income or in the statement of changes in equity.
Where a Group entity transacts with a joint venture or associate, unrealised profits and losses are eliminated to the extent of the Group’s interest in the joint venture or associate. Joint ventures and associates are equity-accounted until the date on which the Group ceases to have joint control or significant influence over the investment. Upon loss of significant influence or joint control over the associate or joint venture, the Group measures and recognises any retaining investments at its fair value.
NOTES TO THE CONSOLIDATED ANNUAL FINANCIAL STATEMENTS (continued)for the year ended 30 June 2017

GRAND PARADE INVESTMENTS LIMITED ANNUAL FINANCIAL STATEMENTS 2017
CONSOLIDATED ANNUAL FINANCIAL STATEMENTS 19
1. ACCOUNTING POLICIES CONTINUED
1.3 Basis of consolidation (continued)b) Interest in joint ventures and associates (continued)
Any difference between the carrying amount of the associate or joint venture upon loss of significant influence or joint control and the fair value of the retained investment and proceeds from disposal is recognised in profit or loss. Upon derecognition of the investment in a joint venture or associate, previously recognised gains or losses in other comprehensive income will be released to profit or loss for the period.
1.4. Significant accounting judgements and estimatesIn the preparation of the annual financial statements, management is required to make estimates and assumptions that affect reported income, expenses, assets, liabilities, the accompanying disclosure and the disclosure of contingent assets and liabilities. Use of available information and the application of judgement are inherent in the formation of estimates. Actual results in the future could differ from these estimates which may be material to the financial statements within the next financial period.
The preparation of financial statements in conformity with IFRS requires the use of certain critical accounting estimates and judgements concerning the future. Estimates and judgements are continually evaluated and are based on historical factors coupled with expectations about future events that are considered reasonable.
Estimates that have a significant risk of causing material adjustment to the carrying amount of assets and liabilities within the next year are described below. Key assumptions concerning the future and other key sources of estimation uncertainty at the reporting date, as they involve assessments or decisions that are particularly complex or subjective, are discussed below.
Estimates and assumptions 1.4.1 Depreciation rates and residual values
The depreciation method reflects the pattern in which economic benefits attributable to the asset flow to the entity. The useful lives of these assets can vary depending on a variety of factors, including but not limited to; technological obsolescence, maintenance programmes, refurbishments, product life cycles and the intention of management.
The estimation of the useful life and residual value of an asset is a matter of judgement based on the past experience of the Group with similar assets and the intention of management (refer to Note 15).
Based on management’s valuation, the residual amounts of the buildings exceed their carrying amounts and therefore no depreciation has been accounted for during the current year. An annual assessment is done in this regard.
1.4.2 Deferred tax assetsDeferred tax assets are recognised for unused tax losses to the extent that it is probable that taxable profit will be available against which the losses can be utilised. Significant management judgement is required to determine the amount of deferred tax assets that can be recognised, based on the likely timing and the level of future taxable profits together with future tax planning strategies.
Deferred tax is provided for on unutilised assessed losses of the Group based on forecasts made by management that provide convincing evidence that the utilisation thereof is probable. Management has prepared a forecast for each statutory entity in an assessed loss position, based on the up-to-date market assumptions as well as using the experience gained in the prior years.
The most significant factors in achieving forecast profits, and therefore the utilisation of the deferred tax assets reflected in the consolidated annual financial statements are:
• continued revenue growth per burger king store;
• maintaining the expected rate of store openings;
• improved cost control, achieved through the benefit of economies of scale from the larger group as well as efficiencies gained from experience;
• the closure of stores that are loss making and not expected to become profitable within a reasonable period of time; and
• the requisite allocation of profit-generating stores per statutory entity so as to utilise assessed losses within the relevant statutory entities within a reasonable period of time.

20 CONSOLIDATED ANNUAL FINANCIAL STATEMENTS
NOTES TO THE CONSOLIDATED ANNUAL FINANCIAL STATEMENTS (continued)for the year ended 30 June 2017
1. ACCOUNTING POLICIES CONTINUED
1.4. Significant accounting judgements and estimates (continued)1.4.3 Impairment of non-financial assets (continued)
Impairment exists when the carrying amount of an asset or cash generating unit exceeds its recoverable amount, which is the higher of its fair value less costs of disposal and its value in use. The fair value less costs of disposal calculation is based on available data from binding sales transactions, conducted at arm’s length, for similar assets or observable market prices less incremental costs for disposing of the asset. The value-in-use calculation is based on a Discounted Cash Flow (“DCF”) model. The cash flows are derived from the forecast for the next five years and do not include significant future investments that will enhance the asset’s performance of the CGU tested. The recoverable amount is sensitive to the discount rate used for the DCF model as well as the expected future cash-inflows and the growth rate used for extrapolation purposes. These estimates are most relevant to goodwill and other intangibles with indefinite useful lives recognised by the Group. The key assumptions used to determine the recoverable amount for the different CGUs are disclosed and further explained in Note 17.2.
1.4.4 Share-based paymentsThe Group measures the cost of equity-settled transactions with employees by reference to the fair value of the equity instruments at the date at which they are granted. Estimating fair value of share-based awards requires determination of the most appropriate valuation model, which is dependent on the terms and conditions of the grant. This estimate also requires determination of the most appropriate inputs to the valuation model including the expected life of the share option, volatility and dividend yield and making assumptions about them. The assumptions and models used for estimating fair value for share-based payment transactions are disclosed in Note 24.2.
1.4.5 Jointly controlled entities and associatesThe Group has classified its 51.0% voting interest in GTM and its 49.89% voting interest in SunWest as jointly-controlled entities based on contractual agreements with the other shareholders in those investments to manage and control the business jointly.
In assessing the level of influence held by GPI in respect of Worcester Casino, the voting rights in Worcester Casino as well as the extent of board representation are evaluated. With 15.1% of votes and two of four board members, management considers their relationship to be one of significant influence as they are able to participate in the policy-making processes, including participation in decisions about dividend distribution. Therefore, the Group’s investment in Worcester Casino is considered to be an associate.
1.5 Revenue recognitionRevenue is recognised to the extent that it is probable that the economic benefits will flow to the Group and the revenue can be measured reliably. Revenue is measured at the fair value of the consideration received or receivable, net of any discounts, rebates and related taxes, with the exception of gaming taxes which are treated as a cost of sale. Revenue for material revenue streams are recognised on the bases set-out below:
Food salesFood sales are recognised on the date on which the sale is made at the fair value of the consideration received, net of VAT.
Dividend incomeDividend income is recognised when the shareholder’s right to receive payment is established.
Equipment sales
Equipment sales are recognised on the date on which the sale is made at the fair value of the consideration received, net of VAT.
Interest incomeInterest income is recognised in profit or loss on an accrual basis using the effective interest method.
Management feesManagement fees are recognised in the accounting period in which the services are rendered, by reference to completion of the specific transaction assessed on the basis of actual services provided as a proportion of the total services to be provided.
RoyaltiesRoyalties are recognised on the accrual basis in accordance with the substance of the relevant agreements.
Government grant incomeGovernment grants are recognised where there is reasonable assurance that the grant will be received and all attached conditions will be complied with. When the grant relates to an expense item, it is recognised as income on a systematic basis over the periods that the related costs, for which it is intended to compensate, are expensed. When the grant relates to an asset, it is recognised as income in equal amounts over the expected useful life of the related asset.

GRAND PARADE INVESTMENTS LIMITED ANNUAL FINANCIAL STATEMENTS 2017
CONSOLIDATED ANNUAL FINANCIAL STATEMENTS 21
1. ACCOUNTING POLICIES CONTINUED
1.6 Cost of sales Food and Equipment When inventories are sold, the carrying amount of those inventories are recognised as an expense in the period in which the related revenue is recognised. The amount of any write down of inventories to net realisable value and all losses of inventories are recognised as an expense in the period the write-down or loss occurs.
1.7 Investment properties Investment property is recognised as an asset when it is probable that the future economic benefits associated with the investment property will flow to the enterprise, and the cost of the investment property can be measured reliably.
Investment property is initially recognised at cost. Transaction costs are included in the initial measurement. Costs include costs incurred initially and cost incurred subsequently to add to, or to replace a part of property. If a replacement part is recognised in the carrying amount of the investment property, the carrying amount of the replaced part is derecognised.
Cost model Investment property is carried at cost less accumulated depreciation less any accumulated impairment losses. Depreciation is provided to write down the cost of the property to the estimated residual value by equal instalments over the useful life of the property of 20 years.
Investment properties are derecognised either when they have been disposed of or when they are permanently withdrawn from use and no future economic benefit is expected from their disposal. The difference between the net disposal proceeds and the carrying amount of the asset is recognised in profit or loss in the period of derecognition.
Transfers are made to (or from) investment property only when there is a change in the use of the property and the property is transferred at its carrying value. If owner-occupied property becomes an investment property, the Group accounts for such property in accordance with the policy stated in Note 1.8: Property, plant and equipment up to the date of change.
1.8 Property, plant and equipmentProperty, plant and equipment are initially recognised at cost, being the cash price equivalent at the recognition date. The cost of an asset comprises directly attributable costs and any costs incurred in bringing the asset to the location and condition necessary for it to operate as intended by management.
Property, plant and equipment are subsequently stated at cost less accumulated depreciation and accumulated impairment loss, if any. Subsequent costs are included in the asset’s carrying amount or are recognised as separate assets, as appropriate, only when it is probable that future economic benefits will flow to the Group and the cost of the item can be measured reliably.
Maintenance and repairs, which do not meet these criteria, are charged against profit or loss as incurred. Property, plant and equipment are depreciated on the straight-line basis over the estimated useful lives of the assets to the current values of their expected residual values. The assets’ residual values and useful lives are reviewed, and adjusted prospectively if appropriate, at each reporting date.
Depreciation and impairment losses are included in profit or loss. An item of property, plant and equipment is derecognised upon disposal or when no future economic benefits are expected from its use or disposal. Gains and losses on derecognition of assets are included in profit or loss in the year that the asset is derecognised.
The useful lives are as follows:
Computer equipment – 3 yearsFurniture and fittings – 5 to 6 yearsLeasehold improvements – 4 to 10 yearsMotor vehicles – 5 yearsPlant and equipment – 5 yearsPremises soft furnishings – 5 to 10 yearsLand and buildings – 20 yearsPlant and equipment: Food Group – 5 to 10 yearsLift, generators and security systems – 5 to 15 years

22 CONSOLIDATED ANNUAL FINANCIAL STATEMENTS
NOTES TO THE CONSOLIDATED ANNUAL FINANCIAL STATEMENTS (continued)for the year ended 30 June 2017
1. ACCOUNTING POLICIES CONTINUED
1.9 Intangible assetsIntangible assets acquired separately are measured on initial recognition at cost. The cost of intangible assets acquired in a business combination is its fair value as at the date of acquisition. Following initial recognition, intangible assets are carried at cost less accumulated amortisation and accumulated impairment losses, if any. Internally generated intangible assets excluding capitalised development costs, are not capitalised and the expenditure is reflected in profit or loss in the year in which the expenditure is incurred. The useful lives of intangible assets are assessed as either finite or indefinite. Intangible assets with indefinite useful lives are not amortised, but are tested for impairment annually, either individually or at the cash-generating unit level. Intangible assets with finite lives are amortised over the useful life and assessed for impairment whenever there is an indication that the intangible asset may be impaired. The amortisation period and the amortisation method for an intangible asset with a finite useful life is reviewed at least at the end of each reporting period. An intangible asset is derecognised upon disposal or when no future economic benefits are expected from its use or disposal. Gains and losses on derecognition of assets are included in profit or loss in the year that the asset is derecognised.
Computer software costs Computer software acquired separately is measured on initial recognition at cost. Following initial recognition computer software is carried at cost less any accumulated amortisation and accumulated impairment losses. Computer software is amortised over its useful economic life and assessed for impairment whenever there is an indication that the computer software may be impaired. The amortisation period and the amortisation method for computer software is reviewed annually. The amortisation expense on computer software is recognised in profit or loss under the amortisation category. Computer software is amortised over its expected useful life of three years.
Master franchise licenceExpenditure incurred by the Group in acquiring the Master franchise licences in respect of Burger King®, Dunkin Donuts® and Baskin-Robbins® are measured at the original cost to acquire the licence less accumulated amortisation. The intangible is amortised over its expected useful life of 20 years, which represents a period over which GPI has the right to trade under the brand names of Burger King®, Dunkin Donuts® and Baskin-Robbins®.
Franchise licence feeExpenditure incurred by the Group in acquiring Franchisee licences in respect of the right to operate Burger King restaurants at the various locations and the intangibles are measured at the original cost to acquire the license less accumulated amortisation. The intangible is amortised over its expected useful life of five to 10 years, which represents the licence period over which the Group has the right to operate the Burger King restaurant.
1.10 Impairment of non-financial assetsThe Group assesses at each reporting date whether there is an indication that an asset may be impaired. If any such indication exists, or when annual impairment testing for an asset is required, the Group estimates the asset’s recoverable amount. An asset’s recoverable amount is the higher of an asset’s fair value less costs to sell and its value in use. When the carrying amount exceeds its recoverable amount, the asset is considered impaired and is written-down to its recoverable amount. In assessing value in use, the estimated future cash flows are discounted to their present value using a pre-tax discount rate that reflects current market assessments of the time value of money and the risks specific to the asset. In determining fair value less costs to sell, recent market transactions are taken into account, if available. If no such transactions can be identified, an appropriate valuation model is used.
Impairment losses are recognised in profit or loss. A previously recognised impairment loss, other than a loss related to the impairment of goodwill, is reversed only if there has been a change in the estimates used to determine the asset’s recoverable amount since the last impairment loss was recognised. If that is the case then the asset’s carrying amount is increased to its recoverable amount. The recoverable amount cannot exceed the carrying amount that would have been determined had no impairment loss been recognised for the asset in prior years. Such reversal is recognised in profit or loss.

GRAND PARADE INVESTMENTS LIMITED ANNUAL FINANCIAL STATEMENTS 2017
CONSOLIDATED ANNUAL FINANCIAL STATEMENTS 23
1. ACCOUNTING POLICIES CONTINUED
1.11 Financial instruments – initial recognition and subsequent measurement1.11.1 Financial assets
i) Initial recognition and measurement of financial assets Financial assets within the scope of IAS 39 are classified as loans and receivables and available-for-sale investments. The Group determines the classification on initial recognition.
All financial assets are recognised initially at fair value plus directly attributable transaction costs. Purchases or sales of financial assets that require delivery of assets within a timeframe established by regulation or convention in the market-place (regular way trade) are recognised on the trade date, i.e. the date that the Group commits to purchase or sell the asset. The Group’s financial assets includes cash and short-term deposits, trade and other receivables, loans and receivables, listed and unlisted equity instruments (classified as available-for-sale).
ii) Subsequent measurement of financial assetsThe subsequent measurement of financial assets depends on the classification as follows:
Loans and receivablesLoans and receivables are non-derivative financial assets with fixed or determinable payments that are not quoted in an active market and include related party loans receivable. After initial measurement, such assets are subsequently measured at amortised cost using the effective interest method. Gains and losses are recognised in profit or loss when the loans and receivables are derecognised or impaired, as well as through the amortisation process.
Cash and cash equivalents Cash and short-term deposits in the statement of financial position comprise cash at banks and on hand and short-term deposits with a maturity date of three months or less.
Trade and other receivablesTrade receivables are recognised initially at fair value and subsequently measured at amortised cost using the effective interest method, less provision for impairment.
Available-for-sale investmentsAvailable-for-sale investments consist of investments in unlisted and listed equity instruments. After initial recognition available-for-sale investments are subsequently measured at fair value with unrealised gains or losses recognised as other comprehensive income until the investment is derecognised or until the investment is determined to be impaired, at which time the cumulative gain or loss previously reported in equity is included in the profit or loss.
iii) Derecognition of financial assets A financial asset or portion of a financial asset is derecognised when:
• the rights to receive cash flows from the asset have expired;
• the Group retains the right to receive cash flows from the asset, but has assumed an obligation to pay them in full without any material delay to a third party under a pass through arrangement; or
• the Group has transferred its rights to receive cash flows from the asset and has either (i) transferred substantially all rights and rewards of the asset or (ii) has neither transferred nor retained substantially all the rights and rewards of the asset but has transferred control of the asset.
When the Group has transferred its right to receive cash flows from an asset or has entered into a pass-through arrangement, and has neither transferred nor retained substantially all of the risks and rewards of the asset nor transferred control of the asset, the asset is recognised to the extent of the Group’s continuous involvement in the asset.

24 CONSOLIDATED ANNUAL FINANCIAL STATEMENTS
NOTES TO THE CONSOLIDATED ANNUAL FINANCIAL STATEMENTS (continued)for the year ended 30 June 2017
1. ACCOUNTING POLICIES CONTINUED
1.11 Financial instruments – initial recognition and subsequent measurement (continued)1.11.1 Financial assets (continued)
iv) Impairment of financial assetsThe Group assesses at each reporting date whether there is any objective evidence that a financial asset or a group of assets is impaired. Where the carrying value of these instruments exceeds the recoverable amount, the asset is written-down to the recoverable amount. Impairment losses are recognised in profit or loss.
Impairment of financial assets carried at amortised costIf there is objective evidence that an impairment loss on loans and receivables carried at amortised cost has been incurred, the amount of the loss is measured as the difference between the asset’s carrying amount and the present value of estimated future cash flows (excluding future credit losses that have not been incurred) discounted at the financial asset’s original effective interest rate (i.e. the effective interest rate computed at initial recognition). The carrying amount of the asset is reduced by any impairment loss. The amount of the loss is recognised in profit or loss.
The criteria that the Group uses to determine that there is objective evidence of an impairment loss include:
• significant financial difficulty of the issuer or obligor;
• a breach of contract, such as a default or delinquency in interest or principal payments;
• it becomes probable that the borrower will enter bankruptcy or other financial reorganisation;
• observable data indicating that there is a measurable decrease in the estimated future cash flows from a portfolio of financial assets since the initial recognition of those assets, although the decrease cannot yet be identified with the individual financial assets in the portfolio, including:
a) adverse changes in the payment status of borrowers in the portfolio; and
b) national or local economic conditions that correlate with defaults on the assets in the portfolio.
The Group first assesses whether objective evidence of impairment exists individually for the financial assets that are individually significant, and individually or collectively for financial assets that are not individually significant. If it determines that no objective evidence of impairment exists for an individually assessed financial asset, whether significant or not, it includes the asset in a group of financial assets with similar credit risk characteristics and collectively assesses them for impairment. Assets that are individually assessed for impairment and for which an impairment loss is or continues to be recognised are not included in a collective assessment of impairment.
Impairment of available-for-sale investmentsThe Group assesses at each reporting date whether there is objective evidence that an available-for-sale investment is impaired. In the case of equity investments classified as available-for-sale, objective evidence would include a significant or prolonged decline in the fair value of the investment. ‘Significant’ is evaluated against the original cost of the investment and ‘prolonged’ against the period in which the fair value has been below its original cost. Where there is evidence of impairment, the cumulative loss, measured as the difference between the acquisition cost and the current fair value less any impairment losses on that investment previously recognised in profit or loss, is removed from other comprehensive income and recycled to profit or loss.
If in a subsequent period, the fair value of an equity investment classified as available-for-sale increases, the impairment losses recognised in profit or loss are not reversed through profit or loss.
1.11.2 Financial liabilitiesi) Initial recognition and measurement of financial liabilities
Financial liabilities within the scope of IAS 39 are classified as financial liabilities at amortised cost. The Group determines the classification of its financial liabilities at initial recognition.
All financial liabilities are initially recognised at fair value plus transaction costs that are directly attributable to the acquisition or issue of the financial liability. The Group’s financial liabilities include trade and other payables, loans and preference shares.

GRAND PARADE INVESTMENTS LIMITED ANNUAL FINANCIAL STATEMENTS 2017
CONSOLIDATED ANNUAL FINANCIAL STATEMENTS 25
1. ACCOUNTING POLICIES CONTINUED
1.11 Financial instruments – initial recognition and subsequent measurement (continued)1.11.2 Financial liabilities (continued)
ii) Subsequent measurement of financial liabilities The subsequent measurement of financial liabilities depends on the classification as follows:
Loans and borrowingsAfter initial recognition, interest-bearing borrowings and loans are subsequently measured at amortised cost using the effective interest method. Gains and losses are recognised in profit or loss when the liabilities are derecognised as well as through the amortisation process.
Trade and other payablesTrade and other payables are subsequently measured at amortised cost using the effective interest method. Gains and losses are recognised in profit or loss when the trade and other payables are de-recognised and through interest based on the effective interest method. Trade and other payables are short-term in nature and are classified as current liabilities in the statement of financial position. Related party loans are payable on demand and are classified as current liabilities in the statement of financial position.
Preference sharesPreference shares that are redeemable on a specific date or at the option of the shareholder are classified as financial liabilities and are held at amortised cost using the effective interest method. The dividends on these preference shares are recognised in profit or loss as interest expense.
iii) Derecognition of financial liabilities A financial liability is de-recognised when the obligation under the liability is discharged, cancelled or has expired.
When an existing financial liability is replaced by another financial liability from the same lender on substantially different terms, or terms of an existing liability are substantially modified, such an exchange or modification is treated as a de-recognition of the original liability and recognised as a new liability, and the difference in the respective carrying amounts is recognised in profit or loss.
1.11.3 Offsetting of financial assets and liabilitiesFinancial assets and liabilities are off-set and the net amount reported in the statement of financial position when there is a currently legally enforceable right to set-off the recognised amounts and there is an intention to realise the assets and settle the liabilities simultaneously or settle on a net basis.
1.12 InventoriesInventories are valued at the lower of cost and net realisable value. Cost is measured using standard costing and revised in light of current conditions as necessary. Net realisable value is the estimated selling price in the ordinary course of business, less estimated costs of completion and the estimated costs necessary to make the sale.
Costs incurred in bringing each product to its present location and condition are accounted for as follows:
• raw materials: purchased cost on a first in, first out basis; and
• finished goods and work in progress: cost of direct materials and labour and a proportion of manufacturing overheads based on the normal operating capacity.
1.13 Borrowing costsBorrowing costs directly attributable to the acquisition, construction or production of an asset that necessarily takes a substantial period of time to get ready for its intended use or sale are capitalised. All other borrowing costs are expensed in the period they occur.
1.14 LeasesThe determination of whether an arrangement is, or contains, a lease is based on the substance of the arrangement at inception date, whether fulfilment of the arrangement is dependent on the use of a specific asset or assets or the arrangement conveys a right to use the asset, even if that right is not explicitly specified in an arrangement. Leases are classified as finance leases where substantially all the risks and rewards associated with ownership have transferred from the lessor to the lessee. Finance leases are capitalised at the commencement of the lease at the fair value of the leased property or, if lower, at the present value of the minimum lease payments. Lease payments are apportioned between finance charges and reduction of the lease liability so as to achieve a constant rate of interest on the remaining balance of the liability. Finance charges are recognised in finance costs in profit or loss.

26 CONSOLIDATED ANNUAL FINANCIAL STATEMENTS
NOTES TO THE CONSOLIDATED ANNUAL FINANCIAL STATEMENTS (continued)for the year ended 30 June 2017
1. ACCOUNTING POLICIES CONTINUED
1.14 Leases (continued)A leased asset is depreciated over the useful life of the asset. However, if there is no reasonable certainty that the Group will obtain ownership by the end of the lease term, the asset is depreciated over the shorter of the estimated useful life of the asset and the lease term.
All other leases are treated as operating leases and the relevant rentals are recognised as an expense in profit or loss on a straight-line basis over the lease term. Contingent rentals are recognised as incurred.
The Group leases certain property, plant and equipment and motor vehicles.
1.15 TaxesCurrent normal tax Current income tax assets and liabilities for the current year and prior years are measured at the amount expected to be recovered from or paid to the taxation authorities. The tax rates and tax laws used to compute the amount are those that are enacted or substantively enacted at the reporting date. Current income tax relating to items recognised directly in other comprehensive income or equity is recognised in other comprehensive income or equity and not in profit or loss.
Deferred tax Deferred tax is recognised on differences between the carrying amounts of assets and liabilities in the financial statements and the corresponding tax base used in the computation of taxable profit, and is accounted for using the liability method. Deferred tax liabilities are generally recognised for all taxable temporary differences and deferred tax assets are generally recognised for all deductible temporary differences, carry forward of unused tax credits and unused tax losses, to the extent that it is probable that taxable profit will be available against which the deductible temporary differences and the carry forward of unused tax credits and unused tax losses can be utilised. Such assets and liabilities are not recognised if the temporary difference arises from goodwill or from the initial recognition (other than in a business combination) of other assets and liabilities in a transaction that affects neither the taxable profit nor the accounting profit.
Deferred tax liabilities are recognised for taxable temporary differences arising on investments in subsidiaries and associates, and interests in joint ventures, except where the Group is able to control the reversal of the temporary difference and it is probable that the temporary difference will not reverse in the foreseeable future.
In respect of deductible temporary differences associated with investments in subsidiaries, associates and interest in joint ventures, deferred tax assets are recognised only to the extent that it is probable that the temporary differences will reverse in the foreseeable future and taxable profit will be available against which the temporary difference can be utilised.
The carrying amount of deferred tax assets is reviewed at each reporting date and reduced to the extent that it is no longer probable that sufficient taxable profits will be available to allow all or part of the asset to be recovered.
Deferred tax is calculated at the tax rates that are expected to apply in the period when the liability is settled or the asset realised based on tax rates/laws that have been enacted or substantively enacted at the reporting date.
Deferred tax is charged or credited to profit or loss, except when it relates to items charged or credited to other comprehensive income or directly to equity, in which case it is recognised in other comprehensive income or equity respectively.
Dividend withholding tax Dividend withholding tax (DWT) payable is included as part of trade and other payables in the statement of financial position. The gross amount of dividends declared is accounted for in equity.
1.16 Dividends payableDividends payable and the related taxation or withholding tax thereon are recognised as liabilities in the period in which the dividends are declared. A dividend declared subsequent to period-end is not charged against total equity at the reporting date as no liability exists.

GRAND PARADE INVESTMENTS LIMITED ANNUAL FINANCIAL STATEMENTS 2017
CONSOLIDATED ANNUAL FINANCIAL STATEMENTS 27
1. ACCOUNTING POLICIES CONTINUED
1.17 Employee benefitsWages and salaries, annual leave and sick leave Liabilities for wages and salaries, including non-monetary benefits and annual leave that are due to be settled within 12 months of the reporting date are recognised in other payables in respect of employees’ services up to the reporting date and are measured at the amounts that are due to be paid when the liabilities are settled.
Long-service leave provisionThe liability for long-service leave is recognised in provisions and measured using the projected unit credit method calculated by an independent actuary and is based on a minimum service period of five years and accumulates up to a maximum of 35 years continuous service. Consideration is given to the current wage and salary levels and the number of employees expected to qualify for the award. Movements in the provision are taken to profit or loss.
Retirement benefit obligationsThe Group has a defined contribution plan which is governed by the Pension Fund Act No. 24 of 1956. The defined contribution plan receives fixed contributions from the Group and its legal or constructive obligation is limited to these contributions.
Contributions to the defined contribution fund are recognised as an expense as they become payable. Prepaid contributions are recognised as an asset to the extent that a cash refund or a reduction in the future payments is available.
Short-term incentive plan The Group recognises a liability and an expense for bonuses and profit-sharing based on a formula that takes into consideration the profit attributable to the Group’s shareholders after certain adjustments. The Group recognises a provision where contractually obliged or where there is a past practice that has created a constructive obligation, the amount can be measured reliably and the Directors are of the opinion that it is probable that such bonuses will be paid.
Termination benefitsTermination benefits are payable when employment is terminated by the Group before the normal retirement date, or whenever an employee accepts voluntary redundancy in exchange for these benefits. The Group recognises termination benefits when it is demonstrably committed to either:
• terminating the employment of current employees according to a detailed formal plan without possibility of withdrawal; or
• providing termination benefits as a result of an offer made to encourage voluntary redundancy. Benefits falling due more than 12 months after the reporting date are discounted to their present value.
1.18 ProvisionsProvisions are recognised when the Group has a present legal or constructive obligation as a result of past events, it is more likely than not that an outflow of resources will be required to settle the obligation and the amount has been reliably estimated.
Where there are a number of similar obligations, the likelihood that an outflow will be required in settlement is determined by considering the class of obligations as a whole. A provision is recognised even if the likelihood of an outflow with respect to any one item included in the same class of obligations may be small.
Provisions are measured at the present value of management’s best estimate of the expenditure required to settle the obligation at the reporting date.
1.19 Treasury sharesOwn equity instruments which are re-acquired (treasury shares) are recognised at cost and deducted from equity. No gain or loss is recognised in profit or loss on the purchase, sale, issue or cancellation of the Group’s own equity instruments.
28 CONSOLIDATED ANNUAL FINANCIAL STATEMENTS
NOTES TO THE CONSOLIDATED ANNUAL FINANCIAL STATEMENTS (continued)for the year ended 30 June 2017
1. ACCOUNTING POLICIES CONTINUED
1.20 Translation of foreign currenciesForeign currency transactionsA foreign currency transaction is recorded, on initial recognition in Rand, by applying to the foreign currency amount, the spot exchange rate between the functional currency and the foreign currency at the date of the transaction.
At the end of the reporting period, foreign currency:
• monetary items are translated using the closing rate;
• non-monetary items that are measured in terms of historical cost in a foreign currency are translated using the exchange rate at the date of the transaction; and
• non-monetary items that are measured at fair value in a foreign currency are translated using the exchange rates at the date when the fair value was determined.
Exchange differences arising on the settlement of monetary items or on translating monetary items at rates different from those at which they were translated on initial recognition during the period or in previous consolidated financial statements are recognised in profit or loss in the period in which they arise.
Cash flows arising from transactions in a foreign currency are recorded in Rand by applying to the foreign currency amount the exchange rate between the Rand and the foreign currency at the date of the cash flow.
1.21 Share-based paymentsEmployees (including senior executives) of the Group receive remuneration in the form of share-based payments, whereby employees render services as consideration for equity instruments (equity-settled transactions).
Equity-settled transactionsThe cost of equity-settled transactions is determined by the fair value at the date when the grant is made using an appropriate valuation model.
That cost is recognised, together with a corresponding increase in other capital reserves in equity, over the period in which the performance and/or service conditions are fulfilled in employee benefits expense (Note 24.2). The cumulative expense recognised for equity-settled transactions at each reporting date until the vesting date reflects the extent to which the vesting period has expired and the Group’s best estimate of the number of equity instruments that will ultimately vest. The statement of profit or loss expense or credit for a period represents the movement in cumulative expense recognised as at the beginning and end of that period and is recognised in employee benefits expense (Note 6).
When these services are rendered in an associate or jointly controlled venture the fair value of these costs are capitalised to the carrying value of the investment.
No expense is recognised for awards that do not ultimately vest, except for equity-settled transactions for which vesting is conditional upon a market or non-vesting condition. These are treated as vesting irrespective of whether or not the market or non-vesting condition is satisfied, provided that all other performance and/or service conditions are satisfied.
When the terms of an equity-settled award are modified, the minimum expense recognised is the grant date fair value of the unmodified reward. An additional expense is recognised for any modification that increases the total fair value of the share-based payment transaction, or is otherwise beneficial to the employee as measured at the date of modification.
The dilutive effect of outstanding options is reflected as additional share dilution in the computation of diluted earnings per share (Note 9).
1.22 Non-current assets held-for-sale The Group classifies non-current assets and disposal groups as held-for-sale if their carrying amounts will be recovered principally through a sale rather than through continuing use. Such assets and disposal groups classified as held-for-sale or are measured at the lower of their carrying amount and fair value less costs to sell. Costs to sell are the incremental costs directly attributable to the sale, excluding the finance costs and income tax expense.
The criteria for held-for-sale classification is regarded as met only when the sale is highly probable and the asset or disposal group is available for immediate sale in its present condition. Actions required to complete the plan should indicate that it is unlikely that significant changes to the plan will be made or that the plan will be withdrawn. Management must be committed to the sale expected within one year from the date of the classification.

GRAND PARADE INVESTMENTS LIMITED ANNUAL FINANCIAL STATEMENTS 2017
CONSOLIDATED ANNUAL FINANCIAL STATEMENTS 29
1. ACCOUNTING POLICIES CONTINUED
1.22 Non-current assets held-for-sale (continued)Property, plant and equipment and intangible assets are not depreciated or amortised once classified as held-for-sale.
Assets and liabilities classified as held-for-sale are presented separately as current items in the statement of financial position.
Additional disclosures are provided in Note 3. All other notes to the financial statements mainly include amounts for continuing operations, unless otherwise mentioned.
When the Group changes its intention to sell or makes a formal decision not to sell an asset (or disposal group) classified as held-for-sale, (other than associates, joint ventures or subsidiaries) the asset (or disposal group) no longer meets the recognition criteria to be classified as an asset held-for-sale. The Group measures the asset at the lower of:
i) its carrying amount before the asset (or disposal group) was classified as held-for-sale, adjusted for any depreciation, amortisation or revaluations that would have been recognised had the asset (or disposal group) not been classified as held-for-sale; and
ii) its recoverable amount at the date of the subsequent decision not to sell.
If the asset (or disposal group) is a subsidiary, joint venture or an associate the Group restates the results for all periods since the initial classification as held-for-sale to no longer recognise the asset (or disposal group) as held-for-sale in those periods.
1.23 Fair value measurementFair value is the price that would be received to sell an asset or paid to transfer a liability in an orderly transaction between market participants at the measurement date. The fair value of an asset or a liability is measured using the assumptions that market participants would use when pricing the asset or liability, assuming that market participants act in their economic best interest.
The Group uses valuation techniques that are appropriate in the circumstances and for which sufficient data are available to measure fair value, maximising the use of relevant observable inputs and minimising the use of unobservable inputs.
For assets and liabilities that are recognised in the financial statements at fair value on a recurring basis, the Group determines whether transfers have occurred between levels in the hierarchy by re-assessing categorisation (based on the lowest level input that is significant to the fair value measurement as a whole) at the end of each reporting period.
The Group’s Corporate Finance Department is responsible for the fair value measurement procedures for recurring fair value measurements such as investment properties and unquoted AFS financial assets. External valuers are involved for significant valuations and for the annual and half yearly net asset valuation. The Corporate Finance Department present the results of the valuations to the Financial Director, Board, Audit and Risk Committee and independent auditors on a quarterly basis.

30 CONSOLIDATED ANNUAL FINANCIAL STATEMENTS
NOTES TO THE CONSOLIDATED ANNUAL FINANCIAL STATEMENTS (continued)for the year ended 30 June 2017
2. STANDARDS AND INTERPRETATIONS2.1 Standard issued and effective for the current reporting period
The accounting policies adopted by the Group are consistent with the previous financial year. The group adopted all standards and amendments that became effective in the current period. None of these standards or amendments had an impact on the financial statements as presented, but may have on future transactions and disclosures.
2.2 Standards issued not yet effectiveAt the date of authorisation of these annual financial statements, these are standards and interpretations in issue but not effective and will be adopted when they become effective.
Standard
Effective date – annual periods commencing on or after Effect of change
Amendment to IAS 12 – Income Taxes
1 Jan 2017 The amendments clarify that an entity needs to consider whether tax law restricts the sources of taxable profits against which it may make deductions on the reversal of that deductible temporary difference. Furthermore, the amendments provide guidance on how an entity should determine future taxable profits and explains in which circumstances taxable profit may include the recovery of some assets for more than their carrying amount. This is currently being assessed by management.
Amendment to IFRS 12 – Disclosure of interest in other entities
1 Jan 2017 The amendments clarify that certain disclosure requirements apply to an entity’s interest in a subsidiary, a joint venture or an associate that is classified (or included in a disposal group that is classified) as held for sale. The clarification is not expected to have a material impact on the Group, however it might require expanded disclosure.
Amendment to IAS 7 – Statement of cash flows
1 Jan 2017 The amendments require entities to provide disclosures about changes in their liabilities arising from financing activities, including both changes arising from cash flows and non-cash changes (such as foreign exchange gains or losses). This may give rise to additional disclosures in future.
Amendment to IAS 28 – Investment in associates and joint ventures
1 Jan 2018 The amendment clarifies that measuring investees at fair value through profit or loss is an investment-by-investment choice. The clarification is not expected to have a material impact on the Group.
Amendment to IAS 40 – Investment Property
1 Jan 2018 The amendments clarify when an entity should transfer property, including property under construction or development into, or out of investment property. This may affect the classification of items in future but is unlikely to have a material impact on the Group.

GRAND PARADE INVESTMENTS LIMITED ANNUAL FINANCIAL STATEMENTS 2017
CONSOLIDATED ANNUAL FINANCIAL STATEMENTS 31
Standard
Effective date – annual periods commencing on or after Effect of change
IFRS 9 – Financial Instruments
1 Jan 2018 IFRS 9 introduces new classification and measurement bases, a new impairment model and revised guidance on hedge accounting. Based on the new classification and measurement requirements, debt instruments are subsequently measured at fair value through profit or loss (FVTPL), amortised cost, or fair value through other comprehensive income (FVOCI), on the basis of their contractual cash flows and the business model under which the debt instruments are held. Equity instruments are generally measured at FVTPL.
The impairment requirements are based on an expected credit loss (ECL) model that replaces the IAS 39 incurred loss model. For trade receivables, a simplified approach may be applied whereby the lifetime ECL are always recognised.
The majority of ‘IAS 39 Financial Instruments: Recognition and Measurement’ classification and measurement requirements for financial liabilities have been carried forward into IFRS 9.
The impact of the standard is currently being assessed by management, particularly relating to the classification and profit or loss impacts of its current ‘Available for sale’ financial assets. Other than these instruments, significant change in classification and measurement is not expected. In addition, because of the short term nature of the majority of GPI’s receivables, significant increases in impairment are considered unlikely.
Amendment to IFRS 2 – Clarification of Classification and Measurement of Share-based Payment Transactions
1 Jan 2018 The amendments to IFRS 2 are intended to eliminate diversity in practice, but are narrow in scope and address specific areas of classification and measurement relating to the effects of vesting conditions on the measurement of cash-settled share-based payment transactions; the classification of a share-based payment transaction with net settlement features for withholding tax obligations; and accounting for a modification to the terms and conditions of a share-based payment transaction which changes its classification from cash-settled to equity-settled. The amendments are not expected to have a material impact on the Group.
2. STANDARDS AND INTERPRETATIONS CONTINUED
2.2 Standards issued not yet effective (continued)

32 CONSOLIDATED ANNUAL FINANCIAL STATEMENTS
Standard
Effective date – annual periods commencing on or after Effect of change
IFRS 15 – Revenue from Contracts from Customers
1 Jan 2018 IFRS 15 replaces all existing revenue requirements in IFRS and applies to all revenue arising from contracts with customers, unless the contracts are in the scope of other standards, such as IAS 17. Its requirements also provide a model for the recognition and measurement of gains and losses on disposal of certain non-financial assets, including property, plant and equipment and intangible assets. The standard outlines the principles an entity must apply to measure and recognise revenue. The core principle is that an entity will recognise revenue at an amount that reflects the consideration to which the entity expects to be entitled in exchange for transferring goods or services to a customer.
The principles in IFRS 15 must be applied using a five-step model:
1. Identify the contract(s) with a customer
2. Identify the performance obligations in the contract
3. Determine the transaction price
4. Allocate the transaction price to the performance obligations in the contract
5. Recognise revenue when (or as) the entity satisfies a performance obligation.
IFRS 15 is more prescriptive than the current IFRS requirements for revenue recognition and provides more application guidance.
The disclosure requirements are also more extensive.
The impact of the standard is currently being assessed by management, particularly relating to any principle-agent relationships and performance obligations relating to servicing inventory subsequent to the sale thereof.
IFRS 16 – Leases 1 Jan 2019 The new leasing standard requires a lessee to recognise a ‘right of use’ asset and a corresponding financing liability on commencement of a lease for all leases other than low value or short-term leases. Right of lease assets are amortised over period to the earlier of the end of the useful life of the right-of-use asset or the end of the lease term. This will affect the majority of the Group’s leases in which it is the lessee. The new model will result in an increase in both assets and liabilities of the Group.
IFRIC 23 – Uncertainty over Income Tax Treatments
1 Jan 2019 Applied to the determination of taxable profit (tax loss), tax bases, unused tax losses, unused tax credits and tax rates, when there is uncertainty over income tax treatments under IAS 12. IFRIC 23 is unlikely to have a material impact on the Group.
NOTES TO THE CONSOLIDATED ANNUAL FINANCIAL STATEMENTS (continued)for the year ended 30 June 2017
2. STANDARDS AND INTERPRETATIONS CONTINUED
2.2 Standards issued not yet effective (continued)

GRAND PARADE INVESTMENTS LIMITED ANNUAL FINANCIAL STATEMENTS 2017
CONSOLIDATED ANNUAL FINANCIAL STATEMENTS 33
2017
R’000s2016
R’000s
3 ASSETS HELD-FOR-SALEThe assets and liabilities included in assets classified as held-for-sale are as follows: Assets Non-current assetsInvestment in associate (Sun Slots) – 171 140 Investment property (1 Heerengracht) 40 175 – Investment property (21 Friesland Drive) 21 339 Assets classified as held-for-sale 40 175 192 479
Non-current liabilitiesDeferred tax liabilities (Sun Slots) – 16 690 Liabilities associated with assets held-for-sale – 16 690 Net assets 40 175 175 789
At year-end the Group entered into an agreement with UBUD Developments (Pty) Ltd to dispose of its property situated at 1 Heerengracht for R52.5 million. The transfer of the property was effected on 18 August 2017. The property was previously disclosed as investment property. Non-current assets held-for-sale are measured at the lower of carrying amount and fair value less cost of sale.
2017
R’000s
4. DISPOSAL/ACQUISITION OF BUSINESSES4.1 Disposal of businesses
The profit or loss on disposal of businesses is included in profit/(loss) for the year in the statement of comprehensive income.
Cash inflow on disposal of businesses 10 215 Net profit on disposal of investment 1 341
4.1.1 Disposal of Grand LinkstateThe Group disposed of its interest in Grand Linkstate, effective 12 August 2016, for a gross consideration of R1.0 million. The consideration was received on the effective date.Property, plant and equipment (581)Intangible assets (10)Trade and other receivables (2 579)Cash and cash equivalents (629)Goodwill (377)Trade and other liabilities 1 288 Provisions 639 Non-controlling interest (6 612)GPI’s share of net asset disposed of (8 861)Consideration received in cash and cash equivalents 961 Loss on disposal of business (7 900)
Net cash inflow on disposal of businessConsideration received in cash and cash equivalents 961 Less: Cash and cash equivalents balance disposed of (629)
332

34 CONSOLIDATED ANNUAL FINANCIAL STATEMENTS
2017
R’000s
4. DISPOSAL/ACQUISITION OF BUSINESSES CONTINUED
4.1 Disposal of businesses (continued) 4.1.2 Disposal of Grand Sport
The Group disposed of its interest in Grand Sport (Pty) Ltd, effective 24 January 2017, for a gross consideration of R10.0 million. The consideration was received on the effective date.Property, plant and equipment (30)Intangible assets (369)Trade and other receivables (1 158)Cash and cash equivalents (117)Trade and other liabilities 817 Provisions 98 Net asset disposed of (759)Consideration received in cash and cash equivalents 10 000 Profit on disposal of business 9 241
Net cash inflow on disposal of businessConsideration received in cash and cash equivalents 10 000 Less: Cash and cash equivalents balance disposed of (117)
9 883
4.2 Prior year business combinationGrand Foods Meat PlantOn 26 October 2015, the Group acquired a further 65% shareholding of Grand Foods Meat Plant for R35.8 million, including R3.3 million for repayment of the shareholder loan, increasing its effective shareholding to 96.9%. The increased holding gave the Group control of the investment that had been previously classified as an investment in associate. As a result, Grand Foods Meat Plant was consolidated into the Group results with effect from 26 October 2015.
The initial 35% investment was increased to its fair value of R17.5 million resulting in a fair value gain of R18.7 million being recognised in profit or loss from continuing operations. The key unobservable inputs were a discount rate of 19.0% and a terminal growth rate of 5.5%.
All the assets purchased and the liabilities assumed in the acquisition were identified at their fair values and were recognised separately from goodwill. No intangible assets were recognised during the identification process. Goodwill of R53.9 million was recognised as part of the business combination and represents the expected value creation within Grand Foods Meat Plant as a result of the opportunity to trade with Burger King during their expansion.
The table below provides an analysis on the values recognised:
2017
R’000s
2016
R’000s
4.3 Profit/(loss) on disposal of investmentsProfit on disposal of Sun Slots 90 588 55 258 Loss on disposal of Grand Linkstate (7 900) – Profit on disposal of Grand Sport 9 241 – Profit on disposal of SunWest and Worcester – 215 307
91 929 270 565
NOTES TO THE CONSOLIDATED ANNUAL FINANCIAL STATEMENTS (continued)for the year ended 30 June 2017

GRAND PARADE INVESTMENTS LIMITED ANNUAL FINANCIAL STATEMENTS 2017
CONSOLIDATED ANNUAL FINANCIAL STATEMENTS 35
2017
R’000s
2016
R’000s
5. REVENUEFood sales 653 413 485 162 Equipment sales 182 704 198 342 Meat sales 91 477 44 739 Dividends received 16 859 15 235 Other revenue 6 925 3 362 IT fees – 9 501 Rental income 10 980 14 946 Gross gaming revenue – Sport betting 640 1 057 Revenue 962 998 772 344 Finance income 31 583 23 660 Total revenue and finance income 994 581 796 004
6. PROFIT FROM OPERATIONS BEFORE FINANCE COSTS AND TAXATIONProfit before finance and taxation cost is stated after:
IncomeRemeasurement of investment – 18 687 Gain on disposal of investments 91 929 270 565
ExpensesDepreciation (note 15) 66 083 45 876 Amortisation (note 16) 4 906 2 975 Operating lease rentals of premises 51 020 38 640 – Contingent leases 1 981 3 069 – Straight-lined leases 49 039 35 571 Impairment of work in progress 3 676 – Profit/(loss) on disposal of property, plant and equipment 15 998 (412)Loss on disposal of intangibles – (654)
Auditors’ remunerationAudit fees 4 454 4 351 – current year 3 886 3 906 – prior year underprovision 568 445
Staff costs 240 566 211 751 – Salaries and wages 205 679 193 869 – Directors’ remuneration (note 35) 31 434 15 967 – Share-based payments expense 3 453 1 915
Number of employees 2 501 2 295
7. FINANCE COSTS Bank loans and overdraft 1 190 984 Short-term borrowings 12 272 22 117 Preference shares – interest 21 724 33 302 Interest on finance lease liabilities 4 286 4 238 Term loans 10 621 11 896
50 093 72 537

36 CONSOLIDATED ANNUAL FINANCIAL STATEMENTS
2017
R’000s
2016
R’000s
8. TAXATIONSouth African normal tax– current year 67 705 146 863 – prior year overprovision (4 676) (4 282)Movement in deferred tax liability associated with assets held-for-sale (16 760) (14 689)Deferred tax (51 287) (42 498)
(5 018) 85 394
% %
Standard rate 28.00 28.00 Exempt income(1) (532.89) (20.26)Non-deductible expenses(2) 173.60 9.45 Prior year overprovision 78.80 (1.57)Difference in tax rate of a trust – 0.03 Change in CGT rate – 1.00 Tax rate differential on disposals of capital items 269.04 13.03 Assessed loss not recognised (101.10) 1.05 Effective tax rate (84.55) 30.73
(1) Exempt income pertains mostly to dividends received and equity-accounted earnings(2) Non-deductible expenses pertains to other expenses disallowed under the
apportionment basis as well as on impairments of investments.
R’000s R’000s
Deferred taxationDeferred tax assets 147 128 95 241 Deferred tax liabilities (4 469) (6 245)
142 659 88 996
The deferred tax balance is made up as follows:Operating lease 4 285 1 656 Assessed losses 141 845 94 684 Provisions and accruals 11 042 5 573 Prepayments (1 823) (1 121)Foreign currency adjustments – (113)Property, plant and equipment (12 690) (9 359)Available-for-sale investment – (2 324)
142 659 88 996
Reconciliation of net deferred tax assetOpening balance 88 996 37 666 Tax expense for the period recognised in profit or loss 51 287 42 498 Operating lease 2 629 1 861 Assessed losses 47 161 37 497 Provisions and accruals 5 469 558 Prepayments (702) (419)Foreign currency adjustment 113 (113)Property, plant and equipment (3 383) 3 114
Tax expense for the period recognised in other comprehensive income 2 376 8 019 Liability recognised through business combination – 813 Closing balance 142 659 88 996
NOTES TO THE CONSOLIDATED ANNUAL FINANCIAL STATEMENTS (continued)for the year ended 30 June 2017

GRAND PARADE INVESTMENTS LIMITED ANNUAL FINANCIAL STATEMENTS 2017
CONSOLIDATED ANNUAL FINANCIAL STATEMENTS 37
9. BASIC AND DILUTED EARNINGS PER SHAREBasic earnings per share amounts are calculated by dividing the net profit for the year attributable to ordinary equity holders of the Company by the weighted average number of ordinary shares (WANOS) in issue during the year.
Diluted earnings per share amounts are calculated by dividing the net profit for the year attributable to ordinary shareholders by the diluted WANOS in issue.
Headline earnings per share amounts are calculated by dividing the headline earnings for the year attributable to ordinary shareholders by the WANOS in issue for the year.
Diluted headline earnings per share amounts are calculated by dividing the headline earnings for the year attributable to ordinary shareholders by the diluted WANOS in issue for the year.
2017
R’000s
2016
R’000s
9.1 Reconciliation of the profit for the yearBasic and diluted earnings per share reconciliationProfit for the year 10 953 192 519 Non-controlling interest 8 328 10 290 Profit for the year attributable to ordinary shareholders 19 281 202 809
9.2 Reconciliation of headline (loss)/earnings for the yearProfit for the year attributable to ordinary shareholders 19 281 202 809 Profit on sale of investments (59 819) (158 621)Impairment of investments 4 490 2 691 Reversal of impairments – (21 362)Loss on disposal of property, plant, equipment and intangibles 12 910 769 Remeasurement of investment – (17 023)Adjustments by jointly-controlled entities 3 012 122 – Impairment of investment 2 889 – – Loss on disposal of plant and equipment 123 122
Headline (loss)/earnings (20 126) 9 385
000s 000s
9.3 Reconciliation of WANOS – net of treasury sharesShares in issue at beginning of the year 461 732 470 076 Shares repurchased during year weighted for period held by Group (17 020) (497)Shares repurchased and cancelled during the year weighted for period held by Group (7 148) – Shares issued during the year weighted for period in issue 1 271 2 003
438 835 471 582
000s 000s
9.4 Reconciliation of diluted WANOS – net of treasury sharesWANOS in issue – net of treasury shares 438 835 471 582 Effects of dilution from: – Share options – 2 274 Diluted WANOS in issue – net of treasury shares 438 835 473 856
Cents Cents
9.5 StatisticsBasic earnings per share 4.39 43.01 Diluted earnings per share 4.39 42.80 Headline (loss)/earnings per share (4.59) 1.99 Diluted headline (loss)/earnings per share (4.59) 1.98

38 CONSOLIDATED ANNUAL FINANCIAL STATEMENTS
NOTES TO THE CONSOLIDATED ANNUAL FINANCIAL STATEMENTS (continued)for the year ended 30 June 2017
10.
INV
ESTM
ENT
IN J
OIN
TLY
CO
NTR
OLL
ED E
NTI
TIES
The
Gro
up
’s in
vest
me
nts
th
at
ha
ve b
ee
n c
lass
ifie
d a
s jo
intly
co
ntr
olle
d e
ntit
ies
are
:
Effe
ctiv
e h
old
ing
Inve
stm
en
t
2017 %
2016 %
De
scrip
tion
of b
usin
ess
Sun
We
st
15.1
015
.10
Sun
We
st h
old
s 10
0% o
f Gra
nd
We
st C
asin
o a
nd
En
tert
ain
me
nt
Wo
rld a
nd
100
% o
f th
e
Tab
le B
ay
Ho
tel
Gra
nd
Te
llum
at
Ma
nu
fac
turin
g (
“GTM
”)
51.0
051
.00
Gra
nd
Te
llum
at
ma
nu
fac
ture
s a
nd
ass
em
ble
s e
lec
tro
nic
eq
uip
me
nt
The
re h
as
be
en
no
mo
vem
en
t in
th
ese
ho
ldin
gs
du
ring
th
e c
urre
nt
yea
r.
Sun
We
stW
orc
est
er C
asin
o
Sun
Slo
ts
Gra
nd
Te
llum
at
Ma
nu
fac
turin
g
Tota
l
2017
R’0
00s
2016
R’0
00s
2017
R’0
00s
2016
R’0
00s
2017
R’0
00s
2016
R’0
00s
2017
R’0
00s
2016
R’0
00s
2017
R’0
00s
2016
R’0
00s
10.1
Rec
onc
ilia
tion
of c
arr
ying
va
lue
Ca
rryin
g a
mo
unt o
f the
inve
stm
ent
–
be
gin
ning
of t
he y
ea
r 6
16 7
15
1 0
55 7
51
– –
– 2
68 8
50
12
920
18
114
629
635
1
342
715
In
vest
me
nt
in jo
intly
c
on
tro
lled
en
tity
– –
– 3
0 12
0 –
– –
– –
30
120
Pro
fit/(
loss
) fr
om
join
tly
co
ntr
olle
d e
ntit
ies
70
354
124
980
–
945
–
24
351
(4
649)
(5
118)
65
705
145
158
D
ivid
en
ds
rec
eiv
ed
(
70 9
70)
(15
5 62
0)–
– –
– –
– (
70 9
70)
(15
5 62
0)Sa
le o
f po
rtio
n o
f jo
intly
c
on
tro
lled
en
tity
– (
408
396)
– (
17 2
47)
– –
– –
– (
425
643)
Re
vers
al o
f im
pa
irme
nt
– –
– 2
1 36
2 –
– –
– –
21
362
Re
co
gn
itio
n o
f pre
vio
usly
u
nre
co
gn
ised
loss
es
– –
– (
9 13
5)–
– –
– –
(9
135)
Imp
airm
en
t o
f in
vest
me
nt
– –
– –
– –
(8
271)
– (
8 27
1)–
Tra
nsf
err
ed
to
inve
stm
en
t
in a
sso
cia
te
– –
– (
26 0
45)
– (
293
201)
– –
– (
319
246)
IFR
S 2
rese
rve
–
– –
– –
– –
(76
)–
(76
)C
arr
ying
am
oun
t of t
he
inve
stm
ent
– e
nd o
f the
ye
ar
616
099
6
16 7
15
– –
– –
– 1
2 92
0 6
16 0
99
629
635

GRAND PARADE INVESTMENTS LIMITED ANNUAL FINANCIAL STATEMENTS 2017
CONSOLIDATED ANNUAL FINANCIAL STATEMENTS 39
10. INVESTMENT IN JOINTLY CONTROLLED ENTITIES CONTINUED
Set out below is the summarised financial information, as well as a reconciliation of that information to the carrying amount of the Group’s jointly controlled entities which are accounted for using the equity method.
SunWest
Grand Tellumat
Manufacturing
2017
R’000s 2016
R’000s
2017
R’000s 2016
R’000s
10.2 Investment in jointly controlled entities’ financial resultsSummarised statement of comprehensive income Revenue 2 495 893 2 488 044 87 096 127 973 Operating costs (1 583 628) (1 546 249) (103 500) (130 171)Finance income 1 095 809 22 381 Finance cost (93 847) (93 748) (1 586) (2 170)Depreciation and amortisation (162 166) (145 595) (6 830) (6 049)Profit/(loss) before tax 657 347 703 261 (24 798) (10 036)Taxation (191 427) (205 333) – –Profit/(loss) for the year 465 920 497 928 (24 798) (10 036)Other comprehensive income – – – – Total comprehensive income/(loss) for the year 465 920 497 928 (24 798) (10 036)
Summarised statement of financial position Non-current assets 1 305 278 1 331 796 15 529 21 525 Current assets excluding cash and cash equivalents 49 368 62 187 54 593 42 904 Cash and cash equivalents included in current assets 92 297 43 241 3 713 1 296 Non-current liabilities (excluding trade and other payables and provisions) (335 374) (339 704) – – Current liabilities (excluding trade and other payables and provisions) (735 991) (709 104) (88 187) (69 073)Current trade and other payables and provisions (192 428) (201 185) (28 625) (14 831)Equity 183 150 187 231 (42 977) (18 179)
SunWest
Grand Tellumat
Manufacturing Total
2017
R’000s 2016
R’000s
2017
R’000s 2016
R’000s
2017
R’000s 2016
R’000s
10.3
Reconciliation between investment in jointly controlled entities’ equity and carrying valueJointly controlled entities’ total equity 183 150 187 231 (42 977) (18 179) 140 173 169 052 Group’s proportionate interest (%) 15.1 15.1 51.0 51.0 1 1 Groups’ proportionate share of equity 27 656 28 272 (21 918) (9 271) 5 738 19 001 Goodwill 588 443 588 443 – – 588 443 588 443 Proportionate share of IFRS 2 reserve – – (76) (76) (76) (76)Loans – – 22 267 22 267 22 267 22 267 Loss not recognised – – 7 998 – 7 998 – Impairment of investment – – (8 271) – (8 271) – Carrying amount of the investment 616 099 616 715 – 12 920 616 099 629 635

40 CONSOLIDATED ANNUAL FINANCIAL STATEMENTS
11. INVESTMENTS IN ASSOCIATES The Group’s investments that have been classified as associates are:
Effective holding
Investment
2017
%
2016
% Description of business
Sun Slots 30.00 30.00 Sun Slots operates limited payout
machines throughout the country under
different brandsWorcester Casino 15.10 15.10 Worcester Casino holds 100% of the
Golden Valley Casino situated in
Worcester
There has been no change in these investments during the current year.
Sun Slots Worcester Casino Total
2017
R’000s 2016
R’000s
2017
R’000s 2016
R’000s
2017
R’000s 2016
R’000s
11.1 Reconciliation of carrying value of investment in associateCarrying amount of the investment – beginning of the year 301 723 – 26 045 – 327 768 – Transferred from jointly controlled entities – 293 201 – 26 045 – 319 246 Profit from associates 27 860 8 117 2 529 – 30 389 8 117 IFRS 2 reserve – 405 – – – 405 Carrying amount of the investment – end of the year 329 583 301 723 28 574 26 045 358 157 327 768
11.2 Investment in associates’ financial resultsSet out below is the summarised financial information, as well as a reconciliation of that information to the carrying amount of the Group’s associates which are accounted for using the equity method.
Sun Slots Worcester Casino
2017
R’000s
2016
R’000s
2017
R’000s
2016
R’000s
Summarised statement of comprehensive income Revenue 1 019 561 934 667 252 333 165 130 Operational costs (779 966) (717 445) (203 021) (135 140)Finance income 9 706 3 895 784 137 Finance cost (20 184) (25 923) (4 903) (4 710)Depreciation and amortisation (89 021) (74 792) (23 758) (18 037)Profit before tax 140 096 120 402 21 435 7 380 Taxation (47 228) (12 175) (4 689) (3 615)Profit for the year 92 868 108 227 16 746 3 765
Summarised statement of financial position Non-current assets 598 908 556 709 178 310 174 960 Current assets excluding cash and cash equivalents 53 093 49 733 4 450 2 814 Cash and cash equivalents included in current assets 82 049 98 084 14 712 3 355 Non-current liabilities (excluding trade and other payables and provisions) (26 413) (31 783) (8 830) (7 359)Current liabilities (excluding trade and other payables and provisions) (134 268) (220 815) (5 719) (6 664)Current trade and other payables and provisions (116 545) (87 971) (20 269) (21 199)Equity 456 824 363 957 162 654 145 907
NOTES TO THE CONSOLIDATED ANNUAL FINANCIAL STATEMENTS (continued)for the year ended 30 June 2017

GRAND PARADE INVESTMENTS LIMITED ANNUAL FINANCIAL STATEMENTS 2017
CONSOLIDATED ANNUAL FINANCIAL STATEMENTS 41
11. INVESTMENTS IN ASSOCIATES CONTINUED
11.3 Reconciliation between investment in associates’ equity and carrying value
Sun Slots Worcester Casino Total
2017
R’000s 2016
R’000s
2017
R’000s 2016
R’000s
2017
R’000s 2016
R’000s
Investment in associates’ equity 456 824 363 957 162 654 145 907 619 478 509 864 Group’s proportionate interest 30.00% 30.00% 15.10% 15.10% – – Groups’ proportionate share of equity 137 047 109 187 24 561 22 032 161 608 131 219 Goodwill 191 012 191 012 4 013 4 013 195 025 195 025 Proportionate share of IFRS 2 reserve 1 524 1 524 – – 1 524 1 524 Carrying amount of the investment 329 583 301 723 28 574 26 045 358 157 327 768
12. AVAILABLE-FOR-SALE INVESTMENT
Effective holding
Investment
2017
%2016
% Description of business
Spur 17.48 10.00 Spur Corporation operates a franchise
restaurant business with six brands in South
Africa and internationallyAtlas Gaming 4.95 4.95 Atlas Gaming is a gaming software and
machine development company based
in Melbourne, Australia
Spur Atlas Gaming Total
2017
R’000s
2016
R’000s
2017
R’000s
2016
R’000s
2017
R’000s
2016
R’000s
Opening balance 305 036 350 064 2 319 – 307 355 350 064 Acquisitions 266 555 – – 5 787 266 555 5 787 Impairment – – – (3 468) – (3 468)Unrealised fair value (loss)/gain on available-for-sale investments (Note 24.1) (56 943) (45 028) 3 468 – (53 475) (45 028)
514 648 305 036 5 787 2 319 520 435 307 355
13. SUBSIDIARIES WITH MATERIAL NON-CONTROLLING INTERESTThe financial information of subsidiaries that have material non-controlling interests is provided below:
2017
R’000s
2016
R’000s
13.1 Non-controlling interestAccumulated balances of non-controlling interestsBurger King South Africa (Pty) Ltd – Group (29 754) (21 439)Other non-controlling interests – (6 599)
(29 754) (28 038)
Loss allocated to non-controlling interestBurger King South Africa (Pty) Ltd – Group (8 328) (8 564)Other non-controlling interests – (1 726)
(8 328) (10 290)
During the year, the Group disposed of its investment in Grand Linkstate (Note 4).

42 CONSOLIDATED ANNUAL FINANCIAL STATEMENTS
13. SUBSIDIARIES WITH MATERIAL NON-CONTROLLING INTEREST CONTINUED
13.2 Summarised financial information of subsidiaries with material non-controlling interestBurger King South Africa (Pty) LtdThe Group holds a 91.1% investment in Burger King South Africa (Pty) Ltd with the remaining 8.9% held by Burger King Europe. Burger King South Africa (Pty) Ltd holds the master franchise licence of Burger King for South Africa.
% %
Portion of equity interest held by non-controlling interestsBurger King South Africa (Pty) Ltd 8.90 8.90
The summarised financial information of the Burger King South Africa– Group is provided below. This information is based on amounts before inter-company eliminations.
2017
R’000s2016
R’000s
Summarised statement of comprehensive incomeRevenue 628 897 485 162 Operating costs and cost of sales (691 442) (568 014)Operating loss (62 545) (82 852)Finance income 1 197 1 029 Finance expense– intercompany (46 410) (20 405)Finance expense– third party (3 070) (416)Loss before tax (110 828) (102 644)Tax 29 864 26 794 Loss after tax (80 964) (75 850)Total loss attributable to – Ordinary shareholder (72 636) (67 286)– Non-controlling interests (8 328) (8 564)
Summarised statement of financial positionNon-current assets 477 168 477 554 Current assets 67 488 94 644 Non-current liabilities (557 645) (493 821)Current liabilities (100 175) (110 968)Equity (113 164) (32 591)
Total equity attributable to: – Ordinary shareholder (83 410) (11 152)– Non-controlling interest (29 754) (21 439)
Summarised cash flow information Operating (3 225) (47 006)Investing (42 700) (194 830)Financing 21 295 220 281 Net decrease in cash and cash equivalents (24 630) (21 555)
NOTES TO THE CONSOLIDATED ANNUAL FINANCIAL STATEMENTS (continued)for the year ended 30 June 2017

GRAND PARADE INVESTMENTS LIMITED ANNUAL FINANCIAL STATEMENTS 2017
CONSOLIDATED ANNUAL FINANCIAL STATEMENTS 43
14. INVESTMENT PROPERTY The Group’s investment properties consist of a vacant plot in Goodwood.
2017
Office
buildings
R’000s
Industrial
buildings
R’000s
Total
R’000s
Cost 40 160 29 638 69 798 Accumulated depreciation – – – Carrying value at 1 July 2016 40 160 29 638 69 798
Additions 15 – 15 Sale of property (22 817) (22 817)Transferred to assets held-for-sale (40 175) – (40 175)Carrying value at 30 June 2017 – 6 821 6 821
Made up of: Cost – 6 821 6 821 Accumulated depreciation – – –
2016Cost 61 193 22 817 84 010 Accumulated depreciation – – – Carrying value at 1 July 2015 61 193 22 817 84 010
Additions 306 6 821 7 127 Transfers from property, plant and equipment (21 339) – (21 339)Carrying value at 30 June 2016 40 160 29 638 69 798
Made up of: Cost 40 160 29 638 69 798 Accumulated depreciation – – –
Management have assessed the residual values and are satisfied that the residual values exceed the carrying values of these properties.
Fair value of investment properties carried at costThe fair values of the investment properties carried at cost are as follows:
2017 2016
Property Class Location
Fair
value
R’000s
Carrying
value
R’000s
Fair
value
R’000s
Carrying
value
R’000s
Erf 117, Roggebaai Office building Cape Town – – 51 500 40 160 Portion 128 and 206 of the farm 1183, City of Cape Town Industrial building Atlantis – – 35 000 22 817 Erf 33997, Goodwood Industrial building Goodwood 6 821 6 821 6 821 6 821
6 821 6 821 93 321 69 798
The fair value is based on recent market valuations performed.

44 CONSOLIDATED ANNUAL FINANCIAL STATEMENTS
GRAND PARADE INVESTMENTS LIMITED ANNUAL FINANCIAL STATEMENTS 2017
CONSOLIDATED ANNUAL FINANCIAL STATEMENTS 45
15. PROPERTY, PLANT AND EQUIPMENT
Computer
equipment
R’000s
Furniture
and fittings
R’000s
Leasehold
improvements
R’000s
Motor
vehicles
R’000s
Plant and
equipment
R’000s
Premises soft
furnishings
R’000s
Projects under
development
R’000s
Land and
buildings
R’000s
Plant and
equipment:
Food group
R’000s
Total
R’000s
Cost 25 417 27 747 9 551 10 074 82 152 169 786 476 198 823 194 658 718 684 Accumulated depreciation (11 011) (7 391) (862) (3 532) (17 468) (21 335) – (3 323) (27 717) (92 639)Carrying value at 1 July 2016 14 406 20 356 8 689 6 542 64 684 148 451 476 195 500 166 941 626 045
Additions 2 979 3 295 23 1 800 459 37 616 4 562 7 799 30 207 88 740 Disposals (67) (54) – (308) (53) (33) – (52 969) (4 444) (57 928)Depreciation (7 433) (6 089) (25) (1 654) (7 840) (18 964) – (1 037) (23 041) (66 083)Impairment* – – – – – (10 124) – (2 565) (1 685) (14 374)Sale of subsidiary (611) – – – – – – – – (611)Carrying value at 30 June 2017 9 274 17 508 8 687 6 380 57 250 156 946 5 038 146 728 167 978 575 789
Made up of: Cost 24 674 30 967 9 574 11 026 82 518 207 387 5 038 154 050 220 959 746 193 Accumulated depreciation (15 400) (13 459) (887) (4 646) (25 268) (50 441) – (7 322) (52 981) (170 404)
Cost 12 375 18 565 2 156 7 502 32 323 110 414 25 174 383 113 415 471 158 Accumulated depreciation (5 152) (3 601) (594) (2 905) (6 414) (7 814) – (2 296) (10 804) (39 580)Carrying value at 1 July 2015 7 223 14 964 1 562 4 597 25 909 102 600 25 172 087 102 611 431 578
Additions 11 879 9 573 7 395 4 103 8 766 59 355 476 23 027 81 529 206 103 Disposals (182) (589) (6) (919) (172) (99) (25) – (144) (2 136)Depreciation (6 753) (4 053) (262) (1 239) (2 152) (13 405) – (1 027) (16 985) (45 876)Business combination 467 461 – – 33 676 – – – – 34 604 Transfers 1 772 – – – (1 343) – – 1 413 (70) 1 772 Carrying value at 30 June 2016 14 406 20 356 8 689 6 542 64 684 148 451 476 195 500 166 941 626 045
Made up of: Cost 25 417 27 747 9 551 10 074 82 152 169 786 476 198 823 194 658 718 684 Accumulated depreciation (11 011) (7 391) (862) (3 532) (17 468) (21 335) – (3 323) (27 717) (92 639)
Land and buildings include land, buildings, generators, air conditioners, lifts and security systems.
* The Group closed certain under performing Burger King restaurants during the year and performed an assessment as to the recoverability of the related assets. All assets deemed to be unrecoverable were scrapped and impaired to nil. The impairment relating to land and buildings pertains to a property of the Group whose fair value assessment was lower than carrying value and the property was subsequently impaired.
NOTES TO THE CONSOLIDATED ANNUAL FINANCIAL STATEMENTS (continued)for the year ended 30 June 2017

46 CONSOLIDATED ANNUAL FINANCIAL STATEMENTS
Franchise
licences
R’000s
Master
franchise
licence
R’000s
Computer
software
R’000s
Total
R’000s
16. INTANGIBLE ASSETSCost 15 354 18 101 12 135 45 590 Accumulated amortisation (1 872) (430) (2 689) (4 991)Carrying value at 1 July 2016 13 482 17 671 9 446 40 599
Additions 2 642 – 6 052 8 694 Disposal – – (72) (72)Amortisation (1 702) (949) (2 255) (4 906)Impairment – – (504) (504)Transfer – – 647 647 Sale of subsidiary – – (379) (379)Carrying value at 30 June 2017 14 422 16 722 12 935 44 079
Made up of: Cost 17 995 18 101 16 835 52 931 Accumulated amortisation (3 573) (1 379) (3 900) (8 852)
Cost 8 759 2 572 7 194 18 525 Accumulated amortisation (748) (290) (3 528) (4 566)Carrying value at 1 July 2015 8 011 2 282 3 666 13 959
Additions 6 595 15 529 8 145 30 269 Disposals – – (654) (654)Amortisation (1 124) (140) (1 711) (2 975)Carrying value at 30 June 2016 13 482 17 671 9 446 40 599
Made up of: Cost 15 354 18 101 12 135 45 590 Accumulated amortisation (1 872) (430) (2 689) (4 991)
At 30 June 2017, the Group intangible assets are made up of franchise licences, a master franchise licence and computer software and no internally generated or indefinite useful life intangibles have been recognised.
Franchise licencesIn terms of the Burger King Master Franchise Development Agreement, the Group is required to pay a franchise licence fee to Burger King Europe of USD20 000 per store that is opened in South Africa. The licence fees are amortised over the periods of the respective stores’ lease which range between five and 10 years. In terms of the Dunkin Brands Master Franchise Development Agreement, the Group is required to pay a franchise licence fee to Dunkin Brands International of USD15 000 per store that is opened in South Africa. The licence fees are amortised over the periods of the respective stores’ lease which range between five and 10 years.
Master franchise licenceThe master licence fee of R2.5 million paid to Burger King Europe is for the rights to the Master Franchise for South Africa and is being amortised over 20 years, which commenced on 1 April 2013. The addition in the prior year is cost incurred to acquire a Master Franchise Development agreement for the right to trade under the brand names of Dunkin Donuts® and Baskin-Robbins® in South Africa and is being amortised over 20 years. There were no further movements during the current year.
Computer softwareComputer software has a useful life of three years and is amortised using the straight-line method. Certain computer software programs that were initiated in the prior year were no longer deemed necessary. No further development was commissioned and the software is not ready for use. This has been impaired during the year.
NOTES TO THE CONSOLIDATED ANNUAL FINANCIAL STATEMENTS (continued)for the year ended 30 June 2017

GRAND PARADE INVESTMENTS LIMITED ANNUAL FINANCIAL STATEMENTS 2017
CONSOLIDATED ANNUAL FINANCIAL STATEMENTS 47
Grand Food
Meat Plant
R’000s
Mac Brothers
R’000s
Grand
Linkstate
R’000s
Total
R’000s
17. GOODWILL17.1. Reconciliation of goodwill
Cost 53 910 38 598 377 92 885 Accumulated impairment – – – –Carrying value at 1 July 2016 53 910 38 598 377 92 885
Disposal of investment – – (377) (377)Carrying value at 30 June 2017 53 910 38 598 – 92 508
Made up of: Cost 53 910 38 598 – 92 508 Accumulated impairment – – – –
Cost – 38 598 377 38 975 Accumulated impairment – – – –Carrying value at 1 July 2015 – 38 598 377 38 975
Additions 53 910 – – 53 910 Carrying value at 30 June 2016 53 910 38 598 377 92 885
Made up of: –Cost 53 910 38 598 377 92 885 Accumulated impairment – – – –
17.2. Goodwill impairment testing An annual impairment test is performed to assess whether goodwill has been impaired. Goodwill has been allocated for impairment testing purposes to individual cash-generating units (CGUs). The recoverable amount of every CGU has been determined based on a value-in-use calculation using five-year cash flow projections approved by the senior management of each CGU.
Mac Brothers and Grand Food Meat PlantThe annual impairment test was performed on the CGUs and it was determined that the recoverable amounts were higher than the carrying amounts and therefore no impairment loss has been recognised. The calculation of the value-in-use is most sensitive to the following assumptions:
2017
%
2016
%
– Average revenue growth rates 19.80 23.40– Discount rates 19.2 – 20.8 19.5 – 22.1– Terminal growth rates 5.50 4 – 5.85
Revenue growth rates – The revenue growth rates used in the cash flow projections have been based on the growth rates of the preceding two years. The growth rates have also been adjusted to take into account the impact of annual inflation.
Discount rates – Discount rates represent the current market assessment of the risks specific to the CGU, regarding the time value of money and individual risks of the underlying assets which have not been incorporated in the cash flow projections. The discount rate calculation is based on specific circumstances of the Group and its CGU’s and is derived from its WACC. The WACC takes into account both debt and equity. The cost of equity is derived from the expected return on investment by the Group’s shareholders. The cost of debt is based on the interest-bearing borrowings the Group is obliged to service. Specific risks associated with the CGU is incorporated by applying individual beta factors. The beta factors are evaluated annually based on publicly available market data.
Terminal growth rates – The terminal growth rates have been based on the growth rates of revenues and expenses for the preceding two years. These rates have been adjusted to take into account the impact of inflation.
Management believes that any reasonable possible change in the key assumptions on which the CGU’s recoverable amount is based would not cause its carrying amount to exceed its recoverable amount.

48 CONSOLIDATED ANNUAL FINANCIAL STATEMENTS
2017
R’000s
2016
R’000s
18. INVENTORYWork in progress 1 558 5 043 Spare parts 11 050 2 366 Consumables 7 203 7 239 Stock of food and packaging 21 178 13 590 Gaming machines 3 971 4 499 Catering equipment 43 803 58 494
88 763 91 231
At year end all items of inventory are carried at cost and no items have been written down to their net realisable value. During the current year stock to the value of R0.5 million was written off as obsolete (2016: Rnil).
SunWest
R’000s
Worcester
R’000s
Total
R’000s
19. DEFERRED PROCEEDS2017Opening balance 502 972 25 473 528 445 Interest accrued 16 221 822 17 043 Instalments received (521 108) (26 392) (547 500)Gain on acceleration of proceeds 1 915 97 2 012 Closing balance – – –
2016Net proceeds 642 462 32 538 675 000 Imputed interest (32 413) (1 642) (34 055)Consideration 610 049 30 896 640 945 Instalments received at 30 June 2016 (107 077) (5 423) (112 500)Closing balance 502 972 25 473 528 445
In terms of the agreement entered into with Tsogo Sun, the proceeds were to be received in 18 equal instalments of R37.5 million. In November 2016 this was renegotiated and the full outstanding balance was settled in full.
2017
R’000s
2016
R’000s
20. TRADE AND OTHER RECEIVABLES 20.1. Reconciliation of trade and other receivables
Trade receivables 32 128 46 309 Less: Provision for doubtful debts (2 374) (2 104)
29 754 44 205 Other receivables 3 993 20 278 Prepayments 30 388 37 187 VAT receivable – 5 124
64 135 106 794
The fair value of trade and other receivables approximates their carrying value.
Group receivables are considered overdue 30 days from the invoice date. Refer to Note 32 for the maturity analysis of financial assets.
NOTES TO THE CONSOLIDATED ANNUAL FINANCIAL STATEMENTS (continued)for the year ended 30 June 2017

GRAND PARADE INVESTMENTS LIMITED ANNUAL FINANCIAL STATEMENTS 2017
CONSOLIDATED ANNUAL FINANCIAL STATEMENTS 49
2017
R’000s
2016
R’000s
20. TRADE AND OTHER RECEIVABLES CONTINUED
20.2 Past due and impaired accounts receivableThe individually impaired receivables mainly relate to customers that are long overdue.
0 to 30 days – 30 to 60 days – – 60 to 120 days – 314 Over 120 days 2 374 1 790
2 374 2 104
Opening balance 2 104 1 392 Charge to profit or loss 332 868 Impairment utilised (62) (156)Closing balance 2 374 2 104
21. RELATED-PARTY LOANSGPI and its subsidiary companies, in the ordinary course of business, entered into various service and investment transactions.21.1 Related-party loans receivable(1)
– Directors(2) 26 492 20 323
Interest-bearing loans – Grand Tellumat(3) 15 000 12 838 – Atlas Gaming(4) 3 282 3 291
Total current assets 44 774 36 452
(1) None of the above related-party loans are past due.(2) Employee loans are secured by GPI shares purchased by employees under the rules of the Employee Share Scheme.
During the year the Group issued loans with a value of R7.2 million (2016: R8.8 million) to Directors to fund their acquisition of GPI Shares under the GPI Employee Share Scheme. During the year loans with a value of R1.1 million were repaid by Directors (2016: Rnil). The market value of the shares held as security at 30 June 2017 amounted to R21.9 million (2016: R20.9 million). These above loans are interest free.
(3) The loan to GTM was interest free during the year. The loan was impaired by R4.7 million to its recoverable amount of R15.0 million.
(4) The loan is denominated in Australian dollars. This loan accrues interest at 10% per annum.
2017
R’000s
2016
R’000s
22. CASH AND CASH EQUIVALENTS22.1 Cash and cash equivalents 22 911 65 594
22 911 65 594 22.2 Bank overdraft (25 474) (7 919)
Total cash and cash equivalents (2 563) 57 675
Cash and cash equivalents include Money Market call accounts with floating interest rates that fluctuated between 8.00% and 6.50% during the year (2016: between 5.85% and 6.50%). At year end the Group had overdraft facilities of R65.0 million (2016: R65.0 million). This is made up of a R50.0 million overdraft facility in Burger King with Nedbank Limited attracting interest at prime less 0.75% and with a monthly commitment fee of 0.5% and a R15.0 million facility held by GPI with Standard Bank Limited attracting interest at prime and with a monthly commitment fee of 0.65%. Furthermore there is a R8 million overnight facility in Mac Brothers attracting interest at prime less half a percentage point.

50 CONSOLIDATED ANNUAL FINANCIAL STATEMENTS
2017
R’000s
2016
R’000s
23. STATED CAPITAL 23.1. Ordinary share capital
Authorised share capital 2 000 000 000 ordinary shares of no par value – –
Opening balance – 1 July 859 517 859 517 Shares cancelled (52 810) – Closing balance (issued and fully paid) – 30 June 806 707 859 517
000s 000s
Reconciliation of number of shares in issueOpening balance – 1 July 488 806 488 806 Shares cancelled (15 017) – Closing balance – 30 June 473 789 488 806
During the year, the Group brought back and cancelled 15.02 million shares at an average price of R3.51.
2017
R’000s
2016
R’000s
23.2. Treasury sharesOpening balance – 1 July (105 971) (76 222)Treasury shares allocated to employees 9 002 10 581 Shares acquired (69 317) (40 330)Closing balance – 30 June (166 286) (105 971)
000s 000s
Reconciliation of number of treasury sharesOpening balance – 1 July (27 074) (18 730)Shares allocated to employees 2 000 2 930 Shares acquired (18 726) (11 274)Closing balance – 30 June (43 800) (27 074)
At 30 June 2017, the Grand Parade Share Incentive Trust holds 4.98 million GPI shares (2016: 6.99 million GPI Shares) in treasury for the purpose of hedging GPI’s Employee Share Scheme. During the year the Grand Parade Share Incentive Trust repurchased no GPI shares (2016: 6 million GPI Shares) and allocated 2.00 million GPI shares (2016: 2.93 million GPI shares) to employees under the GPI Employee Share Scheme. At 30 June 2017, the GPI Women’s BBBEE Empowerment Trust holds 14.82 million GPI shares (2016: 14.82 million GPI shares) in treasury to maintain the Company’s minimum black female ownership. The trust did not repurchase any GPI shares during the year. At 30 June 2017, GPI Management Services holds 24 million GPI shares (2016: 5.27 million GPI shares) in treasury, 18.73 million shares were repurchased during the year.
Therefore in total the Group bought back 18.73 million GPI shares to be held in treasury for R69.3 million (2016: 11.27 million shares for R40.3 million). The shares were acquired at an average price of 370 cents per share (2016: 357 cents per share).
NOTES TO THE CONSOLIDATED ANNUAL FINANCIAL STATEMENTS (continued)for the year ended 30 June 2017

GRAND PARADE INVESTMENTS LIMITED ANNUAL FINANCIAL STATEMENTS 2017
CONSOLIDATED ANNUAL FINANCIAL STATEMENTS 51
24. RESERVES 24.1. Available-for-sale reserve at fair value
The movements in the unrealised gains relating to the Group’s available-for-sale investments are as follows:
Atlas Gaming Spur Total
2017
R’000s
2016
R’000s
2017
R’000s
2016
R’000s
2017
R’000s
2016
R’000s
Opening balance – – 8 055 45 064 8 055 45 064 Movement during the year: 3 468 – (54 567) (37 009) (51 099) (37 009)Unrealised fair value (losses)/gains on available-for-sale investments (note 12) 3 468 – (56 943) (45 028) (53 475) (45 028)Deferred tax – – 2 376 8 019 2 376 8 019
Closing balance 3 468 – (46 512) 8 055 (43 044) 8 055
24.2. IFRS 2 share-based payment reserveThe IFRS 2 share-based payment reserve has been recognised in line with the Group share-based payment accounting policy detailed in Note 1.21 of the Consolidated Annual Financial Statements.
The Group established a share option incentive scheme in which options to acquire GPI shares have been granted to key employees of the Group. All options have been granted with an exercise price equal to the 30-day VWAP of the shares on the date of the grant and are conditional on the participant remaining in service with the Group. The maximum aggregate number of shares in terms of the Group Share Options Scheme that may be utilised for the purposes of the scheme shall not exceed 46.9 million. The following are the salient features of the share options granted:
1. Five-year vesting period commencing on the grant date and vests in four equal tranches.
2. The first tranche vests on the second anniversary of the Option Grant Date and annually thereafter for three years in equal tranches.
3. Share options exercised are settled on a net settlement share basis.
4. No dividend rights will be attached to the share options until such time as the shares are registered in the recipients’ name.
5. In the event of death, retirement or retrenchment any exercisable options will only be capable of conversion for a 12-month period.
6. Upon resignation or termination of employment all unexercised options will immediately lapse.
Share options outstanding at the end of the year have the following vesting dates and exercise prices:
Number
’000s
Weighted
exercise
price
R
Total value
R’000s
2017Outstanding at beginning of the year 14 346 4.61 66 181 Granted during the year 2 604 3.52 9 166 Exercised during the year (2 000) 3.61 (7 218)Forfeited during the year (7 433) 4.55 (33 845)Outstanding at end of the year 7 517 4.56 34 284 Exercisable at the end of the year 766 5.63 4 313

GRAND PARADE INVESTMENTS LIMITED ANNUAL FINANCIAL STATEMENTS 2016
52 CONSOLIDATED ANNUAL FINANCIAL STATEMENTS
Exercise
date within
one year
’000s
Exercise
date from
two to five
years
’000s
Exercise
date after
five years
’000s
Total
’000s
24. RESERVES CONTINUED
24.2. IFRS 2 share-based payment reserve (continued)Outstanding optionsOptions with exercise price from R3.61 1 878 1 604 – 3 482 Options with exercise price from R6.33 505 505 – 1 010 Options with exercise price from R7.21 481 481 – 962 Options with exercise price from R5.32 155 465 – 620 Options with exercise price from R3.52 – 1 443 – 1 443
Number
’000s
Weighted
exercise
price
R
Total value
R’000s
2016Outstanding at beginning of the year 20 616 4.40 90 733 Granted during the year 620 5.32 3 300 Exercised during the year (4 163) 3.61 (15 029)Forfeited during the year (2 727) 4.70 (12 823)Outstanding at end of the year 14 346 4.61 66 181 Exercisable at the end of the year 87 4.72 411
Exercise
within one
year
’000s
Exercise
date from
two to five
years
’000s
Exercise
date after
five years
’000s
Total
’000s
Outstanding optionsOptions with exercise price from R3.61 3 127 6 254 – 9 381 Options with exercise price from R4.72 87 261 – 348 Options with exercise price from R6.33 412 1 235 – 1 647 Options with exercise price from R7.21 587 1 763 – 2 350 Options with exercise price from R5.32 155 465 – 620
Information on options granted during the yearDuring the year the Group granted 2.60 million options to a key employee of the Group. These options were granted on 9 September 2016. The tables below provide details of the options granted during the year.
Fair value was determined by the Black-Scholes-Merton model. The following inputs were used for the share options granted 9 September 2016:
9 Sep 18 9 Sep 19 8 Sep 20 -Sep 21
– Weighted fair value per option granted (cents) 70 84 98 108 – Weighted average share price per GPI share (cents) 532.00 532.00 532.00 532.00– Exercise price (cents) 532.00 532.00 532.00 532.00– Expected volatility (%) 30.00 30.35 31.00 32.70– Dividend yield (%) 4.00 4.00 4.00 4.00– Risk-free interest rate (%) 7.42 7.48 7.57 7.66
NOTES TO THE CONSOLIDATED ANNUAL FINANCIAL STATEMENTS (continued)for the year ended 30 June 2017

GRAND PARADE INVESTMENTS LIMITED ANNUAL FINANCIAL STATEMENTS 2017
CONSOLIDATED ANNUAL FINANCIAL STATEMENTS 53
24. RESERVES CONTINUED
24.2. IFRS 2 share-based payment reserve (continued)
Method and the assumptions to incorporate the effects of expected early exerciseThe historic volatility was measured at the standard deviation of price changes over an identified historic period. Expected volatility generally cannot be taken from a single objective source and therefore it is subjective to estimate this model input. The following factors were considered in assessing the volatility.
a) Implied volatility from traded share options on the entities shares;
b) Historical volatility of the GPI share price over the most recent period that is commensurate with the expected term of the option;
c) The length of time the entity’s shares have been publicly traded;
d) The tendency of volatility to revert to its mean; and
e) Appropriate and regular intervals for price observations.
Total expenses of R3.5 million (2016: R1.9 million), relating to equity-settled share based payments transactions were recognised during the year.
24.3. Capital redemption reserve fund The capital redemption reserve fund was recognised when the Group issued preference shares to Standard Bank and Depfin (Note 25.1) and represents the capital portion of the preference shares. The reserve is recognised in equity when the Group redeems the preference shares and in proportion to the number of shares redeemed against the total number of issued shares. The preference shares were redeemed in full during the prior year and as a result the reserve was released from the reserve to retained earnings.
Note
2017
R’000s
2016
R’000s
25. PREFERENCE SHARES Standard Bank/Depfin (SunWest) 25.1 – – Standard Bank (Spur) – Class “A” 25.2 75 918 83 955 Standard Bank (Spur) – Class “B” 25.2 72 652 67 135 Spur (Vendor funding) 25.3 91 831 83 581
240 401 234 671 Balance made up as follows:Short-term portion 2 011 2 111 Long-term portion 238 390 232 560
240 401 234 671 Balance below including interest accrual approximates fair value:Short-term portion – Capital 2 011 2 111 Long-term portion 238 390 232 560 Fair value 240 401 234 671
25.1. Preference shares – Standard Bank/Depfin (SunWest) Authorised203 356 authorised preference shares of R1 per share (2016: 203 356)IssuedNil (2016: 133 193)
Balance at beginning of year – 1 July – 132 880 Amortisation of debt issue cost capitalised – 313 Redemption of preference shares – (133 193)Closing balance – 30 June – –
The preference shares were voluntarily redeemed by the Group, in full, during the prior year. Interest was paid semi-annually on 31 March and 30 September at a rate of 90% of the prime interest rate. The SunWest shares that were sold were held as security against the preference shares and have been unconditionally released as security.

54 CONSOLIDATED ANNUAL FINANCIAL STATEMENTS
25. PREFERENCE SHARES CONTINUED
25.2 Preference shares – Standard Bank (Spur) Authorised90 000 authorised A preference shares of R1 000 per share (2016: 90 000)
60 000 authorised B preference shares of R1 000 per shares (2016: 60 000)
Issued79 000 redeemable A preference shares of R1 000 per share (2016: 90 000)
60 000 redeemable B preference share of R1 000 per share (2016: 60 000)
A preference shares B preference shares
2017
R’000s
2016
R’000s
2017
R’000s
2016
R’000s
Balance at beginning of year – 1 July 83 955 88 611 67 135 62 323 Capitalised raising fee – net of related amortisation 172 189 68 68 Redemption (8 000) (5 000) – – Interest accrued 7 435 8 484 5 449 5 078 Interest paid (7 644) (8 329) – (334)Closing balance – 30 June 75 918 83 955 72 652 67 135
A cumulative redeemable preference sharesThe A cumulative redeemable preference shares are partially amortised with a bullet payment at their maturity date of 31 October 2019 with a rate of 95.0% of the prime interest rate. The rate, however reduced to 90.0% of the prime interest rate, when market capitalisation of the Group’s investment in Spur was greater than 4 times the outstanding balance on the A preference shares. Interest is payable semi-annually on 31 October and 30 April.
The Group is required to maintain the following cash reserves during the first 36 months from the issue date:
• Between 12 and 24 months: R2.0 million less any voluntary redemptions;
• Between 24 and 36 months: R5.0 million less any voluntary redemptions; and
• At 36 months: R9.0 million less any voluntary redemptions.
The shares have the following mandatory redemptions:
• 9 000 shares on 30 October 2017;
• 9 000 shares on 30 October 2018; and
• 72 000 shares on 30 October 2019.
As additional security the Group ceded its shares in Spur and provided a performance guarantee to Standard Bank. The carrying value of GPI’s pledged holding in Spur at 30 June 2017 is R286.5 million (2016: R305.0 million).
B cumulative redeemable preference sharesThe B cumulative redeemable preference shares are redeemable in full on their maturity date of 31 October 2019. The unpaid dividends are capitalised semi-annually on 31 October and 30 April, with mandatory redemptions required to maintain the total balance outstanding below R78.0 million. The shares have a rate of 80.0% of the prime interest rate. The only security provided on the shares is a performance guarantee provided by GPI to Standard Bank.
The fair value of the A and B class preference shares approximate their carrying value as their terms are market related.
NOTES TO THE CONSOLIDATED ANNUAL FINANCIAL STATEMENTS (continued)for the year ended 30 June 2017

GRAND PARADE INVESTMENTS LIMITED ANNUAL FINANCIAL STATEMENTS 2017
CONSOLIDATED ANNUAL FINANCIAL STATEMENTS 55
25. PREFERENCE SHARES CONTINUED
25.3 Preference shares – Spur Authorised72 328 authorised preference shares of R1 000 per share (2016: 72 328)
Issued72 328 redeemable preference shares of R1 000 per share (2016: 72 328)
2017
R’000s
2016
R’000s
Balance at beginning of year – 1 July 83 581 76 397 New issue of cumulative redeemable preference shares – – Interest accrued 8 250 7 184 Closing balance – 30 June 91 831 83 581
The shares are redeemable in full on their maturity date of 31 October 2019 and have a rate of 90.0% of the prime interest rate. The interest is calculated monthly and capitalised semi-annually on 31 October and 30 April. A reversionary cession over the Spur shares ceded to Standard Bank as security for the A preference share has been given to Spur Corporation. No other security has been provided.
The fair value of the preference shares approximate their carrying value as their terms are market related.
2017
R’000s2016
R’000s
26. INTEREST-BEARING BORROWINGSSanlam Capital Markets – Term loan 1 44 746 52 241 Sanlam Capital Markets – Term loan 2 – 49 863 Sanlam Capital Markets – Term loan 3 29 895 29 895 SBSA – Revolving loan facility – 225 000
74 641 356 999 Balance made up as follows:Short-term portion 7 403 254 903 Long-term portion 67 238 102 096
74 641 356 999
26.1 Sanlam Capital Markets – Term loan 1 The SCM term loan 1 bears interest at the three-month JIBAR rate plus 3.15% and interest is paid quarterly on 30 June, 30 September, 31 December and 31 March annually. The interest rate at 30 June 2017 is 10.51% (2016: 10.28%). The loan is repayable in 40 quarterly instalments of R1.9 million each, with the final instalment being due in June 2023. The proceeds from the loan were used to acquire an office building in the Cape Town central business district, which is occupied by Group companies and recognised under property, plant and equipment (Note 15). The carrying value of the office building is R83.7 million (2016: R83.5 million).
The Group has also provided the following security in respect of the loan:
• A cession in security of any lease agreements in respect of the property;
• A cession of all material cash flows payable by any tenant under any lease agreements relating to the property;
• A mortgage bond to the value of R100.0 million registered over the property in favour of SCM;
• A cession of all the Group’s rights under the insurance policy over the property; and
• A cession of GPI Properties’ bank account.
The loan has the following financial covenant:
• Group must maintain a debt to tangible net worth ratio of no greater than 40.0%. The ratio was 18% at 30 June 2017 (2016: 26%).
• The GPI Group must maintain an interest cover ratio of greater than four times. The interest cover ratio is calculated as EBITDA divided by net interest and was eight times at 30 June 2017. The fair value of the term loan approximates its carrying value as the terms are market related.

56 CONSOLIDATED ANNUAL FINANCIAL STATEMENTS
26. INTEREST-BEARING BORROWINGS CONTINUED
26.2 Sanlam Capital Markets – Term loan 2 The loan bore interest at the three-month JIBAR plus 2.50% which equalled 9.86% (2016: 9.73%) at 30 June 2017. The interest was payable quarterly on 30 June, 30 September, 31 December and 31 March each year. The loan was fully repaid during the year from the proceeds on disposal of the related property.
26.3 Sanlam Capital Markets – Term loan 3On 26 January 2016, the Group entered into a new term facility agreement with SCM for a R30.0 million term loan with a 5 year term (Term loan 3). The loan bears interest at the 3 month JIBAR rate plus 3% which equalled 10.36% at 30 June 2017. The interest is payable quarterly on 30 June, 30 September, 31 December and 31 March each year. There are no capital repayments during the term of the loan, however the total outstanding capital amount is repayable on the maturity date of the loan 31 December 2020.
The proceeds from the new term loan funds were used to fund the acquisition of two properties situated in Goodwood, Erf 33996 and Erf 33997 (Note 14). Properties consist of a vacant land and a meat processing plant tenanted by Group companies and have been recognised in property, plant and equipment. The combined carrying value of the properties at 30 June 2017 is R26.4 million.
The Group has provided the following security in respect of the loan:
• A cession in security of any lease agreements in respect of the two properties;
• A cession of all material cash flows payable by any tenants under any lease agreements relating to the two properties;
• A mortgage bond to the value of R30 million, registered over the two properties in favour of SCM;
• Cession of GPI Properties’ bank account; and
• An unconditional demand guarantee in favour of SCM issued by the Group.
The loan is subject to the following covenants:
• The GPI Group must maintain a debt to tangible net worth ratio of no greater than 40.0%. The ratio was 18% at 30 June 2017.
• The GPI Group must maintain an interest cover ratio of greater than four times. The interest cover ratio is calculated as EBITDA divided by net interest and was eight times at 30 June 2017. The fair value of the term loan approximates its carrying value as the terms of the loan are market related.
26.4 SBSA revolving credit facilityThe facility was fully repaid during the current year.
NOTES TO THE CONSOLIDATED ANNUAL FINANCIAL STATEMENTS (continued)for the year ended 30 June 2017

GRAND PARADE INVESTMENTS LIMITED ANNUAL FINANCIAL STATEMENTS 2017
CONSOLIDATED ANNUAL FINANCIAL STATEMENTS 57
2017
R’000s
2016
R’000s
27. FINANCE LEASE LIABILITY Non-current liabilitiesFinance leases – gross payables 27 127 42 883 Unrecognised future finance expenses (2 104) (4 780)
25 023 38 103 Current liabilities Finance leases – gross payables 17 335 17 380 Unrecognised future finance expenses (3 026) (4 291)
14 309 13 089
39 332 51 192 Gross liabilities from finance leasesNot later than one year 17 335 17 380 Later than one year and not later than five years 27 127 42 883
44 462 60 263 Unrecognised future finance expense on finance leases (5 130) (9 071)
39 332 51 192 The net liability from finance leases made up as followsNot later than one year 14 309 13 089 Later than one year and not later than five years 25 023 38 103
39 332 51 192
The finance leases consist of the following material instalment sale agreements:
• Leases with Nedbank for the acquisition of motor vehicles by Burger King. The lease liability is secured by the underlying leased motor vehicles with a carrying value of R1.6 million (2016: R2.1 million).
• Leases with Nedbank for the acquisition of motor vehicles by Dunkin’ Donuts. The lease liability is secured by the underlying leased motor vehicles with a carrying value of R0.4 million (2016: Rnil).
• A lease with Nedbank for the acquisition of a motor vehicle by Baskin-Robbins. The lease liability is secured by the underlying leased motor vehicle with a carrying value of R0.2 million (2016: Rnil).
• A lease with Standard Bank for the acquisition of a motor vehicle by Grand Parade Investments Management Services. The lease liability is secured by the underlying motor vehicle with a carrying value of R0.1 million (2016: R0.1 million).
• A lease with Absa Bank for the acquisition machinery and of a motor vehicle by Mac Brothers. The lease liability is secured by the underlying machinery and leased motor vehicle with a carrying value of R9.5 million (2016: R3.5 million).
• A lease with Mercantile Bank for the acquisition of machinery by Mac Brothers. The lease liability is secured by the underlying lease machinery and motor vehicles with a carrying value of R10.0 million (2016: R16.5 million) and a performance guarantee provided by GPI in favour of Mercantile Bank.
• A lease with Standard Bank for the acquisition of plant and machinery of Grand Foods Meat Plant (Pty) Ltd. The lease liability is secured by the surety and cession of claims limited to R41.7 million by Burger King South Africa (RF) (Pty) Ltd.

58 CONSOLIDATED ANNUAL FINANCIAL STATEMENTS
2017
Long-service
leave
R’000s
Employee
bonuses
R’000s
Total
R’000s
28. PROVISIONSAt beginning of year 2 444 16 636 19 080 Provision raised during the year 479 24 195 24 674 Sale of subsidiary (131) (607) (738)Amount utilised – (22 391) (22 391)At end of year 2 792 17 833 20 625
At beginning of year 560 11 341 11 901 Provision raised during the year 2 094 19 688 21 782 Amount utilised (210) (14 393) (14 603)At end of year 2 444 16 636 19 080
2017
R’000s
2016
R’000s
Balance made up as follows:Non-current provisions 2 792 2 444 Current provisions 17 833 16 636
20 625 19 080
29. TRADE AND OTHER PAYABLESTrade payables 33 365 59 229 Other payables and accruals 70 512 90 726 Annual leave accrual 4 763 8 627 Audit fee accrual 3 955 3 975 Deferred income 5 199 5 413 Payroll accruals 8 168 6 683 Sundry accruals 20 358 46 480 Operating lease straight-lining liability 16 791 14 310 Other payables 11 278 5 238
103 877 149 955
Trade payables are repaid on average of 30 days from the invoice date. The trade and other payables carrying amount approximates fair value.
NOTES TO THE CONSOLIDATED ANNUAL FINANCIAL STATEMENTS (continued)for the year ended 30 June 2017

GRAND PARADE INVESTMENTS LIMITED ANNUAL FINANCIAL STATEMENTS 2017
CONSOLIDATED ANNUAL FINANCIAL STATEMENTS 59
30. COMMITMENTS AND CONTINGENCIES30.1. Operating lease commitments – Group as lessee
The Group has entered into operating leases on certain properties. The leases have terms of between five to ten years with an option at the election of the lessee to extend for a further five years. All leases include a clause to enable upward revision of the rental charge on an annual basis on average of 8.0%. Rental comprise minimum monthly payments and additional payments based on turnover levels. Turnover rentals, where applicable, averaged 7% for the year.
2017
R’000s
2016
R’000s
The future minimum lease payments under non-cancellable operating leases are as follows:Rentals due within one year 54 385 28 376Due within one to five years 150 005 109 116Due after five years 184 222 118 651
388 612 256 143
30.2. Operating lease commitments – Group as lessor The Group has entered into operating leases on its investment property portfolio consisting of certain office buildings. The leases have average terms of five years with an option at the election of the lessee to extend for a further five years. All leases include a clause to enable upward revision of the rental charge on an annual basis on average of 8.0%.
2017
R’000s
2016
R’000s
The future minimum rentals receivables under non-cancellable operating leases are as follows: Rentals due within one year 2 904 7 527 Due within one to five years 4 714 16 172 Due after five years – –
7 618 23 699

60 CONSOLIDATED ANNUAL FINANCIAL STATEMENTS
GRAND PARADE INVESTMENTS LIMITED ANNUAL FINANCIAL STATEMENTS 2017
CONSOLIDATED ANNUAL FINANCIAL STATEMENTS 61
31. SEGMENT ANALYSISThe chief decision-makers are considered to be the members of the GPI Executive Committee, who review the Group’s internal reporting firstly by industry and secondly by significant business unit. The chief decision-makers do not review the Group’s performance by geographical sector and therefore no such disclosure has been made. The chief decision makers also reassessed the segments and as a results identified the following segments: Food, Gaming, Group costs and non-core. Listed below is a detailed segment analysis:
External revenue Inter-segment revenue(1) Operating costs(2)
Equity-accounted
earnings EBITDA
Net profit/(loss)
after tax Total assets Total liabilities
2017
R’000s
2016
R’000s
2017
R’000s
2016
R’000s
2017
R’000s
2016
R’000s
2017
R’000s
2016
R’000s
2017
R’000s
2016
R’000s
2017
R’000s
2016
R’000s
2017
R’000s
2016
R’000s
2017
R’000s
2016
R’000s
Food 948 853 743 106 27 919 69 361 (463 284) (378 995) – 28 (32 119) 2 709 (86 123) (26 193) 1 297 578 1 063 457 (479 264) (458 493)
Gaming and Leisure – – – – 836 (3 891) 100 743 149 256 101 580 136 866 101 580 83 014 974 256 1 472 928 – –
Group costs 13 506 16 237 247 042 247 731 (51 463) (64 124) – – 46 037 249 073 15 805 150 856 304 205 464 910 (40 557) (377 619)
Non-core 639 13 001 – 9 873 (1 431) (15 778) (4 649) (5 116) (20 064) (13 007) (20 309) (15 158) 15 000 31 001 – (2 519)
962 998 772 344 274 961 326 965 (515 342) (462 788) 96 094 144 168 95 434 375 641 10 953 192 519 2 591 039 3 032 296 (519 821) (838 631)
1 Heerengracht – – – – – – – – – – – – 40 175 – – – 21 Friesland – – – – – – – – – – – – – 21 339 – – Sun Slots – – – – – – – – – – – – – 171 140 – (16 690)Held-for-sale – – – – – – – – – – – – 40 175 192 479 – (16 690)
(1) Transactions between segments are concluded at arm’s length.(2) Certain costs are presented pre-elimination of intergroup charges and therefore net profit are after these eliminations.(3) The income tax expense is based on the net profit before tax and pre elimination of intergroup charges.
NOTES TO THE CONSOLIDATED ANNUAL FINANCIAL STATEMENTS (continued)for the year ended 30 June 2017

62 CONSOLIDATED ANNUAL FINANCIAL STATEMENTS
32. FINANCIAL INSTRUMENTS32.1 Classification of financial instruments
The Group’s and Company’s principal financial liabilities are preference shares, interest-bearing borrowings, trade and other payables and related party loans payable. The main purpose of these instruments is to raise finance for the Group’s operations and investments. The Group’s principal financial assets are available-for-sale investments, trade and other receivables, related party loans and cash. The main risks arising from financial instruments are market risk (comprising interest rate risk and other price risk), liquidity risk and credit risk. The fair values of each class of the financial instrument approximate the carrying amounts.
Note
Loans and
receivables
R’000s
Available-
for-sale
R’000s
Non-financial
assets
R’000s
Total
R’000s
Financial assets 2017Cash and cash equivalents 22 22 911 – – 22 911 Related-party loans 21.1 44 774 – – 44 774 Trade and other receivables 20.1 33 747 – 30 388 64 135 Available-for-sale investment 12 – 520 435 – 520 435 Total 101 432 520 435 30 388 652 255
2016Cash and cash equivalents 22 65 594 – – 65 594 Deferred proceeds 19 528 445 – – 528 445 Related-party loans 21.1 36 452 – – 36 452 Trade and other receivables 20.1 64 483 – 42 311 106 794 Available-for-sale investment 12 – 307 355 – 307 355 Total 694 974 307 355 42 311 1 044 640
The non-financial assets are made up of the year-end prepayments and vat receivables balances.
Note
Financial
liabilities
measured
at amortised
cost
R’000s
Non-financial
liabilities
R’000s
Total
R’000s
Financial liabilities2017Trade and other payables 29 68 956 34 921 103 877 Overdraft 22 25 474 – 25 474 Dividends payable 34.3 9 744 – 9 744 Preference shares 25 240 401 – 240 401 Interest-bearing borrowings 26 74 641 – 74 641 Finance lease liabilities 27 39 332 – 39 332 Total 458 548 34 921 493 469
2016Trade and other payables 29 129 232 20 723 149 955 Dividends payable 34.3 8 826 – 8 826 Preference shares 25 234 671 – 234 671 Interest-bearing borrowings 26 356 999 – 356 999 Finance lease liabilities 27 51 192 – 51 192 Total 780 920 20 723 801 643
The non-financial liabilities are made up of the year-end payroll accruals, operating lease straight-lining and deferred income.
NOTES TO THE CONSOLIDATED ANNUAL FINANCIAL STATEMENTS (continued)for the year ended 30 June 2017

GRAND PARADE INVESTMENTS LIMITED ANNUAL FINANCIAL STATEMENTS 2017
CONSOLIDATED ANNUAL FINANCIAL STATEMENTS 63
32. FINANCIAL INSTRUMENTS CONTINUED
32.2 Fair value of financial instruments The Group uses the following hierarchy for determining and disclosing the fair value of financial instruments by valuation technique:
Level 1: Quoted prices (unadjusted) in active markets for identical assets and liabilities.Level 2: Other techniques for which all inputs which have a significant effect on the recorded fair value
and are observable, either directly or indirectly.Level 3: Techniques which use inputs which have a significant effect on the recorded fair value that are
not based on observable market data.
As at 30 June, the Group held the following instruments measured at fair value:
Level 1
R’000s
Level 2
R’000s
Level 3
R’000s
Total
R’000s
2017Available-for-sale investment – Spur (i) 228 108 – 286 540 514 648 Available-for-sale investment – Atlas Gaming – – 5 787 5 787 Total 228 108 – 292 327 520 435
2016Available-for-sale investment – Spur (i) – – 305 036 305 036 Available-for-sale investment – Atlas Gaming – – 2 319 2 319 Total – – 307 355 307 355
i) Available-for-sale investment – SpurThe carrying value of the investment in Spur at 30 June 2017 of R514.7 million is made up of the original acquisition price of R294.7 million, the acquisition during current year of R266.6 million and fair value adjustments of R56.9 million (2016: R10.3 million) (Note 12). The Group’s initial investment in Spur is subject to a trading restriction linked to the Group’s empowerment credentials. The restriction expires on 29 October 2019, after which the instrument may be traded without restriction. The fair value of the investment has been measured by applying a tradability discount of 3% per year remaining on the restriction against the market price of Spur, as quoted on the JSE. The tradability discount was determined with reference to the agreements which govern the trading restrictions and industry standards applied to empowerment transactions. As the terms of the trading restrictions are unobservable the instrument has been classified under level 3, had the trading restrictions not been in place, the instrument would have been classified under level 1. A change of 1.0% in the discount rate used to determine the fair value at the reporting date would have increased/decreased other comprehensive income after tax by R2.4 million (2016: R2.6 million). There were no additions to level 3 instruments in the current year.
32.3 Financial risk management The Group and Company has exposure to the following risks from its use of financial instruments:
• Market risk;
• Credit risk; and
• Liquidity risk.
This note presents information about the Group’s and Company’s exposure to each of the above risks, the Group’s objectives, policies and processes for measuring these risks, and the Group’s and Company’s management of Capital. Further quantitative disclosures are included throughout these Consolidated and Company Annual Financial Statements. The Group’s and Company’s objective is to effectively manage each of the above risks associated with its financial instruments, in order to limit the Group’s and Company’s exposure as far as possible to any financial loss associated with these risks.
32.3.1 Market riskMarket risk is the risk that the fair value or future cash flows of the financial instrument will fluctuate because of changes in market prices. Market risk comprises three types of risk: currency risk, interest rate risk and other price risk. The Group and Company are not exposed to any significant currency risks.

64 CONSOLIDATED ANNUAL FINANCIAL STATEMENTS
32. FINANCIAL INSTRUMENTS CONTINUED
32.3 Financial risk management (continued)32.3.1 Market risk (continued)
Market risk: Interest rate riskInterest rate risk is the risk that the cash flows of a financial instrument will fluctuate due to changes in market interest rates. The Group’s exposure to the risk of changes in interest rates relates to the Group’s obligation in terms of the preference shares, interest-bearing borrowings, finance leases and bank accounts. The Group manages this risk by factoring in forecast movements in the market interest rates into its cash-flow projections and by ensuring that sufficient available funds are maintained in bank accounts to cover the cash flows affected by the movements in the forecast market interest rate. The Group does not have fixed rate financial instruments. The table below reflects the interest rate sensitivity analysis. The analysis was calculated by increasing or decreasing the Group’s interest rate by 100 basis points assuming all other variables remain constant.
Increase in
basis points
Effect on
pre-tax profit
R’000s
Decrease in
basis points
Effect on
pre-tax profit
R’000s
2017 100 (3 569) (100) 3 569 2016 100 (5 852) (100) 5 852
Market risk: Other price riskThe Group’s listed equity securities are susceptible to market price risk arising from uncertainties about future values of the investment securities. The Group is exposed to other price risk through its investment in Spur.
At the reporting date, the exposure to listed equity securities at fair value was R514.7 million (2016: R305.1 million). A increase or decrease of 10% on the JSE market index would have an impact of approximately R23.3 million (2016: R25.9 million) on other comprehensive income to the Group.
32.3.2 Credit riskCredit risk is the risk of financial loss caused by the inability or unwillingness of a counterparty to a financial instrument to discharge contractual obligations. There is no independent rating procedure for customers as the credit quality for customers is assessed by taking into account their financial position, past experience and other factors are used in evaluating the acceptability of clients.
The Group’s and Company’s maximum exposure to credit risk in terms of cash and cash equivalents, loans and receivables equals the carrying amounts of these instruments are as disclosed below.
Cash and cash equivalents The Group and Company only deposits cash surpluses with major banks of high quality and credit standing. The cash and cash equivalents are deposited with three financial institutions.
Trade receivables, other receivables and related-party loansAt year-end, the Group did not consider there to be any significant concentration of credit risk and all assets that have been identified as impaired, after taking the Groups credit policy into account, have been appropriately provided for. Related party credit risk is managed by each business unit in terms of the Group’s policy. Outstanding receivables are regularly monitored and an impairment analysis is performed at each reporting date based on payment history and the financial position of the counterparty.
Employee loansLoans are issued to key employees to fund the acquisition of GPI Shares allocated to employees under the GPI Employee Share Scheme. The employee loan credit risk is managed by employees ceding GPI Shares to the Group as security for the loan.
NOTES TO THE CONSOLIDATED ANNUAL FINANCIAL STATEMENTS (continued)for the year ended 30 June 2017

GRAND PARADE INVESTMENTS LIMITED ANNUAL FINANCIAL STATEMENTS 2017
CONSOLIDATED ANNUAL FINANCIAL STATEMENTS 65
32. FINANCIAL INSTRUMENTS CONTINUED
32.3 Financial risk management (continued)32.3.2 Credit risk (continued)
The following table presents the maturity analysis of related party loans and trade and other receivables.
Current
R’000s
30 to 60 days
R’000s
60 to 120 days
R’000s
Over 120 days
R’000s
Total
R’000s
2017Related-party loans 44 774 – – – 44 774 Trade and other receivables 19 050 4 156 4 921 5 620 33 747 Total 63 824 4 156 4 921 5 620 78 521
2016Related-party loans 36 452 – – – 36 452 Trade and other receivables 36 203 13 472 3 981 10 827 64 483 Total 72 655 13 472 3 981 10 827 100 935
32.3.3 Liquidity riskLiquidity risk is the risk that the Group will encounter difficulty in raising funds to meet commitments associated with financial liabilities. The Group monitors its risk of a shortage of funds based on future cash flow commitments. The Group’s and Company’s objective is to maintain a balance between continuity of funding and flexibility through the use of bank loans. The Group and Company manages the liquidity risk by considering all future cash flows associated with financial liabilities in the cash flow projections and ensures that adequate funds are held to meet their commitments. In addition the short-term risks are managed by ensuring that adequate banking facilities are in place.
The following table presents the contractual maturity analysis of financial liabilities:
On
demand
R’000s
Less than
3 months
R’000s
3 to 12
months
R’000s
1 to 2
years
R’000s
> 2 years
R’000s
Total
R’000s
2017Trade and other payables – 68 956 – – – 68 956 Preference shares – – – – 240 401 240 401 Interest-bearing borrowings – 1 875 5 625 7 500 59 641 74 641 Finance leases 752 1 985 11 511 14 334 10 750 39 332 Interest on preference shares – – 12 703 12 206 26 987 51 896 Interest on interest-bearing borrowings – 1 806 3 287 4 176 6 616 15 885 Interest on finance leases 197 517 2 312 1 705 399 5 130 Dividends payable 9 744 – – – – 9 744 Total 10 693 75 139 35 438 39 921 344 794 505 985
2016Trade and other payables – 129 232 – – – 129 232 Preference shares – – – – 234 671 234 671 Interest-bearing borrowings – 20 601 211 802 7 403 117 193 356 999 Finance leases 683 1 917 10 489 17 257 20 846 51 192 Interest on preference shares – – 8 279 7 832 68 733 84 844 Interest on interest-bearing borrowings – 7 191 18 314 12 268 29 348 67 121 Interest on finance leases 258 685 3 348 3 544 1 236 9 071 Dividends payable 8 826 – – – – 8 826 Total 9 767 159 626 252 232 48 304 472 027 941 956

66 CONSOLIDATED ANNUAL FINANCIAL STATEMENTS
32. FINANCIAL INSTRUMENTS CONTINUED
32.4 Gains and losses on financial instrumentsThe table below summarises the gains and losses on financial instruments:
Fair value
movement
R’000s
Interest
income
R’000s
Interest
expense
R’000s
Total
R’000s
2017Loans and receivables – 31 583 – 31 583 Available-for-sale investments (56 943) – – (56 943)Financial liabilities at amortised cost – – (50 093) (50 093)Total (56 943) 31 583 (50 093) (75 453)
2016Loans and receivables – 23 660 – 23 660 Available-for-sale investments (45 028) – – (45 028)Financial liabilities at amortised cost – – (72 537) (72 537)Total (45 028) 23 660 (72 537) (93 905)
32.5 Capital managementThe primary objective of the Group’s capital management is to ensure that it maintains healthy capital ratios in order to support its business and maximise shareholders’ value.
The Group carefully manages its capital structure and makes adjustments to it, in light of changes in economic conditions and the Group investment strategy. To maintain or adjust the capital structure, the Group may adjust the dividend payment to shareholders, return capital to shareholders, repurchase shares or issue new shares. The primary source of capital is issued ordinary share capital and preference share capital. Acquisitions may be geared to those levels which investments may support and the funders will allow. The entity is subject to an externally imposed maximum debt to equity ratio of 40% and this is monitored by management on an ongoing basis. Refer to note 26.1 and 26.2. The Group has complied with all external capital requirements imposed.
2017
R’000s
2016
R’000s
33. DIVIDENDS DECLARED AND PAIDFinal dividend declared and paid in respect of 2016 financial year of 25 cents (2016: 15 cents per share in respect of the 2015 financial year) 113 070 71 455
No final ordinary dividend was declared in respect of the 2017 financial year.
NOTES TO THE CONSOLIDATED ANNUAL FINANCIAL STATEMENTS (continued)for the year ended 30 June 2017

GRAND PARADE INVESTMENTS LIMITED ANNUAL FINANCIAL STATEMENTS 2017
CONSOLIDATED ANNUAL FINANCIAL STATEMENTS 67
2017
R’000s
2016
R’000s
34. NOTES TO THE CASH FLOW STATEMENT34.1 Cash generated from operations
Profit before taxation 5 935 277 913 Adjustments for:– Depreciation 66 083 45 876 – Amortisation 4 906 2 975 – Finance income (31 583) (23 660)– Finance costs 50 093 72 537 – Dividends received (16 859) (15 235)– (Profit)/loss on disposal of property, plant and equipment (15 998) 412 – Loss on disposal of intangibles – 654 – Share-based payments expense 3 452 1 915 – Remeasurement of investment – (18 687)– Reversal of impairment of investment – (21 362)– Profit on sale of investments (91 929) (270 565)– Impairment of investments 8 271 3 468 – Foreign currency losses 526 2 332 – Impairment of loans 4 701 – – Impairment of plant and equipment 18 549 – – Profit from equity-accounted investments (96 094) (144 168)Operating cash flows before working capital changes (89 947) (85 595)Decrease/(increase) in inventory 2 468 (8 104)Decrease/(increase) in trade and other receivables 38 811 (36 272)(Decrease)/increase in trade and other payables (47 119) 43 274 Net cash utilised by operations (95 787) (86 697)
34.2 Taxation paidTaxation – beginning of the year (10 710) (8 146)Amount per statement of comprehensive income (Note 8)– Current year 67 705 146 863 – Prior year overprovision (4 676) (4 282)Taxation – closing balance 8 182 10 710 Taxation paid during the year 60 501 145 145 The closing tax balances comprise the following: – Income tax receivable 9 440 14 454 – Income tax liabilities (1 258) (3 744)
8 182 10 710
34.3 Dividends paidOpening balance 8 826 8 276 Dividends declared 113 070 71 455 Closing balance (9 744) (8 826)
112 152 70 905

68 CONSOLIDATED ANNUAL FINANCIAL STATEMENTS
2017
R’000s
2016
R’000s
34. NOTES TO THE CASH FLOW STATEMENT CONTINUED
34.4 Loans receivedSBSA – Revolving loan facility – 370 000 Sanlam Capital Markets – Term loan 3 – 30 000
– 400 000
34.5 Repayment of loansPreference shares (8 000) (138 193)Investec – Credit facility 2 – (177 000)SBSA – Revolving loan facility (225 000) (270 000)Sanlam Capital Markets – Term loan 1 (7 500) (7 500)Sanlam Capital Markets – Term loan 2 (50 000) – Related-party loan repaid – (30 000)Finance lease liabilities (11 254) (8 746)
(301 754) (631 439)
34.6 Loans advancedRelated-party loans – GTM (6 849) – Related-party loans – Atlas Gaming – (3 287)Related-party loans – Employee loans – (1 555)
(6 849) (4 842)
34.7 Loan repayments receivedRelated-party loan – Sun Slots – 189 905 Related-party loans – GTM – 2 462 Employee loans 1 128 –
1 128 192 367
34.8 Cash paid through business combinationAcquisition of 65% of Grand Food Meat Plant (Note 4) – (39 259)
– (39 259)
34.9 Investment madeInvestmentsAcquisition of 7.4% of Spur (Note 12) (266 555) – Acquisition of Atlas Gaming – (5 786)AssociatesRights issue in Worcester Casino (Note 10) – (30 120)
(266 555) (35 906)
34.10 Consideration from disposal of subsidiariesNet cash received on derecognition as a subsidiary of Grand Linkstate (Note 4) 332 – Net cash received on derecognition as a subsidiary of Grand Sport (Note 4) 9 883 –
10 215 –
NOTES TO THE CONSOLIDATED ANNUAL FINANCIAL STATEMENTS (continued)for the year ended 30 June 2017

GRAND PARADE INVESTMENTS LIMITED ANNUAL FINANCIAL STATEMENTS 2017
CONSOLIDATED ANNUAL FINANCIAL STATEMENTS 69
2017
R’000s
2016
R’000s
34. NOTES TO THE CASH FLOW STATEMENT CONTINUED
34.11 Consideration from disposal of equity-accounted investmentsProceeds from the disposal of 19.9% of Sun Slots (Tranche 3) (2016: 25.0% Tranche 2) 262 492 270 260 Accelerated proceeds from sale of 10% of SunWest and Worcester 528 445 – Proceeds from the disposal of 10% of SunWest and Worcester – 112 500
790 937 382 760
34.12 Dividends receivedSunWest 70 970 155 620 Spur 16 859 14 862 Preference shares – Investec – 373
87 829 170 855

70 CONSOLIDATED ANNUAL FINANCIAL STATEMENTS
GRAND PARADE INVESTMENTS LIMITED ANNUAL FINANCIAL STATEMENTS 2017
CONSOLIDATED ANNUAL FINANCIAL STATEMENTS 71
NOTES TO THE CONSOLIDATED ANNUAL FINANCIAL STATEMENTS (continued)for the year ended 30 June 2017
Salary
R’000s
Short-term
benefits(1)
R’000s
Long-term
benefits
R’000s
Bonuses
R’000s
Directors’
fees
R’000s
Audit
and Risk
Committee
R’000s
Remuneration
and
Nomination
Committee
R’000s
Investment
Committee
R’000s
Total
remuneration
R’000s
Loans
advanced
R’000s
Share-based
payment
expense
R’000s
35. DIRECTORS’ EMOLUMENTS2017Executive directorsH Adams 4 327 1 195 649 10 701 – – – – 16 872 5 251 765 A Keet(3) 1 947 2 818 292 3 000 – – – – 8 057 1 847 (729)T Karriem(2) 1 143 156 171 – – – – – 1 470 – 201 D Pienaar 1 808 56 271 1 250 – – – – 3 385 411 289 Sub-total 9 225 4 225 1 383 14 951 – – – – 29 784 7 509 526
Non-executive directorsN Maharaj – – – – 232 75 36 – 343 – – N Mlambo – – – – 202 – 6 – 208 – – C Priem – – – – 225 136 24 9 394 – – A Abercrombie – – – – 202 – 24 – 226 – – R Hargey – – – – 202 – – – 202 – – W Geach – – – – 202 75 – – 277 – – Sub-total – – – – 1 265 286 90 9 1 650 – –
Total 9 225 4 225 1 383 14 951 1 265 286 90 9 31 434 7 509 526
(1) Short-term benefits include medical aid contributions, allowances and fringe benefit tax on interest-free loans.(2) T Karriem was appointed on 9 September 2016 as a executive director. Amounts disclosed above include remuneration
for 10 months.(3) A Keet resigned as CEO and director of GPI on 3 April 2017.
Salary R’000s
Short-termbenefits(1)
R’000s
Long-termbenefits R’000s
Bonuses R’000s
Directors’fees
R’000s
Audit and Risk
Committee R’000s
Remunerationand
NominationCommittee
R’000s
InvestmentCommittee
R’000s
Socialand Ethics
CommitteeR’000s
Totalremuneration
R’000s
Loansadvanced
R’000s
Share-basedpaymentexpense
R’000s
2016Executive directorsH Adams 3 097 916 465 3 500 – – – – – 7 978 4 935 765 A Keet 2 046 256 307 1 688 – – – – – 4 297 2 943 455 D Pienaar 1 339 51 196 550 – – – – – 2 136 895 289 Sub-total 6 482 1 223 968 5 738 – – – – – 14 411 8 773 1 509
Non-executive directorsN Maharaj – – – – 209 82 52 – – 343 – – N Mlambo – – – – 180 – 38 – – 218 – – C Priem – – – – 180 150 38 9 – 377 – – A Abercrombie – – – – 180 – 20 9 9 218 – – R Hargey(2) – – – – 138 – – – – 138 – – W Geach – – – – 180 82 – – – 262 – – Sub-total – – – – 1 067 314 148 18 9 1 556 – –
Total 6 482 1 223 968 5 738 1 067 314 148 18 9 15 967 8 773 1 509
(1) Short-term benefits include medical aid contributions, allowances and fringe benefit tax on interest-free loans.(2) R Hargey was appointed on 1 September 2015 as a non-executive director.

72 CONSOLIDATED ANNUAL FINANCIAL STATEMENTS
GRAND PARADE INVESTMENTS LIMITED ANNUAL FINANCIAL STATEMENTS 2017
CONSOLIDATED ANNUAL FINANCIAL STATEMENTS 73
NOTES TO THE CONSOLIDATED ANNUAL FINANCIAL STATEMENTS (continued)for the year ended 30 June 2017
35. DIRECTORS’ EMOLUMENTS CONTINUED
Equity-based remuneration (GPI share options granted in terms of the Grand Parade Share Incentive Trust)
Number of
unvested
share options
30 June 2016
000s
Granted
during the
year
000s
Vested during
the year
000s
Forfeited
during the
year
000s
Average
market price
per share on
vesting date
R
Vesting price
per share
R
Date
granted
Number of
unvested
share options
30 June 2017
000s
2017Executive directorsH Adams 3 376 – (1 125) – 5.50 3.61 1 Sep 2013 2 251 A Keet(1) 2 005 1 161 (669) (2 497) 5.54 3.61 1 Sep 2013 – T Karriem(2) 620 568 5.54 3.61 1 Sep 2013 1 188 D Pienaar 617 875 (206) – 5.42 3.61 1 Sep 2013 1 286 Sub-total 6 618 2 604 (2 000) (2 497) 4 725
2016Executive directorsH Adams 4 501 – (1 125) – 5.50 3.61 1 Sep 2013 3 376 A Keet 2 674 – (669) – 5.54 3.61 1 Sep 2013 2 005 D Pienaar 823 – (206) – 5.42 3.61 1 Sep 2013 617 Sub-total 7 998 – (2 000) – 5 998
(1) On 3 April 2017 Mr A Keet resigned as an executive director from the Group. All unvested share options are forfeited on an employee’s resignation date.
(2) On 9 September 2016 Mrs T Karriem was appointed as an executive director.

74 CONSOLIDATED ANNUAL FINANCIAL STATEMENTS
NOTES TO THE CONSOLIDATED ANNUAL FINANCIAL STATEMENTS (continued)for the year ended 30 June 2017
36. RELATED-PARTY TRANSACTIONS36.1. Transactions between Group companies
The Group in the ordinary course of business entered into various transactions with related parties. Any intra-group related party transactions and balances are eliminated in the preparation of the Consolidated Annual Financial Statements as presented. Details regarding related party loans have been disclosed in Note 21.1 of the Consolidated Annual Financial Statements.
During the year the Group entered into the following transactions with its investments that have been classified as jointly controlled entities or associates. These transactions have not been eliminated in the preparation of the Consolidated Annual Financial Statements:
2017
R’000s
2016
R’000s
Sun Slots – IT fees received – 8 256 – Rental income received 1 188 3 255 – Interest received on related-party loan – 15 525
1 188 27 036 GTM – Rental income received – 2 761
– 2 761
36.2. Identity of related parties A number of the Group and Company’s directors (or parties related to them) hold positions in other entities, where they may have significant influence over the financial or operating policies of those entities. To the extent that the Group has any relationship or dealings with those entities, they are listed as follows:
Director Entity Relationship with entity
Hassen Adams Afriserv (Pty) Ltd
Nadeson Consulting Services (Pty) Ltd
Nadesons Investments (Pty) Ltd
Proman Project Management Services
(Pty) Ltd
Risk Benefit Solutions (Pty) Ltd
74.64% shareholder (indirect)
37.5% shareholder (Indirect)
93.30% shareholder
37.5% shareholder (Indirect)
23.42% shareholder (indirect) Colin Priem Afriserv (Pty) Ltd 20% shareholder (Indirect)
Afriserv (Pty) Ltd Afriserv provided office cleaning and security services to the Group to the value of R5 045 405 during the year (2016: R3 876 000). Afriserv charges the Group a fee for their services that is consistent with the fees charged to their other clients.
Nadeson Consulting Services (Pty) Ltd Nadeson Consulting provided no services to the Group during the year (2016: R246 000). The services provided to the Group in the prior year were for the development of properties including Burger King stores and the fees charged to the Group are in line with the fees Nadeson Consulting charges its other clients.
During the year Nadeson Consulting paid rental fees to the Group amounting to R568 701 (2016: R 637 500). This is in line with market rentals.

GRAND PARADE INVESTMENTS LIMITED ANNUAL FINANCIAL STATEMENTS 2017
CONSOLIDATED ANNUAL FINANCIAL STATEMENTS 75
36. RELATED-PARTY TRANSACTIONS CONTINUED
36.2. Identity of related parties (continued)Nadeson Projects (Pty) Ltd During the current year the Group paid no fees (2016: R368 220) to Nadeson Projects for project management services. The services provided to the Group during the prior year are for the development of properties including Burger King stores and the fees charged to the Group are in line with the fees Nadesons Projects charges its other clients.
Proman Project Management Services (Pty) Ltd Proman Project Management Services provided no services to the Group during the current year (2016: R3 090 540). The services provided to the Group during the prior year are for the development of properties including Burger King stores and the fees charged to the Group are in line with the fees Proman Project Management charges its other clients.
Risk Benefit Solutions (Pty) LtdRisk Benefit Solutions provided insurance underwriting services to the Group during the current year to the value of R4 936 916 (2016: Rnil). The fees charged to the Group are in line with the fees charged to other clients.
36.3. Key management The key management personnel compensation is as follows:
2017
R’000s
2016
R’000s
– Short-term employee benefits 29 656 25 456 – Long-term employee benefits 1 523 1 419 – Share-based payment expense 526 2 171
31 705 29 046
Interest-free loans – H Adams(i) 18 185 14 078 – A Keet(ii) 6 662 4 222 – A Abercrombie(iii) – 1 128 – D Pienaar(iv) 1 645 895
26 492 20 323
(i) H Adams has ceded 5 250 692 GPI shares as security for the loan at 30 June 2017 (2016: 4 125 346 GPI shares). (ii) A Keet has ceded 1 847 008 GPI shares as security for the loan at 30 June 2017 (2016: 1 178 504 GPI shares). (iii) A Abercrombie repaid his loan in full during the financial year (2016: 450 000 GPI shares used as security). (iv) D Pienaar has ceded 411 356 GPI shares as security for the loan at 30 June 2017 (2016: 205 679 GPI shares).
The terms of the loans are disclosed under Note 21.1 of the Consolidated Annual Financial Statement.
36.4. Directors’ fees from Group investments Certain of the Directors received Directors’ fees as a result of being Board members on the Board committees of the underlying investment companies. These fees are paid directly to these Directors.
2017
R’000s
2016
R’000s
SunWestH Adams 88 97 A Abercrombie 72 69 N Mlambo 72 69
232 235 Worcester CasinoH Adams 33 39 A Abercrombie 40 28
73 67
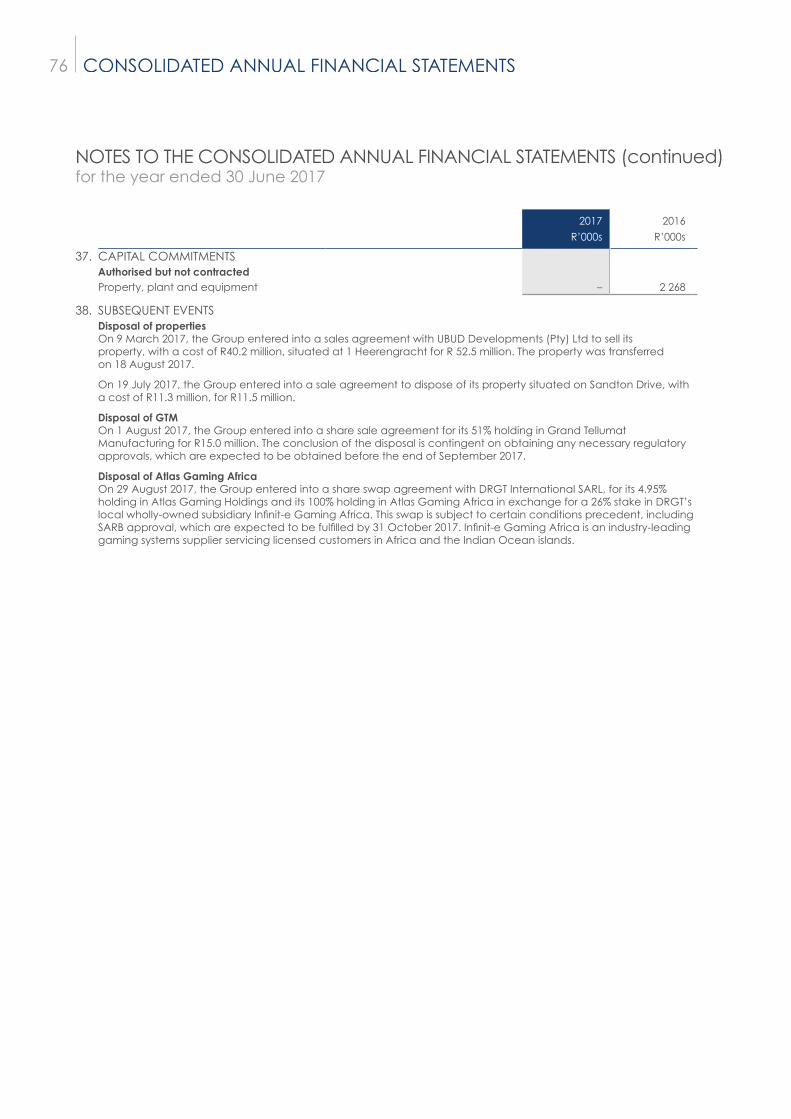
76 CONSOLIDATED ANNUAL FINANCIAL STATEMENTS
NOTES TO THE CONSOLIDATED ANNUAL FINANCIAL STATEMENTS (continued)for the year ended 30 June 2017
2017
R’000s
2016
R’000s
37. CAPITAL COMMITMENTSAuthorised but not contractedProperty, plant and equipment – 2 268
38. SUBSEQUENT EVENTSDisposal of propertiesOn 9 March 2017, the Group entered into a sales agreement with UBUD Developments (Pty) Ltd to sell its property, with a cost of R40.2 million, situated at 1 Heerengracht for R 52.5 million. The property was transferred on 18 August 2017.
On 19 July 2017, the Group entered into a sale agreement to dispose of its property situated on Sandton Drive, with a cost of R11.3 million, for R11.5 million.
Disposal of GTMOn 1 August 2017, the Group entered into a share sale agreement for its 51% holding in Grand Tellumat Manufacturing for R15.0 million. The conclusion of the disposal is contingent on obtaining any necessary regulatory approvals, which are expected to be obtained before the end of September 2017.
Disposal of Atlas Gaming AfricaOn 29 August 2017, the Group entered into a share swap agreement with DRGT International SARL, for its 4.95% holding in Atlas Gaming Holdings and its 100% holding in Atlas Gaming Africa in exchange for a 26% stake in DRGT’s local wholly-owned subsidiary Infinit-e Gaming Africa. This swap is subject to certain conditions precedent, including SARB approval, which are expected to be fulfilled by 31 October 2017. Infinit-e Gaming Africa is an industry-leading gaming systems supplier servicing licensed customers in Africa and the Indian Ocean islands.

GRAND PARADE INVESTMENTS LIMITED ANNUAL FINANCIAL STATEMENTS 2017
COMPANY ANNUAL FINANCIAL STATEMENTS 77
STATEMENT OF COMPREHENSIVE INCOMEfor the year ended 30 June 2017
Note
2017
R’000s
2016
R’000s
Revenue 2 219 729 129 954 Operating costs (5 465) (50 269)Profit from operations 214 264 79 685 Impairment of loans 13 (3 296) (21 525)Impairment of investment 8 – (3 468)Reversal of impairment 6 – 21 362 Profit on disposal of investment 3, 6, 9 261 238 490 802 Depreciation – (18)Profit before finance costs and taxation 3 472 206 566 838 Finance income 2 22 299 20 283 Finance costs 4 (8 851) (22 117)Profit before taxation 485 654 565 004 Taxation 5 (56 079) (93 706)Profit for the year 429 575 471 298
Other comprehensive incomeItems that will be reclassified subsequently to profit or lossUnrealised fair value adjustments on available-for-sale investments, net of tax 16 2 690 – Total comprehensive income for the year 432 265 471 298

78 COMPANY ANNUAL FINANCIAL STATEMENTS
STATEMENT OF FINANCIAL POSITIONas at 30 June 2017
Note
2017
R’000s
2016
R’000s
ASSETSNon-current assets 495 272 489 184 Investments in jointly controlled entities 6 28 578 28 578 Investments in associates 7 32 688 32 688 Available-for-sale investment 8 5 786 2 319 Investments in subsidiaries 10 428 033 424 822 Deferred tax asset 5 187 777
Assets classified as held-for-sale 9 – 1 461
Current assets 1 327 748 1 281 678 Trade and other receivables 11 4 579 5 789 Deferred proceeds 12 – 298 917 Related-party loans 13 1 319 617 921 576 Cash and cash equivalents 14 3 471 46 216 Income tax receivable 21.2 81 9 180
Total assets 1 823 020 1 772 323
EQUITY AND LIABILITIESCapital and reservesTotal equity Stated capital 15 802 256 855 066 Accumulated profit 981 578 672 759 IFRS 2 share-based payment reserve 11 409 9 636 Available-for-sale reserve 16 2 690 – Total shareholders’ equity 1 797 933 1 537 461
Current liabilities 25 087 234 862 Interest-bearing borrowings 17 – 225 000 Related-party loans 13 13 211 – Trade and other payables 18 2 132 1 036 Dividends payable 21.3 9 744 8 826
Total equity and liabilities 1 823 020 1 772 323

GRAND PARADE INVESTMENTS LIMITED ANNUAL FINANCIAL STATEMENTS 2017
COMPANY ANNUAL FINANCIAL STATEMENTS 79
STATEMENT OF CHANGES IN EQUITYfor the year ended 30 June 2017
Stated
capital
R’000s
Accumulated
profits
R’000s
IFRS 2 Share-
based
payment
reserve
R’000s
Available-
for-sale
reserve
Total
equity
R’000s
Balance at 30 June 2015 855 066 271 919 10 289 – 1 137 274 Total comprehensive income for the year – 471 298 – – 471 298 – Profit for the year – 471 298 – – 471 298 Dividends declared – (73 355) – – (73 355)IFRS 2 charge relating to investments – – 2 244 – 2 244 Share options exercised by employees – 2 897 (2 897) – – Balance at 30 June 2016 855 066 672 759 9 636 – 1 537 461 Total comprehensive income for the year – 429 575 – 2 690 432 265 – Profit for the year – 429 575 – 2 690 432 265 Dividends declared – (122 436) – – (122 436)IFRS 2 charge relating to investments – – 3 453 – 3 453 Shares acquired and cancelled (52 810) – – – (52 810)Share options exercised by employees – 1 680 (1 680) – – Balance at 30 June 2017 802 256 981 578 11 409 2 690 1 797 933

80 COMPANY ANNUAL FINANCIAL STATEMENTS
STATEMENT OF CASH FLOWSfor the year ended 30 June 2017
Note
2017
R’000s
2016
R’000s
Cash flows from operating activitiesNet cash utilised from operations 21.1 (4 297) (55 698)Income tax paid 21.2 (47 167) (93 043)Finance income 11 554 20 726 Net cash outflow from operating activities (39 910) (128 015)
Cash flows from investing activitiesInter-group loans advanced 21.4 (506 220) (800 891)Inter-group loans repaid 21.5 109 018 623 031 Investments made 21.6 – (103 706)Dividends received 21.7 219 729 129 954 Proceeds on disposal of subsidiaries 21.8 10 996 – Proceeds on disposal of investments 21.9 571 821 333 896 Net cash outflow from investing activities 405 344 182 284
Cash flows from financing activitiesDividends paid 21.3 (121 518) (72 805)Loans received 21.10 – 370 000 Loans repaid 21.11 (225 000) (447 000)Shares bought back (52 810) – Finance costs (8 851) (22 117)Net cash outflow from financing activities (408 179) (171 922)
Net decrease in cash and cash equivalents (42 745) (117 653)Cash and cash equivalents at the beginning of the year 46 216 163 869 Total cash and cash equivalents at the end of the year 3 471 46 216

GRAND PARADE INVESTMENTS LIMITED ANNUAL FINANCIAL STATEMENTS 2017
COMPANY ANNUAL FINANCIAL STATEMENTS 81
NOTES TO THE ANNUAL FINANCIAL STATEMENTSfor the year ended 30 June 2017
1. ACCOUNTING POLICIES The Annual Financial Statements are prepared on a historical cost basis, unless otherwise indicated, in accordance with International Financial Reporting Standards and the requirements of the Companies Act (No 71 of 2008), as amended. The accounting policies are consistent with those of the previous year and for detailed accounting policies refer to Note 1 and Note 2 of the Consolidated Annual Financial Statements.
2017
R’000s
2016
R’000s
2. REVENUEDividends received 219 729 129 954 – Subsidiaries, jointly controlled entities 219 729 129 581 – Other – 373 Total revenue 219 729 129 954 Finance income 22 299 20 283 Total revenue including finance income 242 028 150 237
3. PROFIT BEFORE FINANCE COSTS AND TAXATION Profit before finance and taxation cost is stated after:
ExpensesDepreciation – 18 Profit on disposal of investment 207 –
Auditors’ remunerationAudit fees 1 176 715 – Current year 935 671 – Prior year underprovision 241 44
Staff costs 1 678 1 571 – Directors’ remuneration 1 678 1 571
The Company has no employees during the current and prior years.
4. FINANCE COSTS Interest on facilities 8 851 22 117
8 851 22 117
5. TAXATIONSouth African normal tax– Current year 56 740 94 483 – Prior year overprovision (474) – Deferred tax (187) (777)
56 079 93 706
% %
Standard rate 28.00 28.00 Exempt income (13.18) (7.51)Non-deductible expenses 0.87 4.32 Prior year overprovision (0.10) – CGT tax differential (4.04) (8.22)Effective tax rate 11.55 16.59
R’000s R’000s
The deferred tax balance is made up as follows:Provisions and accruals 187 – Available-for-sale investment – 777
187 777
Reconciliation of net deferred tax assetOpening balance 777 – Tax expense for the period recognised in profit or loss 187 – Provisions and accruals 187 –
Tax expense for the period recognised in other comprehensive income (777) 777 Closing balance 187 777

82 COMPANY ANNUAL FINANCIAL STATEMENTS
6. INVESTMENT IN JOINTLY CONTROLLED ENTITIES
SunWest Worcester Casino Sun Slots Total
2017
R’000s
2016
R’000s
2017
R’000s
2016
R’000s
2017
R’000s
2016
R’000s
2017
R’000s
2016
R’000s
Carrying amount of investment – beginning of the year 28 578 150 079 – – – 1 311 28 578 151 390 Disposal of investment – (121 501) – (20 510) – – – (142 011)Reversal of impairment – – – 21 362 – – – 21 362 Rights issue – – – 30 120 – – – 30 120 IFRS 2 expense capitalised – – – – – 405 – 405 Transferred to investment in associate – – – (30 972) – (1 716) – (32 688)Carrying amount of the investment – end of the year 28 578 28 578 – – – – 28 578 28 578
Details on the reclassification of Sun Slots and Worcester Casino as a investment in associate have been disclosed in Note 10 of the Consolidated Annual Financial Statements.
Worcester Casino Sun Slots Total
2017
R’000s
2016
R’000s
2017
R’000s
2016
R’000s
2017
R’000s
2016
R’000s
7. INVESTMENT IN ASSOCIATESCarrying amount – beginning of the year 30 972 – 1 716 – 32 688 – Transfer from investment in jointly controlled entity – 30 972 – 1 716 – 32 688 Disposal of investment – – – – – – Carrying amount – end of the year 30 972 30 972 1 716 1 716 32 688 32 688
Atlas Gaming Total
2017
R’000s
2016
R’000s
2017
R’000s
2016
R’000s
8. AVAILABLE-FOR-SALE INVESTMENTOpening balance 2 319 – 2 319 – Acquisitions – 5 787 – 5 787 Impairment – (3 468) – (3 468)Fair value adjustment 3 467 – 3 467 –
5 786 2 319 5 786 2 319
9. ASSET HELD-FOR-SALE Details regarding the Company’s investment in Sun Slots, recognised as an asset held-for-sale, have been disclosed in Note 3 of the Consolidated Annual Financial Statements and below.
The profit on sale of the asset is as follows: Sun Slots
2017
R’000s
2016
R’000s
Proceeds on disposal 262 492 270 760 Cost of share disposed (1 461) (500)Profit on sale of investment 261 031 270 260
NOTES TO THE ANNUAL FINANCIAL STATEMENTS (continued)for the year ended 30 June 2017

GRAND PARADE INVESTMENTS LIMITED ANNUAL FINANCIAL STATEMENTS 2017
COMPANY ANNUAL FINANCIAL STATEMENTS 83
Sun Slots
2017
R’000s
2016
R’000s
9. ASSET HELD-FOR-SALE CONTINUED
ASSETSNon-current assetsInvestment in associates – 1 461 Assets classified as held-for-sale – 1 461
10. INVESTMENTS IN SUBSIDIARIES Grand Foods(1) 343 195 341 489 Grand Property Management 140 140 Grand Capital(1) 657 657 Grand Sport(1) 254 203 GPI Management Services(1) 8 343 6 889 Grand Casino Investments 1 000 1 000 GPI Investments 1 72 328 72 328 Grand Casino Investments KZN 2 116 2 116
428 033 424 822
(1) The movement in these investments represents the share options issued to employees of these subsidiaries refer note 24.2 of the Consolidated Annual Financial Statements.
2017
R’000s
2016
R’000s
11. TRADE AND OTHER RECEIVABLESTrade receivables 3 677 5 501 Other receivables 351 65 Prepayments 551 223
4 579 5 789
SunWest
R’000s
Worcester
R’000s
Total
R’000s
12 DEFERRED PROCEEDS2017Opening balance 273 444 25 473 298 917 Interest released 8 818 822 9 640 Instalments received (283 303) (26 392) (309 695)Gain on acceleration of proceeds 1 041 97 1 138 Closing balance – – –
2016Net proceeds 349 279 32 538 381 817 Imputed interest (17 622) (1 642) (19 264)Consideration 331 657 30 896 362 553 Instalments received at 30 June 2017 (58 213) (5 423) (63 636)Deferred proceeds 273 444 25 473 298 917
Refer to note 19 of the Consolidated Annual Financial Statements for the terms of the transaction where 10% of SunWest and Worcester were disposed of. The shareholding in SunWest was held through the Company and a subsidiary, while the shareholding in Worcester Casino was held by the Company.

84 COMPANY ANNUAL FINANCIAL STATEMENTS
2017
R’000s
2016
R’000s
13. RELATED-PARTY LOANSGPI, in the ordinary course of business, entered into various service and investment transactions.Interest-free loans – GTM(1) – – – Grand Capital(2) 22 – – Grand Linkstate(4) – 14 523 – GPI Management Services(2) 945 521 729 229 – Grand Casino Investments – 88 609 – GPI Properties (13 211) – – Grand Foods(2) 798 798 – Utish Investments(2) 3 766 3 737 – GPI Foods Investments 3(2) 265 270 – – Grand Sport(2)(3) – 17 002 – Grand Food Meat Plant(2) 5 102 – – Grand Parade Share Incentive Trust(2) 24 695 31 892 – Atlas Gaming Holdings 3 282 – – Atlas Gaming Africa 13 850 – – GPI Women’s BBBEE Empowerment Trust(2) 57 311 57 311
1 306 406 943 101 Impairment of loans(3)(4) – (21 525)
1 306 406 921 576 Total current liabilities (13 211) – Total current assets 1 319 617 921 576
14. CASH AND CASH EQUIVALENTSCash and cash equivalents include Money Market call accounts with floating interest rates that fluctuated between 6.50% and 8.00% during the year (2016: between 5.65% and 6.50%)
Cash and cash equivalents 3 471 46 216 3 471 46 216
At year end the Company had unused overdraft facilities of R15 million (2016: R15 million).
15. STATED CAPITAL Details regarding the Company’s stated capital have been disclosed in Note 23.1 of the Consolidated Annual Financial Statements.
Authorised share capital 2 000 000 000 ordinary shares of no par value – –
Opening balance – 1 July 855 066 855 066 Shares bought back for cancellation (52 810) – Closing balance (issued and fully paid) – 30 June 802 256 855 066
000s 000s
Reconciliation of number of shares in issueOpening balance – 1 July 488 806 488 806 Shares bought back for cancellation (15 017) – Closing balance – 30 June 473 789 488 806
(1) Details regarding the related-party loans have been disclosed in Note 21.1 of the Consolidated Annual Financial Statements. (2) These related-party loans are interest free and are repayable on demand. The loans are subordinated however, post year-end
the Directors have proposed the capitalisation of these loans.(3) The loan was ceded as part of the sale of Grand Sport.(4) The loan was ceded as part of the sale of Grand Linkstate.
NOTES TO THE ANNUAL FINANCIAL STATEMENTS (continued)for the year ended 30 June 2017

GRAND PARADE INVESTMENTS LIMITED ANNUAL FINANCIAL STATEMENTS 2017
COMPANY ANNUAL FINANCIAL STATEMENTS 85
2017
R’000s
2016
R’000s
16 AVAILABLE-FOR-SALE RESERVE AT FAIR VALUE The movements in the unrealised gains relating to the Company’s available-for-sale investments are as follows:
Opening balance – – Movement during the year: 2 690 – Unrealised fair value gains on available-for-sale investments (note 8) 3 467 – Deferred tax (777) –
Closing balance 2 690 –
17. INTEREST-BEARING BORROWINGSInvestec – GPI credit facility 1 – – Investec – GPI credit facility 2 – – SBSA – GPI revolving loan facility – 225 000
– 225 000
Details regarding the Company’s interest bearing borrowings have been disclosed in Note 26 of the Consolidated Annual Financial Statements.
Balance made up as follows:Short-term portion – 225 000
– 225 000
18. TRADE AND OTHER PAYABLESTrade payables 775 365 Other payables and accruals 1 357 671 Audit fee accrual 935 671 Sundry accruals 261 –Other payables 161 –
2 132 1 036
Loans and
receivables
R’000s
Available for
sale
R’000s
Non-financial
assets
R’000s
Total
R’000s
19. FINANCIAL INSTRUMENTS Financial assets2017Cash and cash equivalents 3 471 – – 3 471 Available-for-sale investment – 5 786 – 5 786 Related-party loans 1 319 617 – – 1 319 617 Trade and other receivables 4 028 – 551 4 579 Total 1 327 116 5 786 551 1 333 453
2016Cash and cash equivalents 46 216 – – 46 216 Available-for-sale investment – 2 319 – 2 319 Related-party loans 921 576 – – 921 576 Trade and other receivables 5 566 – 223 5 789 Total 973 358 2 319 223 975 900

86 COMPANY ANNUAL FINANCIAL STATEMENTS
Financial
liabilities
measured
at amortised
cost
R’000s
Non-financial
liabilities
R’000s
Total
R’000s
19. FINANCIAL INSTRUMENTS CONTINUED
Financial liabilities2017Trade and other payables 2 132 – 2 132 Related-party loans 13 211 – 13 211 Dividends payable 9 744 – 9 744 Total 25 087 – 25 087
2016Trade and other payables 1 036 – 1 036 Interest-bearing borrowings 225 000 – 225 000 Dividends payable 8 826 – 8 826 Total 234 862 – 234 862
Market riskMarket risk is the risk that the fair value or future cash flows of the financial instrument will fluctuate because of changes in market prices.
Market risk comprises three types of risk: currency risk, interest rate risk and other price risk.
Market risk: Interest rate riskInterest rate risk is the risk that the cash flows of a financial instrument will fluctuate due to changes in market interest rates. The Company’s exposure to the risk of changes in interest rates relates to the Company’s obligation in terms of interest-bearing borrowings and bank accounts. The Company partially mitigates this by holding interest bearing assets in the form of cash. The table below reflects the interest rate sensitivity analysis. The analysis was calculated by increasing or decreasing the Company’s interest rate by 100 basis points assuming all other variables remain constant.
Increase in
basis points
Effect on
pre-tax profit
Decrease
in basis points
Effect on
pre-tax profit
2017 100 35 (100) (35)2016 100 (1 788) (100) 1 788
Credit riskCredit risk is the risk of financial loss caused by the inability or unwillingness of a counterparty to a financial instrument to discharge contractual obligations. There is no independent rating procedure for customers as the credit quality for customers is assessed by taking into account their financial position, past experience and other factors are used in evaluating the acceptability of clients.
Cash and cash equivalents The Company only deposits cash surpluses with major banks of high quality and credit standing. At year end, the Company did not consider there to be any significant concentration of credit risk and all assets that have been identified as impaired, after taking the Company’s credit policy into account, have been appropriately provided for. The cash and cash equivalents are deposited with two financial institutions. The Company’s maximum exposure to credit risk in terms of cash and cash equivalents, loans and receivables equals the carrying amounts of these instruments as disclosed above.
Related-party loans receivables Related-party credit risk is managed by each business unit in terms of the Company’s policy. Outstanding receivables are regularly monitored and an impairment analysis is performed at each reporting date based on payment history and the financial position of the counterparty.
Liquidity riskRefer to note 32 of the Consolidated Annual Financial Statements for an explanation on liquidity risk and how it is managed.
NOTES TO THE ANNUAL FINANCIAL STATEMENTS (continued)for the year ended 30 June 2017
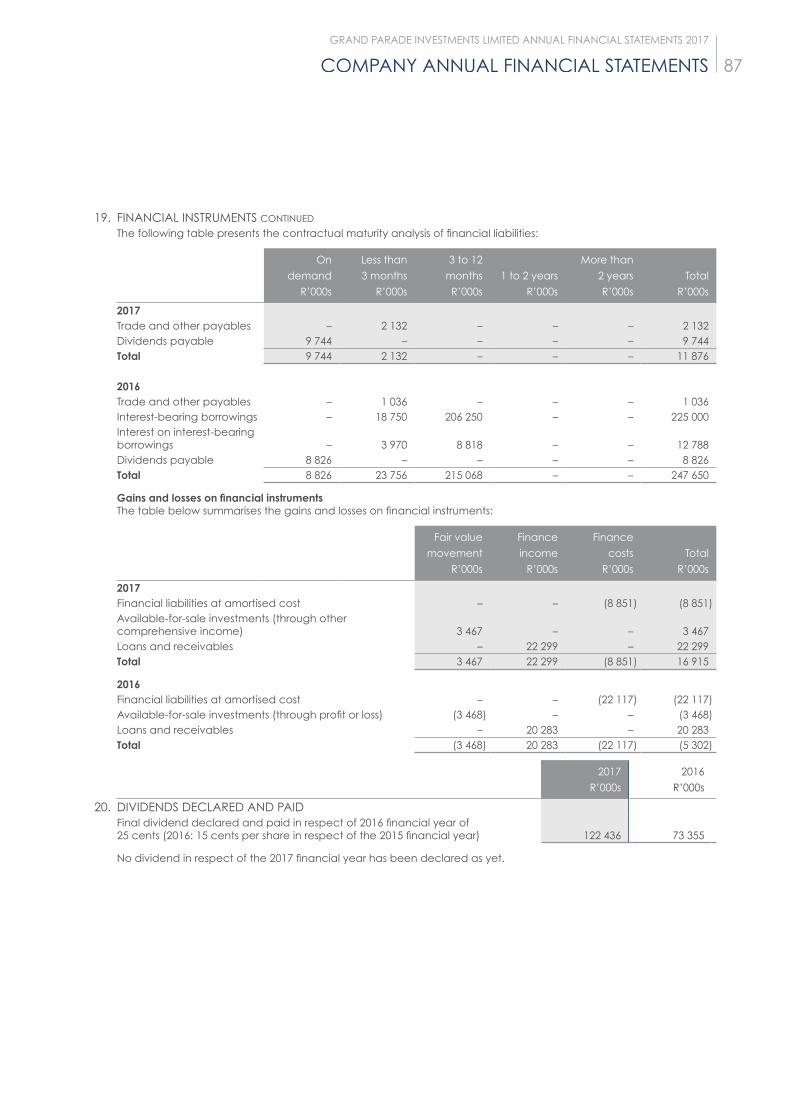
GRAND PARADE INVESTMENTS LIMITED ANNUAL FINANCIAL STATEMENTS 2017
COMPANY ANNUAL FINANCIAL STATEMENTS 87
19. FINANCIAL INSTRUMENTS CONTINUED
The following table presents the contractual maturity analysis of financial liabilities:
On
demand
R’000s
Less than
3 months
R’000s
3 to 12
months
R’000s
1 to 2 years
R’000s
More than
2 years
R’000s
Total
R’000s
2017Trade and other payables – 2 132 – – – 2 132 Dividends payable 9 744 – – – – 9 744 Total 9 744 2 132 – – – 11 876
2016Trade and other payables – 1 036 – – – 1 036 Interest-bearing borrowings – 18 750 206 250 – – 225 000 Interest on interest-bearing borrowings – 3 970 8 818 – – 12 788 Dividends payable 8 826 – – – – 8 826 Total 8 826 23 756 215 068 – – 247 650
Gains and losses on financial instrumentsThe table below summarises the gains and losses on financial instruments:
Fair value
movement
R’000s
Finance
income
R’000s
Finance
costs
R’000s
Total
R’000s
2017Financial liabilities at amortised cost – – (8 851) (8 851)Available-for-sale investments (through other comprehensive income) 3 467 – – 3 467 Loans and receivables – 22 299 – 22 299 Total 3 467 22 299 (8 851) 16 915
2016Financial liabilities at amortised cost – – (22 117) (22 117)Available-for-sale investments (through profit or loss) (3 468) – – (3 468)Loans and receivables – 20 283 – 20 283 Total (3 468) 20 283 (22 117) (5 302)
2017
R’000s
2016
R’000s
20. DIVIDENDS DECLARED AND PAIDFinal dividend declared and paid in respect of 2016 financial year of 25 cents (2016: 15 cents per share in respect of the 2015 financial year) 122 436 73 355
No dividend in respect of the 2017 financial year has been declared as yet.

88 COMPANY ANNUAL FINANCIAL STATEMENTS
2017
R’000s
2016
R’000s
21. NOTES TO THE CASH FLOW STATEMENT21.1 Cash generated from operations
Profit before taxation 485 654 565 004 Adjustments for:– Depreciation – 18 – Impairment of investment – 3 468 – Finance income (22 299) (20 283)– Finance costs 8 851 22 117 – Dividends received (219 729) (129 954)– Reversal of impairment of investment – (21 362)– Impairment of loans 3 296 21 525 – Profit on acceleration of deferred proceeds (1 138) – – Profit on disposal of investments (261 238) (490 802)Operating cash flows before working capital changes (6 603) (50 269)Decrease/(Increase) in trade and other receivables 1 210 (4 465)Increase/(decrease) in trade and other payables 1 096 (964)Net cash utilised from operations (4 297) (55 698)
21.2 Taxation paidTaxation – beginning of the year (9 180) (10 620)Amount per statement of comprehensive income– current year 56 740 94 483 – prior year underprovision (474) – Taxation – closing balance 81 9 180
47 167 93 043
The closing tax balances comprises of the following: – Income tax refunds 81 9 180
81 9 180
21.3 Dividends paidOpening balance (8 826) (8 276)Dividends declared (122 436) (73 355)Closing balance 9 744 8 826
(121 518) (72 805)
21.4 Inter-group loans advanced– GPI Management Services (233 424) (691 681)– Grand Foods – (798)– Grand Capital (22) – – Utish Investments (30) – – GPSIT – (12 889)– BBBEE Women’s trust – (12)– Grand Sport (2 574) – – GTM – (6 902)– Grand Casino Investment – (88 609)– GPI Foods Investments 3 (265 270) – – Grand Foods Meat Plant (4 900) –
(506 220) (800 891)
NOTES TO THE ANNUAL FINANCIAL STATEMENTS (continued)for the year ended 30 June 2017

GRAND PARADE INVESTMENTS LIMITED ANNUAL FINANCIAL STATEMENTS 2017
COMPANY ANNUAL FINANCIAL STATEMENTS 89
2017
R’000s
2016
R’000s
21. NOTES TO THE CASH FLOW STATEMENT CONTINUED
21.5 Inter-group loans repaid– Sun Slots – 189 905 – GPI Properties 13 212 – – Grand Foods – 231 893 – Grand Capital – 162 862 – GTM – 37 084 – GPI Investments 1 – 1 287 – Grand Casino Investments 88 609 – – GPSIT 7 197 –
109 018 623 031
21.6 Investment madeAtlas Gaming – 5 786 Worcester Casino – 30 120 Grand Foods – 67 800
– 103 706
21.7 Dividends receivedGrand Casino Investments 207 695 80 000 SunWest 12 034 49 581 Other dividend – 373
219 729 129 954
21.8 Proceeds on disposal of investmentProceeds from the disposal of Grand Sport 10 000 – Proceeds from the disposal of Grand Linkstate 996 –
10 996 –
21.9 Proceeds on disposal of investmentProceeds from the disposal of 25.0% of Sun Slots (Tranche 2) – 270 260 Proceeds from the disposal of 19.9.1% of Sun Slots (Tranche 3) 262 126 – Proceeds from the disposal of 10% of SunWest and Worcester 309 695 63 636
571 821 333 896
21.10 Loans receivedSBSA – GPI revolving loan facility – 370 000
– 370 000
21.11 Loans repaidInvestec – GPI Credit facility 1 – (177 000)SBSA – GPI revolving loan facility (225 000) (270 000)
(225 000) (447 000)

90 COMPANY ANNUAL FINANCIAL STATEMENTS
22. RELATED-PARTY TRANSACTIONSOther than those disclosed in note 13 of the Company financial statements and note 36 of the Consolidated financial statements there are no other related parties identified.
Certain of the directors received Director fees due to them being Board members on the Board committees of the underlying investment companies. These fees are paid directly to these Directors.
2017
R’000s
2016
R’000s
SunWestH Adams 88 97 A Abercrombie 72 69 N Mlambo 72 69
232 235
Worcester Casino H Adams 33 39 A Abercrombie 40 28
73 67
NOTES TO THE ANNUAL FINANCIAL STATEMENTS (continued)for the year ended 30 June 2017

GRAND PARADE INVESTMENTS LIMITED ANNUAL FINANCIAL STATEMENTS 2017
APPENDICES 91
APPENDIX 1Principal subsidiary companies at 30 June 2017
At year-end the Group consisted of GPI and principal subsidiaries as listed below:
Ordinary
share capital
and premium
2017
R2016
R
Effective
percentage
holding
2017
%
Percentageheld2016
%
Burger King South Africa (Pty) Ltd 180 000 000 180 000 000 91.1 91.1GPI Investments 1 (Pty) Ltd 72 327 960 72 327 960 100.0 100.0GPI Management Services (Pty) Ltd – – 100.0 100.0GPI Properties (Pty) Ltd 100 100 100.0 100.0GPI Women’s BBBEE Empowerment Trust – – 100.0 100.0Grand Capital Investment Holdings (Pty) Ltd 118 622 118 622 100.0 100.0Grand Casino Investments (Pty) Ltd 1 000 000 1 000 000 100.0 100.0Grand Casino Investments KZN (Pty) Ltd 28 582 092 28 582 092 100.0 100.0Grand Foods (Pty) Ltd 337 021 711 337 021 711 100.0 100.0Grand Parade Share Incentive Trust 1 000 1 000 100.0 100.0Grand Sport (Pty) Ltd – 100 0.0 100.0Grand Linkstate (Pty) Ltd – – 0.0 51.0Mac Brothers Catering Equipment (Pty) Ltd 102 061 102 061 100.0 100.0Grand Foods Meat Plant (Pty) Ltd 100 100 96.6 96.6Utish Investments (Pty) Ltd 212 109 589 212 109 589 100.0 100.0

92 APPENDICES
APPENDIX 2Investments, associates and joint ventures
30 June 2017 30 June 2016
Shares
held
Effective
interest
%
Voting
interest
%
Shares
held
Effective
interest
%
Voting
interest
%
Food Spur 18 965 824 17.48 17.48 10 848 093 10.00 10.00
Gaming SunWest 2 220 278 15.10 Joint control(1) 2 220 278 15.10 Joint control(1)
Worcester Casino 2 113 087 15.10 15.10 2 113 087 15.10 15.10Sun Slots 300 30.00 30.00 749 49.90 49.90Atlas Gaming 6 763 000 4.95 4.95 6 763 000 4.95 4.95
Non-coreGTM 51 51.00 Joint control(1) 51 51.00 Joint control(1)
(1) Refer to note 1.4.5 for assessment of joint control.

GRAND PARADE INVESTMENTS LIMITED ANNUAL FINANCIAL STATEMENTS 2017
APPENDICES 93
APPENDIX 3Directors’ interests in shares
As at 30 June, the Directors of the Company beneficially held direct and indirect ordinary shares in the issued share capital of the Company as follows:
As at 30 June 2017
Direct
beneficial
’000s
Indirect
beneficial
’000s
Total shares
beneficial
’000s
Beneficial
%
DirectorOrdinary sharesH Adams 5 873 55 492 61 365 12.95 A Abercrombie – 6 800 6 800 1.44 N Mlambo 20 43 63 0.01 NV Maharaj – 10 10 –D Pienaar 412 – 412 0.09
6 305 62 345 68 650 14.49
As at 30 June 2016
Direct
beneficial
’000s
Indirect
beneficial
’000s
Total shares
beneficial
’000s
Beneficial
%
DirectorOrdinary sharesH Adams 4 747 47 220 51 967 10.63 A Abercrombie – 6 800 6 800 1.39 N Mlambo 20 43 63 0.01 A Keet – 5 687 5 687 1.16 NV Maharaj – 10 10 –D Pienaar 207 – 207 0.04
4 974 59 760 64 734 12.71

94 APPENDICES
APPENDIX 4Analysis of ordinary shareholders as at 30 June 2017
Number of
shareholdings
% of total
shareholdings
Number of
shares
% of issued
capital
Shareholder spread1 – 1 000 1 304 15.53 603 052 0.131 001 –10 000 4 982 59.34 23 399 179 4.9410 001 – 100 000 1 853 22.07 51 240 298 10.82100 001 – 1 000 000 194 2.31 56 881 491 12.01Over 1 000 000 62 0.75 341 664 497 72.10Total 8 395 100.00 473 788 517 100.00
Number of
shareholdings
% of total
shareholdings
Number of
shares
% of issued
capital
Distribution of shareholdersAssurance companies 16 0.19 6 543 394 1.38Close corporations 40 0.48 2 399 127 0.51Collective investment schemes 42 0.50 97 375 021 20.55Custodians 10 0.12 1 237 690 0.26Foundations and charitable funds 5 0.06 99 074 0.02Hedge funds 3 0.04 6 509 525 1.37Insurance companies 4 0.05 1 247 878 0.26Investment partnerships 23 0.27 1 912 710 0.40Managed funds 7 0.08 18 915 464 3.99Medical aid funds 3 0.04 837 776 0.18Private companies 93 1.11 95 922 671 20.25Retail shareholders 7 935 94.52 114 461 608 24.16Retirement benefit funds 46 0.55 38 203 077 8.06Scrip lending 1 0.01 1 0.00Share schemes 2 0.02 4 985 240 1.05Stockbrokers and nominees 13 0.15 899 467 0.19Trust 151 1.80 82 238 793 17.37Unclaimed scrip 1 0.01 1 0.00Total 8 395 100.00 473 788 517 100.00
Number of
shareholdings
% of total
shareholdings
Number of
shares
% of issued
capital
Non-public shareholders 10 0.12 88 449 673 18.67Directors and associates (Direct Holding) 3 0.04 6 304 653 1.33Directors and associates (Indirect Holding) 4 0.05 62 344 965 13.16GPI Women’s BBBEE Empowerment Trust 1 0.01 14 814 815 3.13
Collective investment schemes 2 0.02 4 985 240 1.05Public shareholders 8 385 99.88 385 338 844 81.33Total 8 395 100.00 473 788 517 100.00
Number of
shares
% of issued
capital
Fund Managers with a holding greater than 3% of the issued sharesFoord Asset Management 60 008 240 12.67Kagiso Asset Management 34 914 537 7.37Investec Asset Management 21 084 462 4.45Sanlam Investment Management 20 842 946 4.40Total 136 850 185 28.89

GRAND PARADE INVESTMENTS LIMITED ANNUAL FINANCIAL STATEMENTS 2017
APPENDICES 95
APPENDIX 4 (continued)Analysis of ordinary shareholders as at 30 June 2017 continued
Number of
shares
% of issued
capital
Beneficial shareholders with a holding greater than 3% of the issued sharesMr Hassen Adams 61 364 618 12.95The Chandos Trust 47 268 792 9.98Foord Asset Management 32 017 208 6.76GPI Management Services 24 000 000 5.07Investment Solutions 20 115 464 4.25Sanlam Group 16 587 497 3.50GPI Women’s BBBEE Empowerment Trust 14 814 815 3.13Investec Asset Management 14 334 329 3.03Total 230 502 723 48.67
Total number of shareholdings 8 395 Total number of shares in issue 473 788 517
Share price performanceOpening price 1 July 2016 R3.50 Closing price 30 June 2017 R2.91 Closing high for period R3.00 Closing low for period R2.85
Number of shares in issue 473 788 517 Volume traded during period 102 900 702 Ratio of volume traded to shares issued (%) 21.72Market capitalisation at 30 June 2017 R1 378 724 584

96 COMPANY ANNUAL FINANCIAL STATEMENTS

GREYMATTER & FINCH # 11314

www.grandparade.co.za
GRA
ND
PARA
DE IN
VESTM
ENTS LIM
ITED A
NN
UA
L FINA
NC
IAL STA
TEMEN
TS 2017