audited annual financial statements - … trust is earned audited annual financial statements 2017 1...
TRANSCRIPT

IAUDITED ANNUAL FINANCIAL STATEMENTS 2017PB TRUST IS EARNED™
AUDITED ANNUAL FINANCIAL STATEMENTS
2017

1AUDITED ANNUAL FINANCIAL STATEMENTS 2017II TRUST IS EARNED™
Directors’ responsibility report 1Declaration by the company secretary 1Audit and risk committee report 2Independent auditor’s report 4
CORONATION FUND MANAGERS LIMITED GROUPDirectors’ report 7Consolidated statement of comprehensive income 10Consolidated statement of financial position 11Consolidated statement of changes in equity 12Consolidated statement of cash flows 14Accounting policies 15
NOTES TO THE CONSOLIDATED FINANCIAL STATEMENTSOperating segments 23Revenue 25Finance and dividend income and expense 25Other income 25Operating expenses 25Share-based payment expense 26Income tax expense 28Earnings per share 29Intangible assets 31Equipment 31Investment in equity-accounted investees 32Deferred tax 33Investments backing policyholder funds and investments
held through investment partnerships 34Policyholder investment contract liabilities and liabilities
to holders of interests in investment partnerships 34Financial assets and financial liabilities 35Long-term and short-term portion of long-term borrowings 36Share capital 37Financial risk disclosures 38Commitments, contingent liabilities and guarantees 44Related parties 44Principal subsidiaries, associates and unconsolidated
structured entities 45Non-cash and other adjustments 47Cash flows from policyholders and investment partnerships 47
CORONATION FUND MANAGERS LIMITED COMPANYCompany statement of comprehensive income 48Company statement of financial position 49Company statement of changes in equity 50Company statement of cash flows 51Notes to Coronation Fund Managers Limited company accounts 52Analysis of shareholders 53Glossary of financial reporting terms 54Shareholders’ diary and corporate information 57
CONTENTS

1AUDITED ANNUAL FINANCIAL STATEMENTS 2017II TRUST IS EARNED™
DIRECTORS’ RESPONSIBILITY REPORT
The directors are responsible for the preparation and fair presentation of the consolidated and separate annual financial statements of Coronation Fund Managers Limited, comprising the statement of financial position at 30 September 2017, and the statement of comprehensive income, the statement of changes in equity and statement of cash flows for the year then ended, and the notes to the financial statements, which include a summary of significant accounting policies, the directors’ report and the audit and risk committee report, in accordance with International Financial Reporting Standards and in the manner required by the Companies Act of South Africa.
The directors’ responsibility includes: designing, implementing and maintaining internal control relevant to the preparation and fair presentation of these financial statements that are free from material misstatement, whether due to fraud or error; selecting and applying appropriate accounting policies; and making accounting estimates that are reasonable in the circumstances. The board reviews the operation of the system of internal control primarily through the audit and risk committee of Coronation Fund Managers Limited and various other risk monitoring committees.
The directors’ responsibility also includes maintaining adequate accounting records and an effective system of risk management, as well as the preparation of the supplementary schedules included in these financial statements.
The directors have made an assessment of the group’s and company’s ability to continue as a going concern and there is no reason to believe the businesses will not be going concerns in the year ahead.
The auditor is responsible for reporting on whether the consolidated and separate annual financial statements of Coronation Fund Managers Limited are fairly presented in accordance with International Financial Reporting Standards and the Companies Act of South Africa.
APPROVAL OF CONSOLIDATED AND SEPARATE ANNUAL FINANCIAL STATEMENTSThe consolidated and separate annual financial statements of Coronation Fund Managers Limited as identified in the first paragraph for the year ended 30 September 2017 set out on pages 7 to 52 were approved by the board of directors on 22 November 2017 and are signed on its behalf by:
Shams Pather Anton PillayChairman Chief executive officer
22 November 2017 22 November 2017
DECLARATION BY THE COMPANY SECRETARY
In terms of the Companies Act of South Africa (the Act), and for the year ended 30 September 2017, I certify that Coronation Fund Managers Limited has lodged all returns required by the Act with the Companies and Intellectual Property Commission and that all such returns are true, correct and up to date.
Lee-Anne ParenzeeCompany secretary
22 November 2017

3AUDITED ANNUAL FINANCIAL STATEMENTS 20172 TRUST IS EARNED™
AUDIT AND RISK COMMITTEE REPORTTO THE SHAREHOLDERS OF CORONATION FUND MANAGERS LIMITED
The group audit and risk committee of Coronation Fund Managers, which acts as the audit and risk committee for all its subsidiaries, is a committee of the board of directors that serves in an advisory capacity to the board and assists the directors to discharge their duties relating to the safeguarding of assets, the operation of adequate systems, risk management and internal controls, the review of financial information and the preparation of the annual financial statements. This includes satisfying the board that adequate internal, operating and financial controls are in place and that material risks have been identified and are being effectively managed and monitored. In addition to the above, the audit and risk committee also has its own statutory responsibilities.
TERMS OF REFERENCE The audit and risk committee has adopted a formal audit committee charter that has been updated and approved by the board of directors, and has executed its duties during the past financial year in compliance with the terms of reference.
Composition of the audit and risk committee and meeting processThe committee, chaired by Professor Alexandra Watson, an independent director, has three additional independent directors as members (Lulama Boyce, Hugo Nelson and Jock McKenzie). Lulama Boyce was appointed to the committee on 10 October 2017, with Shams Pather resigning on 13 November 2017. The committee met three times during the year with senior management, which included the chief executive officer, certain senior executive management, the chief financial officer, the internal auditor, the group compliance officer and the risk officer.
The external and internal auditors attend these meetings and have unrestricted access to the committee and to its chairman. Ad hoc meetings are held as required.
DutiesIn execution of its statutory duties during the past financial year, the audit and risk committee has:
+ Ensured the appointment as external auditor of the company and its subsidiaries of a registered auditor who, in the opinion of the audit and risk committee, was independent of the company and its subsidiaries.
+ Determined the fees to be paid to the external auditor and such auditor’s terms of engagement. + Ensured that the appointment of the external auditor complies with any legislation relating to the appointment of such auditors. + Determined the nature and extent of any non-audit services which the auditor may provide to the company and its subsidiaries. + Pre-approved any proposed contract with the auditor for the provision of non-audit services to the company and its subsidiaries. + Considered the independence of the external auditors and has concluded that the external auditor has been independent of the company and
its subsidiaries throughout the year taking into account all other non-audit services performed and circumstances known to the committee. + Received and dealt appropriately with any complaints relating to the accounting practices and internal audit of the company and its
subsidiaries, the content or auditing of its financial statements, the internal financial controls of the company and its subsidiaries, or to any related matter.
+ Made submissions to the board on any matter concerning the company’s accounting policies, financial control, records and reporting.

3AUDITED ANNUAL FINANCIAL STATEMENTS 20172 TRUST IS EARNED™
LEGAL REQUIREMENTSThe audit and risk committee has complied with all applicable legal, regulatory and other responsibilities for the financial year.
ANNUAL FINANCIAL STATEMENTSFollowing our review of the consolidated and separate annual financial statements for the year ended 30 September 2017, we are of the opinion that, in all material respects, they comply with the relevant provisions of the Companies Act of South Africa and International Financial Reporting Standards and that they fairly present the financial position at 30 September 2017 for Coronation Fund Managers Limited and the results of operations and cash flows for the year then ended.
In compliance with requirements of the King Report on Governance for South Africa 2016, an integrated annual report has been compiled for the 2017 financial year in addition to these annual financial statements.
Alexandra WatsonChairman of the audit and risk committee
22 November 2017

5AUDITED ANNUAL FINANCIAL STATEMENTS 20174 TRUST IS EARNED™
INDEPENDENT AUDITOR’S REPORTTO THE SHAREHOLDERS OF CORONATION FUND MANAGERS LIMITED
REPORT ON THE AUDIT OF THE CONSOLIDATED AND SEPARATE FINANCIAL STATEMENTS We have audited the consolidated and separate financial statements of Coronation Fund Managers Limited set out on pages 10 to 52, which comprise the consolidated and separate statements of financial position as at 30 September 2017, and the consolidated and separate statements of profit or loss and other comprehensive income, the consolidated and separate statements of changes in equity and the consolidated and separate statements of cash flows for the year then ended, and notes to the consolidated and separate financial statements, including a summary of significant accounting policies.
In our opinion, the consolidated and separate financial statements present fairly, in all material respects, the consolidated and separate financial position of Coronation Fund Managers Limited as at 30 September 2017, and its consolidated and separate financial performance and consolidated and separate cash flows for the year then ended in accordance with International Financial Reporting Standards and the requirements of the Companies Act of South Africa.
Basis for opinionWe conducted our audit in accordance with International Standards on Auditing (ISAs). Our responsibilities under those standards are further described in the Auditor’s Responsibilities for the Audit of the Consolidated and Separate Financial Statements section of our report. We are independent of the group in accordance with the Independent Regulatory Board for Auditors Code of Professional Conduct for Registered Auditors (IRBA Code), the International Ethics Standards Board for Accountants Code of Ethics for Professional Accountants (IESBA Code) and other independence requirements applicable to performing the audit of Coronation Fund Managers Limited. We have fulfilled our other ethical responsibilities in accordance with the IRBA Code, IESBA Code, and in accordance with other ethical requirements applicable to performing the audit of Coronation Fund Managers Limited. We believe that the audit evidence we have obtained is sufficient and appropriate to provide a basis for our opinion.
Key audit mattersKey audit matters are those matters that, in our professional judgement, were of most significance in our audit of the consolidated and separate financial statements of the current period. These matters were addressed in the context of our audit of the consolidated and separate financial statements as a whole, and in forming our opinion thereon, and we do not provide a separate opinion on these matters. For each matter below, our description of how our audit addressed the matter is provided in that context.
We have fulfilled the responsibilities described in the Auditor’s Responsibilities for the Audit of the Consolidated and Separate Financial Statements section of our report, including in relation to these matters. Accordingly, our audit included the performance of procedures designed to respond to our assessment of the risks of material misstatement of the financial statements. The results of our audit procedures, including the procedures performed to address the matters below, provide the basis for our audit opinion on the accompanying financial statements.
KEY AUDIT MATTER HOW THE MATTER WAS ADDRESSED IN THE AUDIT
1. Management and performance feesThe management and performance fees are included in Revenue as set out in note 2 of the consolidated financial statements.
We consider the occurrence and completeness of performance and management fees to be an area of most significance in the audit of the Coronation Fund Managers Limited group. This is as a result of the fees being quantitatively significant to the Group’s annual financial statements and in respect of performance fees, in particular their complexity, having differing terms and conditions, external benchmarks and rolling periods of performance.
Our audit included the following audit procedures, amongst others:
+ Understanding the fee arrangements and mandates with clients through a review of mandates.
+ Assessing whether revenue recognition policies were in terms of International Financial Reporting Standards.
+ Considering the key financial reporting controls implemented by management to accurately recognise and record performance and management fees.
+ Selecting a sample of management and performance fees, and assessing if the fees were calculated in terms of the fee arrangements and mandates with clients.
+ Conducting analytical review procedures over performance fees and management fees. These procedures were conducted with reference to the appropriate asset under management bases.
+ Evaluating performance fees earned in the previous financial year as compared to the current financial year and evaluating variances.
+ Conducting cut-off testing of performance and management fees to determine whether fees are recorded in the appropriate period.
+ Assessing whether management and performance fees were appropriately recorded in the financial statements in terms of the requirements of IFRS.

5AUDITED ANNUAL FINANCIAL STATEMENTS 20174 TRUST IS EARNED™
KEY AUDIT MATTER HOW THE MATTER WAS ADDRESSED IN THE AUDIT
2. InvestmentsAs disclosed in notes 13 and 15.2 the investment securities and investments backing policyholder funds and investments held through investment partnerships are quantitatively significant to the Group. We thus consider the existence and valuation of these investments an area of most significance in the audit of the Coronation Fund Managers Limited group. The investment securities are also used in the calculation of management and performance fee revenue earned by the Group.
Our audit included the following audit procedures amongst others:
+ Understanding the operating model and risk management processes of the group in safeguarding investments, including segregation of duties between responsible parties.
+ Considering and evaluating the key controls implemented by management, and at significant outsourced service providers, to evaluate the risks over the existence and valuation assertions of these investments.
+ Obtaining independent confirmations for a sample of investment securities to confirm the existence thereof.
+ Assessing the reasonableness of the valution assertion for a sample of investments by agreeing, as applicable, values to quoted prices or by assessing the reasonableness of valuation models, assumptions and data inputs used by management to value investments.
Other information The directors are responsible for the other information. The other information comprises the Directors’ report, Audit and risk committee report and the Declaration by the company secretary as required by the Companies Act of South Africa, and the Directors’ responsibility report, Analysis of shareholders, Glossary of financial reporting terms, Shareholders’ diary and corporate information which we obtained prior to the date of this report, and the Integrated Annual Report, which is expected to be made available to us after that date. Other information does not include the consolidated and separate financial statements and our auditor’s report thereon.
Our opinion on the consolidated and separate financial statements does not cover the other information and we do not express an audit opinion or any form of assurance conclusion thereon.
In connection with our audit of the consolidated and separate financial statements, our responsibility is to read the other information and, in doing so, consider whether the other information is materially inconsistent with the consolidated and separate financial statements or our knowledge obtained in the audit, or otherwise appears to be materially misstated. If, based on the work we have performed on the other information obtained prior to the date of this auditor’s report, we conclude that there is a material misstatement of this other information, we are required to report that fact. We have nothing to report in this regard. When we read the Integrated Annual Report, if we conclude that there is a material misstatement therein, we are required to communicate the matter to those charged with governance.
Responsibilities of the directors for the consolidated and separate financial statementsThe directors are responsible for the preparation and fair presentation of the consolidated and separate financial statements in accordance with International Financial Reporting Standards and the requirements of the Companies Act of South Africa, and for such internal control as the directors determine is necessary to enable the preparation of consolidated and separate financial statements that are free from material misstatement, whether due to fraud or error.
In preparing the consolidated and separate financial statements, the directors are responsible for assessing the group’s and company’s ability to continue as a going concern, disclosing, as applicable, matters related to going concern and using the going concern basis of accounting unless the directors either intend to liquidate the group or to cease operations, or have no realistic alternative but to do so.
Auditor’s responsibilities for the audit of the consolidated and separate financial statementsOur objectives are to obtain reasonable assurance about whether the consolidated and separate financial statements as a whole are free from material misstatement, whether due to fraud or error, and to issue an auditor’s report that includes our opinion. Reasonable assurance is a high level of assurance, but is not a guarantee that an audit conducted in accordance with ISAs will always detect a material misstatement when it exists. Misstatements can arise from fraud or error and are considered material if, individually or in the aggregate, they could reasonably be expected to influence the economic decisions of users taken on the basis of these consolidated and separate financial statements.
7AUDITED ANNUAL FINANCIAL STATEMENTS 20176 TRUST IS EARNED™
As part of an audit in accordance with ISAs, we exercise professional judgement and maintain professional scepticism throughout the audit. We also:
+ Identify and assess the risks of material misstatement of the consolidated and separate financial statements, whether due to fraud or error, design and perform audit procedures responsive to those risks, and obtain audit evidence that is sufficient and appropriate to provide a basis for our opinion. The risk of not detecting a material misstatement resulting from fraud is higher than for one resulting from error, as fraud may involve collusion, forgery, intentional omissions, misrepresentations, or the override of internal control.
+ Obtain an understanding of internal control relevant to the audit in order to design audit procedures that are appropriate in the circumstances, but not for the purpose of expressing an opinion on the effectiveness of the group’s and company’s internal control.
+ Evaluate the appropriateness of accounting policies used and the reasonableness of accounting estimates and related disclosures made by the directors.
+ Conclude on the appropriateness of the directors’ use of the going concern basis of accounting and based on the audit evidence obtained, whether a material uncertainty exists related to events or conditions that may cast significant doubt on the group’s and company’s ability to continue as a going concern. If we conclude that a material uncertainty exists, we are required to draw attention in our auditor’s report to the related disclosures in the consolidated or separate financial statements or, if such disclosures are inadequate, to modify our opinion. Our conclusions are based on the audit evidence obtained up to the date of our auditor’s report. However, future events or conditions may cause the group or company to cease to continue as a going concern.
+ Evaluate the overall presentation, structure and content of the consolidated and separate financial statements, including the disclosures, and whether the consolidated and separate financial statements represent the underlying transactions and events in a manner that achieves fair presentation.
+ Obtain sufficient appropriate audit evidence regarding the financial information of the entities or business activities within the group to express an opinion on the consolidated and separate financial statements. We are responsible for the direction, supervision and performance of the group audit. We remain solely responsible for our audit opinion.
We communicate with the directors regarding, among other matters, the planned scope and timing of the audit and significant audit findings, including any significant deficiencies in internal control that we identify during our audit.
We also provide the directors with a statement that we have complied with relevant ethical requirements regarding independence, and to communicate with them all relationships and other matters that may reasonably be thought to bear on our independence, and where applicable, related safeguards.
From the matters communicated with the directors, we determine those matters that were of most significance in the audit of the consolidated and separate financial statements of the current period and are therefore the key audit matters. We describe these matters in our auditor’s report unless law or regulation precludes public disclosure about the matter or when, in extremely rare circumstances, we determine that a matter should not be communicated in our report because the adverse consequences of doing so would reasonably be expected to outweigh the public interest benefits of such communication.
REPORT ON OTHER LEGAL AND REGULATORY REQUIREMENTS In terms of the IRBA Rule published in Government Gazette Number 39475 dated 4 December 2015, we report that Ernst & Young Inc. has been the auditor of Coronation Fund Managers Limited for 7 years.
Ernst & Young Inc.Director: Malcolm RapsonRegistered AuditorChartered Accountant (SA)Waterway House3 Dock RoadWaterfrontCape Town22 November 2017
INDEPENDENT AUDITORS REPORTTO THE SHAREHOLDERS OF CORONATION FUND MANAGERS LIMITED (continued)

7AUDITED ANNUAL FINANCIAL STATEMENTS 20176 TRUST IS EARNED™
DIRECTORS’ REPORT
BUSINESS ACTIVITIESCoronation Fund Managers Limited (Coronation) (registration number 1973/009318/06) is one of southern Africa’s most successful third-party fund management companies. It is a pure fund management business which offers both individual and institutional investors access to local and global expertise across all asset classes.
Our institutional and retail investors include some of the largest retirement funds, medical schemes and multi-manager companies, many of the major banking and insurance groups, selected investment advisory businesses, prominent independent financial advisors, high-net-worth individuals and direct account holders of unit trusts and retirement products in South Africa. We also manage a growing number of global institutional clients.
GROUP RESULTSOur entire range of client portfolios performed very well against a backdrop of strong market gains worldwide. For the year, the MSCI All Country World Index delivered a return of 18.7% and the MSCI Emerging Markets Index added 22.5% (both in US dollar terms), while the FTSE/JSE All Share Index gained 10.2% (in rand terms). Despite ongoing domestic political uncertainty and volatility in the US dollar and euro, the rand exchange rate has been relatively resilient during the 12-month period, with the local currency strengthening by 1.2% against the US dollar (to close at R13.55) and by 3.7% against the euro (to close at R16.01).
As a cyclical business, Coronation’s revenue stream is highly geared to the returns of the market and the level of outperformance it generates on behalf of its clients. While total AUM rose by 2.5% to R614 billion for the full year (September 2016: R599 billion), average AUM declined by 3.5% over the period, contributing to the decline in revenue of 3.1% to R3.9 billion (September 2016: R4.0 billion) for the year. Although certain once-off fixed expenses relating to our retail client reporting and correspondence system and outsourced fund administration function were incurred in the year under review, the decrease in variable expenses resulted in an overall decline of 4.2% in total expenses. The variable cost nature of our business model dampens the impact of a decline in revenue on profits. The combined effect of these factors was a 2.3% decline in diluted headline earnings per share to 437.5 cents (September 2016: 447.6 cents).
FINANCIAL STATEMENTSThe financial statements for the year ended 30 September 2017 have been prepared in accordance with the requirements of International Financial Reporting Standards (IFRS) and the Companies Act of South Africa.
CASH RETURNED TO SHAREHOLDERSWe continue to reward shareholders through regular and significant distributions of free cash flow generated. We endeavour to distribute at least 75% of after-tax cash profit. After assessing any projected future cash requirements, a final gross dividend of 217.0 cents per share has been declared for the year ended 30 September 2017, which has resulted in a final net dividend of 173.6 cents per share for shareholders subject to Dividends Tax (DT). Together with the interim gross dividend of 220.0 cents per share, this amounts to a total gross dividend of 437.0 cents per share for the year.

9AUDITED ANNUAL FINANCIAL STATEMENTS 20178 TRUST IS EARNED™
DIRECTORS’ REPORT (continued)
SUBSIDIARY AND ASSOCIATE COMPANIESDetails of the principal subsidiary and associate companies are set out in note 21.
The group equity accounts its 40% shareholding in Namibia Asset Management Limited.
The group consolidates the Coronation Global Frontiers Fund due to the seed capital invested in the fund being significant relative to the total fund size.
DIRECTORS AND SECRETARYHugo Nelson was appointed as independent non-executive director effective 7 November 2016.
Profiles of directors are provided in the integrated annual report.
Details of the company secretary and the company’s registered address are set out on the inside back cover of this report. The business address of the company secretary is the same as the company’s registered address.
Executive directors are not employed on fixed-term contracts and have standard employment service agreements with a notice period of at least three months.
DIRECTORS’ INTERESTThere were no material contracts entered into during the financial year in which a director or officer of the company had any interest.
The directors’ direct and indirect beneficial interests in the issued share capital of the company were:
BENEFICIAL
DIRECT INDIRECT %
2017Ordinary sharesAnton Pillay 343 889 4 349 969 1.34 John Snalam 547 473 22 351 0.16 Hugo Nelson 3 751 046 2 677 480 1.84
2016Ordinary sharesAnton Pillay 343 889 4 238 297 1.31 John Snalam 547 473 14 296 0.16
There have been no changes in directors’ interest subsequent to year-end up to the date of signing the financial statements.

9AUDITED ANNUAL FINANCIAL STATEMENTS 20178 TRUST IS EARNED™
DIRECTORS’ REMUNERATIONRemuneration paid by subsidiaries for services rendered for the year ended 30 September 2017 were as follows:
SALARY AND CASHOTHER VARIABLE TOTAL TOTAL
BENEFITS REMUNERATION 2017 2016
Executive directors R’000 R’000 R’000 R’000
Anton Pillay 1 619 9 442 11 061 11 418 John Snalam 1 619 2 381 4 000 3 810 Total 3 238 11 823 15 061 15 228
In addition, for non-cash remuneration, refer to the share-based payments and related party notes in the annual financial statements.
Non-executive directors’ remuneration for services rendered to the group were as follows:
BASICFEE
BOARDMEETINGS
AUDIT AND RISK
COMMITTEEMEETINGS
REMU-NERATION
AND NOMINATIONS
COMMITTEEMEETINGS
SOCIAL, ETHICS AND
TRANS-FORMATIONCOMMITTEE
MEETINGSTOTAL
2017TOTAL
2016
Non-executive directors R’000 R’000 R’000 R’000 R’000 R’000 R’000
Shams Pather 108 549 154 241 – 1 052 772 Alexandra Watson 103 294 240 – 98 735 643 Judith February 108 314 77 – 118 617 482 Jock McKenzie 108 314 154 253 – 829 629 Lulama Boyce 103 294 74 – – 471 372 Hugo Nelson 103 294 98 147 – 642 – Total 633 2 059 797 641 216 4 346 2 898
In addition, remuneration for services rendered to subsidiary companies for the year ended 30 September 2017 were as follows:
BASICFEE
BOARDMEETINGS
TOTAL2017
TOTAL2016
Non-executive directors R’000 R’000 R’000 R’000
Shams Pather – 68 68 64 Alexandra Watson – 68 68 64 Lulama Boyce – 68 68 64 Total – 204 204 192
SPECIAL RESOLUTIONSAt the annual general meeting of the company held on 14 February 2017 the following special resolutions were passed:
+ The company was authorised to generally provide any direct or indirect financial assistance contemplated in and subject to the provisions of section 44 and 45 of the Companies Act of South Africa.
+ The company’s remuneration to non-executive directors in respect of the financial year ending 30 September 2017 was approved. + The directors received general authority to repurchase up to 20% of the company’s issued share capital, subject to certain conditions. + To adopt a new MOI for the company in replacement of the current MOI.
EVENTS SUBSEQUENT TO THE REPORTING DATEThe final cash dividend for the 2017 financial year of R759 million (217 cents per share) was declared based on the actual shares in issue of 349 799 102.

11AUDITED ANNUAL FINANCIAL STATEMENTS 201710 TRUST IS EARNED™
CONSOLIDATED STATEMENT OF COMPREHENSIVE INCOMEFOR THE YEAR ENDED 30 SEPTEMBER 2017
2017 2016NOTE R MILLION R MILLION
Fund management activitiesRevenue 2 3 919 4 046
Financial income 43 55
Finance and dividend income 3.1 37 35 Other income 4 6 20
Operating expenses 5 (1 934) (2 019)
Share-based payment expense 6 (6) (7)Other expenses (1 928) (2 012)
Finance expense 3.2 (23) (22)Share of profit of equity-accounted investees 11 8 9 Profit from fund management 2 013 2 069
Income attributable to policyholder linked assets and investment partnerships 2 20
Net fair value gains on policyholder and investment partnership financial instruments 13 45 58
Administration expenses borne by policyholders and investors in investment partnerships 14 (43) (38)
Profit before income tax 2 015 2 089
Income tax expense 7 (492) (515)
Taxation on shareholder profits 7 (490) (495)Taxation on policyholder investment contracts 7 (2) (20)
Profit for the year 1 523 1 574
Other comprehensive income (to be reclassified to profit and loss in future periods) 67 37
Foreign currency translation differences for foreign operations (24) (8)
Net change in fair value of available-for-sale financial assets 91 45
Total comprehensive income for the year 1 590 1 611
Profit attributable to:– equity holders of the company 1 523 1 574 – non-controlling interest – – Profit for the year 1 523 1 574
Total comprehensive income attributable to:– equity holders of the company 1 590 1 611 – non-controlling interest – – Total comprehensive income for the year 1 590 1 611
Earnings per share (cents)– basic 8 435.4 450.0 – diluted 8 435.4 450.0

11AUDITED ANNUAL FINANCIAL STATEMENTS 201710 TRUST IS EARNED™
CONSOLIDATED STATEMENT OF FINANCIAL POSITIONAS AT 30 SEPTEMBER 2017
2017 2016
NOTE R MILLION R MILLION
AssetsIntangible assets 9 1 088 1 088 Equipment 10 21 31 Investments in equity-accounted investees 11 39 37 Deferred tax asset 12 171 162 Investments backing policyholder funds and investments held through
investment partnerships 13 55 721 64 007 Investment securities 15.2 934 1 097 Trade and other receivables 18 558 498 Cash and cash equivalents 564 538 Total assets 59 096 67 458
LiabilitiesLong-term borrowings 16 150 150 Deferred tax liabilities 12 24 25 Policyholder investment contract liabilities and liabilities to holders of interests
in investment partnerships 14 55 718 63 988 Short-term portion of long-term borrowings 16 150 150External investors in consolidated funds – 269 Taxation payable 35 4 Trade and other payables 18 747 694 Total liabilities 56 824 65 280
Net assets 2 272 2 178
EquityShare capital and premium 17 256 256 Retained earnings 1 607 1 586 Reserves 243 200 Total equity attributable to equity holders of the company 2 106 2 042 Non-controlling interest in consolidated funds 166 136 Total equity 2 272 2 178

13AUDITED ANNUAL FINANCIAL STATEMENTS 201712 TRUST IS EARNED™
CONSOLIDATED STATEMENT OF CHANGES IN EQUITYFOR THE YEAR ENDED 30 SEPTEMBER 2017
SHARE CAPITALAND PREMIUM
FOREIGNCURRENCY
TRANSLATION RESERVE
RETAINED EARNINGS
SHARE-BASED PAYMENT RESERVE
REVALUATION RESERVE
ISSUED CAPITALAND RESERVES
ATTRIBUTABLE TOEQUITY HOLDERSOF THE COMPANY
NON-CONTROLLING
INTEREST TOTAL
EQUITY
R MILLION R MILLION R MILLION R MILLION R MILLION R MILLION R MILLION R MILLION
Balance at 30 September 2015 256 163 1 757 22 (29) 2 169 – 2 169
Total comprehensive income for the yearProfit for the year 1 574 1 574 1 574 Other comprehensive income (available to be recycled to profit and loss
in future periods)Currency translation differences (8) (8) (8)Revaluation of available-for-sale financial assets 45 45 45 – Net change in fair value 52 52 52– Reclassified to profit or loss on disposal (7) (7) (7)
Total other comprehensive income (8) 45 37 37 Total comprehensive income for the year – (8) 1 574 – 45 1 611 – 1 611
Transactions with owners recorded directly in equity Share-based payments 7 7 7Dividends paid (1 745) (1 745) (1 745)Non-controlling interest in consolidated funds 136 136 Total transactions with owners – – (1 745) 7 – (1 738) 136 (1 602)Balance at 30 September 2016 256 155 1 586 29 16 2 042 136 2 178
Total comprehensive income for the yearProfit for the year 1 523 1 523 1 523 Other comprehensive income (available to be recycled to profit or loss
in future periods)Currency translation differences (24) (24) (24)Revaluation of available-for-sale financial assets 91 91 91 Total other comprehensive income (24) 91 67 67 Total comprehensive income for the year – (24) 1 523 – 91 1 590 – 1 590
Transactions with owners recorded directly in equityShare-based payments 6 6 6 Transfer to retained earnings 30 (30)Dividends paid (1 532) (1 532) (1 532)Non-controlling interest in consolidated funds 30 30Total transactions with owners – – (1 502) (24) – (1 526) 30 (1 496)Balance at 30 September 2017 256 131 1 607 5 107 2 106 166 2 272

13AUDITED ANNUAL FINANCIAL STATEMENTS 201712 TRUST IS EARNED™
SHARE CAPITALAND PREMIUM
FOREIGNCURRENCY
TRANSLATION RESERVE
RETAINED EARNINGS
SHARE-BASED PAYMENT RESERVE
REVALUATION RESERVE
ISSUED CAPITALAND RESERVES
ATTRIBUTABLE TOEQUITY HOLDERSOF THE COMPANY
NON-CONTROLLING
INTEREST TOTAL
EQUITY
R MILLION R MILLION R MILLION R MILLION R MILLION R MILLION R MILLION R MILLION
Balance at 30 September 2015 256 163 1 757 22 (29) 2 169 – 2 169
Total comprehensive income for the yearProfit for the year 1 574 1 574 1 574 Other comprehensive income (available to be recycled to profit and loss
in future periods)Currency translation differences (8) (8) (8)Revaluation of available-for-sale financial assets 45 45 45 – Net change in fair value 52 52 52– Reclassified to profit or loss on disposal (7) (7) (7)
Total other comprehensive income (8) 45 37 37 Total comprehensive income for the year – (8) 1 574 – 45 1 611 – 1 611
Transactions with owners recorded directly in equity Share-based payments 7 7 7Dividends paid (1 745) (1 745) (1 745)Non-controlling interest in consolidated funds 136 136 Total transactions with owners – – (1 745) 7 – (1 738) 136 (1 602)Balance at 30 September 2016 256 155 1 586 29 16 2 042 136 2 178
Total comprehensive income for the yearProfit for the year 1 523 1 523 1 523 Other comprehensive income (available to be recycled to profit or loss
in future periods)Currency translation differences (24) (24) (24)Revaluation of available-for-sale financial assets 91 91 91 Total other comprehensive income (24) 91 67 67 Total comprehensive income for the year – (24) 1 523 – 91 1 590 – 1 590
Transactions with owners recorded directly in equityShare-based payments 6 6 6 Transfer to retained earnings 30 (30)Dividends paid (1 532) (1 532) (1 532)Non-controlling interest in consolidated funds 30 30Total transactions with owners – – (1 502) (24) – (1 526) 30 (1 496)Balance at 30 September 2017 256 131 1 607 5 107 2 106 166 2 272

15AUDITED ANNUAL FINANCIAL STATEMENTS 201714 TRUST IS EARNED™
CONSOLIDATED STATEMENT OF CASH FLOWSFOR THE YEAR ENDED 30 SEPTEMBER 2017
2017 2016
NOTE R MILLION R MILLION
Cash flows from operating activities Profit from fund management 2 013 2 069Non-cash and other adjustments 22 15 27
Operating cash flows before changes in working capital 2 028 2 096 Working capital changes (5) (18)Increase in trade and other receivables (58) (7)Increase/(decrease) in trade and other payables 53 (11)Cash flows from policyholder and investment partnership activities 23 (977) 833
Cash generated from operations 1 046 2 911 Interest paid (23) (22)Income taxes paid (454) (502)Net cash from operating activities 569 2 387
Cash flows from investing activitiesFinance and dividend income 3.1 37 35 Acquisition of equipment 10 (10) (13)Net disposal/(acquisition) of investment securities 9 (13)Net cash from investing activities 36 9
Cash flows from financing activitiesDividends paid (1 532) (1 745)Net cash from financing activities (1 532) (1 745)
(Decrease)/increase in cash and cash equivalents (927) 651 Net increase/(decrease) in cash and cash equivalents – shareholders 50 (182)Net (decrease)/increase in cash and cash equivalents – policyholders
and investment partnerships (977) 833
Cash and cash equivalents at beginning of year 9 210 8 567 Cash and cash equivalents at beginning of year – shareholders 538 728 Cash and cash equivalents at beginning of year – policyholders
and investment partnerships 8 672 7 839
Effect of exchange rate fluctuations on cash held (24) (8)
Cash and cash equivalents at end of year 8 259 9 210 Cash and cash equivalents at end of year – shareholders 564 538 Cash and cash equivalents at end of year – policyholders
and investment partnerships 7 695 8 672
The above cash flows include the policyholder and investment partnership activities. These cash flows represent net contributions and withdrawals by policyholders and investment partnerships and the related investing activities. Cash and cash equivalents of policyholders and investment partnerships are not available for use by the shareholders of the group.

15AUDITED ANNUAL FINANCIAL STATEMENTS 201714 TRUST IS EARNED™
ACCOUNTING POLICIESFOR THE YEAR ENDED 30 SEPTEMBER 2017
Coronation Fund Managers Limited (Coronation) is incorporated in South Africa. The consolidated financial statements for the year ended 30 September 2017 include the company and its subsidiaries, the group’s interest in associates and consolidated funds. The financial statements were authorised for issue by the directors on 22 November 2017.
STATEMENT OF COMPLIANCEThe financial statements have been prepared in accordance with IFRS and its interpretations issued by the International Accounting Standards Board (IASB) and in the manner required by the Companies Act of South Africa and the SAICA Financial Reporting Guides as issued by the Accounting Practices Committee and Financial Pronouncements as issued by the Financial Reporting Standards Council.
The accounting policies applied in the presentation of the consolidated financial statements are in terms of IFRS and, with the exception of the early adoption of IFRIC 23: Uncertainty over income tax treatments, are consistent with those presented in the previous annual financial statements. The early adoption of IFRIC 23: Uncertainty over income tax treatments has had no impact on the consolidated financial statements. Please see note 19 for more information regarding the relevant uncertain income tax treatments for this reporting period.
BASIS OF PREPARATIONThe financial statements are presented in South African rand, rounded to the nearest million. They are prepared on the going concern and historical cost basis except that the following assets and liabilities are stated at fair value: financial assets and liabilities at fair value through profit or loss and financial assets classified as available-for-sale.
The accounting policies applied in the preparation of these financial statements are set out below. These policies have been consistently applied to all the years presented.
These financial statements have been prepared under the supervision of H Rawoot CA(SA).
BASIS OF CONSOLIDATIONSubsidiariesThe financial statements of subsidiaries are included in the consolidated financial statements from the date that control commences until the date that control ceases.
In the case of the company, investments in subsidiaries are carried at fair value as available-for-sale financial assets.
ConsolidationCoronation applies IFRS 10: Consolidated Financial Statements. The consolidated financial statements combine the financial statements of Coronation and all its subsidiaries. Subsidiaries are entities over which Coronation has control.
The group has control over another entity when the group has all of the following:
+ power over the relevant activities of the investee, for example through voting or other rights; + exposure to, or rights to, variable returns from its involvement with the investee; and + the ability to affect those returns through its power over the investee.
The assessment of control is based on the consideration of all facts and circumstances. The group reassesses whether it controls an investee if facts and circumstances indicate that there are changes to one or more of the three elements of control.
Intra-group transactions and balances are eliminated on consolidation and consistent accounting policies are used throughout the group for the purposes of the consolidation.
Changes in ownership interests in subsidiaries are accounted for as equity transactions if they occur after control has already been obtained and they do not result in loss of control. Details of the principal subsidiaries are given in note 21.
AssociatesThe consolidated financial statements include the group’s share of the income and expenses and equity movements of associates on an equity-accounted basis, from the date that significant influence commences until the date that significant influence ceases. When the group’s share of losses exceeds its interest in an associate, the group’s carrying amount is reduced to nil and recognition of further losses is discontinued except to the extent that the group has incurred legal or constructive obligations or made payments on behalf of an associate.
Investments in associates are initially recognised at cost.
In the case of the company, investments in associates are carried at cost less impairments.
Unrealised gains arising from transactions with associates are eliminated to the extent of the group’s interest in the entity. Unrealised losses are eliminated in the same way as unrealised gains, to the extent that there is no evidence of impairment.
Unconsolidated structured entitiesCoronation applies IFRS 12: Disclosure of Interests in Other Entities to identify unconsolidated structured entities. A structured entity is an entity that has been designed so that voting or similar rights are not the dominant factor in deciding who controls the entity, such as when any voting rights relate to administrative tasks only and the relevant activities are directed by means of contractual arrangements. Any significant assumptions and judgements made by management in determining whether an entity meets the definition of a structured entity, and the details of Coronation’s interest in these entities, are included in note 21.

17AUDITED ANNUAL FINANCIAL STATEMENTS 201716 TRUST IS EARNED™
ACCOUNTING POLICIESFOR THE YEAR ENDED 30 SEPTEMBER 2017 (continued)
FOREIGN CURRENCYForeign currency transactionsTransactions in foreign currencies are translated to the functional currency at the foreign exchange rate ruling at the date of the transaction. Monetary assets and liabilities denominated in foreign currencies at the reporting date are translated to rand at the foreign exchange rate ruling at that date. Foreign exchange differences arising on translation, realisation or settlement are recognised in profit or loss. Non-monetary assets and liabilities that are measured in terms of historical cost in a foreign currency are translated using the exchange rate at the date of the transaction. Non-monetary assets and liabilities denominated in foreign currencies that are stated at fair value are translated to rand at foreign exchange rates ruling at the dates the fair value was determined.
Financial statements of foreign operationsThe assets and liabilities of foreign operations, including goodwill arising on consolidation, are translated to rand at foreign exchange rates ruling at the reporting date.
The income and expenses of foreign operations are translated to rand at rates approximating foreign exchange rates ruling at the dates of the transactions. Foreign exchange differences arising on translation are recognised directly in the foreign currency translation reserve in other comprehensive income. This reserve is reclassified to profit or loss when foreign operations are disposed of.
Foreign exchange gains and losses arising from a monetary item receivable from or payable to a foreign operation, the settlement of which is neither planned nor likely in the foreseeable future, are considered to form part of a net investment in a foreign operation and are recognised on the same basis as the foreign operation.
Net investment in foreign operationsForeign exchange differences arising from the translation of the net investment in foreign operations are taken to a foreign currency translation reserve. They are reclassified into profit or loss upon disposal.
FINANCIAL INSTRUMENTSFinancial assets and financial liabilities are recognised in the statement of financial position when the group becomes a party to the contractual provisions of the instrument.
Financial instruments are initially recognised at their fair value plus, in the case of financial assets and financial liabilities not at fair value through profit or loss, transaction costs that are directly attributable to the acquisition or issue of the financial asset or financial liability.
Purchase and sale transactions in respect of financial assets that require delivery of a financial instrument within the time frame established by market convention are recorded at trade date.
Where available, market prices provide the best evidence of fair value. Where market prices are not available, the fair value is determined by using appropriate valuation techniques.
Financial assets and financial liabilities at fair value through profit or lossFinancial instruments classified as held for trading or designated as at fair value through profit or loss are initially recognised at fair value excluding transaction costs directly attributable to their acquisition which are recognised immediately in profit or loss. After initial recognition, financial assets at fair value through profit or loss are measured at fair value with resulting fair value gains or losses recognised in profit or loss. Financial instruments designated as at fair value through profit or loss are designated as such on initial recognition of the instrument and remain in this classification until derecognition. Financial instruments measured at fair value include investment securities, investments backing policyholder funds, investments held through investment partnerships, policyholder investment contract liabilities and liabilities to holders of interests in investment partnerships.
All investment contract liabilities issued by the group are designated on initial recognition at fair value through profit or loss. This designation significantly reduces a measurement inconsistency that would otherwise arise if these financial liabilities were not measured at fair value since the assets held to back the investment contract liabilities are also measured at fair value. Investments backing policyholder funds and investments held through investment partnerships are held for trading or are designated at fair value through profit or loss since the financial assets are managed and its performance evaluated on a fair value basis, in accordance with a documented risk management or investment strategy, and information about the group is provided internally on that basis to the entity’s key management personnel.
The fair value of linked investment contract liabilities is determined based on the fair value of the associated linked financial assets and is net of the taxation payable on investment gains. Changes in the fair value of these financial instruments are recognised in profit or loss in the period in which they arise. Contributions received from policyholders and benefit payments made to policyholders are not recognised in profit or loss but are accounted for as deposits. The taxation payable is separately disclosed as part of taxation in the statement of comprehensive income.
A financial liability is recognised, and classified as at fair value through profit or loss, for the fair value of external investors’ interest in consolidated funds where the issued units of the fund are classified as financial liabilities in terms of IFRS. The fair value of the external investors in consolidated funds is determined with reference to the quoted prices in an active market of the investments underlying the liability. Changes in the fair value of the external investors in consolidated funds liability are recognised in profit or loss.

17AUDITED ANNUAL FINANCIAL STATEMENTS 201716 TRUST IS EARNED™
Fair value hierarchyFair value is the price that would be received to sell an asset or paid to transfer a liability in an orderly transaction between market participants at the measurement date.
The fair value measurement is based on the presumption that the transaction to sell the asset or transfer the liability takes place either in the principal market for the asset or liability or, in the absence of a principal market, the most advantageous market for the asset or liability. The principal or the most advantageous market must be accessible to the Fund.
Fair values are determined according to the following hierarchy based on the requirements of IFRS 13: Fair Value Measurement:
+ Level 1: Quoted prices (unadjusted) in active markets for identical assets or liabilities. + Level 2: Inputs other than quoted prices included in Level 1 that are observable for the asset or liability, either directly (i.e. as closing prices)
or indirectly (i.e. derived from closing prices). The majority of Level 2 investments are deposits held with financial institutions. The fair values of these deposits are determined using a discounted cash flow valuation methodology based on market rates, reflecting the time value of money and counter party credit risk. The fair values of the policyholder and investment partnership liabilities included in Level 2, are measured with reference to the fair values of the mentioned assets underlying these liabilities.
+ Level 3: Inputs for the asset or liability that are not based on observable market data (significant unobservable inputs).
Loans and receivablesLoans and receivables are financial assets with fixed or determinable payments that are not quoted in an active market. Such assets are recognised initially at fair value plus any directly attributable transaction costs.
Subsequent to initial recognition, loans and receivables are measured at amortised cost using the effective interest method, less impair ment losses.
The amortised cost of a financial asset or liability is the amount at which the financial asset or liability is measured on initial recognition, minus principal repayments, plus or minus the cumulative amortisation using the effective interest method of any difference between the initial amount recognised and the maturity amount, minus any reductions for impairment of financial assets.
Financial assets held at amortised cost comprise cash and cash equivalents, trade and other receivables.
Cash and cash equivalents comprise balances held with banks that are not held for investment purposes.
Financial assets available-for-saleSubsequent to initial recognition, financial assets classified as available-for-sale are measured at fair value on the statement of financial position, with unrealised gains and losses recognised in other comprehensive income, except for impairment losses and foreign exchange gains and losses on available-for-sale monetary items which are recognised in profit or loss. Cumulative realised gains and losses are reclassified to profit or loss in the period in which the asset is realised. If an available-for-sale financial asset is to be impaired, the respective cumulative losses previously recognised in equity are reclassified to profit or loss in the period in which the impairment is identified.
Financial assets available-for-sale consist of investment securities.
Impairment losses on available-for-sale equity instruments are not reversed through profit or loss once recognised in profit or loss.
Other financial liabilitiesOther financial liabilities are subsequently recorded at amortised cost applying the effective interest method. These consist of trade and other payables and interest-bearing borrowings.
Derecognition of financial assets and liabilitiesA financial asset, or a portion thereof, is derecognised when the group’s contractual rights to cash flows have expired; or when the group has transferred its rights to cash flows relating to the financial assets, in a transaction that transfers substantially all the risks and rewards associated with the financial assets.
If the group enters into a transaction whereby it retains substantially all of the risks and rewards of the assets, and retains control of the assets, the assets are not derecognised.
A financial liability is derecognised when it is extinguished; that is, when the obligation is discharged, cancelled or expired.
Derivative instruments The group uses derivative financial instruments to hedge its exposure to foreign exchange and interest rate risks arising from operational, financing and investment activities. The group does not speculate in derivative financial instruments. Derivatives that do not qualify for hedge accounting are accounted for as financial instruments at fair value through profit or loss and the group has not applied hedge accounting in the current or comparative period.
Offsetting of financial assets and financial liabilitiesFinancial assets and financial liabilities are offset when there is both an intention to settle on a net basis or to realise the asset and settle the liability simultaneously and a legal right to offset exists.

19AUDITED ANNUAL FINANCIAL STATEMENTS 201718 TRUST IS EARNED™
ACCOUNTING POLICIESFOR THE YEAR ENDED 30 SEPTEMBER 2017 (continued)
Issued debt and equity financial instrumentsThe components of compound issued financial instruments are accounted for separately, with the liability component separated first at its fair value and any residual amount being allocated to the equity component.
Equity instruments include share capital and share premium. Equity instruments issued by subsidiaries and consolidated funds of Coronation and not held by the group are recorded as non-controlling interests in the statement of financial position.
Equity instruments are initially measured at cost/considerations net of directly attributable issue costs.
Treasury shares represent issued equity of Coronation repurchased by a group company and which have not been cancelled. Treasury shares are deducted from shareholders’ equity and represent the purchase consideration, including directly attributable costs. Where treasury shares are subsequently sold or reissued, net proceeds received are included in shareholders’ equity.
Dividends on ordinary shares are recognised as a deduction from equity in the period in which they are declared to the shareholders.
IMPAIRMENT OF FINANCIAL ASSETSThe group assesses at each reporting date whether there is any objective evidence that a financial asset or group of financial assets, excluding financial assets at fair value through profit or loss, is impaired. A financial asset is considered to be impaired if objective evidence indicates that one or more events have occurred that have a negative effect on the estimated future cash flows of that asset.
Assets measured at amortised costThe group first assesses whether objective evidence of impairment exists individually for financial assets that are individually significant, and individually or collectively for financial assets that are not individually significant. If it is determined that no objective evidence of impairment exists for an individually assessed financial asset, whether significant or not, the asset is included in a group of financial assets with similar credit risk characteristics and that group is collectively assessed for impairment. Assets that are individually assessed for impairment and for which an impairment loss is or continues to be recognised are not included in a collective assessment of impairment.
An impairment loss in respect of a financial asset measured at amortised cost is calculated as the difference between the asset’s carrying amount and the present value of estimated future cash flows (excluding credit losses that have not been incurred) discounted at the financial asset’s original effective interest rate. The carrying amount of the asset is reduced either directly or through use of an allowance account. The impairment loss is recognised in profit or loss.
If, in a subsequent period, the amount of impairment loss decreases and the decrease can be related objectively to an event occurring after the impairment was recognised, the previously recognised impairment loss is reversed. Any subsequent reversal of an impairment loss is recognised in profit or loss, limited to what the carrying value would have been had no impairment loss been recognised in the past.
Available-for-sale financial assetsIf an available-for-sale financial asset is impaired, an amount comprising the difference between its cost (net of any principal payment and amortisation, where relevant) and its current value, less any impairment loss previously recognised in profit or loss, is transferred from other comprehensive income to profit or loss. Reversals of impairment in respect of equity instruments classified as available-for-sale are recognised directly in other comprehensive income.
Reversals of impairment losses on available-for-sale debt instruments are recognised in profit or loss, if the increase in fair value of the instrument can be objectively related to an event occurring after the impairment loss was recognised in profit or loss.
EQUIPMENTEquipment is measured at cost less accumulated depreciation and impairment losses. Cost includes expenditure that is directly attributable to the acquisition of the asset. Purchased software that is integral to the functionality of the equipment is capitalised as part of the equipment. When parts of an item of equipment have different useful lives, they are accounted for as separate items (major components) of equipment.
Depreciation is provided on the depreciable amount of each component on a straight-line basis over the estimated useful life of the component. The depreciable amount related to each component is determined as the difference between the cost and the residual value of the component. The residual value is the estimated amount, net of disposal costs that the group would currently obtain from the disposal of a component of similar age and condition as expected at the end of its useful life. The residual values, estimated useful lives and depreciation methods of equipment are reassessed at each reporting date.
The estimated depreciation rates for each class of equipment for the current and comparative periods are as follows:
+ Computer equipment 33% – 50%
+ Furniture and fittings 10% – 20%
+ Office equipment 20%
Leasehold improvement depreciation rates are determined by reference to the appropriate useful life of its separate components, limited to the period of the operating lease.

19AUDITED ANNUAL FINANCIAL STATEMENTS 201718 TRUST IS EARNED™
Routine maintenance of assets is expensed as incurred. Subsequent expenditure is only capitalised if it is probable that future economic benefits associated with the item will flow to the group.
The carrying amount of an item of equipment is derecognised on disposal or when no future economic benefits are expected from its use or disposal. Any gain or loss on derecognition, determined as the difference between the net disposal proceeds and the carrying amount of the item, is recognised in profit or loss when the item is derecognised.
IMPAIRMENT OF NON-FINANCIAL ASSETS
At each reporting date, the group assesses whether there is any indication that an asset (excluding deferred tax assets) may be impaired. The recoverable amount, being the higher of fair value less costs to sell and value in use, is determined for any asset for which an indication of impairment is identified. For goodwill and intangible assets that have indefinite lives or that are not yet available for use, the recoverable amount is estimated at each reporting date. If the recoverable amount of an asset is less than its carrying value, the carrying value of the asset is reduced to its recoverable amount.
For the purpose of impairment testing, assets are grouped together into the smallest group of assets that generate cash inflows from continuing use that are largely independent of cash inflows of other assets or groups of assets (the ’cash-generating unit’). If there is any indication that an asset may be impaired, the recoverable amount is estimated for the individual asset. If it is not possible to estimate the recoverable amount for the individual asset, the recoverable amount of the cash-generating unit to which the asset belongs will be determined. An impairment loss is recognised if the carrying amount of an asset or its cash-generating unit exceeds its estimated recoverable amount.
Impairment losses are recognised as an expense in profit or loss in the period in which they are identified. An impairment loss in respect of goodwill is not reversed. In respect of other assets, reversal of impairment losses is recognised in profit or loss in the period in which the reversal is identified, to the extent that the asset is not increased to a carrying value higher than it would have been had no impairment loss been recognised for the asset in prior years.
LEASESLeases in terms of which the group as the lessee assumes substantially all the risks and rewards of ownership are classified as finance leases. Other leases are operating leases.
Payments made under operating leases are recognised in profit or loss on a straight-line basis over the term of the lease. Lease incentives are recognised in profit or loss on a straight-line basis over the term of the lease as an integral part of the total lease expense.
INTANGIBLE ASSETS AND GOODWILLGoodwillAll business combinations are accounted for by applying the acquisition method. Goodwill represents amounts arising on acquisition of subsidiaries and associates. Goodwill represents the difference between the cost of the acquisition and the fair value of the net identifiable assets acquired.
Goodwill is stated at cost less any accumulated impairment losses. Goodwill is allocated to cash-generating units and is not amortised but is tested annually for impairment. In respect of equity-accounted investees, the carrying amount of goodwill is included in the carrying amount of the investment in the equity-accounted investee.
A gain on a bargain purchase arising on an acquisition is recognised directly in profit or loss.
Intangible assetsIntangible assets that are acquired by the group are stated at cost less accumulated amortisation and impairment losses.
Expenditure on internally generated goodwill and brands is recognised in profit or loss as an expense as incurred.
Subsequent expenditureSubsequent expenditure on capitalised intangible assets is capitalised only when it increases the future economic benefits embodied in the specific asset to which it relates. All other expenditure is expensed as incurred.
AmortisationAmortisation is charged to profit or loss on a straight-line basis over the estimated useful lives of intangible assets, unless such lives are indefinite, from the date they are available for use.
DerecognitionAn intangible asset is derecognised on disposal or when no future economic benefits are expected from its use or disposal.
EMPLOYEE BENEFITSThe cost of all employee benefits is recognised as an expense during the period in which the employee renders the related service. The accrual for employee entitlements to remuneration and annual leave represents the amount which the group has a present obligation to pay as a result of employees’ services provided by the reporting date. These accruals have been calculated at undiscounted amounts based on current salary rates.

21AUDITED ANNUAL FINANCIAL STATEMENTS 201720 TRUST IS EARNED™
ACCOUNTING POLICIESFOR THE YEAR ENDED 30 SEPTEMBER 2017 (continued)
Defined contribution plansA defined contribution plan is a benefit plan under which an entity pays fixed contributions into a separate legal entity and will have no legal or constructive obligation to pay further amounts. Contributions to defined contribution plans are recognised as an expense in profit or loss as incurred.
Share-based payment transactions with employeesThe group engages in equity-settled share-based payment transactions in respect of services received from employees.
The fair value of the services received in respect of equity-settled share-based payment transactions is determined by reference to the fair value of the shares or share options on the grant date to the employee. The cost of the share-based payment is recognised as an expense, with a corresponding increase in equity, over the vesting period of the grant. The amount recognised as an expense is adjusted to reflect the actual number of instruments that are expected to vest.
The increase in equity arising on the recognition of the share-based payments expense is recorded in the share-based payments reserve. Subsequently, once the transaction which gave rise to the initial expense has reached its conclusion, the portion of the share-based payments reserve which arose as a result of that particular transaction is transferred to retained earnings.
The grant date fair value measurement is based on option pricing models, taking into account the risk-free interest rate, volatility of the underlying equity instrument, expected dividends, share price as at grant date and any market-based performance conditions attaching to the grant.
PROVISIONS, CONTINGENT LIABILITIES AND CONTINGENT ASSETSProvisions are liabilities of uncertain timing or amount, and are recognised if, as a result of a past event, the group has created a legal or constructive obligation that can be estimated reliably and it is probable that an outflow of economic benefits will be required to settle the obligation. Provisions are determined by discounting the expected future cash flows at a pre-tax rate that reflects current market assessments of the time value of money and the risks specific to the liability.
Contingent assets and contingent liabilities are not recognised.
REVENUERevenue from fund management activities comprises fund management fees, service fees and initial charges.
Revenue from services rendered is recognised in profit or loss in proportion to the stage of completion of the transaction at the reporting date. The stage of completion is determined by reference to services rendered to date in terms of the relevant agreements.
Performance fee income is included in management fee income and is recognised as and when the group is unconditionally entitled to the revenue and no contingency with respect to future performance exists.
Revenue is measured at the fair value of the consideration received or receivable, net of value added tax and rebates.
Financial and other incomeFinancial income comprises interest and dividend income. Other income comprises realised and unrealised profits and losses on disposal or gains or losses on revaluation of financial assets, realised and unrealised foreign exchange gains and losses and other sundry income.
Interest income is recognised in profit or loss as it accrues, using the effective interest method. Dividend income is recognised in profit or loss on the date the entity’s right to receive payment is established.
EXPENSESFinance expenseFinance expense comprises interest payable on borrowings calculated using the effective interest method.
Income tax expenseIncome tax on the profit or loss for the year comprises current and deferred tax. Income tax is recognised in profit or loss unless the underlying transaction is recognised in other comprehensive income or equity, in which case the related tax is also recognised in other comprehensive income or equity.
Current tax is the expected tax payable on the taxable income for the year, using tax rates enacted or substantively enacted at the reporting date, and any adjustment to tax payable in respect of previous years.
Deferred tax is recognised in respect of temporary differences between the carrying amounts of assets and liabilities for financial reporting purposes and the amounts used for taxation purposes. The following temporary deductible and taxable differences are not provided for: initial recognition of goodwill not deductible for tax purposes; the initial recognition of assets or liabilities in a transaction that is not a business combination that affects neither accounting nor taxable profit; and differences relating to investments in subsidiaries and associates to the extent that the company is able to control the timing of the reversal of the temporary differences and it is probable that the temporary differences will not reverse in the foreseeable future. The amount of deferred tax provided is based on the expected manner of realisation or settlement of the carrying amount of assets and liabilities, using tax rates that are expected to apply to the period when the asset is realised or the liability is settled, based on the tax rates (and laws) that have been enacted or substantively enacted by the end of the reporting period.

21AUDITED ANNUAL FINANCIAL STATEMENTS 201720 TRUST IS EARNED™
Deferred tax assets and liabilities are offset if there is a legally enforceable right to offset current tax assets and liabilities, and they relate to income taxes levied by the same tax authority on the same taxable entity, or different tax entities, but they intend to settle current tax assets and liabilities on a net basis or if their tax assets and liabilities will be realised simultaneously in each future period in which significant amounts of deferred tax liabilities or assets are expected to be settled or recorded.
A deferred tax asset is recognised only to the extent that it is probable that future taxable profits will be available against which the asset can be utilised. Deferred tax assets are reviewed at the end of each reporting period and are reduced to the extent that it is no longer probable that the related tax benefit will be realised.
Uncertain tax treatments are considered individually or collectively depending on the uncertainty of the impact on the taxation and deferred taxation and how the tax authority will make its examination. Judgements and estimates made in accounting for uncertain tax treatments are reassessed if the facts and circumstances on which the judgement or estimate was based change or as a result of new information. In determining the tax impact of an uncertainty, management considers whether it is probable that the taxation authority, ultimately being the court of law, will accept the uncertain treatment, and, if so no tax liability is raised, otherwise management reflects the uncertainty in estimating the tax liability.
EARNINGS PER SHAREThe group presents basic, diluted and headline earnings per share data for its ordinary shares. Basic earnings per share is based on profit or loss attributable to equity holders of the company, and will not include non-controllable interest, and is calculated on the weighted average number of ordinary shares in issue during the period. Diluted earnings per share is determined by adjusting the profit or loss attributable to ordinary shareholders and the weighted average number of ordinary shares outstanding for the effects of all dilutive potential ordinary shares.
Headline and diluted headline earnings per share is calculated in accordance with the circular titled Headline Earnings issued by the South African Institute of Chartered Accountants.
SEGMENT REPORTINGAn operating segment is a component of the group that engages in business activities from which it may earn revenues and incur expenses, including revenues and expenses that relate to transactions with any of the group’s other components. An operating segment’s operating results are reviewed regularly by the executive committee in order to make decisions about resources to be allocated to the segment and assess its performance, and for which discrete financial information is available. Segment results that are reported to the executive committee include items directly attributable to a segment as well as those that can be allocated on a reasonable basis. Segment capital expenditure is the total cost incurred during the period to acquire property, plant and equipment, and intangible assets other than goodwill.
BLACK ECONOMIC EMPOWERMENT TRANSACTIONSShare-based payment transactionsThe scope of IFRS 2: Share-based Payment includes the group’s B-BBEE ownership initiatives in accordance with international interpretations in this regard. Where goods or services are received from black economic empowerment partners as consideration for equity instruments of the group, then these transactions are accounted for in terms of IFRS 2, even when the goods and services cannot be specifically identified.
MANAGED FUNDS AND TRUST ACTIVITIESCertain companies within the group operate unit trusts and hold and invest funds on behalf of clients. Assets and liabilities representing such activities are not reflected on the statement of financial position, as these relate directly to clients. The values of these items are disclosed in the notes. Income from these activities is brought to account over the period to which the service relates.
KEY MANAGEMENT JUDGEMENTS, ESTIMATES AND ASSUMPTIONSThe preparation of financial statements, in conformity with IFRS, requires management to make judgements, estimates and assumptions that affect the application of policies and reported amounts of assets and liabilities, income and expenses. The estimates and associated assumptions are based on historical experience and various other factors that are believed to be reasonable under the circumstances, the results of which form the basis of making the judgements about carrying values of assets and liabilities that are not readily apparent from other sources. Actual results may differ from these estimates.
The estimates and underlying assumptions are reviewed on an ongoing basis. Revisions to accounting estimates are recognised in the period in which the estimate is revised if the revision affects only that period, or in the period of the revision and future periods if the revision affects both current and future periods.
Key areas in which judgement is applied include:
+ The valuation of unlisted investments is the principal area of judgement applied in the preparation of these financial statements. It is the opinion of the directors that fair value approximates carrying amount.
+ Valuation of the share-based payment expense where inputs are based on observable market inputs, adjusted for factors that specifically apply to the transaction and recognising market volatility (refer note 6).
+ Assessing whether the group controls an investee by assessing the power over the investee, exposure or rights, to variable returns from its involvement with its investee and the ability to use its power over the investee to affect the amount of the groups returns (refer note 21).
+ Assessing the probability of a negative outcome in relation to areas of tax uncertainty. In addition, judgement has been applied in determination of the ultimate tax authority.

23AUDITED ANNUAL FINANCIAL STATEMENTS 201722 TRUST IS EARNED™ 23AUDITED ANNUAL FINANCIAL STATEMENTS 201722 TRUST IS EARNED™
ACCOUNTING POLICIESFOR THE YEAR ENDED 30 SEPTEMBER 2017 (continued)
IFRS, AMENDMENTS AND IFRIC INTERPRETATIONS ISSUED BUT NOT YET EFFECTIVEThe following IFRS and amendments that are relevant to the group have been issued but are not yet effective for the current financial year. The group will adopt these no later than their effective dates, to the extent that they are applicable to its activities. The impact of these is currently being assessed by management in light of internal interpretation and practice in the market.
+ IFRS 2: Share-based PaymentsEffective for annual periods beginning on or after 1 January 2018
The amendments are intended to eliminate diversity in practice, but are narrow in scope and address specific areas of classification and measurement.
+ IFRS 9: Financial InstrumentsEffective for annual periods beginning on or after 1 January 2018
This standard reflects the final phase of the IASB’s work on the replacement of IAS 39. It applies to the classification and measurement of financial assets and financial liabilities as defined in IAS 39; a new general hedge accounting model and a new expected loss impairment model.
+ IFRS 15: Revenue from Contracts with CustomersEffective for annual periods beginning on or after 1 January 2018
The standard emphasises how and when an IFRS reporter will recognise revenue as well as requiring such entities to provide users of financial statements with more informative, relevant disclosures. The standard applies a single, principle-based five-step model to be applied to all contracts with customers.
+ IFRS 16: LeasesEffective for annual periods beginning on or after 1 January 2019
The scope of IFRS 16 includes leases of all assets, with certain exceptions. A lease is defined as a contract, or part of a contract, that conveys the right to use an asset (the underlying asset) for a period of time in exchange for consideration. IFRS 16 requires lessees to account for all leases under a single on-balance sheet model in a similar way to finance leases under IAS 17.
+ IFRS 17: Insurance ContractsEffective for annual periods beginning on or after 1 January 2021
IFRS 17 applies to all types of insurance contracts (i.e., life, non-life, direct insurance and re-insurance), regardless of the type of entities that issue them, as well as to certain guarantees and financial instruments with discretionary participation features. A few scope exceptions will apply.
+ IFRIC 22 Foreign Currency Transactions and Advance Consideration Effective for annual periods beginning on or after 1 January 2018
The interpretation clarifies that in determining the spot exchange rate to use on initial recognition of the related asset, expense or income (or part of it) on the derecognition of a non-monetary asset or non-monetary liability relating to advance consideration, the date of the transaction is the date on which an entity initially recognises the non-monetary asset or non-monetary liability arising from the advance consideration. If there are multiple payments or receipts in advance, then the entity must determine a date of the transactions for each payment or receipt of advance consideration.
+ IAS 7: Statement of Cash FlowsEffective for annual periods beginning on or after 1 January 2017
The amendments to IAS 7 Statement of Cash Flows are part of the IASB’s Disclosure Initiative and require an entity to provide disclosures that enable users of financial statements to evaluate changes in liabilities arising from financing activities, including both changes arising from cash flows and non-cash changes.
+ IAS 12: Income TaxesEffective for annual periods beginning on or after 1 January 2017
The amendments clarify that an entity needs to consider whether tax law restricts the sources of taxable profits against which it may make deductions on the reversal of that deductible temporary difference. Furthermore, the amendments provide guidance on how an entity should determine future taxable profits and explains in which circumstances taxable profit may include the recovery of some assets for more than their carrying amount.

23AUDITED ANNUAL FINANCIAL STATEMENTS 201722 TRUST IS EARNED™ 23AUDITED ANNUAL FINANCIAL STATEMENTS 201722 TRUST IS EARNED™
NOTES TO THE CONSOLIDATED FINANCIAL STATEMENTSFOR THE YEAR ENDED 30 SEPTEMBER 2017
1 OPERATING SEGMENTS Segment information is presented in respect of the group’s operating segments based on geographical location. The international segment
consists of internationally domiciled funds and clients as well as South African clients with international mandates.
Inter-segment pricing is determined on an arm’s length basis.
Segment results, assets and liabilities include items directly attributable to a segment as well as those that can be allocated on a reasonable basis. Segment capital expenditure is the total cost incurred during the year to acquire segment assets that are expected to be used for more than one period.
Each segment’s operating profitability is measured based on segment results and the segment’s income from fund management.
AFRICA INTERNATIONAL GROUP
2017 2016 2017 2016 2017 2016
R MILLION R MILLION R MILLION R MILLION R MILLION R MILLION
Segment reportFund management Segment external revenue 2 525 2 690 1 394 1 356 3 919 4 046
Segment operating expenses (1 461) (1 501) (473) (518) (1 934) (2 019)Share-based payment expense (6) (7) – – (6) (7)Other expenses (1 455) (1 494) (473) (518) (1 928) (2 012)
Segment result 1 064 1 189 921 838 1 985 2 027
Segment financial income 40 57 3 (2) 43 55 Finance and dividend income 34 33 3 2 37 35Other income/(expense) 6 24 – (4) 6 20
Segment finance expense (23) (21) – (1) (23) (22)Share of profit of equity-accounted
investees 8 9 – – 8 9Segment income from fund
management 1 089 1 234 924 835 2 013 2 069
Income attributable to policyholder linked assets and investment partnerships 2 20
Net fair value gains on policyholder and investment partnership financial instruments 45 58
Administration expenses borne by policyholders and investors in investment partnerships (43) (38)
Profit before income tax 2 015 2 089Income tax expense (492) (515)Taxation on shareholder profits (490) (495)Taxation on policyholder
investment contracts (2) (20)
Profit for the year 1 523 1 574
Attributable to: – equity holders of the company 1 523 1 574– non-controlling interest – – Profit for the year 1 523 1 574

25AUDITED ANNUAL FINANCIAL STATEMENTS 201724 TRUST IS EARNED™
AFRICA INTERNATIONAL GROUP
2017 2016 2017 2016 2017 2016
R MILLION R MILLION R MILLION R MILLION R MILLION R MILLION
1 OPERATING SEGMENTS (continued)Segment report (continued)Segment assets 1 626 1 286 451 878 2 077 2 164 Intangible assets 1 088 1 088 Investment in equity-accounted investee 39 37 Deferred tax assets 171 162 Investments backing policyholder funds
and investments held through investment partnerships 55 721 64 007
Total assets 1 626 1 286 451 878 59 096 67 458
Segment liabilities 866 808 181 455 1 047 1 263 Deferred tax liabilities 24 25 Policyholder investment contract
liabilities and liabilities to holders of interests in investment partnerships 55 718 63 988
Taxation payable 35 4 Total liabilities 866 808 181 455 56 824 65 280
Major customers
None of the group’s customers individually represent revenue in excess of 10% of the group’s total revenue.
NOTES TO THE CONSOLIDATED FINANCIAL STATEMENTSFOR THE YEAR ENDED 30 SEPTEMBER 2017 (continued)

25AUDITED ANNUAL FINANCIAL STATEMENTS 201724 TRUST IS EARNED™
2017 2016
R MILLION R MILLION
2 REVENUEManagement, performance and service fees 3 919 4 046
3 FINANCE AND DIVIDEND INCOME AND EXPENSE3.1 Finance and dividend income
Finance income on available-for-sale financial assets 1 1 Finance income from loans and receivables 30 28 Dividend income on financial assets at fair value through profit or loss 6 6
37 35 3.2 Finance expense
Finance expense on interest-bearing borrowings 23 22 23 22
4 OTHER INCOMEProfit on disposal of available-for-sale financial assets – 9 Foreign exchange gains 1 – Revaluation of financial assets at fair value through profit or loss 4 7 Gain on disposal of group operations – 2 Other sundry gains 1 2
6 20
5 OPERATING EXPENSESare stated after taking into account:Auditor’s remuneration: audit fees– current year 3 3 – prior year 2 2 Depreciation 20 20 Distribution expenses 242 394 Fund administration services 161 124 Foreign exchange losses – 19 Information technology and communication costs 126 84 Loss on disposal of available-for-sale financial assets 10 –Marketing expenses 78 88 Operating lease payments 27 28 Personnel expenses (including executive directors' remuneration)– salaries and incentive compensation 1 088 1 100 – provident fund contributions 36 33 – social security costs 5 6 – share-based payment expense 6 7
Details of the directors’ remuneration and their interests are disclosed in the directors’ report on pages 8 to 9 and in notes 6 and 20.
Coronation retirement fund All employees are members of a defined contribution provident fund, which is governed by the Pension Funds Act, 24 of 1956, as amended. No valuation is performed as the liability of the fund cannot exceed its assets. Other than ongoing contributions charged against income as incurred, the group has no further retirement benefit obligations.

27AUDITED ANNUAL FINANCIAL STATEMENTS 201726 TRUST IS EARNED™
6 SHARE-BASED PAYMENT EXPENSEShare transactions Coronation Investments and Trading Limited (CIT) offered Coronation shares to employees of the group. The sale of shares is restricted while an employee is employed by Coronation. The compensation benefit which was required to be spread over the vesting period was approximated by the intrinsic value of the offer, being the difference between the market share price and the offer price on grant date.
1 February 2005– Assumed employee turnover rate per annum 5.0%– Number of shares 9 931 668– Vesting period 31 January 2008 to 31 January 2010– Closing share price on grant date (cents per share) 402– Offer price (cents per share) 150– Restriction on sale while employed one third
1 April 2005– Assumed employee turnover rate per annum 5.0%– Number of shares 13 600 000– Vesting period 15 April 2008 to 15 April 2010– Closing share price on grant date (cents per share) 395– Offer price (cents per share) 150– Restriction on sale while employed 13 600 000
2017 2016
NUMBER NUMBER
Details of number of restricted shares held during the year
At beginning of year 23 531 668 23 531 668 At end of year 23 531 668 23 531 668
B-BBEE transactionCoronation established the Imvula Trust to facilitate its B-BBEE transactions. On 1 April 2005, the Imvula Trust acquired 10% of Coronation Investment Management Proprietary Limited from Coronation. The acquisition consideration amounted to R147 million, based on a price per Coronation share of R3.85, and was funded by the issue of redeemable preference shares to a third-party financier. The funding was guaranteed by Coronation and the Imvula Trust was consolidated into the group’s financial statements. The Imvula Trust was no longer consolidated into the group as from 28 February 2013.
During 2014, the Imvula II Trust was formed to house unallocated units. A board of trustees was established to nominate the beneficiaries of the Imvula II Trust who will, upon fulfilment of certain conditions, have an interest in the underlying shares held by the Imvula Trust. Performance and service conditions impact the vesting period of the shares, which ranges from three to five years. The majority of these units have been allocated to beneficiaries as at 30 September 2017.
The fair value was estimated at the date of the sale in 2005 using an option valuation model. The inputs into the model were as follows: + Assumed employee forfeiture rate per annum 5% + Dividend yield 6.5% + Fair value at grant date (cents per share) 385
NOTES TO THE CONSOLIDATED FINANCIAL STATEMENTSFOR THE YEAR ENDED 30 SEPTEMBER 2017 (continued)

27AUDITED ANNUAL FINANCIAL STATEMENTS 201726 TRUST IS EARNED™
2017 2016
R MILLION R MILLION
6 SHARE–BASED PAYMENT EXPENSE (continued)Expense charged to profit or lossB-BBEE transaction 6 7Total expense 6 7
Equity–based remuneration of executive directors
CIT TRANSACTION (CORONATION SHARES)
RESTRICTED BALANCE
1 OCTOBER 2016 GRANTED VESTED VESTING DATE
RESTRICTED BALANCE
30 SEPTEMBER 2017
MARKET VALUE30 SEPTEMBER
2017R’000
2017Anton Pillay 125 000 – – – 125 000 8 413
RESTRICTED BALANCE
1 OCTOBER 2015 GRANTED VESTED VESTING DATE
RESTRICTED BALANCE
30 SEPTEMBER 2016
MARKET VALUE30 SEPTEMBER
2016R’000
2016Anton Pillay 125 000 – – – 125 000 8 780
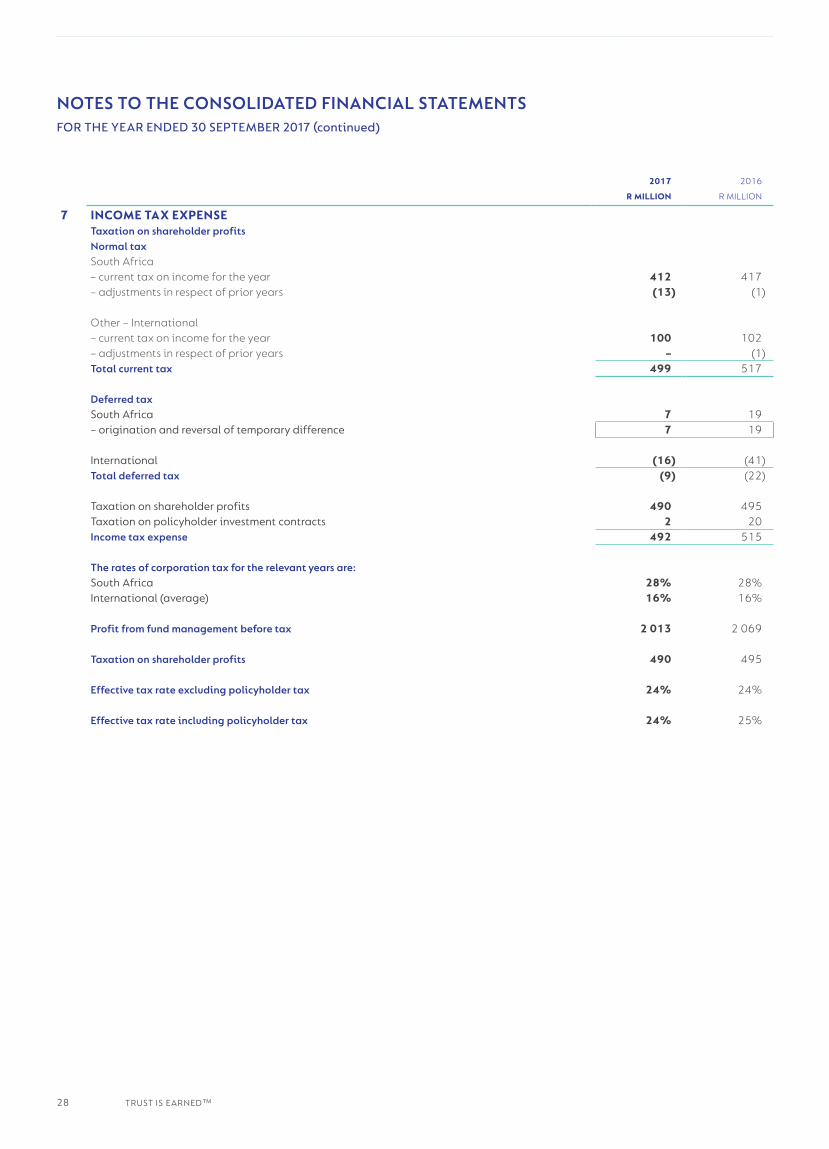
29AUDITED ANNUAL FINANCIAL STATEMENTS 201728 TRUST IS EARNED™
2017 2016
R MILLION R MILLION
7 INCOME TAX EXPENSETaxation on shareholder profitsNormal taxSouth Africa– current tax on income for the year 412 417 – adjustments in respect of prior years (13) (1)
Other – International– current tax on income for the year 100 102 – adjustments in respect of prior years – (1)Total current tax 499 517
Deferred taxSouth Africa 7 19 – origination and reversal of temporary difference 7 19
International (16) (41)Total deferred tax (9) (22)
Taxation on shareholder profits 490 495 Taxation on policyholder investment contracts 2 20 Income tax expense 492 515
The rates of corporation tax for the relevant years are:South Africa 28% 28%International (average) 16% 16%
Profit from fund management before tax 2 013 2 069
Taxation on shareholder profits 490 495
Effective tax rate excluding policyholder tax 24% 24%
Effective tax rate including policyholder tax 24% 25%
NOTES TO THE CONSOLIDATED FINANCIAL STATEMENTSFOR THE YEAR ENDED 30 SEPTEMBER 2017 (continued)

29AUDITED ANNUAL FINANCIAL STATEMENTS 201728 TRUST IS EARNED™
2017 2016
R MILLION R MILLION
7 INCOME TAX EXPENSE (continued)Reconciliation of taxation on shareholder profits The tax charge is different to the standard rate as detailed below:Tax on profit from fund management before tax, at SA rate of 28% 564 579 Effect of tax rates in foreign jurisdictions (81) (84)Share-based payment expense 2 2 Non-deductible expenses 20 7 Non-taxable income – (5)Overprovided in prior years (13) (2)Effect of equity-accounted profits included net of tax (2) (2)Taxation on shareholder profits 490 495
Tax on policyholder investment contractsCurrent taxSouth Africa– current tax on income for the year 19 73
Deferred taxSouth Africa (17) (53)Tax on policyholder investment contracts 2 20
Income tax expense 492 515
8 EARNINGS PER SHAREBasic earnings per share (cents) CENTS CENTS
Basic earnings per share is calculated by dividing the earnings attributable to ordinary shareholders by the weighted number of ordinary shares in issue during the year. 435.4 450.0
NUMBER’000
NUMBER’000
Issued ordinary shares at beginning of year 349 799 349 799 Weighted average number of ordinary shares in issue during the year 349 799 349 799 Adjusted weighted number of ordinary shares potentially in issue 349 799 349 799
R MILLION R MILLION
Earnings attributable to shareholders 1 523 1 574Non-controlling interest – –Earnings attributable to ordinary shareholders 1 523 1 574

31AUDITED ANNUAL FINANCIAL STATEMENTS 201730 TRUST IS EARNED™
2017 2016
CENTS CENTS
8 EARNINGS PER SHARE (continued)Diluted earnings per share (cents)Diluted earnings per share is calculated by dividing the earnings attributable to ordinary
shareholders, adjusted for the effects of dilutive ordinary potential shares, by the weighted average number of shares in issue during the year plus the weighted average number of ordinary shares potentially in issue. 435.4 450.0
R MILLION R MILLION
Earnings attributable to shareholders 1 523 1 574 Diluted earnings attributable to ordinary shareholders 1 523 1 574
Headline earnings per share (cents)Headline earnings per share has been calculated in accordance with the circular titled Headline Earnings issued by the South African Institute of Chartered Accountants
EARNINGS
NON- ATTRIBUTABLE
PROFIT CONTROLLING TO ORDINARY
BEFORE TAX TAX INTEREST SHAREHOLDERS PER SHARE
R MILLION R MILLION R MILLION R MILLION CENTS
2017Per the financial statements 2 015 (492) – 1 523 435.4Adjustments:– Loss on disposal of investments 10 (3) – 7 2.1 Headline earnings 2 025 (495) – 1 530 437.5
Diluted headline earnings per share (cents) 1 530 437.5
2016Per the financial statements 2 089 (515) – 1 574 450.0 Adjustments:– Gain on disposal of group operations (2) – – (2) (0.4) – Profit on disposal of investments (9) 2 – (7) (2.0) Headline earnings 2 078 (513) – 1 565 447.6
Diluted headline earnings per share (cents) 1 565 447.6
2017 2016
Dividends per share CENTS CENTS
Dividend distribution– interim: declared 23 May 2017 (2016: 17 May 2016) 220 229
– final: declared 20 November 2017 (2016: 14 November 2016) 217 218Total dividend 437 447
NOTES TO THE CONSOLIDATED FINANCIAL STATEMENTSFOR THE YEAR ENDED 30 SEPTEMBER 2017 (continued)

31AUDITED ANNUAL FINANCIAL STATEMENTS 201730 TRUST IS EARNED™
2017 2016
R MILLION R MILLION
9 INTANGIBLE ASSETSGoodwill (cost) 1 088 1 088Total 1 088 1 088
Substantially all goodwill arose on the acquisition of the group’s Africa fund management operations and is allocated to this cash-generating unit for impairment testing purposes. The recoverable amount of goodwill has been assessed at the reporting dates based on a Level 3 fair value hierarchy valuation of this business, with reference to the group’s traded share price, Africa assets under management and applying a discount factor for the listed premium derived from external industry sources. The recoverable amount significantly exceeded the carrying value of goodwill. No goodwill impairment is thus required.
COMPUTER FURNITURE OFFICE LEASEHOLD
EQUIPMENT AND FITTINGS EQUIPMENT IMPROVEMENTS TOTAL
R MILLION R MILLION R MILLION R MILLION R MILLION
10 EQUIPMENT2017CostAt beginning of year 92 16 10 6 124 Additions 8 – 2 – 10Disposals (1) – – – (1)Exchange adjustments – – – – – At end of year 99 16 12 6 133
Accumulated depreciationAt beginning of year (66) (13) (10) (4) (93)Depreciation (18) (1) (1) – (20)Disposals 1 – – – 1 Exchange adjustments – – – – – At end of year (83) (14) (11) (4) (112)Net carrying value – 2017 16 2 1 2 21
2016CostAt beginning of year 83 15 10 4 112 Additions 10 1 – 2 13 Disposals (1) – – – (1)Exchange adjustments – – – – – At end of year 92 16 10 6 124
Accumulated depreciationAt beginning of year (51) (12) (9) (3) (75)Depreciation (17) (1) (1) (1) (20)Disposals 1 – – – 1 Exchange adjustments 1 – – – 1 At end of year (66) (13) (10) (4) (93)Net carrying value – 2016 26 3 – 2 31

33AUDITED ANNUAL FINANCIAL STATEMENTS 201732 TRUST IS EARNED™
2017 2016
R MILLION R MILLION
11 INVESTMENT IN EQUITY-ACCOUNTED INVESTEESAnalysis of the movement in our share of net assets:At beginning of year 37 41 Share of profit from equity–accounted investee 8 9 Sale of 8% of associate – (6)Dividends received (6) (7)At end of year 39 37
Summary financial information of equity-accounted investees:
OWNERSHIP ASSETS LIABILITIES EQUITY REVENUE PROFIT
COUNTRY % R MILLION R MILLION R MILLION R MILLION R MILLION
2017Namibia Asset Management
Limited Namibia 40.05 21 6 15 33 8
OWNERSHIP ASSETS LIABILITIES EQUITY REVENUE PROFIT
COUNTRY % R MILLION R MILLION R MILLION R MILLION R MILLION
2016Namibia Asset Management
Limited Namibia 40.05 21 7 14 37 9
NOTES TO THE CONSOLIDATED FINANCIAL STATEMENTSFOR THE YEAR ENDED 30 SEPTEMBER 2017 (continued)

33AUDITED ANNUAL FINANCIAL STATEMENTS 201732 TRUST IS EARNED™
ASSETS LIABILITIES NET
2017R MILLION
2016R MILLION
2017R MILLION
2016R MILLION
2017R MILLION
2016R MILLION
12 DEFERRED TAX Deferred tax assets and liabilities are attributable to the following:Employee benefits 160 159 – – 160 159 Provisions and prepayments 11 3 – – 11 3 Unrealised fair value adjustments
on financial assets– shareholders – – (22) (5) (22) (5)– policyholders – – (2) (20) (2) (20)Net deferred tax assets/liabilities 171 162 (24) (25) 147 137
Movement in temporary differences during the year
BALANCE2016
R MILLION
RECOGNISED IN PROFIT
OR LOSSR MILLION
RECOGNISED IN OTHER COMPRE-HENSIVE INCOME
R MILLION
FOREIGNCURRENCY
TRANSLATIONDIFFERENCES
R MILLION
BALANCE2017
R MILLION
Employee benefits 159 2 – (1) 160 Provisions and prepayments 3 8 – – 11 Unrealised fair value adjustments
on financial assets (25) 16 (8) (7) (24) 137 26 (8) (8) 147
BALANCE2015
RECOGNISED IN PROFIT
OR LOSS
RECOGNISED IN OTHER COMPRE-HENSIVE INCOME
FOREIGNCURRENCY
TRANSLATIONDIFFERENCES
BALANCE2016
R MILLION R MILLION R MILLION R MILLION R MILLION
Employee benefits 136 24 – (1) 159 Provisions and prepayments – 3 – – 3 Unrealised fair value adjustments
on financial assets (69) 51 (7) – (25) 67 78 (7) (1) 137

35AUDITED ANNUAL FINANCIAL STATEMENTS 201734 TRUST IS EARNED™
2017 2016
R MILLION R MILLION
13 INVESTMENTS BACKING POLICYHOLDER FUNDS AND INVESTMENTS HELD
THROUGH INVESTMENT PARTNERSHIPSNet fair value gains on policyholder and investment partnership financial instrumentsInvestment income 2 882 3 181 Realised and unrealised gains on financial assets 1 644 2 731 Increase in liabilities to policyholders and holders of redeemable interests in
investment partnerships (4 481) (5 854) 45 58
Policyholder and investment partnership investmentsEquities 18 005 22 493Mining 2 741 3 563 Banks, insurance and financial services 3 366 4 846 Industrial, retail and other sectors 11 857 14 049 Unlisted investments 41 35
Derivative financial instruments 13 9 Real estate funds and property loan stock companies 5 786 6 169 Interest-bearing stocks, debentures and other loans 13 522 14 789 Deposits at financial institutions 7 695 8 672Domestic unit trusts 2 607 2 371 Mutual funds 7 673 8 903 International bonds 33 23 Unsettled trades 239 353 55 573 63 782
Investments at book value 57 334 64 264 Unrealised investment losses (1 761) (482)Partnership trade receivables 148 225 Balance at end of year 55 721 64 007
Comprising:Investments backing policyholder funds 51 967 57 971 Investments held through investment partnerships 3 754 6 036
55 721 64 007
14 POLICYHOLDER INVESTMENT CONTRACT LIABILITIES AND LIABILITIES
TO HOLDERS OF INTERESTS IN INVESTMENT PARTNERSHIPSMovement in financial liability:Balance at beginning of year 62 056 64 263
20 115 21 574 Contributions from policyholders and investors 17 233 18 393 Investment income 2 882 3 181
(29 647) (26 512)Withdrawals by policyholders and investors (29 602) (26 454)Operating expenses (43) (38)Taxation on policyholder investment contracts (2) (20)
Realised and unrealised net fair value gains on investments designated at fair value through profit or loss backing policyholder funds and holders of interest in investment partnerships 1 644 2 731
Balance at end of year 54 168 62 056 Trade payables 579 207 Short positions 972 1 724 Deferred tax 2 20 Balance at end of year 55 721 64 007
NOTES TO THE CONSOLIDATED FINANCIAL STATEMENTSFOR THE YEAR ENDED 30 SEPTEMBER 2017 (continued)
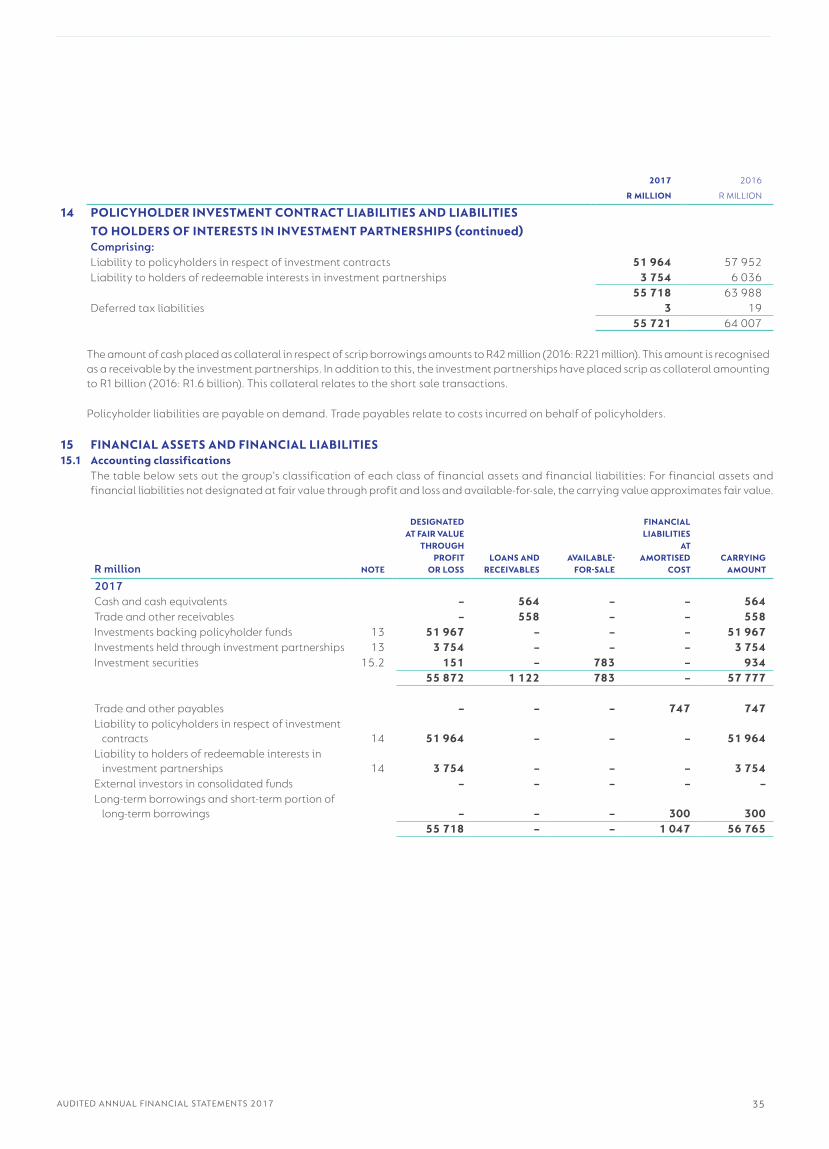
35AUDITED ANNUAL FINANCIAL STATEMENTS 201734 TRUST IS EARNED™
2017 2016
R MILLION R MILLION
14 POLICYHOLDER INVESTMENT CONTRACT LIABILITIES AND LIABILITIES
TO HOLDERS OF INTERESTS IN INVESTMENT PARTNERSHIPS (continued)Comprising:Liability to policyholders in respect of investment contracts 51 964 57 952 Liability to holders of redeemable interests in investment partnerships 3 754 6 036
55 718 63 988 Deferred tax liabilities 3 19
55 721 64 007
The amount of cash placed as collateral in respect of scrip borrowings amounts to R42 million (2016: R221 million). This amount is recognised as a receivable by the investment partnerships. In addition to this, the investment partnerships have placed scrip as collateral amounting to R1 billion (2016: R1.6 billion). This collateral relates to the short sale transactions.
Policyholder liabilities are payable on demand. Trade payables relate to costs incurred on behalf of policyholders.
15 FINANCIAL ASSETS AND FINANCIAL LIABILITIES15.1 Accounting classifications
The table below sets out the group’s classification of each class of financial assets and financial liabilities: For financial assets and financial liabilities not designated at fair value through profit and loss and available-for-sale, the carrying value approximates fair value.
R million NOTE
DESIGNATEDAT FAIR VALUE
THROUGH PROFIT
OR LOSSLOANS AND
RECEIVABLESAVAILABLE-
FOR-SALE
FINANCIALLIABILITIES
ATAMORTISED
COSTCARRYING
AMOUNT
2017Cash and cash equivalents – 564 – – 564 Trade and other receivables – 558 – – 558 Investments backing policyholder funds 13 51 967 – – – 51 967 Investments held through investment partnerships 13 3 754 – – – 3 754 Investment securities 15.2 151 – 783 – 934
55 872 1 122 783 – 57 777
Trade and other payables – – – 747 747Liability to policyholders in respect of investment
contracts 14 51 964 – – – 51 964 Liability to holders of redeemable interests in
investment partnerships 14 3 754 – – – 3 754 External investors in consolidated funds – – – – – Long-term borrowings and short-term portion of
long-term borrowings – – – 300 300 55 718 – – 1 047 56 765

37AUDITED ANNUAL FINANCIAL STATEMENTS 201736 TRUST IS EARNED™
15 FINANCIAL ASSETS AND FINANCIAL LIABILITIES (continued)15.1 Accounting classifications and fair values (continued)
R million NOTE
DESIGNATEDAT FAIR VALUE
THROUGH PROFIT
OR LOSSLOANS AND
RECEIVABLESAVAILABLE-
FOR-SALE
FINANCIALLIABILITIES
ATAMORTISED
COSTCARRYING
AMOUNT
2016Cash and cash equivalents – 538 – – 538 Trade and other receivables – 498 – – 498 Investments backing policyholder funds 13 57 971 – – – 57 971 Investments held through investment partnerships 13 6 036 – – – 6 036 Investment securities 15.2 147 – 950 – 1 097
64 154 1 036 950 – 66 140
Trade and other payables – – – 694 694 Liability to policyholders in respect of investment
contracts 14 57 952 – – – 57 952 Liability to holders of redeemable interests in
investment partnerships 14 6 036 – – – 6 036 External investors in consolidated funds 269 – – – 269 Long-term borrowings and short-term portion of
long-term borrowings – – – 300 300 64 257 – – 994 65 251
2017 2016
R MILLION R MILLION
15.2 Investment securitiesFinancial assets available-for-sale– Mutual funds and unit trusts 464 263 – Listed equities and bonds in respect of consolidated funds 319 687
Financial assets at fair value through profit and loss– Unit trusts 151 147
934 1 097
16 LONG-TERM AND SHORT-TERM PORTION OF LONG-TERM BORROWINGSLong-term borrowingsBalance at beginning of year 150 300Interest accrued 22 21 Interest paid (22) (21)Reclassified as short-term – (150)
150 150
Short-term portion of long-term borrowingsBalance at beginning of year 150 – Reclassified as short-term – 150
150 150
Cumulative redeemable preference shares with dividends linked to prime are payable on a quarterly basis, with R150 million capital repayments due on 31 March 2018 and 1 April 2020. The latter was previously due on 31 March 2017, with the terms now renegotiated. Interest on both tranches are reflected within the interest on long-term borrowings table above.
NOTES TO THE CONSOLIDATED FINANCIAL STATEMENTSFOR THE YEAR ENDED 30 SEPTEMBER 2017 (continued)

37AUDITED ANNUAL FINANCIAL STATEMENTS 201736 TRUST IS EARNED™
2017 2016
R’000 R’000
17 SHARE CAPITALAuthorised750 000 000 (2016: 750 000 000) ordinary shares of 0.01 (2016: 0.01) cent per share 75 75
Issued, allotted and fully paidNUMBER
(’000)NUMBER
(’000)
Number of ordinary sharesAt beginning of year 349 799 349 799Issued during the year – –At end of year 349 799 349 799
R MILLION R MILLION
Share capital and premium 256 256
Unissued sharesUnissued shares are under the control of the directors until the forthcoming annual general meeting.
Shareholders with a direct or indirect beneficial interest of 5% or more in shares are disclosed on page 53.

39AUDITED ANNUAL FINANCIAL STATEMENTS 201738 TRUST IS EARNED™
18 FINANCIAL RISK DISCLOSURESThe group is exposed to market risk, credit risk, liquidity risk, price risk, interest rate risk and currency risk through a combination of the nature of its operations, the financial instruments of which it is a party and the location of its operations.
This note represents information about the group’s exposure to each of the above risks, the group’s objectives, policies and processes for measuring and managing risk, and the group’s management of capital. Further quantitative disclosures are included throughout these consolidated financial statements.
Risk management and control are integral to the governance of the group as more fully explained in the integrated report. There has been no change in the documented risk and control policies in the current year.
The board of directors has overall responsibility for the establishment and oversight of the group’s risk management framework. The board has established the audit and risk committee, which is responsible for developing and monitoring the group’s risk management policies. The committee reports regularly to the board of directors on its activities.
The group’s risk management policies are established to identify and analyse the risks faced by the group, to set appropriate risk limits and controls, and to monitor risks and adherence to limits. Risk management policies and systems are reviewed regularly to reflect changes in market conditions, products and services offered. The group, through its training and management standards and procedures, aims to develop a disciplined and constructive control environment, in which all employees understand their roles and obligations.
The group audit and risk committee is responsible for monitoring compliance with the group’s risk management policies and procedures, and for reviewing the adequacy of the risk management framework in relation to the risks faced by the group. The group audit and risk committee is assisted in these functions by internal audit. Internal audit undertakes both regular and ad hoc reviews of risk management controls and procedures, the results of which are reported to the audit and risk committee.
The market and credit risk associated with the financial assets held to back investment contract liabilities issued by a group company is borne in its entirety by policyholders. The liquidity risk associated with the company being contractually obligated to repay policyholders on demand, is managed through the investment composition of assets included in the policyholder portfolios and by contract with the policyholders. Such contracts mitigate the liquidity risk faced by the company and passes this on to policyholders in the ordinary course of business and in the event that substantial withdrawals require large scale disinvestment of the assets in these portfolios. The investment composition at 30 September is provided in note 13.
The assets held through limited liability investment partnerships which the group is deemed to control and which are therefore consolidated, are held to back the investors’ interests in these partnerships. The financial assets within these investment partnerships are subject to a variety of financial risks (market and credit risk), all of which are borne by the investors into these partnerships. Fluctuations in the values of these assets directly impact the carrying value of the group’s financial liabilities to the holders of redeemable interests in these partnerships. By virtue of the fact that these investment partnerships are permitted in terms of their investment mandates to use leverage in their investment strategies and the fact that certain companies in the group are the general partner to these partnerships, exposes the group to the residual risk of any shortfall in the net assets of the partnerships – refer note 13. This risk is considered remote and a financial loss to the group would require the limited partners or investors into these partnerships to lose all of the capital they have contributed, together with investment returns earned.
As explained above, the group’s exposure to financial risk arising from the financial assets and liabilities relating to investment partnerships is negligible and therefore no further analysis is required to be presented.
Credit riskCredit risk is the risk of financial loss to the group if a customer or counterparty to a financial instrument fails to meet its contractual obligations.
Financial assets which are subject to credit risk consist principally of cash and receivables. Management has a credit policy in place and the exposure to credit risk is monitored on an ongoing basis.
Investments are allowed only in liquid securities and only with counterparties that have high credit ratings.
At the reporting date, the majority of cash and cash equivalents were held with one financial institution. The maximum exposure to credit risk is represented by the carrying amount of each financial asset in the statement of financial position.
NOTES TO THE CONSOLIDATED FINANCIAL STATEMENTSFOR THE YEAR ENDED 30 SEPTEMBER 2017 (continued)

39AUDITED ANNUAL FINANCIAL STATEMENTS 201738 TRUST IS EARNED™
18 FINANCIAL RISK DISCLOSURES (continued)Credit risk (continued)At the reporting date, the group’s financial assets exposed to credit risk amounted to the following:
CARRYING AMOUNT
2017 2016
R MILLION R MILLION
Trade and other receivables 558 498 Cash and cash equivalents 564 538 1 122 1 036
The ageing of trade and other receivables at the reporting date was:
Not past due 423 429 Past due 0 – 30 days 27 21 Past due 31 – 120 days 50 48 Past due 121 – 365 days 58 – Total 558 498
None of the trade receivables are considered to be impaired. Trade and other receivables have not been discounted as the impact of discounting is considered to be insignificant.
Trade and other receivables comprise fees receivable.
Capital adequacy The group comprises financial services providers. As such the various operating entities in the group are subject to the financial services
regulations in the jurisdictions in which they operate.
These are as follows: + South Africa – Financial Services Board of South Africa (FSB) + United Kingdom – Financial Conduct Authority (FCA) + Ireland – Ireland Financial Services Regulatory Authority (IFSRA)
All of these bodies have prescribed minimum capital requirements for financial service entities operating in their jurisdiction. As such, the group ensures ongoing compliance with these requirements.
Capital adequacy is ensured by means of compliance with the regulations set out above. All operating entities have complied with all externally imposed capital requirements throughout the year. There have been no material changes in the group’s management of capital during the year.
Liquidity risk Liquidity risk is the risk that the group will not be able to meet its financial obligations as they fall due. The group’s approach to managing
liquidity risk is to ensure, as far as possible, that it will always have sufficient liquidity to meet its liabilities when due, under normal and stressed conditions, without incurring unacceptable losses or risking damage to the group’s reputation.
Amounts due to policyholders is the fair value of the underlying assets, and the amount at which these assets are realised will be paid to policyholders.
Amounts due to external investors in consolidated funds were carried at the fair value of the underlying assets.
The two tranches of cumulative redeemable preference shares were issued by Coronation Investment Management SA Proprietary Limited on 31 March 2014 and 31 March 2015.
These tranches are repayable on 31 March 2018 and 31 March 2020 respectively. The latter was previously due on 31 March 2017, with the terms now renegotiated.
For more information on these cumulative redeemable preference shares, see note 16.

41AUDITED ANNUAL FINANCIAL STATEMENTS 201740 TRUST IS EARNED™
18 FINANCIAL RISK DISCLOSURES (continued) Liquidity risk (continued) The following are the contractual maturities of short-term financial liabilities, including estimated interest payments and excluding the
impact of netting agreements:
R MILLIONCARRYING
AMOUNTCONTRACTUAL
CASH FLOWS6 MONTHS
OR LESS6 – 12
MONTHS
30 September 2017Non-derivative financial liabilitiesTrade and other payables 747 (747) (747) – Short-term portion of long-term borrowings 150 (150) (150) –
897 (897) (897) –
30 September 2016Trade and other payables 694 (694) (694) – Short-term portion of long-term borrowings 150 (150) (150) –
844 (844) (844) –
Trade and other payables relate to operating expenses incurred in the ordinary course of business.
Market risk Market risk is the risk that changes in market prices, such as foreign exchange rates, interest rates and equity prices will affect the group’s
income or the value of its holdings of financial instruments. The objective of market risk management is to manage and control market risk exposures within acceptable parameters, while optimising the return on the risk.
The revenues and profit generation of the group are linked to the value of assets under management. Movements in equity markets and interest rates, currency exchange rates and commodity prices that adversely affect the value of assets under management will impact the group’s revenues and reported profits. In the event that performance benchmarks are not met, the group may be exposed to underperformance rebates. The group manages this risk through its structured investment process. The value of assets under management at the reporting date is as follows:
2017 2016
R BILLION R BILLION
Assets under management
Fair value of assets under management – by geographical regionAfrica 438 444 International 176 155
614 599
The group earned an average revenue margin of 64 basis points (2016: 63 basis points) on assets under management.
NOTES TO THE CONSOLIDATED FINANCIAL STATEMENTSFOR THE YEAR ENDED 30 SEPTEMBER 2017 (continued)

41AUDITED ANNUAL FINANCIAL STATEMENTS 201740 TRUST IS EARNED™
18 FINANCIAL RISK DISCLOSURES (continued) Interest rate risk
The following table provides an analysis of the financial assets and liabilities of the group and indicates those categories that are interest sensitive and their contractual maturities.
NON-
1 YEAR INTEREST-
R MILLION TOTAL OR LESS 1 – 5 YEARS BEARING
2017 AssetsTrade and other receivables 558 – – 558Cash and cash equivalents 564 564 – –
1 122 564 – 558LiabilitiesLong-term borrowings 150 – 150 –Short-term portion of long-term borrowings 150 150 – –Trade and other payables 747 – – 747
1 047 150 150 747
2016 AssetsTrade and other receivables 498 – – 498 Cash and cash equivalents 538 538 – –
1 036 538 – 498 LiabilitiesLong-term borrowings 150 – 150 – Short-term portion of long-term borrowings 150 150 – –Trade and other payables 694 – – 694
994 150 150 694
South African cash balances earn interest at a rate of prime minus 4.5% per annum. Foreign cash balances earn negligible interest rates.
Price risk The group is exposed to other price risks in respect of its investments in mutual funds, unit trusts, listed equities and bonds as per note
15.2 and consequently for external investors in consolidated funds. A reasonable possible change in the price of the investments as per note 15.2 of 10%, with other variables held constant, would result in a corresponding gain or loss recognised in profit or loss in the case of financial instruments designated as fair value through profit and loss or other comprehensive income in the case of financial assets designated as available-for-sale.

43AUDITED ANNUAL FINANCIAL STATEMENTS 201742 TRUST IS EARNED™
18 FINANCIAL RISK DISCLOSURES (continued) Foreign currency risk
In respect of other monetary assets and liabilities held in currencies other than the rand, the group ensures that the net exposure is kept to an acceptable level by buying or selling foreign currencies at spot rates where necessary to address short-term imbalances.
The following currency profile analyses the group’s financial assets and liabilities according to the currencies in which they are held at 30 September 2017. The totals are then expressed in the equivalent rand amount (in millions). In the prior year, the vast majority of the liability for external investors in consolidated funds of R269 million was exposed to USD, whilst in the current year no external investors in consolidated funds exist.
R MILLIONCURRENCY ZAR EUR GBP USD Total
Exchange rate 1.0000 15.9766 18.1337 13.5386 2017AssetsTrade and other receivables 482 3 9 64 558Cash and cash equivalents 201 55 6 302 564
683 58 15 366 1 122 LiabilitiesLong-term borrowings and short-term portion
of long-term borrowings 300 300 Trade and other payables 707 1 19 20 747
1 007 1 19 20 1 047
R MILLIONCURRENCY ZAR EUR GBP USD Total
Exchange rate 1.0000 15.4175 17.8088 13.73242016AssetsTrade and other receivables 442 3 8 45 498 Cash and cash equivalents 197 10 7 324 538
639 13 15 369 1 036 LiabilitiesLong-term borrowings and short-term portion
of long-term borrowings 300 – – – 300 Trade and other payables 657 1 19 17 694
957 1 19 17 994
NOTES TO THE CONSOLIDATED FINANCIAL STATEMENTSFOR THE YEAR ENDED 30 SEPTEMBER 2017 (continued)

43AUDITED ANNUAL FINANCIAL STATEMENTS 201742 TRUST IS EARNED™
18 FINANCIAL RISK DISCLOSURES (continued) Foreign currency risk (continued) Sensitivity analysis A 10% strengthening of the rand against the following currencies at 30 September would have decreased equity and profit or loss by
the amounts shown below.
This analysis assumes that all other variables, in particular interest rates, remain constant. The analysis is performed on the same basis for 2016.
R MILLION EQUITY PROFIT OR LOSS
30 September 2017EUR – (6)GBP – –USD – (35)
30 September 2016EUR – (1) GBP – –USD – (35)
A 10% weakening of the rand against the above currencies at 30 September 2017 would have had the equal but opposite effect on the above currencies to the amounts shown above, on the basis that all other variables remain the same.
Fair value hierarchy + Level 1: Quoted prices (unadjusted) in active markets for identical assets or liabilities. The fair value of policyholder and investment
partnership liabilities that are included in Level 1 of the hierarchy, are measured with reference to the quoted prices in an active market of the investments underlying the liabilities.
+ Level 2: Inputs other than quoted prices included in Level 1 that are observable for the asset or liability, either directly (i.e. as closing prices) or indirectly (i.e. derived from closing prices). The majority of Level 2 investments are deposits held with financial institutions. The fair values of these deposits are determined using a discounted cash flow valuation methodology based on market rates, reflecting the time value of money and counter party credit risk. The fair values of the policyholder and investment partnership liabilities included in Level 2, are measured with reference to the fair values of the mentioned assets underlying these liabilities. Cash and cash equivalent balances along with their related liabilities of R2 253 million (2016: R2 170 million) have been excluded from the below table in current and prior years respectively.
+ Level 3: Inputs for the asset or liability that are not based on observable market data (significant unobservable inputs).
R MILLIONLEVEL 1
RESTATED*LEVEL 2
RESTATED* LEVEL 3 TOTAL
2017Investments backing policyholder funds and investments
held through investment partnerships 46 960 6 508 – 53 468 Investment securities 933 – 1 934
47 893 6 508 1 54 402 Policyholder, external investor and investment
partnership liabilities – 53 465 – 53 465
2016Investments backing policyholder funds and investments
held through investment partnerships 54 520 7 317 – 61 837Investment securities 1 060 – 37 1 097
55 580 7 317 37 62 934Policyholder, external investor and investment
partnership liabilities 269 61 818 – 62 087
* Policyholder, external investor and investment partnership liabilities to the value of R54 520 million as at 30 September 2016 previously categorised as level 1 have been restated as level 2. These changes have been made to more appropriately reflect the nature of the fair value of the liability.
During the current reporting period, it was determined that transfers between levels of the assets and liabilities held at fair value occurred. A net amount of R222 million in debentures were transferred from Level 1 to Level 2 as these are now considered to be held in an inactive market. Fair value for all other financial assets and liabilities have not been presented because they are not carried at fair value and their carrying amounts approximate fair value.
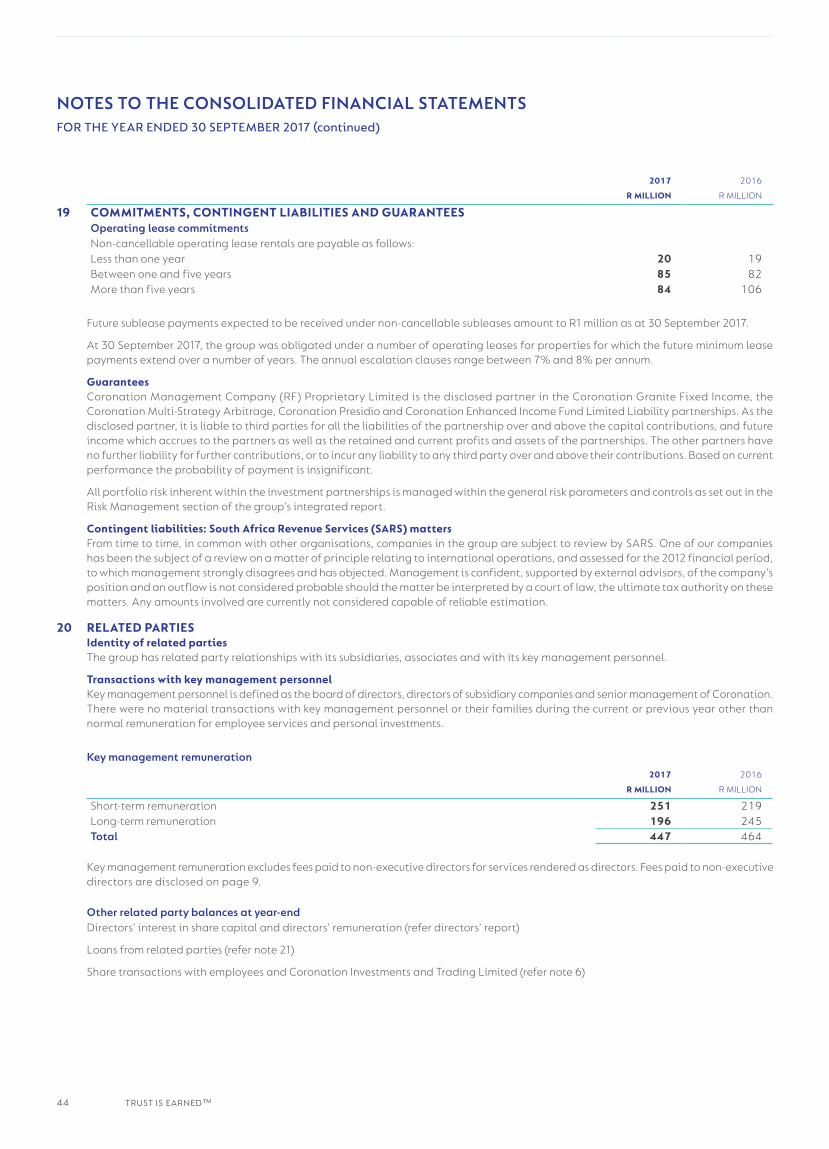
45AUDITED ANNUAL FINANCIAL STATEMENTS 201744 TRUST IS EARNED™
2017 2016
R MILLION R MILLION
19 COMMITMENTS, CONTINGENT LIABILITIES AND GUARANTEESOperating lease commitmentsNon-cancellable operating lease rentals are payable as follows:Less than one year 20 19 Between one and five years 85 82 More than five years 84 106
Future sublease payments expected to be received under non-cancellable subleases amount to R1 million as at 30 September 2017.
At 30 September 2017, the group was obligated under a number of operating leases for properties for which the future minimum lease payments extend over a number of years. The annual escalation clauses range between 7% and 8% per annum.
GuaranteesCoronation Management Company (RF) Proprietary Limited is the disclosed partner in the Coronation Granite Fixed Income, the Coronation Multi-Strategy Arbitrage, Coronation Presidio and Coronation Enhanced Income Fund Limited Liability partnerships. As the disclosed partner, it is liable to third parties for all the liabilities of the partnership over and above the capital contributions, and future income which accrues to the partners as well as the retained and current profits and assets of the partnerships. The other partners have no further liability for further contributions, or to incur any liability to any third party over and above their contributions. Based on current performance the probability of payment is insignificant.
All portfolio risk inherent within the investment partnerships is managed within the general risk parameters and controls as set out in the Risk Management section of the group’s integrated report.
Contingent liabilities: South Africa Revenue Services (SARS) mattersFrom time to time, in common with other organisations, companies in the group are subject to review by SARS. One of our companies has been the subject of a review on a matter of principle relating to international operations, and assessed for the 2012 financial period, to which management strongly disagrees and has objected. Management is confident, supported by external advisors, of the company’s position and an outflow is not considered probable should the matter be interpreted by a court of law, the ultimate tax authority on these matters. Any amounts involved are currently not considered capable of reliable estimation.
20 RELATED PARTIES Identity of related parties The group has related party relationships with its subsidiaries, associates and with its key management personnel.
Transactions with key management personnel Key management personnel is defined as the board of directors, directors of subsidiary companies and senior management of Coronation.
There were no material transactions with key management personnel or their families during the current or previous year other than normal remuneration for employee services and personal investments.
Key management remuneration
2017 2016
R MILLION R MILLION
Short-term remuneration 251 219 Long-term remuneration 196 245 Total 447 464
Key management remuneration excludes fees paid to non-executive directors for services rendered as directors. Fees paid to non-executive directors are disclosed on page 9.
Other related party balances at year-endDirectors’ interest in share capital and directors’ remuneration (refer directors’ report)
Loans from related parties (refer note 21)
Share transactions with employees and Coronation Investments and Trading Limited (refer note 6)
NOTES TO THE CONSOLIDATED FINANCIAL STATEMENTSFOR THE YEAR ENDED 30 SEPTEMBER 2017 (continued)
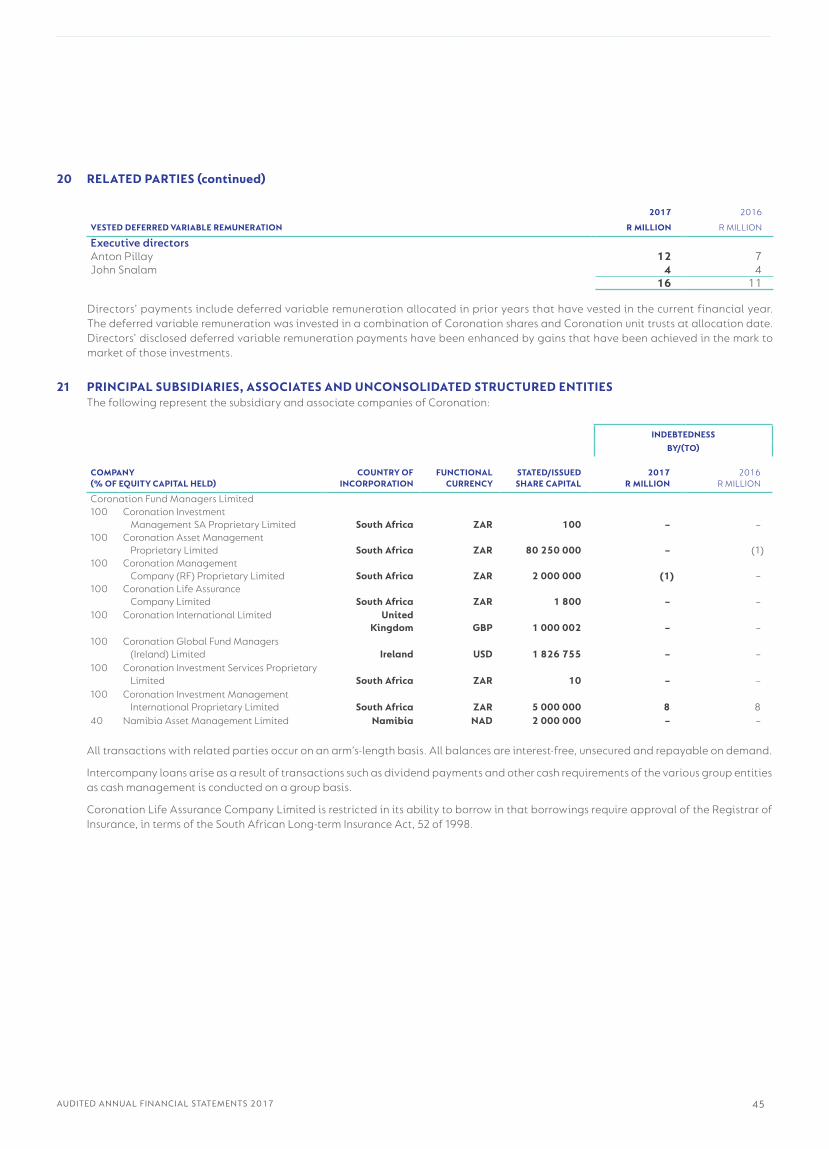
45AUDITED ANNUAL FINANCIAL STATEMENTS 201744 TRUST IS EARNED™
20 RELATED PARTIES (continued)
2017 2016
VESTED DEFERRED VARIABLE REMUNERATION R MILLION R MILLION
Executive directorsAnton Pillay 12 7John Snalam 4 4
16 11
Directors’ payments include deferred variable remuneration allocated in prior years that have vested in the current financial year. The deferred variable remuneration was invested in a combination of Coronation shares and Coronation unit trusts at allocation date. Directors’ disclosed deferred variable remuneration payments have been enhanced by gains that have been achieved in the mark to market of those investments.
21 PRINCIPAL SUBSIDIARIES, ASSOCIATES AND UNCONSOLIDATED STRUCTURED ENTITIES
The following represent the subsidiary and associate companies of Coronation:
INDEBTEDNESS
BY/(TO)
COMPANY(% OF EQUITY CAPITAL HELD)
COUNTRY OFINCORPORATION
FUNCTIONALCURRENCY
STATED/ISSUEDSHARE CAPITAL
2017R MILLION
2016R MILLION
Coronation Fund Managers Limited100 Coronation Investment
Management SA Proprietary Limited South Africa ZAR 100 – –100 Coronation Asset Management
Proprietary Limited South Africa ZAR 80 250 000 – (1)100 Coronation Management
Company (RF) Proprietary Limited South Africa ZAR 2 000 000 (1) –100 Coronation Life Assurance
Company Limited South Africa ZAR 1 800 – –100 Coronation International Limited United
Kingdom GBP 1 000 002 – –100 Coronation Global Fund Managers
(Ireland) Limited Ireland USD 1 826 755 – –100 Coronation Investment Services Proprietary
Limited South Africa ZAR 10 – –100 Coronation Investment Management
International Proprietary Limited South Africa ZAR 5 000 000 8 840 Namibia Asset Management Limited Namibia NAD 2 000 000 – –
All transactions with related parties occur on an arm’s-length basis. All balances are interest-free, unsecured and repayable on demand.
Intercompany loans arise as a result of transactions such as dividend payments and other cash requirements of the various group entities as cash management is conducted on a group basis.
Coronation Life Assurance Company Limited is restricted in its ability to borrow in that borrowings require approval of the Registrar of Insurance, in terms of the South African Long-term Insurance Act, 52 of 1998.

47AUDITED ANNUAL FINANCIAL STATEMENTS 201746 TRUST IS EARNED™
Principal subsidiariesThe group has access to the assets and liabilities of all principal subsidiaries other than policyholder assets and liabilities. Details of policyholder assets and liabilities are included in notes 13 and 14.
Structured entitiesA structured entity is an entity in which voting or similar rights are not the dominant factor in deciding control. Structured entities are generally created to achieve a narrow and well-defined objective with restrictions around their ongoing activities.
Depending on the group’s power over the activities of the entity and its exposure to and ability to influence its own returns, it may consolidate the entity. In other cases it may sponsor or have exposure to such an entity but not consolidate it.
Consolidated structured entitiesThe group has no equity interest in the following limited liability partnerships, which are consolidated based on control:
+ Coronation Granite Fixed Income Fund Partnership + Coronation Multi-Strategy Arbitrage Fund Partnership + Coronation Presidio Fund Partnership + Coronation Enhanced Income Fund Partnership
Details regarding the group’s contractual commitments to these partnerships are included in note 19.
The group also consolidates the Coronation Global Frontiers Fund due to the seed capital invested in the fund, relative to the total fund size, being significant. The group interest in the fund is 48% (2016: 48%). The non-controlling interest in consolidated funds arises as a result of the continued consolidation of the Coronation Global Frontiers Fund. The group’s interest in the Coronation Global Equity Select Fund was diluted in the period and the fund is no longer consolidated. Investment securities and external investors in consolidated funds were reduced by R269 million on deconsolidation. The deconsolidation had no cash nor profit and loss impact in the current year.
Unconsolidated structured entitiesThe CFM Deferred Remuneration Trust, the Imvula Trust and the Imvula II Trust are unconsolidated structured entities.
Refer to note 6 for information relating to the Imvula Trust and The Imvula II Trust.
The CFM Deferred Remuneration Trust, a deferred variable remuneration trust (the Trust), is not consolidated as it is a completely separate entity from the group and decisions are made by independent trustees solely for the benefit of beneficiaries (employees). Trustees consider guidance from the Coronation remuneration and nominations committee when making such decisions. The objective of the Trust is to incentivise the employees of the group by acquiring restricted equity instruments (either CFM shares and/or other products that are managed by Coronation) for the benefit of the employees. The group annually transfers 30% of its profits before tax, after deducting amounts allocated for variable remuneration and restraint of trade payments, to the Trust.
This reward system takes cognisance of the long term and instruments vest in the beneficiary over a period of three to seven years. The group’s remuneration policy and reward system aims to be consistent with and promote sound and effective risk management. It is desirable to increase the employee equity ownership in the business. Through the use of employee ownership and the Trust, the group discourages risk taking which is inconsistent with the risk profiles, rules or instruments of incorporation of the entities being managed.
Once this amount has been transferred to the Trust, the group does not bear any risk relating to instruments purchased by the Trust. Risks related to fluctuations in the value of these instruments are borne by the beneficiaries. The group is neither an income nor capital beneficiary of the Trust.
The group does not receive any income from the Trust; however, it does pay an administrative charge to facilitate the activities of the Trust on an ongoing basis.
21 PRINCIPAL SUBSIDIARIES, ASSOCIATES AND UNCONSOLIDATED STRUCTURED
ENTITIES (continued)
NOTES TO THE CONSOLIDATED FINANCIAL STATEMENTSFOR THE YEAR ENDED 30 SEPTEMBER 2017 (continued)
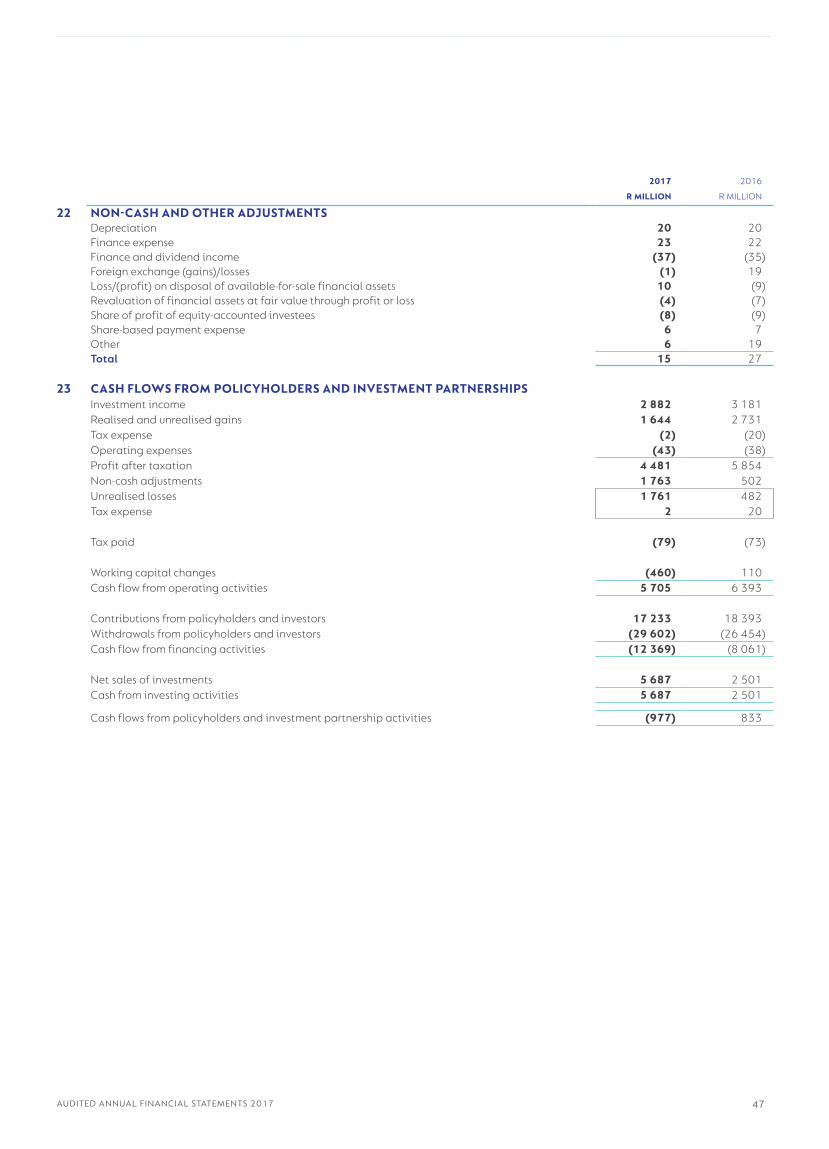
47AUDITED ANNUAL FINANCIAL STATEMENTS 201746 TRUST IS EARNED™
2017 2016
R MILLION R MILLION
22 NON-CASH AND OTHER ADJUSTMENTSDepreciation 20 20 Finance expense 23 22 Finance and dividend income (37) (35)Foreign exchange (gains)/losses (1) 19 Loss/(profit) on disposal of available-for-sale financial assets 10 (9)Revaluation of financial assets at fair value through profit or loss (4) (7)Share of profit of equity-accounted investees (8) (9)Share-based payment expense 6 7 Other 6 19Total 15 27
23 CASH FLOWS FROM POLICYHOLDERS AND INVESTMENT PARTNERSHIPSInvestment income 2 882 3 181 Realised and unrealised gains 1 644 2 731 Tax expense (2) (20)Operating expenses (43) (38)Profit after taxation 4 481 5 854 Non-cash adjustments 1 763 502 Unrealised losses 1 761 482 Tax expense 2 20
Tax paid (79) (73)
Working capital changes (460) 110 Cash flow from operating activities 5 705 6 393
Contributions from policyholders and investors 17 233 18 393 Withdrawals from policyholders and investors (29 602) (26 454)Cash flow from financing activities (12 369) (8 061)
Net sales of investments 5 687 2 501 Cash from investing activities 5 687 2 501
Cash flows from policyholders and investment partnership activities (977) 833

49AUDITED ANNUAL FINANCIAL STATEMENTS 201748 TRUST IS EARNED™
COMPANY STATEMENT OF COMPREHENSIVE INCOMEFOR THE YEAR ENDED 30 SEPTEMBER 2017
2017 2016
NOTE R MILLION R MILLION
Dividend income from subsidiaries 1 538 1 757Finance income 1 1Operating expenses (7) (5)Profit before income tax 1 532 1 753Income tax expense b – – Profit for the year 1 532 1 753
Other comprehensive income (to be reclassified to profit and loss in future periods)
Change in fair value of financial assets available-for-sale c (1 029) 1 732Total comprehensive income for the year 503 3 485

49AUDITED ANNUAL FINANCIAL STATEMENTS 201748 TRUST IS EARNED™
COMPANY STATEMENT OF FINANCIAL POSITIONAS AT 30 SEPTEMBER 2017
2017 2016
NOTE R MILLION R MILLION
AssetsInvestment in subsidiaries c 23 541 24 570 Loan to group company d 8 8 Total assets 23 549 24 578
LiabilitiesLoan from group company d 1 1Total liabilities 1 1
Net assets 23 548 24 577
EquityShare capital and premium e 905 905 Retained earnings 1 431 1 431 Revaluation reserve 21 212 22 241 Total equity 23 548 24 577

51AUDITED ANNUAL FINANCIAL STATEMENTS 201750 TRUST IS EARNED™
COMPANY STATEMENT OF CHANGES IN EQUITY FOR THE YEAR ENDED 30 SEPTEMBER 2017
SHARE CAPITAL RETAINED REVALUATION TOTAL
AND PREMIUM EARNINGS RESERVE EQUITY
R MILLION R MILLION R MILLION R MILLION
Balance at 30 September 2015 905 1 423 20 509 22 837
Total comprehensive income for the yearProfit for the year – 1 753 – 1 753
Other comprehensive income (available to be recycled to profit and loss in future periods)
Revaluation of financial assets available-for-sale – – 1 732 1 732 Total comprehensive income for the year – 1 753 1 732 3 485
Transactions with owners recorded directly to equityDividends paid – (1 745) – (1 745)
Total transactions with owners – (1 745) – (1 745)
Balance at 30 September 2016 905 1 431 22 241 24 577
Total comprehensive income for the yearProfit for the year – 1 532 – 1 532
Other comprehensive loss (available to be recycled to profit and loss in future periods)
Revaluation of financial assets available-for-sale – – (1 029) (1 029)Total comprehensive loss for the year – 1 532 (1 029) 503
Transactions with owners recorded directly to equityDividends paid – (1 532) – (1 532)Total transactions with owners – (1 532) – (1 532)Balance at 30 September 2017 905 1 431 21 212 23 548

51AUDITED ANNUAL FINANCIAL STATEMENTS 201750 TRUST IS EARNED™
COMPANY STATEMENT OF CASH FLOWSFOR THE YEAR ENDED 30 SEPTEMBER 2017
2017 2016
R MILLION R MILLION
Cash flows from operating activitiesProfit for the year 1 532 1 753
Non-cash and other adjustments (1 538) (1 757)Dividends received (1 538) (1 757)
Operating loss before changes in working capital (6) (4) Working capital changes – (8)Increase in loans to group company – (8)
Cash utilised by operations (6) (12)Dividends received 1 538 1 757
Net cash from operating activities 1 532 1 745
Cash flows from financing activities (1 532) (1 745)Dividends paid (1 532) (1 745)
Net change in cash and cash equivalents – –Cash and cash equivalents at beginning of year – –Cash and cash equivalents at end of year – –
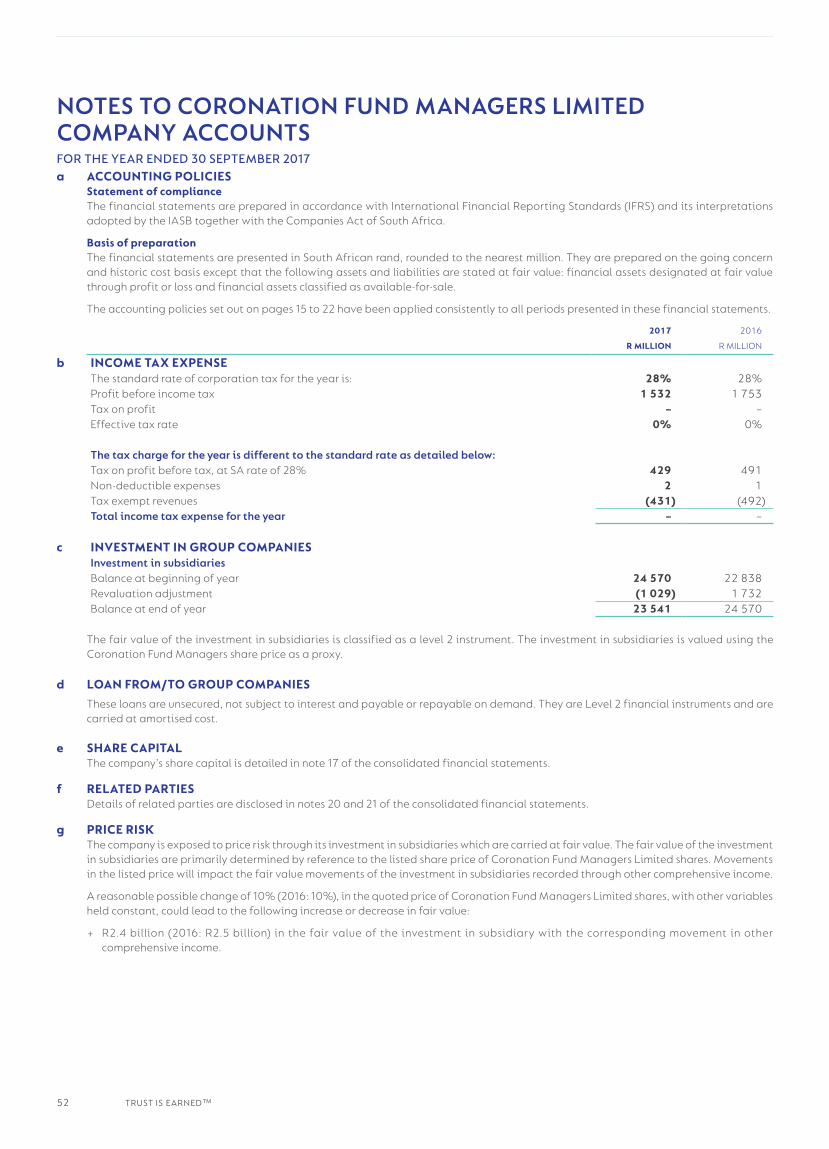
53AUDITED ANNUAL FINANCIAL STATEMENTS 201752 TRUST IS EARNED™
NOTES TO CORONATION FUND MANAGERS LIMITED COMPANY ACCOUNTS FOR THE YEAR ENDED 30 SEPTEMBER 2017a ACCOUNTING POLICIES Statement of compliance The financial statements are prepared in accordance with International Financial Reporting Standards (IFRS) and its interpretations
adopted by the IASB together with the Companies Act of South Africa.
Basis of preparation The financial statements are presented in South African rand, rounded to the nearest million. They are prepared on the going concern
and historic cost basis except that the following assets and liabilities are stated at fair value: financial assets designated at fair value through profit or loss and financial assets classified as available-for-sale.
The accounting policies set out on pages 15 to 22 have been applied consistently to all periods presented in these financial statements.
2017 2016
R MILLION R MILLION
b INCOME TAX EXPENSEThe standard rate of corporation tax for the year is: 28% 28%Profit before income tax 1 532 1 753Tax on profit – – Effective tax rate 0% 0%
The tax charge for the year is different to the standard rate as detailed below:Tax on profit before tax, at SA rate of 28% 429 491Non-deductible expenses 2 1Tax exempt revenues (431) (492)Total income tax expense for the year – –
c INVESTMENT IN GROUP COMPANIESInvestment in subsidiariesBalance at beginning of year 24 570 22 838Revaluation adjustment (1 029) 1 732Balance at end of year 23 541 24 570
The fair value of the investment in subsidiaries is classified as a level 2 instrument. The investment in subsidiaries is valued using the Coronation Fund Managers share price as a proxy.
d LOAN FROM/TO GROUP COMPANIES
These loans are unsecured, not subject to interest and payable or repayable on demand. They are Level 2 financial instruments and are carried at amortised cost.
e SHARE CAPITAL The company’s share capital is detailed in note 17 of the consolidated financial statements.
f RELATED PARTIES Details of related parties are disclosed in notes 20 and 21 of the consolidated financial statements.
g PRICE RISKThe company is exposed to price risk through its investment in subsidiaries which are carried at fair value. The fair value of the investment in subsidiaries are primarily determined by reference to the listed share price of Coronation Fund Managers Limited shares. Movements in the listed price will impact the fair value movements of the investment in subsidiaries recorded through other comprehensive income.
A reasonable possible change of 10% (2016: 10%), in the quoted price of Coronation Fund Managers Limited shares, with other variables held constant, could lead to the following increase or decrease in fair value:
+ R2.4 billion (2016: R2.5 billion) in the fair value of the investment in subsidiary with the corresponding movement in other comprehensive income.

53AUDITED ANNUAL FINANCIAL STATEMENTS 201752 TRUST IS EARNED™
ANALYSIS OF SHAREHOLDERSAS AT 30 SEPTEMBER 2017
NUMBER OF
NUMBER OF SHARES
DISTRIBUTION OF SHAREHOLDERS SHAREHOLDERS % ’000 %
1 – 1 000 shares 8 620 53.08 3 903 1.111 001 – 10 000 shares 6 176 38.02 20 102 5.7510 001 – 100 000 shares 1 111 6.84 33 676 9.63100 001 – 1 000 000 shares 271 1.67 83 142 23.771 000 001 shares and over 63 0.39 208 976 59.74
16 241 100.00 349 799 100.00
NUMBER OF
NUMBER OF SHARES
DISTRIBUTION OF SHAREHOLDERS SHAREHOLDERS % ’000 %
Banks 76 0.47 12 564 3.59Brokers 56 0.34 22 632 6.47Close corporations 81 0.50 411 0.12Endowment funds 16 0.10 437 0.12Individuals 12 567 77.38 36 282 10.37Insurance companies 109 0.67 4 906 1.40Medical aid schemes 39 0.24 664 0.19Mutual funds 699 4.30 94 279 26.95Nominees and trusts 1 679 10.34 10 055 2.88Other corporations 24 0.15 2 029 0.58Pension funds 359 2.21 57 685 16.49Private companies 304 1.87 2 655 0.76Employee holdings 183 1.13 88 350 25.26Sovereign wealth funds 49 0.30 16 850 4.82
16 241 100.00 344 799 100.00
NUMBER OF
NUMBER OF SHARES
PUBLIC/NON-PUBLIC SHAREHOLDERS SHAREHOLDERS % ’000 %
Non-public shareholders183 1.13 88 350 25.26
Directors* 5 0.03 6 139 4.81Shares held by employees 178 1.10 82 211 20.45
Public shareholders 16 058 98.87 261 449 74.7416 241 100.00 349 799 100.00
* Includes directors of subsidiary companies.
NUMBER OF
NUMBER OF SHARES
GEOGRAPHICAL OWNERSHIP SHAREHOLDERS % ’000 %
South Africa 15 762 97.05 264 888 75.73International 479 2.95 84 911 24.27
16 241 100.00 349 799 100.00
NUMBER OF
SHARES
SHAREHOLDERS WITH DIRECT OR INDIRECT BENEFICIAL INTEREST OF 5% OR MORE IN SHARES ’000 %
Government Employees Pension Fund 38 428 10.99The Imvula Trust 30 498 8.72Louis Stassen 17 495 5.00

55AUDITED ANNUAL FINANCIAL STATEMENTS 201754 TRUST IS EARNED™
GLOSSARY OF FINANCIAL REPORTING TERMS
GROUP STRUCTURESCompany A legal business entity registered in terms of the applicable legislation of that country.
Entity Coronation Fund Managers Limited, a subsidiary or associate.
Equity-accounted investee
An entity, other than a subsidiary or joint venture, in which the group has significant influence over the financial and operating policies.
Group Coronation Fund Managers Limited and its subsidiaries and associate.
Operation A component of the group that:– represents a separate major line of business or geographical area of operation; and– can be distinguished separately for financial and operating purposes.
Subsidiary Any entity over which the group has control.
GENERAL ACCOUNTING TERMSAcquisition date of a business
The date on which control in respect of subsidiaries and significant influence in respect of associates commences.
Consolidated financial statements
The financial results of the group, which comprise the financial results of Coronation Fund Managers Limited and its subsidiaries and its interests in associates.
Control An investor controls an investee when it is exposed, or has rights, to variable returns from its involvement with the investee and has the ability to affect those returns through its power over the investee.
Disposal date The date on which the control in respect of subsidiaries and significant influence in respect of associates ceases.
Fair value The price that would be received to sell an asset or paid to transfer a liability in an orderly transaction between market participants at the measurement date.
Financial results Comprise the financial position (assets, liabilities and equity), financial performance (revenue and expenses) and cash flows of the group or an entity within the group.
Functional currency The currency of the primary economic environment in which the entity operates.
Long term A period longer than 12 months from reporting date.
Other comprehensive income
Comprises items of income and expenses (including reclassification adjustments) that are not recognised in profit or loss as required or permitted by other IFRS.
Presentation currency The currency in which the financial statements are presented.
Reclassification Amounts reclassified to profit or loss in the current period that were recognised in other comprehensive income in the current or previous period.
Recoverable amount The amount that reflects the greater of the fair value less costs to sell and value in use that can be attributed to a non-financial asset as a result of its ongoing use by the entity. In determining the value in use, expected pre-tax future cash flows are discounted to their present values using the appropriate discount rate.
Related parties The following entities or parties are considered related parties to the reporting entity:– a subsidiary, fellow subsidiary, associate, jointly controlled entity or an entity having joint control in relation to
the reporting entity; – key management personnel and their close members of family and entities which they control, jointly control or
over which they exercise significant influence; and– post-employment benefit plan for the benefit of employees of the entity or any related party.
Significant influence The power to participate in the financial and operating policy decisions of the investee but is not control or joint control of those policies.

55AUDITED ANNUAL FINANCIAL STATEMENTS 201754 TRUST IS EARNED™
FINANCIAL INSTRUMENT TERMSAvailable-for-sale financial assets
A non-derivative financial asset that is designated as available-for-sale or is not classified as: – a loan or receivable;– a held-to-maturity investment; or– a financial asset at fair value through profit or loss.
Cash and cash equivalents
Cash and cash equivalents comprise cash balances and call deposits. Bank overdrafts that are repayable on demand and form an integral part of the group’s cash management are included as a component of cash and cash equivalents for the purpose of the statement of cash flows.
Derivative instrument A financial instrument:– whose value changes in response to movements in a specified interest rate, commodity price, instrument price,
foreign exchange rate or similar variable, provided in the case of a non-financial variable that the variable is not specific to a party of the contract;
– that requires minimal initial net investment; and– is settled at a future date.
Effective interest rate The rate that discounts the expected future cash flows to the net carrying amount of the financial asset or financial liability.
Equity instrument Any financial instrument (including investments) that evidences a residual interest in the assets of an enterprise after deducting all of its liabilities.
Financial asset Cash or cash equivalents, a right to receive cash or cash equivalents, an equity instrument of another entity, a right to exchange a financial instrument under favourable conditions.
Financial guarantee contract
A contract that requires the issuer to make specified payments to reimburse the holder for the loss it incurs, because a specified debtor fails to make payment when due in accordance with the original or modified terms of the debt instrument.
Financial liability A contractual obligation to pay cash or transfer other benefits or an obligation to exchange a financial instrument under unfavourable conditions.
Financial instruments classified as held for trading
Derivatives or instruments that are held principally with the intention of short-term disposal.
Financial assets and liabilities at fair value through profit or loss
Financial instruments held at fair value through profit or loss include all instruments classified as held for trading and those instruments designated as held at fair value through profit or loss on initial recognition.
Financial instruments issued by the group classified as financial liabilities
Financial instruments issued by the group are classified as liabilities if they contain a contractual obligation to transfer cash or another financial asset or to exchange financial assets or liabilities under potentially unfavourable conditions.
Financial instruments issued by the group classified as equity
Financial instruments issued by the group are classified as equity where they confer on the holder a residual interest in the net assets of the group.
Held-to-maturity investments
Non-derivative financial assets, with a fixed maturity and fixed or determinable future payments, that the entity has the positive intent and ability to hold to maturity, other than those designated upon initial recognition as at fair value through profit or loss, those designated as available-for-sale and those that meet the definition of loans and receivables.
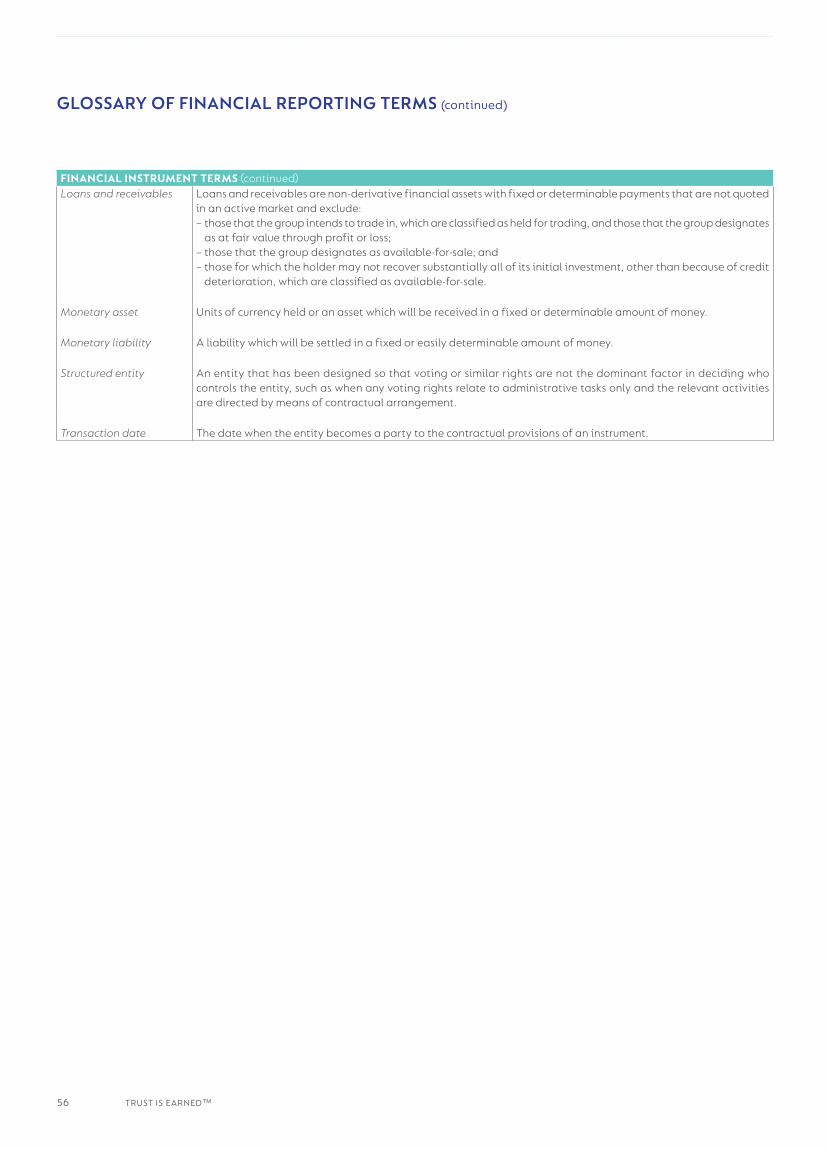
57AUDITED ANNUAL FINANCIAL STATEMENTS 201756 TRUST IS EARNED™
GLOSSARY OF FINANCIAL REPORTING TERMS (continued)
FINANCIAL INSTRUMENT TERMS (continued)Loans and receivables Loans and receivables are non-derivative financial assets with fixed or determinable payments that are not quoted
in an active market and exclude:– those that the group intends to trade in, which are classified as held for trading, and those that the group designates
as at fair value through profit or loss;– those that the group designates as available-for-sale; and – those for which the holder may not recover substantially all of its initial investment, other than because of credit
deterioration, which are classified as available-for-sale.
Monetary asset Units of currency held or an asset which will be received in a fixed or determinable amount of money.
Monetary liability A liability which will be settled in a fixed or easily determinable amount of money.
Structured entity An entity that has been designed so that voting or similar rights are not the dominant factor in deciding who controls the entity, such as when any voting rights relate to administrative tasks only and the relevant activities are directed by means of contractual arrangement.
Transaction date The date when the entity becomes a party to the contractual provisions of an instrument.

57AUDITED ANNUAL FINANCIAL STATEMENTS 201756 TRUST IS EARNED™
SHAREHOLDERS’ DIARY AND CORPORATE INFORMATION
Annual general meeting 20 February 2018
Share code (ordinary shares): CML ISIN number: ZAE000047353
BOARD OF DIRECTORSShams Pather (independent non-executive chairman)Anton Pillay (chief executive officer)John Snalam (chief financial officer)Alexandra WatsonHugo Nelson Appointed 7 November 2016Jock McKenzieJudith February Lulama Boyce
TRANSFER SECRETARIESComputershare Investor Services Proprietary LimitedRosebank Towers15 Biermann AvenueRosebank 2196Gauteng
POSTAL ADDRESSPO Box 61051Marshalltown 2107
COMPANY SECRETARYLee-Anne Parenzee
REGISTERED OFFICE7th Floor, MontClare PlaceCnr Campground and Main RoadsClaremont 7708Cape Town
POSTAL ADDRESSPO Box 44684Claremont 7735Cape Town
AUDITORSErnst & Young Inc.Waterway House3 Dock RoadWaterfrontCape Town 8001

CAPE TOWN 7th Floor, MontClare Place, Cnr Campground and Main Roads, Claremont 7708 PO Box 44684, Claremont 7735 Telephone: +27 (0)21 680 2000 Fax: +27 (0)21 680 2100
JOHANNESBURG 1st Floor, Unit 7B, 3 Melrose Boulevard, Melrose Arch 2196 PO Box 652643, Benmore 2010 Telephone: +27 (0)11 328 8200 Fax: +27 (0)11 684 2187
PRETORIA 1st Floor, Block 4, The Boardwalk Office Park, Eros Street, Faerie Glen 0043 Telephone: +27 (0)12 990 9040 Fax: +27 (0)12 991 6079
DURBAN Suite 6, 15 The Boulevard, Westway Office Park, Westville 3635 Telephone: +27 (0)87 354 0508
LONDON 7th Floor, St Albans House, 57–59 Haymarket, London, SW1Y 4QX United Kingdom Telephone: +44 (0)207 389 8840 Fax: +44 (0)207 389 8899
DUBLIN Suite 1, 2 Grand Canal Square, Macken Street, Dublin D02 A342, Ireland Telephone: +353 (0)1 674 5410 Fax: +353 (0)1 674 5411