audit report on union gas 2009 - consortium for energy ... · audit report on union gas 2009 . a...
TRANSCRIPT
ECONOMICS • FINANCE • PLANNING
Audit Report on Union Gas 2009 Annual Report A Report to the Audit Subcommittee of the DSM Consultative Final Report
888 SW Fifth Avenue, Suite 1460 Portland, Oregon 97204
503-222-6060
July 16, 2010
Acknowledgements
This report was prepared by ECONorthwest’s Portland office for Union Gas and the Audit Subcommittee of the DSM Consultative. Dr. Stephen Grover was the ECONorthwest project manager for this analysis and was the primary author of this report. Questions regarding the report should be directed to him at [email protected] or by phoning the Portland office at (503) 222-6060. Anne Fifield at ECONorthwest assisted with this analysis. Mike Kennedy also provided a review of the engineering studies and other supporting research reports.
TABLE OF CONTENTS 1. Introduction ............................................................................................................................ 1
2. Review of DSMVA Calculations and 2010 Targets ............................................................ 2
3. Review of SSM Calculations ................................................................................................. 3
4. Review of LRAM Calculations ............................................................................................. 4
5. Residential Program Audit Results ...................................................................................... 5
5.1 Low Income and ESK Showerheads.................................................................................. 5
5.2 Additional Residential Issues Raised by the Audit Subcommittee .................................... 6
6. Commercial and Distribution Contract Audit Results....................................................... 7
6.1 Project sampling................................................................................................................. 7
6.2 Agriculture Custom Projects .............................................................................................. 9
6.3 ERV / HRV Report .......................................................................................................... 10
6.4 Infrared Heater Report ..................................................................................................... 10
6.5 Commercial Custom Project Review ............................................................................... 13
6.6 Distribution Contract Customers Custom Projects .......................................................... 14
6.7 Custom Project Review Summary ................................................................................... 16
7. Market Transformation ...................................................................................................... 18
8. Audit Recommendations ..................................................................................................... 20

Union Gas: 2009 DSM Audit 1 ECONorthwest
1. INTRODUCTION Union Gas Limited (Union) in consultation with the Evaluation and Audit Committee (EAC) asked ECONorthwest to conduct an audit of the Union Gas DSM 2009 Annual Report. A review of project files was conducted by a third party engineering firm as part of Union Gas’ 2009 DSM evaluation. The audit was limited to a general review of the 2009 savings estimates and reviewing the supporting research provided by Union for these programs. Throughout this process, Union was very responsive and provided us with all the requested background materials in a timely manner.
The tasks completed as part of the 2009 audit include the following:
• Audited the draft 2009 Annual Report to identify if there are claims made by Union that have not been substantiated.
• Compared the overall evaluation approach with that stated in the DSM Annual Report including a review of the completeness of the evaluation work.
• Verified that the calculation methodology and assumptions used in calculating the SSM incentive adhered to Board-approved methods.
• Considered and responded to EAC comments on Union Gas’s DSM 2009 Annual Report.
• Reviewed studies conducted in support of the DSM Annual Report.
• Identified assumptions underlying Union Gas’s DSM program design strategy and TRC calculation that should be modified prospectively.
• Identified opportunities to enhance the assumptions used to calculate the SSM and LRAM that should be addressed in future evaluation work.
• Replicated the savings and TRC amounts reported in the SSM.
• Reviewed two third party engineering reports that evaluated the savings estimates for a sample of custom commercial, industrial, and agricultural projects.
• Interviewed the firms that conducted the engineering reviews.
• Reviewed the sampling methodology for custom projects developed by Summit Blue.
• Reviewed the ERV/HRV report by Nexant
• Reviewed the Infrared heating report by Enermodal Engineering
• Reviewed Union Gas survey results used for 2009 market transformation activities.
• Assessed the underlying assumptions used in savings estimates.
• Reviewed the target calculations for the 2010 TRC target. Our review focused on the 2009 program areas as defined in the 2009 Annual Report:
• Residential Sector
• Residential-Low Income
Union Gas: 2009 DSM Audit 2 ECONorthwest
• Commercial Sector o New Building Construction
o Building Retrofit, Audit Programs
o Custom Projects
• Distribution Contract o Custom Projects, Audit Programs
• Market Transformation o Drain Water Heat Recovery
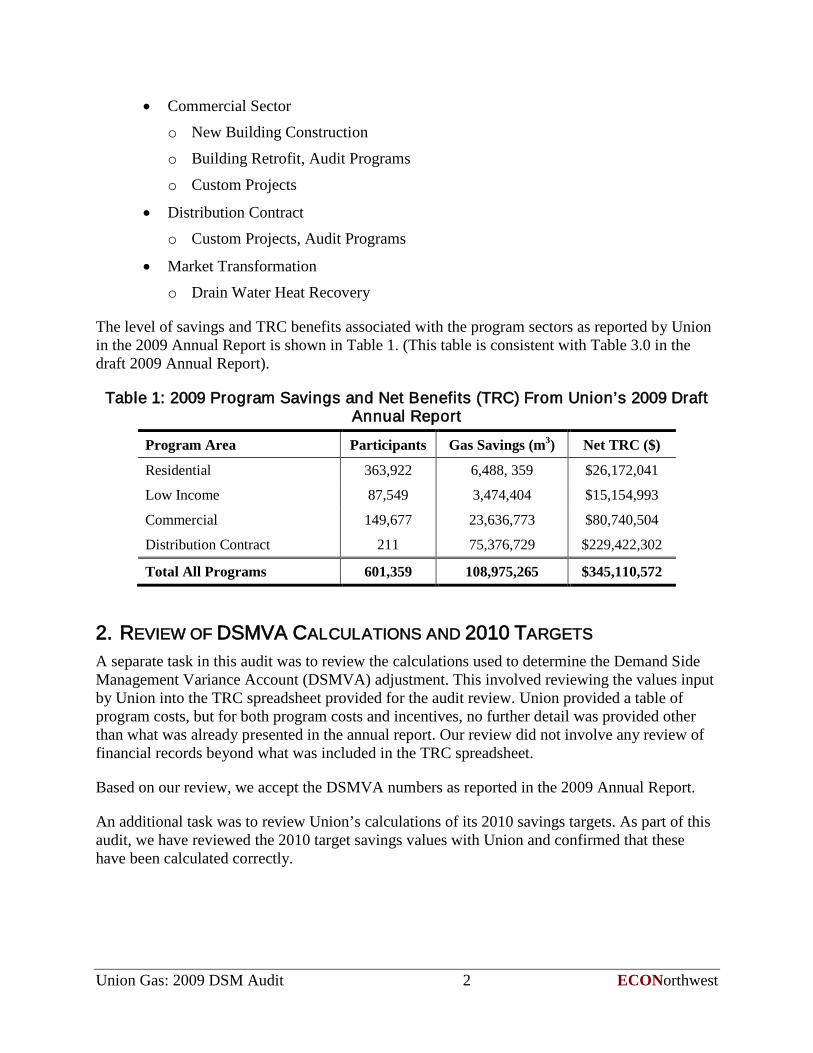
The level of savings and TRC benefits associated with the program sectors as reported by Union in the 2009 Annual Report is shown in Table 1. (This table is consistent with Table 3.0 in the draft 2009 Annual Report).
Table 1: 2009 Program Savings and Net Benefits (TRC) From Union’s 2009 Draft Annual Report
Program Area Participants Gas Savings (m3 Net TRC ($) )
Residential 363,922 6,488, 359 $26,172,041
Low Income 87,549 3,474,404 $15,154,993
Commercial 149,677 23,636,773 $80,740,504
Distribution Contract 211 75,376,729 $229,422,302
Total All Programs 601,359 108,975,265 $345,110,572
2. REVIEW OF DSMVA CALCULATIONS AND 2010 TARGETS A separate task in this audit was to review the calculations used to determine the Demand Side Management Variance Account (DSMVA) adjustment. This involved reviewing the values input by Union into the TRC spreadsheet provided for the audit review. Union provided a table of program costs, but for both program costs and incentives, no further detail was provided other than what was already presented in the annual report. Our review did not involve any review of financial records beyond what was included in the TRC spreadsheet.
Based on our review, we accept the DSMVA numbers as reported in the 2009 Annual Report.
An additional task was to review Union’s calculations of its 2010 savings targets. As part of this audit, we have reviewed the 2010 target savings values with Union and confirmed that these have been calculated correctly.
Union Gas: 2009 DSM Audit 3 ECONorthwest
3. REVIEW OF SSM CALCULATIONS As part of this audit, ECONorthwest replicated the SSM calculations as shown in the 2009 Annual Report. This was done by obtaining Excel workbooks from Union that contained all the savings and TRC calculations and reviewing the calculations to make sure that they were done correctly and match the numbers shown in the 2009 Annual Report.
The SSM calculations were obtained from Union and then replicated and checked for the following:
• Accuracy with the final savings totals shown in the Annual Report.
• Consistency with the agreed-upon assumptions for calculation parameters (e.g., free ridership, per unit savings, savings adjustments).
We found no discrepancies between the SSM calculations and the figures presented in the 2009 Annual Report.
In our review of the approved input assumptions, we found one small error in the Demand Control Kitchen Ventilation Dinner House (10,000-15,000 cfm) measure under New Building Construction. The savings per unit for natural gas was incorrectly entered into the TRC and LRAM “Input Assumptions” worksheet. The savings per unit in Appendix A-2009 Input Assumptions for the Decision with Reasons is 18,924 cubic meters; it was incorrectly entered as 18,624 cubic meters. The same measure under Building Retrofit was correctly entered. ECONorthwest found no other errors.
Based on our review, we recommend that the following adjustments be made to the 2009 SSM claim:
• For Low Income bath and kitchen aerators, apply the Beslin retention adjustments from the ESK programs in the input assumptions.
• For showerheads in the Home Retrofit program, move all participants falling in the two highest savings ranges (2.0-2.5 gpm existing and greater than 2.6 gpm existing) into the lowest savings category.
• For commercial custom projects, adjust savings for projects 244 and 245 using the revised savings calculations provided by Diamond Engineering during the audit.
• Savings for all other commercial custom projects should be reduced by 50 percent for gas, water, and electricity. These adjustments are to be done in place of the adjustment factors recommended the by the 3rd
• For Distribution Contract custom projects, adopt the adjusted savings values developed by Diamond Engineering during the course of the audit for the 12 projects included in the evaluation sample. Of these twelve projects, Customer 193 should be removed from the sample when calculating the realization rate to be applied to the Distribution Contract custom project population.
party engineer.
Union Gas: 2009 DSM Audit 4 ECONorthwest
• For the remaining Distribution Contract custom projects outside the sample of 12, apply an adjustment factor of 105 percent for gas savings, 47 percent for electricity savings, and 110 percent for water savings. These adjustments are to be done in place of the adjustment factors recommended the by the 3rd
These recommendations are discussed in more detail below.
party engineer.
4. REVIEW OF LRAM CALCULATIONS ECONorthwest reviewed the LRAM calculations provided by Union and found them to be calculated correctly using the same per unit gas savings values used in the 2009 SSM calculation provided in the 2009 Annual Report.
In our review of the 2009 report, we recommended two adjustments be made to the 2009 LRAM claim to reflect the best information currently available.
• Adopt the savings values from Nexant report on ERV and HRV savings. This was done with an average adjustment for 2009. In 2010, the building-specific savings values should be applied to each individual project.
• Reduce infrared heater savings by 66 percent. Additional evaluation work should be conducted to develop a new savings estimate for use in 2010.
• Apply a free ridership rate of 54 percent to all custom projects (industrial, commercial, agriculture, and distribution) as recommended by Summit Blue in Custom Projects Attribution Study, dated October 31, 2008.
• For showerheads in the ESK program, adopt values from the Enbridge showerhead study, and reduce the per unit gas savings by an additional 57.76 percent.
• For showerheads in the Low Income program, change the natural gas savings per unit from 66 m3 for the 2.0-2.5 existing category to 46 m3, and from 116 m3 for the greater 2.6 gpm existing category to 88 m3
The combined effect of our recommended changes on the SSM, TRC, and LRAM are shown in
.
Table 2. If the changes recommended by the 2009 Audit are adopted, we believe that the TRC savings, SSM amount recoverable, LRAM amount recoverable and DSMVA amount recoverable are correctly calculated using reasonable assumptions, based on data that have been gathered and recorded using reasonable methods and accurate in all material respects, and following the rules and principles set down by the Ontario Energy Board.

Union Gas: 2009 DSM Audit 5 ECONorthwest
Table 2: Audit Adjustments to SSM, TRC, LRAM, and DSMVA
Account 2009 Annual Report 2009 Audit Value % Change
Gas Savings SSM (m3 108,975 000’s) 99,343 -9%
Gas Savings LRAM (m3 108,975 000’s) 92,604 -15%
SSM $8,921,583* $8,751,232 -2%
TRC $345,110,572 $308,255,602 -11%
DSMVA (Total Program Spending)
$22,222,457 $22,222,457 0%
*The SSM payout is capped at $8,921,583. The actual calculated annual report SSM was $10,425,218.
5. RESIDENTIAL PROGRAM AUDIT RESULTS For the Residential programs, we reviewed the savings calculations as well as some of the major assumptions and evaluation research that is used in developing the savings estimates. The audit process also involved investigating specific issues raised by the EAC. The programs reviewed included:
• Home Retrofit
• Low Income
We also reviewed an evaluation report completed by Summit Blue Canada that addressed free ridership values for selected measures.1
5.1 LOW INCOME AND ESK SHOWERHEADS
While we have expressed concerns with this report in previous audits for Enbridge and Union Gas, we will not repeat our comments here.
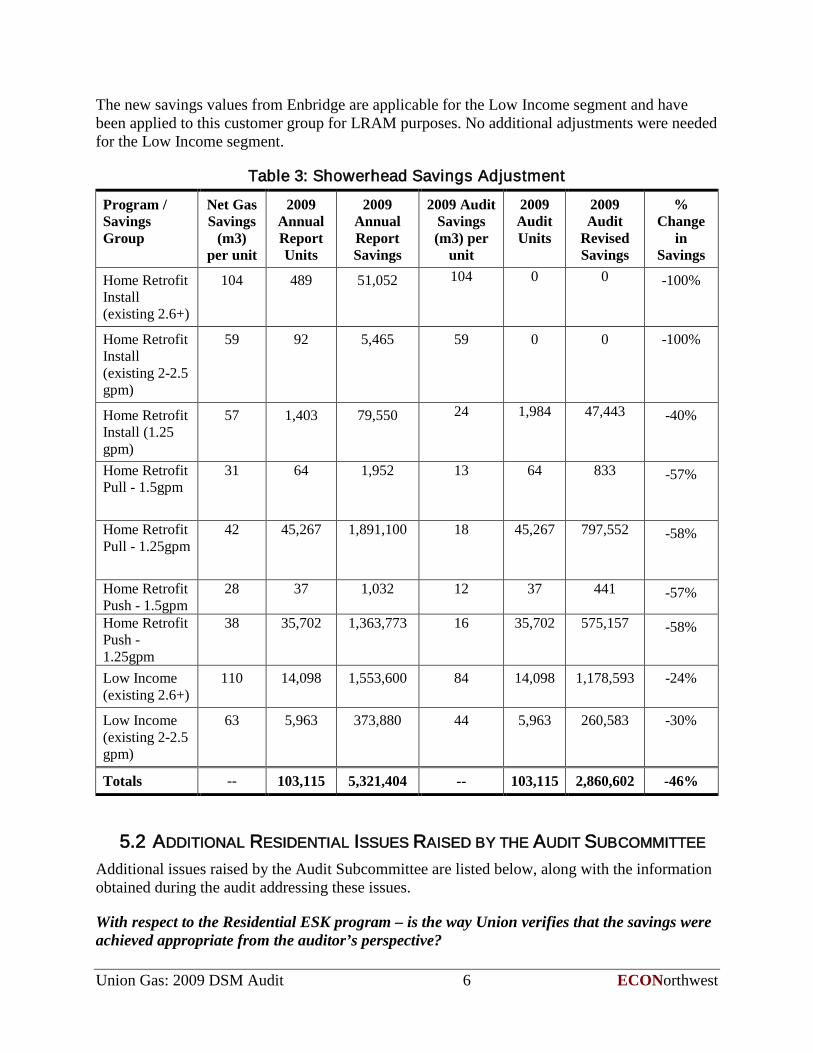
Due to concerns raised by the auditor and the EAC on the accuracy of the bag test used to categorize the ESK showerhead installations, Union agreed to use an average savings value for the showerheads installed through the Home Retrofit program. This shift in participation for these customers (and the resulting savings) is shown in the top three rows of Table 3. This change applies to both SSM and LRAM for 2009.
During the audit, a new study on the showerhead savings was completed for the Enbridge evaluation2
Table 3
, and the savings values from that study are being recommended for use for Union’s 2009 LRAM claim. For all ESK programs (Install, Push, and Pull), the natural gas savings per unit was reduced by an additional 76 percent to account for the percentage of showering that occurred under the single installed showerhead. An additional 76 reduction was applied to the per unit savings, based on the Beslin verification studies to account for the fraction of showerheads that are actually installed. These changes are also shown in .
1 Residential Measure Free Ridership and Inside Spillover Study, June 4, 2008. 2 The Enbridge showerhead study was not reviewed as part of this audit.
Union Gas: 2009 DSM Audit 6 ECONorthwest
The new savings values from Enbridge are applicable for the Low Income segment and have been applied to this customer group for LRAM purposes. No additional adjustments were needed for the Low Income segment.
Table 3: Showerhead Savings Adjustment
Program / Savings Group
Net Gas Savings
(m3) per unit
2009 Annual Report Units
2009 Annual Report Savings
2009 Audit Savings (m3) per
unit
2009 Audit Units
2009 Audit
Revised Savings
% Change
in Savings
Home Retrofit Install (existing 2.6+)
104 489 51,052 104 0 0 -100%
Home Retrofit Install (existing 2-2.5 gpm)
59 92 5,465 59 0 0 -100%
Home Retrofit Install (1.25 gpm)
57 1,403 79,550 24 1,984 47,443 -40%
Home Retrofit Pull - 1.5gpm
31 64 1,952 13 64 833 -57%
Home Retrofit Pull - 1.25gpm
42 45,267 1,891,100 18 45,267 797,552 -58%
Home Retrofit Push - 1.5gpm
28 37 1,032 12 37 441 -57%
Home Retrofit Push - 1.25gpm
38 35,702 1,363,773 16 35,702 575,157 -58%
Low Income (existing 2.6+)
110 14,098 1,553,600 84 14,098 1,178,593 -24%
Low Income (existing 2-2.5 gpm)
63 5,963 373,880 44 5,963 260,583 -30%
Totals -- 103,115 5,321,404 -- 103,115 2,860,602 -46%
5.2 ADDITIONAL RESIDENTIAL ISSUES RAISED BY THE AUDIT SUBCOMMITTEE Additional issues raised by the Audit Subcommittee are listed below, along with the information obtained during the audit addressing these issues.
With respect to the Residential ESK program – is the way Union verifies that the savings were achieved appropriate from the auditor’s perspective?

Union Gas: 2009 DSM Audit 7 ECONorthwest
Union has contracted with Beslin to verify the installation of the various measures included in the ESK (showerheads, pipe insulation, aerators). The verification consists of a phone survey of participants to determine if the measure is still installed. We have reviewed the Beslin studies for the 2009 Annual Report and believe that this method is adequate for verifying these measures. While the verification could be improved with a sample of onsite inspection visits to determine the persistence of the measures, this is a lower priority relative to other evaluation research needs.
For programmable thermostats – how does Union verify that they were installed and were being used differently than manual thermostats?
Union Gas is relying on the savings estimates from the 2009 Navigant study3
6. COMMERCIAL AND DISTRIBUTION CONTRACT AUDIT RESULTS
for the programmable thermostat savings value. We reviewed this study as part of the audit and confirmed it that some behavioral information was used to develop the final savings value. While the savings estimate may benefit from additional evaluation research on this topic, this should be considered a lower priority relative to more pressing evaluation needs such as custom project evaluation.
As part of the audit, we reviewed the sampling process used to select projects for the engineering review for commercial and distribution contract custom projects. We also reviewed the two studies completed by engineering firms to review the savings estimates for custom projects for commercial customer and direct contract customers. Our review was limited to reviewing the reports and discussing the results with the engineers who managed these projects.
6.1 PROJECT SAMPLING The sampling method used for evaluating the custom projects is consistent with the method agreed on for the 2008 program year and is based on a method designed by Summit Blue. We reviewed the sampling procedure and had several recommendations on how the process could be improved. Union Gas adopted some of these for 2009 and for those that were not we reiterate our previous recommendations below for the remaining sampling issues.
1. Develop a stratified sampling method that has very large projects included in the evaluation sample. This can be accomplished by developing a “certainty” stratum where large projects are sampled with certainty for the evaluation.
2. Adopt a larger sample size. We understand that the sample size was set in an agreement with the OEB for 2008. However, given the wide range of business and measure types covered by the custom projects (and the suggested modifications discussed below), the sample size should be increased in order to achieve a 90/10 relative precision level for important sub-categories of customer types and measures. For example, samples could be drawn separately for retrofit and new construction projects. It may be desirable to have
3 Measures and Assumptions for Demand Side Management (DSM) Planning Appendix C: Substantiation Sheets by Navigant Consulting (April 16, 2009).
Union Gas: 2009 DSM Audit 8 ECONorthwest
samples for several size categories (i.e., small, medium, large) to further improve the reliability of the sample estimates.
A larger sample size will also provide insurance against having to discard some sample points once the sample is drawn. All of the sample precision calculations assume that each sampled project is well documented, for example, so that the sample results can be readily extrapolated to the population. In situations where projects are not well documented, the value as a sample point is reduced, as we cannot be sure that the project is representative. This was a particular issue with the commercial custom projects, where documentation was deficient in most of the sampled projects. A separate case is the issue where projects are adequately documented but still are not very representative of projects in the population. For example, Customer 193 in the Distribution Contract custom program is a very large new construction project that is significantly different from the other custom projects in this group both in terms of size and technology and therefore is not very useful as a sample point.
Two-Stage Sampling As was done in the 2008, the 2009 sample is drawn in two stages in order to allow more calendar time for the verification of savings. In principle, this approach is logical and often necessary. In practice, however, the analyst must be careful not to introduce unintended bias into the sample by not maintaining a consistent probability of selection for each project.4
The first-stage portion of the sample (Wave 1) is drawn based on projects installed in the first three quarters of the project year. In the second stage, the remainder of the sample is drawn based on projects installed in the fourth quarter and those projects installed in the first three quarters, but not selected in the first sample. This method violates the assumption of equal probability of selection because projects in the first stage have a different probability of selection than projects in the second stage. Without a properly developed post-hoc weighting scheme, the findings from the sample may be biased in an unknown direction (i.e., indicate either greater or lesser savings that was actually achieved).
Recommendations for Future Sampling What is the optimal number of strata? There are two issues to consider in answering this: how does variance decrease as the number of strata increase and how does an increase in the number of strata affect cost? The purpose of stratifying the DSM projects by expected savings is to reduce cost. Stratification reduces sample variance, which in turns reduces the sample size necessary to meet precision requirements (relative to simple random sampling). Fieldwork—especially for custom commercial and industrial projects—is expensive. The optimal sample design is the one that meets precision (and any other) requirements at the lowest cost. This is achieved through stratification.
4 The issue of bias is relevant regardless of whether or not the probability of selection of a project is weighted by the expected energy savings of the project.
Union Gas: 2009 DSM Audit 9 ECONorthwest
How should size of expected energy savings be incorporated into stratification?5
Random Sampling with Replacement. Setting aside that it may be desirable to weight the probability of sample selection by expected savings, a fundamental characteristic of random sampling for program evaluations is that all projects have an equal and unchanging likelihood of selection into the sample.
There are a number of methods to develop the stratification. Regardless of method, the objective is to minimize sample variance. One approach is to sort the projects in descending order of expected savings. Starting at the top of the list, create a running tally of the cumulative expected saving of the projects. Divide the cumulative savings of all projects by the number of strata to get the target savings per stratum. Beginning at the top, allocate each consecutive project into stratum 1 until the cumulative savings of the stratum is (approximately) equal to the target savings per stratum. Once this is done, continue down the list, allocating projects into stratum 2 until the cumulative savings is approximately equal to the target savings per stratum. Continue this process until all projects are assigned to a stratum.
6
6.2 AGRICULTURE CUSTOM PROJECTS
Although there is added complexity to the overall process, this can be accomplished in multi-stage sampling. We recommend that sampling with replacement is conducted. This method not only results in simpler formulas for variances estimated from the sample, but may also allow for a smaller overall number of projects selected in the sample (i.e., the same project may be chosen for the sample two or more times).
In both the commercial custom and distribution custom projects, agricultural customers are assigned a free ridership rate of zero. This rate comes from the Summit Blue free ridership study7
Using separate free ridership rates for the customer groups also runs counter the recommendation provided in the same Summit Blue report (page ii):
that provides separate rates by customer group. While we understand that the free ridership rates broken out by customer group are the rates that have been approved for use by the OEB for 2009, the actual free ridership rate for agricultural customer is certainly higher than zero.
Summit Blue recommends that the utilities use the utility-specific total free ridership values of 41% and 54% as the best estimate of free ridership. Those results are based on larger sample sizes than the sector-specific results and proved more stable in the sensitivity analysis. The sector-specific results are based on smaller sample sizes and should only be used to support program management, for example to support targeting and marketing decisions.
5 Stratification by one or more descriptive criteria (e.g. fuel type, measure type, etc.) may be mandated by the utility. Such additional stratification does add complexity to the sample design process, however the process of conducting the stratification by size does not change. 6 Even if a projects probability of selection is based on expected energy savings, the probability of selection should not change during the selection process. 7 Custom Projects Attribution Study, prepared for Enbridge by Summit Blue (October 31, 2008).
Union Gas: 2009 DSM Audit 10 ECONorthwest
To correct these issues, we recommend that the overall free ridership rate of 54 percent from the Summit Blue report be applied to all custom projects for commercial and distribution customers for LRAM purposes.
6.3 ERV / HRV REPORT The Nexant report Evaluation of Natural Gas DSM Measures: Energy Recovery Ventilators & Heat Recovery Ventilators (March 12, 2010) was reviewed as part of the 2009 Audit. The study is very in depth and did address the hours of operation assumptions (an issue raised in the 2008 Audit), and include recommended changes to the hours of operation for several building types. The potential impact of the recommended changes to operating hours can be seen in Table 1-8 of the Nexant report.
The evaluation did not examine the night temperature issue raised as part of the 2008 Audit despite going into considerable depth on other aspects of the model. Since the calculation is using an average temperature for all heating hours and it is based upon 24/7 operation, any project where the ERV/HRV is not operating at night would have over-estimated savings. It would have been simple to analyze the impact of daytime only operation on the average outdoor temperature yet they indicate that accounting for this issue is too complicated for this type of project.
Rather than dismiss this issue entirely, a very simple sensitivity study could and should be done. If the sensitivity analysis finds the night temperature issue to be an important factor, then this can be addressed easily within the current spreadsheet calculation by having both an average temperature for 24/7 operation and one for a 10-hour day operation. The applicable temperature can be interpolated based upon the hours of operation assuming that short hour units are operating during the day.
Despite these concerns, we believe that the Nexant report should be used for LRAM purposes. It was not possible for Union to adjust all the individual project values in time for this audit, instead an average adjustment was used across all building types. This adjustment reduced the claimed savings by 4 percent for ERV and 23 percent for HRV for the 2009 LRAM value. In future years (2010 and beyond), the building-specific savings values from the Nexant report should be applied to the individual ERV and HRV projects.
6.4 INFRARED HEATER REPORT Enermodal Study As part of the 2009 audit, we reviewed the Enermodal Engineering report Evaluation of Natural gas Fired Infra-red Heaters (March 22, 2010). We do not find that the Enermodel study addressed issues raised in the previous audit and also found an additional area of concern regarding the current infrared heater savings values.
The Enermodal study was conducted in response to an auditor comment on the quasi-prescriptive calculation from the 2008 audit. They indicate the fan power savings for going from unit heaters to infrared heaters is only 1.4 percent of total TRC and conclude, “the slight increase in gas use should be ignored”. Unfortunately, this study completely misses the point of the auditor comments on this issue in 2008. From the 2008 Audit Report:

Union Gas: 2009 DSM Audit 11 ECONorthwest
”The estimates for infrared heaters take credit for reduced electric consumption from the removal of air handler fans, but there is no indication that gas savings were adjusted for this reduction in electric use. Also, the electric use value for unit heaters seems quite high and should be re-checked.”
This study does not provide the assumed base case unit heater fan power or the basis for it, and it does not compare the assumption used with that used in the quasi-prescriptive calculator. The study claims that fan energy is a very small number, however it is apparently large enough to justify having electricity savings in calculator. Either the quasi-prescription calculator needs to not claim fan power savings, or they need to document typical fan power and also account for the decrease in gas savings that result from the reduced fan power. It should be noted that the unit heater fan runs when heat is needed and as such all of the reduced fan heat must be offset by increased heater use. The two numbers are of the same magnitude, so including the electric savings without the gas increase is without merit.
Additional Infrared Heater Issues New issues are raised from our current review of the infrared savings values and relate primarily to the total baseline gas usage assumed in the calculator, and secondarily to the fraction of total consumption that is assumed to be savings. The 2008 quasi-prescriptive tool provided in May of 2009 predicts infrared heater savings of 5,100m3 for each 500 kBtuh of heater capacity. The tool used during 2009 was not provided, but the Navigant report that is purported to be the basis for the new number estimates savings of 0.015m3 per Btuh of heater capacity (7,500m3 for each 500 kBtuh of capacity) with a savings rate of 18.4 percent. From this the assumed base usage of a 500 kBtuh heater is 40,760m3
The Enermodal Engineering report Evaluation of Natural Gas Fired Infra-red Heaters (March 22, 2010) used a set of simulations comparing unit heaters to infrared heaters to investigate the amount of increased infrared heating from removing the unit heater fan. The study simulations predict total gas use averaged across 3 climates and 2 prototypes of 11,800 m
.
3 per 500 kBtuh of heater capacity. In more detail, the average across 3 climates for partially heated spaces is near 6,000 m3 and for fully heated spaces is 17,500 m3
Comparing the baseline usage from the Navigant report to the Enermodal simulations finds a 400 percent difference in baseline usage on average. We recognize there are limits of using Enermodel simulations since they were designed to assess typical fan TRC and not total gas usage. However, the magnitude of difference raises a substantial red flag regarding the prescriptive savings supporting work. Concern is further supported by the relative sophistication of the Enermodel simulations compared to the work supporting the calculator assumptions. The Navigant estimate is based on a 2004 Agviro report that uses an extremely basic bin calculation done in 2 climates with a single set point assumption. The Enermodal estimate is the result of simulations done in three climates with 2 typical set point conditions thus providing significantly more detail.
.
Union Gas: 2009 DSM Audit 12 ECONorthwest
Several issues were identified that would lead the Navigant work to overestimate base usage and savings.8
1) Base Heating Load. The baseline heating load, which the prescriptive savings are based upon, is calculated by Agviro using a bin calculation assuming a 65F balance point. Given a minimal amount of lighting, this basically assumes 24/7 operation at 70F or higher. While not impossible, this clearly represents the extreme case for heat energy use for a given unit capacity. Facilities that are not heated 24/7, are not fully heated, and/or are only heated seasonally will have significantly reduced energy use for the same unit capacity. Plenty of warehouses are operated with the heat totally off until the heart of the heating season and most keep it significantly cooler than 70F. All these factors reduce energy use but leave heater capacity unchanged thus reducing the potential savings for a given capacity. Energy use typically decreases by 3-4 percent per degree reduction in set point, so small changes in average conditions will have a very significant impact on usage and therefore on savings.
Our concerns are summarized below.
2) Baseline Equipment Efficiency. Agviro states they use 80 percent for the unit heater efficiency, but dividing heat load by energy use indicates the actual efficiency level assumed is 68 percent - thus inflating base energy use. The fact the report states 80 percent but uses 68 percent is concerning, and given increased saturation of forced draft unit heaters the use of 68 percent is low.
3) Equipment Sizing. Agviro sizes the heaters to exactly meet the steady state heating load with no extra capacity. Any oversizing of equipment increases the installed capacity but does not change the energy use, thus reducing savings per unit capacity. The Navigant study states that a 20 percent oversizing adjustment is made, but the backup tables are identical to the earlier Agviro study where no oversizing assumed. We suspect that the Navigant study forgot to make the oversizing adjustment for its savings estimates, and the lack of such an adjustment inflates the savings estimate. Furthermore, we believe that a 20 percent oversizing would reflect best practices and actual oversizing is likely to be higher.
4) Infrared heater efficiency. Infrared heater efficiency is assumed to be 15 percent for "conventional" units and 27 percent for 2-stage units. A 1993 paper (MacDonald, R.D., Technical Report: Fuel (HL Series) Infra-Red Heaters. 1993.) is referenced to support the efficiency differential. It is a isolated test conducted on older infrared technology, it assumes a set of controls that may or may not be typical, and Agviro assumes a third of installed units are two-stage with no information supporting the assumption. This results in an average savings of 19 percent. (Note the 18.4% savings estimate by Navigant results from dividing the Agviro savings estimate by a total use estimate of another study). Given that 15 percent is a common estimate of average savings, it already includes the impact of 2-stage units and explicit treatment needs to be based upon significantly better documentation than that presented.
8 The Navigant work is largely based upon work by Agviro that is summarized in “Assessment of Average Infared Heater Savings” (2004).

Union Gas: 2009 DSM Audit 13 ECONorthwest
The combined effect of these factors is a savings value from the infrared heater quasi-prescriptive tool that is likely to overestimate savings substantially. Consequently, we recommend that savings from the quasi-prescriptive infrared calculator be reduced by 66 percent for LRAM purposes. This adjustment uses the Enermodel estimates of base consumption and averaging all the simulations from the Enermodal study results in an average base usage of 11,800 m3 per 500 kBtuh of heater capacity. Assuming a savings value of 15 percent yields a savings value of 1770 m3, which is approximately a 66 percent reduction of the average savings value of 5,000 m3
As discussed above, we do not believe that the 2009 savings values for infrared heaters are accurate. However, developing a new savings estimate for use as an input assumption for 2010 is beyond the scope of this audit and should be conducted as part of Union’s evaluation process. Our recommended adjustment should be applied as part of the 2009 LRAM, but we do not recommend that it be used as an input assumption for 2010 as we did not conduct the evaluation research needed to develop a rigorous savings value. We recommend that Union conduct additional simulations on infrared heaters to address the issues raised above and create a more realistic savings value for 2010.
per 500 kBtuh capacity.
6.5 COMMERCIAL CUSTOM PROJECT REVIEW The firm Michaels Engineering conducted an engineering review of the Commercial Custom program. Their final report Union Gas 2009 Commercial and Industrial Markets Project Verification Final Report (March 2010) was reviewed as part of the 2009 Audit. The evaluation entailed a desk review of 28 custom energy efficiency projects, four of which were subsequently assigned to Diamond Engineering since they were already in the field and therefore could conduct on-sites. The remaining sites did not receive a site visit as part of the evaluation.
An interview was conducted of personnel from Michaels Engineering regarding their general approach and also specific projects. They indicated that several project files contained very little information regarding the savings claim. Twelve of the twenty-eight projects that were directly reviewed by Michaels Engineering had very little information of how savings were calculated or in some cases even what the measure was. There was a slight improvement in Wave 2 applications, which were processed after changes to the claim process. Although the number of poorly documented claims appears to drop off, only one-third of the claims in the sample were considered to have adequate data. Michaels Engineering often calculated savings based on almost no information.
The evaluators reviewed the information available for each project and then assembled questions for the customer. These were submitted to the utility for review and then Michaels called the site and conducted the interview. They indicated that the baseline was an area they actively examined, although in several cases key factors could not be determined. At one site (Site 161), pollution control standards were forcing the change from an ancient burner control to a modern control, they questioned whether the old burner should be the base case and the utility indicated that this treatment had been “deemed appropriate” by the directors and regulators.
The four projects that received a site visit are all at one facility and we recommend a fairly significant adjustment for of these projects due to differing treatment of the interior film coefficients. These sites were actually reviewed by Diamond Engineering as they were able to

Union Gas: 2009 DSM Audit 14 ECONorthwest
conduct on-sites for these projects. The savings estimates were revised downward from Diamond’s original estimates based on conversations with the auditor regarding the interior film coefficient. Given that these projects received significantly different evaluation review from the other projects in the sample, we have removed them from the calculations of the 2009 Audit realization rates discussed below.
These projects demonstrate a situation that really needs M&V planning prior to the measure installation, as the largest uncertainty is the actual performance of the base case. We would only anticipate this on large projects such as these and some distribution contract projects. We recommend that Union establish a savings threshold above which an M&V plan is developed prior to measure installation.
In the majority of cases, there was not enough detail available to allow the audit to compare Michaels Engineering’s savings estimates and verify the underlying assumptions with the actual project conditions. Given the very limited project documentation available for Michaels to review and the very small evaluation budget, we do not believe that this program has been adequately evaluated and do not have any confidence in the savings results presented in this report. However, it is likely that some savings did result from these projects. To correct for the lack of documentation and limited evaluation review, we recommend that an adjustment factor of 0.50 (i.e., savings be reduced by 50 percent) be applied to all commercial custom projects to adjust for potential errors in the savings calculations. As we recommended in the 2008 Audit, we also recommend that zero savings be allowed for custom projects where savings calculations are not adequately documented and evaluated.
The original realization rates and the 2009 Audit realization rates are shown in Table 4. As discussed above, the projects that were reviewed by Diamond Engineering were removed from the sample used to calculate the realization rates for the commercial custom projects, as these projects were less representative of the commercial custom project population in terms of the level of evaluation analysis conducted.
Table 4: Audit Realization Rates for Commercial Contract Custom Projects
Account 2009 Annual Report
2009 Audit Value
Natural Gas 137.5% 50%
Electricity 52.02% 50%
Water 96.5% 50%
Costs 91.2% 91.26%
6.6 DISTRIBUTION CONTRACT CUSTOMERS CUSTOM PROJECTS The third party engineering report 2009 Evaluation of Distribution Contract Custom Projects March 17, 2010) by Diamond Engineering was also reviewed as part of the 2009 Audit. We also interviewed the engineer that produced the final report.
Union Gas: 2009 DSM Audit 15 ECONorthwest
The distribution contract report is very detailed and the calculations were found to be robust. The evaluator provided a high and low estimate of savings from generally new calculations performed on the basis of data collected during site visits. In this case the level of effort allowed key information to be gathered from the site
For the evaluation, Diamond Engineering reviewed 12 projects that were selected by Summit Blue using the sampling method developing in 2007. For five projects, the evaluator increased the measure life was increased from 20 to 30 years. This is highly questionable in cases where the savings are determined over an existing base case. The issue is not whether the new equipment will last 30 years but whether the old existing equipment would have lasted another 30 years. We recommend that clearer standards be developed for the measure life assumptions for these custom projects.
Our primary concern for these projects is with a single customer site (Customer 193) that had a very large savings claim involving a new plant. This single project accounted for over 27 million m3
For this particular project, Diamond Engineering was required by Union to use as a baseline a 1997 plant that is still in operation. Using the 1997 plant as a starting point, a series of questionable adjustments are made in an attempt to make the plant comparable to the new 2007 plant. From the audit standpoint, the mandated baseline and subsequent calculations are entirely inappropriate. An appropriate baseline would be to compare the project with a similar new construction facility that has a less efficient design. Even taking the new facility and simply assuming it was 10 or 20 percent more efficient than some hypothetical new standard efficiency facility would result in a savings estimate that is a fraction of what Union is claiming for this project.
in claimed savings, which is 36 percent of the claimed Distribution Contract custom project savings and 25 percent of the entire 2009 savings claim.
Based on our review of the Diamond Engineering Report and talking to the engineer that did the analysis, Union was able to revise savings for this project based on an alternative base case using a plant that was built around the same period. While this solution was not ideal, it was the best attainable given the audit timeline. Using this new baseline, gas savings were recalculated at 77 percent of the original claimed savings. The revised savings numbers are used as the audit values for both SSM and LRAM. Given the unique nature of this project, its differences from the other projects in the program, and considering its size, we have removed it from the sample used to calculate the realization rates for the other distribution contract custom projects.
In addition to this project, there was a separate project (Customer 256) where we did not believe the savings calculations treat the insulation factor appropriately and therefore significantly over estimate the project savings. Diamond engineering did some additional analysis and lowered their initial savings claim for this project based on comments from the auditor.
The original realization rates and the audit realization rate are shown in Table 5. The adjustment factors from the 2009 Annual Report are those adjustments recommended by Diamond Engineering to be applied to the savings values from the original project application. The 2009 Audit Value adjustments are those recommended by the current audit to be applied to the original claimed savings (in place of the adjustments recommended by Diamond Engineering).
Union Gas: 2009 DSM Audit 16 ECONorthwest
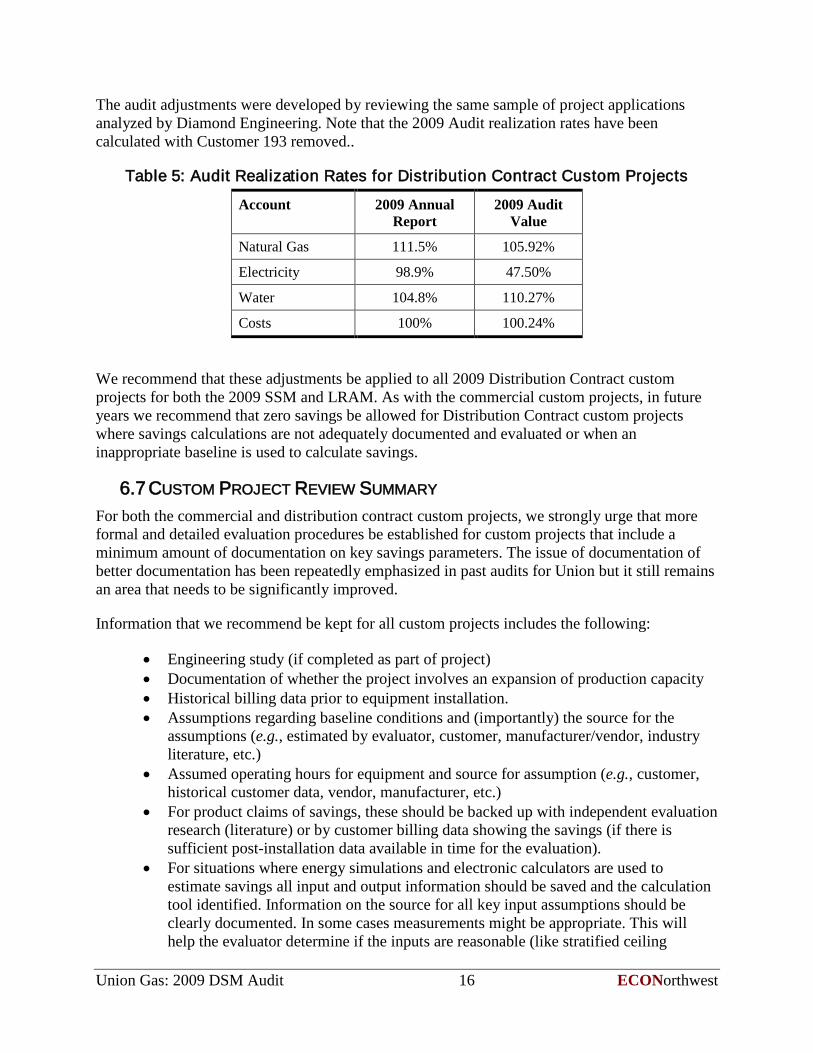
The audit adjustments were developed by reviewing the same sample of project applications analyzed by Diamond Engineering. Note that the 2009 Audit realization rates have been calculated with Customer 193 removed..
Table 5: Audit Realization Rates for Distribution Contract Custom Projects
Account 2009 Annual Report
2009 Audit Value
Natural Gas 111.5% 105.92%
Electricity 98.9% 47.50%
Water 104.8% 110.27%
Costs 100% 100.24%
We recommend that these adjustments be applied to all 2009 Distribution Contract custom projects for both the 2009 SSM and LRAM. As with the commercial custom projects, in future years we recommend that zero savings be allowed for Distribution Contract custom projects where savings calculations are not adequately documented and evaluated or when an inappropriate baseline is used to calculate savings.
6.7 CUSTOM PROJECT REVIEW SUMMARY For both the commercial and distribution contract custom projects, we strongly urge that more formal and detailed evaluation procedures be established for custom projects that include a minimum amount of documentation on key savings parameters. The issue of documentation of better documentation has been repeatedly emphasized in past audits for Union but it still remains an area that needs to be significantly improved.
Information that we recommend be kept for all custom projects includes the following:
• Engineering study (if completed as part of project) • Documentation of whether the project involves an expansion of production capacity • Historical billing data prior to equipment installation. • Assumptions regarding baseline conditions and (importantly) the source for the
assumptions (e.g., estimated by evaluator, customer, manufacturer/vendor, industry literature, etc.)
• Assumed operating hours for equipment and source for assumption (e.g., customer, historical customer data, vendor, manufacturer, etc.)
• For product claims of savings, these should be backed up with independent evaluation research (literature) or by customer billing data showing the savings (if there is sufficient post-installation data available in time for the evaluation).
• For situations where energy simulations and electronic calculators are used to estimate savings all input and output information should be saved and the calculation tool identified. Information on the source for all key input assumptions should be clearly documented. In some cases measurements might be appropriate. This will help the evaluator determine if the inputs are reasonable (like stratified ceiling
Union Gas: 2009 DSM Audit 17 ECONorthwest
temperature). If the information on the inputs is not available, the evaluator should not just accept the savings estimate at face value but instead develop a new estimate based on what they consider reasonable parameters. This should also be clearly documented so that an auditor can review.
• More information about measure context should be gathered by Union and reviewed during the evaluation. For EMS controls, this includes documenting which end uses are being included in the savings estimate (EMS savings are currently calculated as a percentage of overall building energy use). If the measure is EMS for multi-residential, then applying a savings fraction developed for general commercial buildings should raise some flags. It should be clear whether in-unit gas and electric use is included in the overall usage numbers for the site and adjustments made for usage that is not controlled. For boiler measures impacting cycling or standby losses, this would involve a review of the operating characteristics to insure that savings factors appropriate to space heating load boilers are not being applied to boilers with block loads.
It is not feasible for the evaluator to collect all this information after the project has been completed. We recommend that Union Gas develop a procedure where they maintain a file on each custom project and develop a checklist for the key information requirements. This will ensure that relevant information is collected as the project progresses and will be readily available later when the evaluation begins.
We also recommend that all custom projects have an engineering review (perhaps conducted by Union staff as part of the rebate application process) that screens for and asks for documentation of basic inputs to savings calculations. Hours of operation and assumed temperatures should have a few sentences about their origin (e.g., facility operations staff estimate, measurement, manufacturer) and whether there was any check of these numbers. The project files should also include information on gas usage at the customer site.
A related issue is the timing of the evaluation. If an evaluator were engaged earlier in the year, it would be possible to visit some of the custom sites prior to the equipment being installed. It would also allow pre-metering at sites with large and complex projects, which would greatly improve the evaluation results. Having an engineer on staff at Union would help identify potential metering projects and allow for the evaluation team to be involved early in the process. It will also allow for an M&V plan to be created and vetted prior to the project being completed.
Of critical importance is determining the appropriate baseline for custom projects. This was a particular issue this year given several of the custom projects (especially Customer 193). We recommend that along with developing an M&V plan, a standard process be developed that identifies an appropriate baseline for large custom projects. The baseline assumptions should be reviewed and approved by a 3rd
Finally, we strongly recommend that more time and resources should be devoted to evaluating these projects to ensure that the evaluators are able to delve deeper into the custom savings issues. Based on the RFP and contracts developed by Union for both engineering firms, only a
party during the first stage of the evaluation process. As the current audit illustrates, it is not feasible to identify and resolve baseline issues after the evaluation work has been completed.
Union Gas: 2009 DSM Audit 18 ECONorthwest
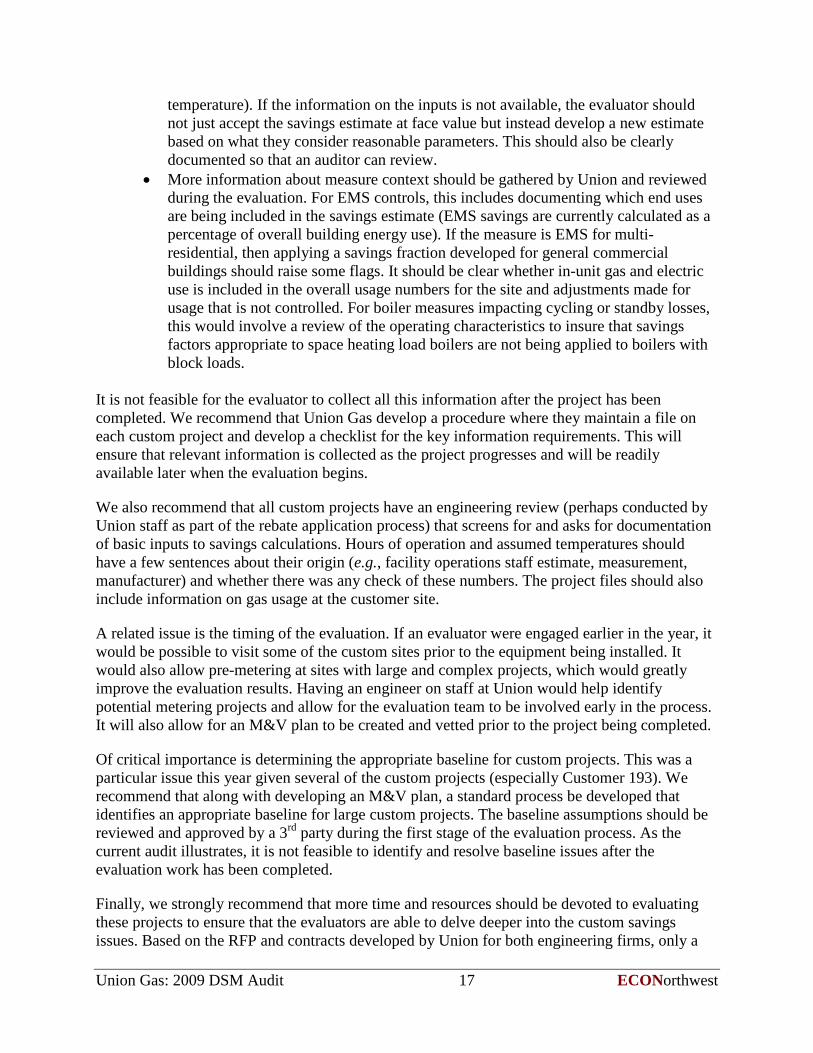
minimal amount of resources were allocated for these programs. A general guideline for evaluation is for evaluation budgets to be roughly 5 percent of implementation budgets. This threshold is shown in Table 6 and compared with the actual evaluation budgets for the 2009 custom programs.
Table 6: Evaluation Spending
Program 2009 Implementation Budget
5% of Implementation
Budget
Actual 2009 3rd
Commercial
Party
Engineering Studies*
$4,637,816 $231,891 $26,247
Distribution Customer Custom $5,022,108 $251,105 $66,017 *Total includes only 3rd
7. MARKET TRANSFORMATION
party engineering studies, does not include any other evaluation research.
ECONorthwest reviewed the work completed by Union to show progress on its market transformation programs. We also reviewed the action taken on our recommendations in our audit of the 2008 Annual Report.
In our audit of the 2008 Annual Report, ECONorthwest made three recommendations for the Market Transformation program. In its “Summary Results and Responses to the Audit,” Union Gas responded that it will review the recommendations with the EAC for consideration in future Market transformation survey and scorecard design. The recommendations and their status are as follows.
• Define the various levels of familiarity. Union Gas incorporated this recommendation into the 2009 Customer and Builder surveys—the surveys now include more descriptive levels of familiarity.
• Accept progress on market transformation metrics only in cases where there is a statistically significant change. This recommendation was not incorporated into the 2009 metrics.
The Union Gas market transformation program targeted the Drain Water Heat Recovery (DWHR) technology to the residential new construction sector in 2007, 2008, and 2009. Union Gas developed several market transformation metrics to assess progress toward its goals. According to the Union Gas 2009 Annual Report, the metrics are:
• Number of participating builders as tracked by the program;
• Overall number of units installed as a percentage of housing starts as tracked by the program and available housing starts for Union’s franchise;
• Customer awareness of the technology as determined through a market survey; and
• Builder awareness of the technology as determined through a market survey.
Union Gas: 2009 DSM Audit 19 ECONorthwest
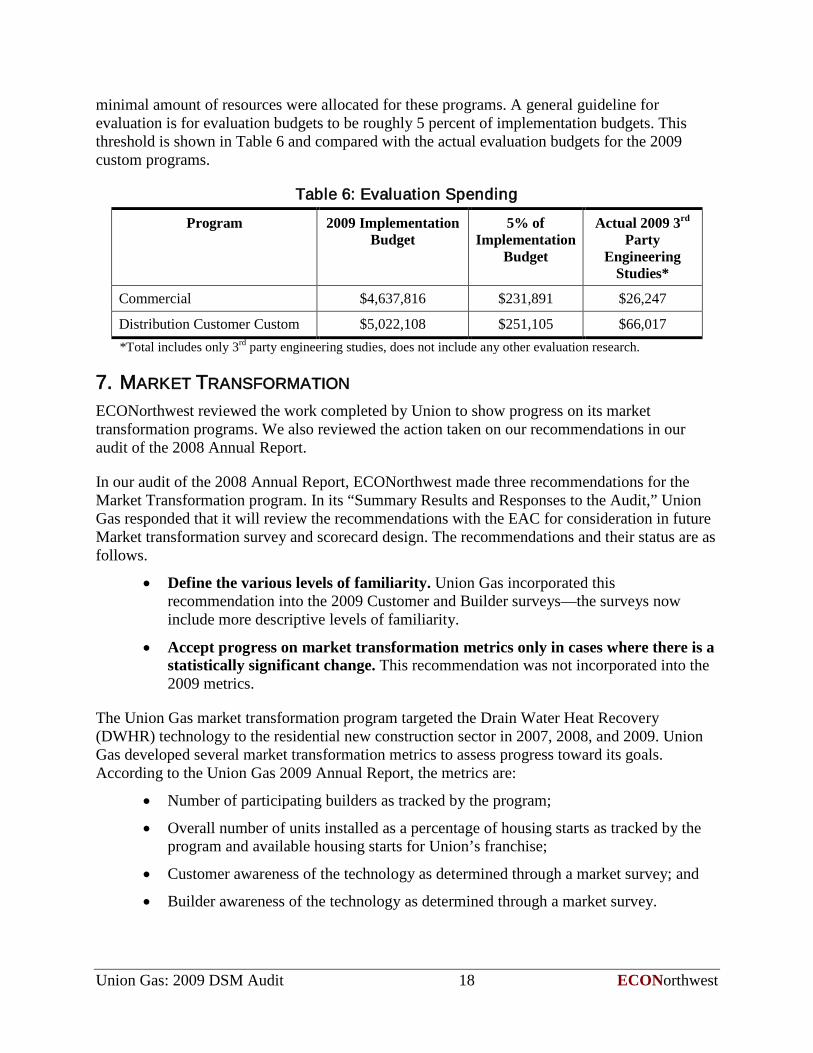
The 2009 Annual Report shows the 2009 MT Scorecard Results in Table 8.1 of the report. Union Gas provided ECONorthwest a corrected version of the table in a spreadsheet to ECO titled “MT Scorecard updated April 9.xlsx”, shown below in Figure 1. The MT Scorecard records progress toward each metric. The metrics are divided between ultimate outcomes and market effects.
Figure 1. 2009 Market Transformation Scorecard Results (Revised)
We assume the program’s ultimate outcomes—the number of builders enrolled and number of units installed as a percentage of 2009 housing starts—are tracked by internal program databases. ECONorthwest did not attempt to verify the builder enrollment or units installed as part of this audit.
The market effects metrics are measured with two different survey instruments, one for household (customers) and one for builders. Union Gas provided ECO the survey instruments for the Customer Awareness and Builder Knowledge as well as the raw data from the survey respondents.
Calculation of Score The 2009 Annual Report does not explain how the score shown in the scorecard is calculated, but Union Gas provided an explanation during the course of this audit. The scorecard shows the required results to meet 50, 100, and 150 percent of the performance metrics. For example, for Customer Awareness, 32 percent of the respondents must have confirmed awareness for Union Gas to receive 50 percent of the score for that metric. To receive 100 percent, 36 percent of the respondents must have confirmed awareness. The difference between a 50 and 100 percent score is the difference between 32 and 36 percent confirmed awareness, or four percentage points. The result this year was 30 percent awareness, two percentage points below the 50 percent score. Union Gas explained that since the difference between 50 and 100 percent is four percentage points, they calculated that a decline of two percentage points is half of four, so the percent score should 50 percent divided by two, or 25 percent.
Residential customers survey The Survey Report for Residential customers states that 502 interviews were completed with new housing customers in Union’s franchise area. The Survey Report states that the survey sample size yielded an overall margin of error of +/-3.5 percent at a 90 percent confidence interval. To measure market effects, the report used what it called confirmed awareness. Confirmed awareness is calculated by cross-tabulating respondents who answered yes to the question “Have you heard of a DWHR system for residential homes?” with respondents who reported to have a thorough understanding or know something of the DWHR technology.
Union Gas: 2009 DSM Audit 20 ECONorthwest
According to the data and the survey report, 30 percent of the respondents had confirmed awareness, two percentage points lower than in 2008.
In the 2009 ECONorthwest audit, we recommended that Union Gas only accept progress on market transformation metrics in cases where there is a statistically significant change. The 2009 Annual Report did not incorporate this recommendation. We also reiterate our recommendation that the confidence bounds for the specific questions used to measure market transformation progress be included in the Annual Report.
The survey results are actually lower in 2009, and no improvement in market effects can be shown. Because the margin is +/-3.5 percent, the difference is not statistically significant. If no improvement can be shown, we recommend that zero points be applied for that element. ECONorthwest recommends changing the score from 3.75 (of 15 points) to 0 points for this metric. This change reduces the total score to 105 out of 100 points, or 105 percent.
Home Builders survey The Survey Report for Home Builders states that 100 interviews were completed with builders across Ontario. The Survey Report states that the survey sample size yielded an overall margin of error of +/-7.8 percent at a 90 percent confidence interval. Confirmed awareness is determined in the same manner as in the Residential sector. According to the data and the survey report, 70 percent of the respondents had confirmed awareness, five percentage points lower than in 2008. Because the margin is +/-7.8 percent, the difference is not significantly different. The score for the Builder Knowledge survey is already 0 in the updated MT Scorecard, and ECONorthwest believes that score is appropriate.
The combined effect of the zero scores for both the Customer and Builders survey metrics results in the overall MT score dropping from 108.75 to 105, or 105 percent. We recommend that the score of 105 be used for the 2009 Union Gas Market Transformation program and that the recommendations discussed above be adopted in future years.
8. AUDIT RECOMMENDATIONS We recommend the following adjustments be applied to the 2009 DSM results:
• For Low Income bath and kitchen aerators, apply the Beslin retention adjustments from the ESK programs in the input assumptions.
• For showerheads in the Home Retrofit program, move all participants falling in the two highest savings ranges (2.0-2.5 gpm existing and greater than 2.6 gpm existing) into the lowest savings category.
• For commercial custom projects, adjust savings for projects 244 and 245 using the revised savings calculations provided by Diamond Engineering during the audit.
• Savings for all other commercial custom projects should be reduced by 50 percent for gas, water, and electricity. These adjustments are to be done in place of the adjustment factors recommended the by the 3rd party engineer.
Union Gas: 2009 DSM Audit 21 ECONorthwest
• For Distribution Contract custom projects, adopt the adjusted savings values developed by Diamond Engineering during the course of the audit for the 12 projects included in the evaluation sample. Of these twelve projects, Customer 193 should be removed from the sample when calculating the realization rate to be applied to the Distribution Contract custom project population.
• For the remaining Distribution Contract custom projects outside the sample of 12, apply an adjustment factor of 105 percent for gas savings, 47 percent for electricity savings, and 110 percent for water savings. These adjustments are to be done in place of the adjustment factors recommended the by the 3rd
• Adopt the savings values from Nexant report on ERV and HRV savings. This was done with an average adjustment for 2009. In 2010, the building-specific savings values should be applied to each individual project.
party engineer.
• Reduce infrared heater savings by 66 percent. Additional evaluation work should be conducted to develop a new savings estimate for use in 2010.
• Apply a free ridership rate of 54 percent to all custom projects (industrial, commercial, agriculture, and distribution) as recommended by Summit Blue in Custom Projects Attribution Study, dated October 31, 2008.
• For showerheads in the Low Income program, change the natural gas savings per unit from 66 m3 for the 2.0-2.5 existing category to 46 m3, and from 116 m3 for the greater 2.6 gpm existing category to 88 m3
We reiterate the same issues from the 2008 audit and recommend that the following adjustments be made to future DSM claims:
.
• Disallow savings for custom projects that are not adequately documented and/or evaluated.
• Only allow market transformation claims when the relevant survey results show statistically significant progress from the baseline.
Table 7 shows the original values for SSM, TRC, and LRAM from the 2009 Annual Report and with the changes recommended as part of the 2009 Audit. If the changes recommended by the 2009 Audit are adopted, we believe that the TRC savings, SSM amount recoverable, LRAM amount recoverable and DSMVA amount recoverable are correctly calculated using reasonable assumptions, based on data that have been gathered and recorded using reasonable methods and accurate in all material respects, and following the rules and principles set down by the Ontario Energy Board.

Union Gas: 2009 DSM Audit 22 ECONorthwest
Table 7: Audit Adjustments to SSM, TRC, LRAM, and DSMVA
Account 2009 Annual Report 2009 Audit Value % Change
Gas Savings SSM (m3 108,975 000’s) 99,343 -9%
Gas Savings LRAM (m3 108,975 000’s) 92,604 -15%
SSM $8,921,583* $8,751,232 -2%
TRC $345,110,572 $308,255,602 -11%
DSMVA (Total Program Spending)
$22,222,457 $22,222,457 0%
*The SSM payout is capped at $8,921,583. The actual calculated annual report SSM was $10,425,218.
The following are recommendations for future evaluation research.
• Conduct new free ridership studies (both residential and commercial) with the survey questions and scoring methods thoroughly vetted prior to fielding the survey. This will allow for a study to be completed that provides results that can be applied with confidence to the savings estimates. We also recommend a method that utilizes fewer questions with a less complicated weighting scheme. Having the survey questions and scoring method reviewed prior to fielding the survey will help ensure that the study produces results that can be used in the net savings calculations.
• Use larger samples for engineering review, covering the major equipment types and end uses. Future engineering reviews should utilize larger project samples so that statistically representative samples for the major measures and end uses within sectors are represented. This will allow the sample results to be extrapolated to the population with a greater degree of confidence. Additional suggestions for the custom project sampling are included in the main body of this report.
• More project detail needed in the engineering review report. For the projects reviewed by the third party engineers, much more detail should be made available. This includes any engineering site or design reports, documentation of assumptions used to calculate savings, information on existing equipment, and any other information that is necessary for an auditor to see how savings are calculated and to have confidence in the underlying savings calculation parameters. Examples of the types of documentation that should be maintained and the types of issues that should be addressed in the evaluation are discussed in the main body of this audit report.
• Allocate more resources for evaluation, particularly for custom projects. As discussed above, 2009 spending on custom project evaluation is much lower than what is typically done in other jurisdictions and consequently is not yielding reliable estimates of savings. Having an engineer at Union monitor applications and require M&V plans for larger projects will also help improve the evaluation results for these programs.
Union Gas: 2009 DSM Audit 23 ECONorthwest
• Establish a process for identifying and vetting baseline assumptions early in the evaluation. Baseline issues were a significant source of contention during this audit and will always be a critical part of determining program savings. In the cases of custom projects, we recommend that the baseline assumptions be identified early in the evaluation process (such as during the application approval stage) and then vetted by an independent 3rd party. Given the complexity of the baseline issues for these projects, discussion of the appropriate baseline should not be postponed until the audit stage as it has been in recent years.