audit of water savings · pdf fileaudit of water savings shepparton and central goulburn 1-4...
TRANSCRIPT

Audit of Water Savings Shepparton and Central Goulburn 1-4
Prepared for Department of Sustainability and Environment
November 2011 Job Number: 3603-11

Audit of Water Savings Prepared for Department of Sustainability and Environment
November 2011 Version 1 Page i Commercial in Confidence \\Bnesan01p\mts$\3603-11 DSE Audit of Water Savings\Reports\Final Reports\Audit of Water Savings 2011 - G-MW - FINAL.docx
Cardno (Qld) Pty Ltd
ABN 57 051 074 992
Level 11 Green Square North Tower
515 St Paul’s Terrace
Fortitude Valley Qld 4006
Locked Bag 4006 Fortitude Valley
Queensland 4006 Australia
Telephone: 07 3369 9822
Facsimile: 07 3369 9722
International: +61 7 3369 9822
www.cardno.com.au
Document Control
Version Date Author Reviewer
Version 1 November 2011 Stephen Walker
Robecca Gilham
"© 2011 Cardno (Qld) Pty Ltd All Rights Reserved. Copyright in the whole and every part of this document belongs to Cardno (Qld) Pty Ltd and may not be used, sold, transferred, copied or reproduced in whole or in part in any manner or form or in or on any media to any person without the prior written consent of Cardno (Qld) Pty Ltd.”

Audit of Water Savings Prepared for Department of Sustainability and Environment
November 2011 Version 1 Page ii Commercial in Confidence \\Bnesan01p\mts$\3603-11 DSE Audit of Water Savings\Reports\Final Reports\Audit of Water Savings 2011 - G-MW - FINAL.docx
Summary of Findings
This report details the findings of Cardno’s audit of the estimates of the water savings achieved through the Shepparton and Central Goulburn 1-4 irrigation modernisation projects. The report details the Phase 3 water savings estimates for the 2010/11 irrigation season. For this year, Phase 4 water savings estimates have also been audited. However, these have been based on operating data from the 2009/10 irrigation season. These water savings estimates have been prepared by Goulburn-Murray Water (G-MW).
A separate audit report has been prepared for the water savings achieved by the Northern Victoria Irrigation Renewal Project (NVIRP).
Audited Water Savings Estimates
The audited Phase 3 and Phase 4 water saving estimates are summarised in the following tables:
Audited Phase 3 Water Savings Estimates (2010/11)
Water Savings Intervention Shepparton Central Goulburn 1-4
Channel Rationalisation
Seepage (ML) 964 21
Bank Leakage (ML) 40 18
Evaporation (ML) 426 6
Total - Channel Rationalisation (ML) 1,430 45
Channel Automation
Outfalls (ML) 4,376 139
Bank Leakage (ML) 6 65
Total - Channel Automation(ML) 4,382 204
Service Point Replacement
Meter error (ML) 2,167 1,189
Leakage through service points (ML) 3,111 758
Leakage around service points (ML) 678 167
Unauthorised Use (ML) 333 101
Total - Service Point Replacement (ML) 6,290 2,215
Service Point Rationalisation
Leakage through service points (ML) 590 113
Leakage around service points (ML) 124 24
Unauthorised Use (ML) 76 18
Total - Service Point Rationalisation (ML) 790 155
Channel Remediation
Bank Leakage (ML) 129 909
Seepage (ML) 575 125
Evaporation (ML) 329 -
Total - Channel Remediation (ML) 1,032 1,034
TOTAL - All sources (ML) 13,925 3,652

Audit of Water Savings Prepared for Department of Sustainability and Environment
November 2011 Version 1 Page iii Commercial in Confidence \\Bnesan01p\mts$\3603-11 DSE Audit of Water Savings\Reports\Final Reports\Audit of Water Savings 2011 - G-MW - FINAL.docx
Audited Phase 4 Water Savings Estimates (2009/10)
Water Savings Intervention Shepparton Central Goulburn 1-4 Channel Rationalisation
Seepage (ML) 754 22
Bank Leakage (ML) 420 33
Evaporation (ML) 493 8
Total - Channel Rationalisation (ML) 1,667 64
Channel Automation
Outfalls (ML) 22,197 4,621
Bank Leakage (ML) 56 -
Total - Channel Automation(ML) 22,252 4,621
Service Point Replacement
Meter error (ML) 9,312 4,951
Leakage through service points (ML) 2,393 1,039
Leakage around service points (ML) 620 269
Unauthorised Use (ML) 1,527 664
Total - Service Point Replacement (ML) 13,851 6,923
Service Point Rationalisation
Leakage through service points (ML) 574 139
Leakage around service points (ML) 121 29
Unauthorised Use (ML) 353 85
Total - Service Point Rationalisation (ML) 1,048 253
Channel Remediation
Bank Leakage (ML) 184 3,377
Seepage (ML) 15 219
Evaporation (ML) 4 -
Total - Channel Remediation (ML) 203 3,596
TOTAL - All sources (ML) 39,022 15,457
Systems and Processes
Our review for the 2010/11 audit of the systems and processes used by G-MW and NVIRP has found that they continue to be sufficiently robust to generate data and inputs are that are accurate as could reasonably be expected for the purpose of calculating water savings.
We believe that G-MW must improve how it records and uses outfall data for the purpose of water savings calculations. Our recommendations for this area are summarised in our response to Item 4 from 2009/10 in Appendix A of the NVIRP audit report for this year. We are of the opinion that G-MW Operations must take the lead in these initiatives and that these should be largely implemented before the commencement of the 2012/13 irrigation season given that two years have passed since the first recommendations were made in this area.
We found no discrepancies in the meter delivery volumes used in calculations and sourced from IPM for individual service points. We found when trailing total customer delivery volumes that G-MW includes and excludes some different volumes for different reporting purposes. We are satisfied that the correct inclusions and exclusions have been made for the purposes of calculating water savings.

Audit of Water Savings Prepared for Department of Sustainability and Environment
November 2011 Version 1 Page iv Commercial in Confidence \\Bnesan01p\mts$\3603-11 DSE Audit of Water Savings\Reports\Final Reports\Audit of Water Savings 2011 - G-MW - FINAL.docx
Water Savings Protocol Reporting Requirements
The Department of Sustainability and Environment’s Water Savings Protocol sets out the approach to be taken to the independent audit of water savings. The scope of independent audit work relating to irrigation modernisation is to include the elements detailed below. Our finding against each element is also addressed this below.
Verifying that the Phase 3 (and Phase 4) water savings calculations have been calculated in accordance with the Technical Manual for the Quantification of Water Savings.
We found that G-MW had determined water savings in accordance with the Technical Manual. We discuss the application of water savings calculations in Section 6 of this report.
Checking that the data collection and inputs are as accurate as could reasonably be expected for the purpose of calculating water savings.
Our review of the systems and processes used by G-MW has found that they are generally sufficiently robust to generate data and inputs that are accurate as could reasonably be expected for the purpose of calculating water savings. However, we believe that G-MW need to improve how it records and uses outfall data for the purpose of water savings calculations. Our detailed findings are outlined in Section 5 of this report.
Spot checks that the program of works has been implemented as documented in the water saving calculations.
We visited a selection of sites in the Goulburn Murray Irrigation District where irrigation modernisation works have been completed. This visit provided assurance that works have been implemented as documented in the water saving calculations. However, given that the works in the Shepparton and Central Goulburn 1-4 areas are largely complete, we did not specifically visit these areas this year. We discuss the site visits undertaken in Section 3.3 of this report.
Checking that water savings have been calculated based on the nature and the extent of all modernisation works completed prior to 15th May in the year of the audit.
To address this requirement, we have visited a selection of works sites as noted above and we have cross checked asset commissioning certificates against the dates used in the water savings calculations. While we noted a number of discrepancies between the commissioning dates for service points and those used in the calculations, these were not significant. We discuss these issues further in Section 3.3, Section 5.1 and Section 6 of this report.
Providing a corrected estimate of the water savings for any component where the project proponent calculations are found to be non-compliant or deficient.
Our corrected estimate is provided in the Summary of Findings and in the sub-sections of Section 6 of this report. As a result of the audit, the Phase 3 water savings estimated by G-MW were adjusted by around 9% while there was no change made to the Phase 4 water savings estimates.

Audit of Water Savings Prepared for Department of Sustainability and Environment
November 2011 Version 1 Page v Commercial in Confidence \\Bnesan01p\mts$\3603-11 DSE Audit of Water Savings\Reports\Final Reports\Audit of Water Savings 2011 - G-MW - FINAL.docx
Identifying potential improvements to the data collection, data analysis, assumptions and methods used to estimate the water savings. Recommend changes to the Technical Manual for the Quantification of Water Savings to the Director of Allocations and Licences within DSE that will improve useability and accuracy of water savings.
We make recommendation for improving the water savings estimation process and Technical Manual in Section 8 of this report.
Checking if suggestions from the previous year’s audit have been actioned upon and report upon the status of each of the suggested improvements.
We have reviewed the progress of NVIRP and G-MW in achieving the recommendations from the 2008/09 and 2009/10 audits and found that significant work has been undertaken through various working groups. To avoid repetition, we detail our findings in the 2010/11 NVIRP area water savings audit report only.
Audit of Water Savings Prepared for Department of Sustainability and Environment
November 2011 Version 1 Page vi Commercial in Confidence \\Bnesan01p\mts$\3603-11 DSE Audit of Water Savings\Reports\Final Reports\Audit of Water Savings 2011 - G-MW - FINAL.docx
GLOSSARY
A Ratio of the length of channel to be or actually automated to the total length of channel in the defined system (%)
CG Central Goulburn
CG134 Central Goulburn Channel 1, 3 and 4
CG2 Central Goulburn Channel 2 System
CL Ratio of length of spur channel length rationalised to total spur channel length in system
Dbase Customer Deliveries in the Baseline Year in the irrigation system
DF Durability factor to account for the durability of water savings interventions
DF Durability factor to account for the durability of water savings interventions
DFerror Durability factor for reducing measurement error
DFleakage around Durability factor for reducing leakage around the meter
DFleakage through Durability factor for reducing leakage through the meter
DFunauthorised Durability factor for reducing unauthorised use
DMbase Customer deliveries through the Rationalised meters in the Baseline Year
DMYear X Customer deliveries through the replaced meters for the year in question
DSE The Department of Sustainability and Environment
DYear x Customer deliveries in the year in question to the irrigation system
EBase Evaporation in Baseline Year
EFbank leakage Effectiveness Factor Channel automation (bank leakage)
EFerror Effectiveness Factor for reducing measurement error
EFleakage around Effectiveness Factor for reducing leakage around the meter
EFleakage through Effectiveness Factor for reducing leakage through the meter
EFrationaliation Effectiveness Factor for channel rationalisation
EFremediation Effectiveness Factor for channel remediation
EFunauthorised Effectiveness Factor for reducing unauthorised use
F(LTCEBase) Long Term Cap Equivalent Factor to convert Baseline Year volumes to Long Term Cap Equivalent volume
F(LTCEYear X) Long Term Cap Equivalent Factor to convert Current Year volumes to Long Term Cap Equivalent volume
F(PA) Pondage Testing Adjustment Factor to account for dynamic losses in addition to static losses
FL Proportion of bank leakage recognised as fixed
GIS Geographic Information System
GMID Goulburn Murray Irrigation District

Audit of Water Savings Prepared for Department of Sustainability and Environment
November 2011 Version 1 Page vii Commercial in Confidence \\Bnesan01p\mts$\3603-11 DSE Audit of Water Savings\Reports\Final Reports\Audit of Water Savings 2011 - G-MW - FINAL.docx
G-MW Goulburn Murray Water
IPM Irrigation Planning Module
ITP Inspection Test Procedure
LBase Leakage in Baseline Year
LPost works Post works bank leakage
LTA Defined Fixed Leakage Rate (ML/year/service point) around service points
LTT Defined Fixed Leakage Rate (ML/year/service point) through service points
M&E mechanical and electrical
MCF Adopted Meter Correction Factor for Dethridge Meter Service Points or associated with deemed Service Points
MV Murray Valley
Nrationalised Number of meters rationalised
Nreplaced Number of meters replaced
NVIRP Northern Victoria Irrigation Renewal Project
OBase Outfalls in Baseline Year
OPyearx Ratio of the length of time a channel has been automated in the year in question relative to the irrigation season length in the Baseline Year
Oyearx Outfalls in Current Year
PB Pyramid-Boort
RL Ratio of length of channel length remediated to total channel length in system
RO Rochester
SBase Seepage in Baseline Year
SCADA supervisory control and data acquisition
SH Shepparton
SMC Stuart Murray Canal
SMP Strategic Measurement Project
Spost works Post works seepage
the Manual the Water Savings Protocol Technical Manual
the Protocol the Water Savings Protocol for the Quantification of Water Savings from Irrigation Modernisation Projects
the Technical Manual
Technical Manual for the Quantification of Water Savings
tm Ratio of the length of time that the service point was replaced for irrigation purposes in the year in question to the irrigation season length in the Baseline Year
TO Torrumbarry
tr Ratio of the length of time a channel has been rationalised in the year in question relative to the

Audit of Water Savings Prepared for Department of Sustainability and Environment
November 2011 Version 1 Page viii Commercial in Confidence \\Bnesan01p\mts$\3603-11 DSE Audit of Water Savings\Reports\Final Reports\Audit of Water Savings 2011 - G-MW - FINAL.docx
irrigation season length in the Baseline Year
TSA Transfield Service Australia
UBase Unauthorised use loss in the Baseline Year
Vd Deemed customer deliveries through individual unmetered service points in the Baseline Year
VL Proportion of bank leakage recognised as variable
WEE Water Entitlement Entity

Audit of Water Savings Prepared for Department of Sustainability and Environment
November 2011 Version 1 Page ix Commercial in Confidence \\Bnesan01p\mts$\3603-11 DSE Audit of Water Savings\Reports\Final Reports\Audit of Water Savings 2011 - G-MW - FINAL.docx
Table of Contents
Summary of Findings .............................................................................................................................................................. ii
Glossary ................................................................................................................................................................................... vi
1 INTRODUCTION .............................................................................................................................................................. 1
2 BACKGROUND ............................................................................................................................................................... 3
2.1 Goulburn Murray Irrigation District .......................................................................................................................... 3
2.2 Irrigation Modernisation .......................................................................................................................................... 3
2.3 Water Savings Protocol .......................................................................................................................................... 4
3 AUDIT METHODOLOGY ................................................................................................................................................. 5
3.1 Audit Process under the Audit Protocol .................................................................................................................. 5
3.2 Overview of Audit Methodology .............................................................................................................................. 6
3.3 Site Visits ................................................................................................................................................................ 7
3.4 Schedule of Audit Meetings .................................................................................................................................... 8
3.5 Document Register ................................................................................................................................................. 8
4 IRRIGATION RENEWAL IN SHEPPARTON AND CENTRAL GOULBURN 1-4 ........................................................... 9
4.1 Introduction ............................................................................................................................................................. 9
4.2 Prior Works Programs ............................................................................................................................................ 9
4.3 Shepparton and Central Goulburn 1-4 Project ..................................................................................................... 10
4.4 Northern Victoria Irrigation Renewal Project......................................................................................................... 10
5 AUDIT FINDINGS – SYSTEMS AND PROCESSES ..................................................................................................... 11
5.1 Introduction ........................................................................................................................................................... 11
5.2 Asset Planning, Design, Construction and Handover ........................................................................................... 11
5.3 Information Systems Overview ............................................................................................................................. 12
5.4 Outfall Flow Data .................................................................................................................................................. 13
5.5 Irrigation Planning Module .................................................................................................................................... 14
5.6 Pondage Testing .................................................................................................................................................. 14
5.7 Conclusions .......................................................................................................................................................... 15
5.8 Recommendations ................................................................................................................................................ 15
6 AUDIT FINDINGS – WATER SAVINGS CALCULATIONS .......................................................................................... 17
6.1 Application of the Technical Manual formulae and determination of long-term savings ....................................... 17
6.2 Phase 4 water savings calculations ...................................................................................................................... 17
6.3 Savings from Channel Rationalisation .................................................................................................................. 17
6.4 Savings from Channel Automation ....................................................................................................................... 21
6.5 Savings from Service Point Replacement and Rationalisation ............................................................................. 25
6.6 Savings from Channel Remediation ..................................................................................................................... 29
7 PROGRESS AGAINST PREVIOUS AUDIT RECOMMENDATIONS ............................................................................ 33
8 RECOMMENDATIONS ON TECHNICAL MANUAL AND WATER SAVINGS APPROACH ....................................... 34

Audit of Water Savings Prepared for Department of Sustainability and Environment
November 2011 Version 1 Page x Commercial in Confidence \\Bnesan01p\mts$\3603-11 DSE Audit of Water Savings\Reports\Final Reports\Audit of Water Savings 2011 - G-MW - FINAL.docx
Figures
Figure 2-1 Goulburn Murray Irrigation District ..................................................................................................................... 3
Figure 3-1 Overview of Audit Methodology ......................................................................................................................... 7
Figure 4-1 Timeline of Irrigation Modernisation Programs .................................................................................................. 9
Tables
Table 3-1 Schedule of Audit Meetings ............................................................................................................................... 8
Table 6-1 Fixed Parameters and Baseline Year Parameters for Channel Rationalisation Water Savings Calculation19
Table 6-2 Current Year Parameters for Channel Rationalisation Water Savings Calculation ........................................ 19
Table 6-3 Phase 3 Water Savings due to Chanel Rationalisation .................................................................................. 20
Table 6-4 Phase 4 Water Savings due to Chanel Rationalisation .................................................................................. 20
Table 6-5 Extent of Automation by Irrigation Area .......................................................................................................... 21
Table 6-6 Fixed Parameters and Baseline Year Parameters for Automation Water Savings Calculation ....................... 22
Table 6-7 Current Year Parameters for Automation Water Savings Calculation ............................................................ 22
Table 6-8 Phase 3 and Phase 4 Water Savings due to Chanel Automation .................................................................. 24
Table 6-9 Extent of Meter Replacement and Rationalisation by Irrigation Area at end of 2008/09 Season ................... 25
Table 6-10 Fixed Parameters and Baseline Year Parameters for Service Point Replacement and Rationalisation Water Savings Calculation ......................................................................................................................................... 27
Table 6-11 Current Year Parameters for Service Point Replacement and Rationalisation Water Savings Calculation .... 28
Table 6-12 Phase 3 and Phase 4 Water Savings due to Service Point Replacement ....................................................... 29
Table 6-13 Phase 3 and Phase Water Savings due to Service Point Rationalisation ....................................................... 29
Table 6-14 Calculation methods for Channel remediation works ...................................................................................... 30
Table 6-15 Fixed Parameters and Baseline Year Parameters for Channel Remediation Water Savings Calculation ...... 31
Table 6-16 Current Year Parameters for Channel Remediation Water Savings Calculation ............................................. 31
Table 6-17 Phase 3 Water Savings due to Channel Remediation ..................................................................................... 32
Appendices
Appendix 1 – Schedule of Sites Visited
Appendix 2 – Schedule of Documents Received

Audit of Water Savings Prepared for Department of Sustainability and Environment
November 2011 Version 1 Page 1 Commercial in Confidence \\Bnesan01p\mts$\3603-11 DSE Audit of Water Savings\Reports\Final Reports\Audit of Water Savings 2011 - G-MW - FINAL.docx
1 INTRODUCTION
Cardno has been engaged by the Department of Sustainability and Environment to undertake an independent audit of the water saving achieved through irrigation renewal in the Goulburn Murray Irrigation District during the 2010/11 irrigation season. The water savings referred to in this report have been achieved in the Shepparton Irrigation Area and Central Goulburn Channels 1-4. These areas are outside the Northern Victoria Irrigation Renewal Project (NVIRP) and are the responsibility of Goulburn Murray Water. A separate report has been prepared and released concurrently for the water savings achieved by NVIRP for the 2010/11 irrigation season.
More detail on the irrigation modernisation works undertaken in the Goulburn Murray Irrigation District is provided in Section 4.
The Victorian Government has developed the Water Savings Protocol for the Quantification of Water Savings from Irrigation Modernisation Projects (the Protocol).
The Protocol is a series of documents, which together, aim to provide transparency and consistency in the estimation and allocation of water savings derived from irrigation modernisation projects. It has been developed based on the key principles of the draft Northern Region Sustainable Water Strategy and is applicable State-wide. The Protocol includes a Technical Manual for the Quantification of Water Savings (the Technical Manual).
The Protocol defines the scope of the independent audit of water savings to include:
1. Verifying that the Phase 3 (and Phase 4) water savings calculations have been calculated in accordance with the Technical Manual for the Quantification of Water Savings.
2. Checking that the data collection and inputs are as accurate as could reasonably be expected for the purpose of calculating water savings.
3. Spot checks that the program of works has been implemented as documented in the water saving calculations.
4. Checking that water savings have been calculated based on the nature and the extent of all modernisation works completed prior to 15th May in the year of the audit.
5. Providing a corrected estimate of the water savings for any component where the project proponent calculations are found to be non-compliant or deficient.
6. Identifying potential improvements to the data collection, data analysis, assumptions and methods used to estimate the water savings. Recommend changes to the Technical Manual for the Quantification of Water Savings to the Director of Allocations and Licences within DSE that will improve useability and accuracy of water savings.
7. Checking if suggestions from the previous year’s audit have been actioned upon and report upon the status of each of the suggested improvements.
This is the third audit of annual water savings achieved following the first audit which was completed for the 2008/09 irrigation season. One internal and one external audit of baseline water balance and water loss data have been completed to date. Baseline year water balance data is an important input into the water savings calculations. Given two audits have been completed, this audit has accepted the baseline year parameters without additional scrutiny.

Audit of Water Savings Prepared for Department of Sustainability and Environment
November 2011 Version 1 Page 2 Commercial in Confidence \\Bnesan01p\mts$\3603-11 DSE Audit of Water Savings\Reports\Final Reports\Audit of Water Savings 2011 - G-MW - FINAL.docx
Both Phase 3 and Phase 4 water savings estimates have been audit this year. Only Phase 3 savings were audited in 2009/10. However, the Phase 4 water savings estimates are based on the operating data from the 2009/10 season, not the 2010/11 season.

Audit of Water Savings Prepared for Department of Sustainability and Environment
November 2011 Version 1 Page 3 Commercial in Confidence \\Bnesan01p\mts$\3603-11 DSE Audit of Water Savings\Reports\Final Reports\Audit of Water Savings 2011 - G-MW - FINAL.docx
2 BACKGROUND
2.1 GOULBURN MURRAY IRRIGATION DISTRICT
The Goulburn Murray Irrigation District (GMID) is composed of the following six main irrigation areas located in northern Victoria:
Central Goulburn (CG);
Murray Valley (MV);
Pyramid-Boort (PB);
Rochester (RO);
Shepparton (SH); and
Torrumbarry (TO).
Goulburn Murray Water (G-MW) is responsible as both the Water Resource Manager and System Operator for the GMID. Figure 2-1 shows the location of the GMID and the main irrigation districts.
Figure 2-1 Goulburn Murray Irrigation District
Source: http://www.g-mwater.com.au/about/regionalmap
2.2 IRRIGATION MODERNISATION
In 2004, the Victorian Government put in place a long-term plan for water resource management titled Our Water Our Future. A key initiative to deliver the sustainable outcomes targeted in this plan is modernisation of irrigation areas in northern and southern Victoria. Irrigation modernisation seeks to improve the efficiency of irrigation systems.

Audit of Water Savings Prepared for Department of Sustainability and Environment
November 2011 Version 1 Page 4 Commercial in Confidence \\Bnesan01p\mts$\3603-11 DSE Audit of Water Savings\Reports\Final Reports\Audit of Water Savings 2011 - G-MW - FINAL.docx
Irrigation modernisation typically involves the automation of channel infrastructure, construction of pipelines, upgrading the accuracy of metered outlets to farms, lining and remodelling of channels and rationalising the channel network. As many systems are currently manually controlled, automation of these systems allows water flows to be delivered more accurately and more quickly. These capital works, in unison with changed operational approaches will have the twin benefits of reducing the amount of water lost in irrigation systems and improving service levels to customers.
The Our Water Our Future website1 outlines the following main elements of irrigation modernisation:
Channel automation
Channel automation is a way of improving the efficiency of irrigation networks by using new technology to control the flow of water from the storage (usually a dam) through the distribution system to the irrigator. It involves replacing manual flow control structures in channels with updated gates that accurately measure flows, provide real time measurement data and, in most cases, are automated. The automation greatly reduces the water spilt from the end of channels (known as outfalls). Further the gate measurement allows more accurate location of the worst seepage and leakage losses and more effective targeting of channel remediation works.
Automation of the gates also provides the ability to interact with meters and on-farm automation equipment, so best practice irrigation methods can be employed on farms. Other benefits include constant flows and faster water delivery times.
Pipes and channels
Much of the irrigation system relies on open earthen channels to transport water. Inefficient operation and leaky sections result in up to 30 per cent of the total volume being lost. Water losses can be minimised by reducing outfall losses, lining, remodelling or pipelining parts of the channel system.
Improved meter accuracy
Dethridge wheels are inaccurate and on average under-measure water delivery by 8 per cent. They fail to meet the new metering standards introduced by the Australian Government that specify a maximum of plus or minus 5 per cent measurement inaccuracy. There are also occupational health and safety risks associated with using Dethridge wheels.
2.3 WATER SAVINGS PROTOCOL
The Victorian State Government has committed to clear and transparent processes for the calculation and verification of the water savings achieved through irrigation modernisation and accordingly requires the water savings estimates achieved to be independently audited.
A Water Savings Protocol has been released by the Government which sets out the processes for calculating, applying and allocating water savings generated from irrigation modernisation projects. Supporting the Protocol is the Water Savings Protocol Technical Manual (the Manual) which sets out the calculations to be used in determining water savings. The Protocol and Manual are available on the Our Water Our Website at this location: http://www.ourwater.vic.gov.au/programs/irrigation-renewal/water-savings-protocol/water-savings-protocol-technical-manual.
1 http://www.ourwater.vic.gov.au/programs/irrigation-renewal/about. Note - minor edits have been made to this text to clarify its meaning.

Audit of Water Savings Prepared for Department of Sustainability and Environment
November 2011 Version 1 Page 5 Commercial in Confidence \\Bnesan01p\mts$\3603-11 DSE Audit of Water Savings\Reports\Final Reports\Audit of Water Savings 2011 - G-MW - FINAL.docx
3 AUDIT METHODOLOGY
3.1 AUDIT PROCESS UNDER THE AUDIT PROTOCOL
The Water Savings Audit Process2 is a document under the Water Savings Protocol that sets out the approach to be taken to the independent audit of water savings. Under the Audit Process, the scope of independent audit work relating to irrigation modernisation is to include the elements detailed below. Under each element we set out how the requirement has been addressed in this report:
Verifying that the Phase 3 (and Phase 4) water savings calculations have been calculated in accordance with the Technical Manual for the Quantification of Water Savings.
We address this requirement in Section 6 of this report.
Checking that the data collection and inputs are as accurate as could reasonably be expected for the purpose of calculating water savings.
We address this requirement in Section 5 of this report.
Spot checks that the program of works has been implemented as documented in the water saving calculations.
We address this requirement in Section 3.3 of this report.
Checking that water savings have been calculated based on the nature and the extent of all modernisation works completed prior to 15th May in the year of the audit.
We address this requirement in Section 3.3, Section 5.1 and Section 6 of this report.
Providing a corrected estimate of the water savings for any component where the project proponent calculations are found to be non-compliant or deficient.
We address this requirement in Section 6 of this report.
Identifying potential improvements to the data collection, data analysis, assumptions and methods used to estimate the water savings. Recommend changes to the Technical Manual for the Quantification of Water Savings to the Director of Allocations and Licences within DSE that will improve useability and accuracy of water savings.
We address this requirement in Section 8 of this report.
Checking if suggestions from the previous year’s audit have been actioned upon and report upon the status of each of the suggested improvements.
2 Water Savings Audit Process (Water Savings Protocol), Department of Sustainability and Environment Victoria, Version 2.0 June 2009.

Audit of Water Savings Prepared for Department of Sustainability and Environment
November 2011 Version 1 Page 6 Commercial in Confidence \\Bnesan01p\mts$\3603-11 DSE Audit of Water Savings\Reports\Final Reports\Audit of Water Savings 2011 - G-MW - FINAL.docx
We address this requirement in Section 7 of this report.
The Audit Process also defines the expected content of the water savings audit report. The minimum requirements of the report and where they are fulfilled in this report is summarised following:
Requirement Relevant Section
A summary of findings. Summary of Findings
An audited supporting data set and reports. Section 6
Full evaluation of water savings estimation against protocol. Section 6
Documentation of any instances of non-compliance and the required changes to the proponent’s estimates. Section 6
Full tabulation of water savings estimation against Project Proponent’s Business Case targets. Section 6
Description of the audit process undertaken, including a description of how the information was audited and/or verified (e.g. sighted documentation, persons spoken to etc).
Section 3
In addition to the audit report, the auditor can recommend, to DSE, improvements to the method for estimation, calculation and reporting water savings for future years. This may include recommendations of revisions to the Technical Manual for the Quantification of Water Savings, or to the Project Proponent’s processes for estimating and reporting water savings.
Section 8
The following subsections of this report details the audit process undertaken.
3.2 OVERVIEW OF AUDIT METHODOLOGY
The Cardno approach to auditing water savings is based around structured interviews with key authority staff. These structured interviews allow us to scrutinise the water savings calculations and assess the veracity of the supporting information. Our audits focused on three areas:
Checking that the audit calculations had been performed correctly;
Reviewing the systems and procedures in place to manage the data used in the calculations, including trailing the data used in the calculations back to source records; and
Verifying that the works claimed are complete and commissioned through review of works handover and commissioning documents, as well as site visits.
Figure 3-1 provides an overview of our audit methodology. We completed the audits of the savings from the areas Goulburn Murray Water is responsible for and the areas that NVIRP is responsible for in parallel given that many of the systems, processes and key staff are common to both.

Audit of Water Savings Prepared for Department of Sustainability and Environment
November 2011 Version 1 Page 7 Commercial in Confidence \\Bnesan01p\mts$\3603-11 DSE Audit of Water Savings\Reports\Final Reports\Audit of Water Savings 2011 - G-MW - FINAL.docx
Figure 3-1 Overview of Audit Methodology
3.3 SITE VISITS
The Audit Protocol states that spot checks of the program of works be undertaken to verify that the works have been implemented. A sample of sites where irrigation modernisation works have been completed was visited on Wednesday 7 September 2011. For this year, the sites visited were located in the Murray Valley Irrigation Area. In 2010 sites in the Shepparton and Central Goulburn Irrigation Areas were visited. Sites had to be selected based on accessibility. The sites visited are listed in
Our site visits confirmed that the works sites included in our sample had been implemented. Our sample included outfalls and channel remediation and channel rationalisation works. However, we found two instances of discrepancies in the recording of outfalls between GIS and the water savings calculations. This does not suggest that the asset were not implemented but rather recorded incorrectly. We recommend that G-MW undertakes reconciliation of its outfall information. The exercise should compare the outfall IPM number, structure number, SCADA reference, location in GIS and actual location recorded on site. The works should be prioritised so that those outfalls most critical to the water savings calculations be investigated first. This recommendation follows on from our 2009/10 recommendation that outfalls names used by G-MW should be reconciled with the outfall names used in SCADA.
Appointed as independent auditor, scope of audit set
Issue Notification of Audit Form
Site Based Audit Work
Further information requests, response to queries
Draft report
Final report
Site Visits Data Trailing – flow data, asset records etc.
Structured Interviews

Audit of Water Savings Prepared for Department of Sustainability and Environment
November 2011 Version 1 Page 8 Commercial in Confidence \\Bnesan01p\mts$\3603-11 DSE Audit of Water Savings\Reports\Final Reports\Audit of Water Savings 2011 - G-MW - FINAL.docx
3.4 SCHEDULE OF AUDIT MEETINGS
Table 3-1 lists the meetings held to complete the audit work.
Table 3-1 Schedule of Audit Meetings
Date Audit Work Auditee Organisation
Monday
5 September 2011
Start-up Meeting
Murray Smith NVIRP
Peter Roberts NVIRP
Jeremy Nolan G-MW
Mike Schulz G-MW
Ross Plunkett NVIRP
Rob Fittock NVIRP
Paul Ritchie Transfield
Audit of NVIRP calculations Peter Roberts NVIRP
Tuesday
6 September 2011 Audit of G-MW calculations Mike Schulz G-MW
Wednesday
7 September 2011 Site Visits Mike Schulz G-MW
Thursday
8 September 2011
Review of NVIRP and Transfield construction records
Rob Fittock NVIRP
Felipe Villafrade Transfield
Paul Ritchie Transfield
Peter Roberts NVIRP
Preliminary data trailing of G-MW records Mike Schulz G-MW
Review of progress achieving past recommendations Peter Roberts NVIRP
Close-out meeting
Murray Smith NVIRP
Ross Plunkett NVIRP
Peter Roberts NVIRP
Jeremy Nolan G-MW
Mike Schulz G-MW
3.5 DOCUMENT REGISTER
A list of the documents received before, during and after the audit from both G-MW and NVIRP is included in Appendix 2.
Audit of Water Savings Prepared for Department of Sustainability and Environment
November 2011 Version 1 Page 9 Commercial in Confidence \\Bnesan01p\mts$\3603-11 DSE Audit of Water Savings\Reports\Final Reports\Audit of Water Savings 2011 - G-MW - FINAL.docx
4 IRRIGATION RENEWAL IN SHEPPARTON AND CENTRAL GOULBURN 1-4
4.1 INTRODUCTION
The Goulburn Murray Irrigation District (GMID) covers an area in northern Victoria bordered by the Murray River in the north and the Great Dividing Range in the south. The GMID is Australia’s largest irrigation district. Irrigation assets were first provided in this area in the early 20th century by the State Rivers and Water Supply Commission.
Due to the age and condition of irrigation assets, NVIRP estimates that up to 900GL (Long Term Cap Equivalent) of water in the Goulburn Murray Irrigation District is lost through leaks, evaporation and other inefficiencies. Irrigation renewal in the GMID seeks to improve the efficiency of irrigation water use from its current level at around 70% to 85%.
A program of research and pilot studies commenced in 2002 to examine the cost effectiveness of irrigation modernisation works. The following sections detail these early projects that led to the Shepparton and Central Goulburn 1-4 project and the NVIRP project.
4.2 PRIOR WORKS PROGRAMS
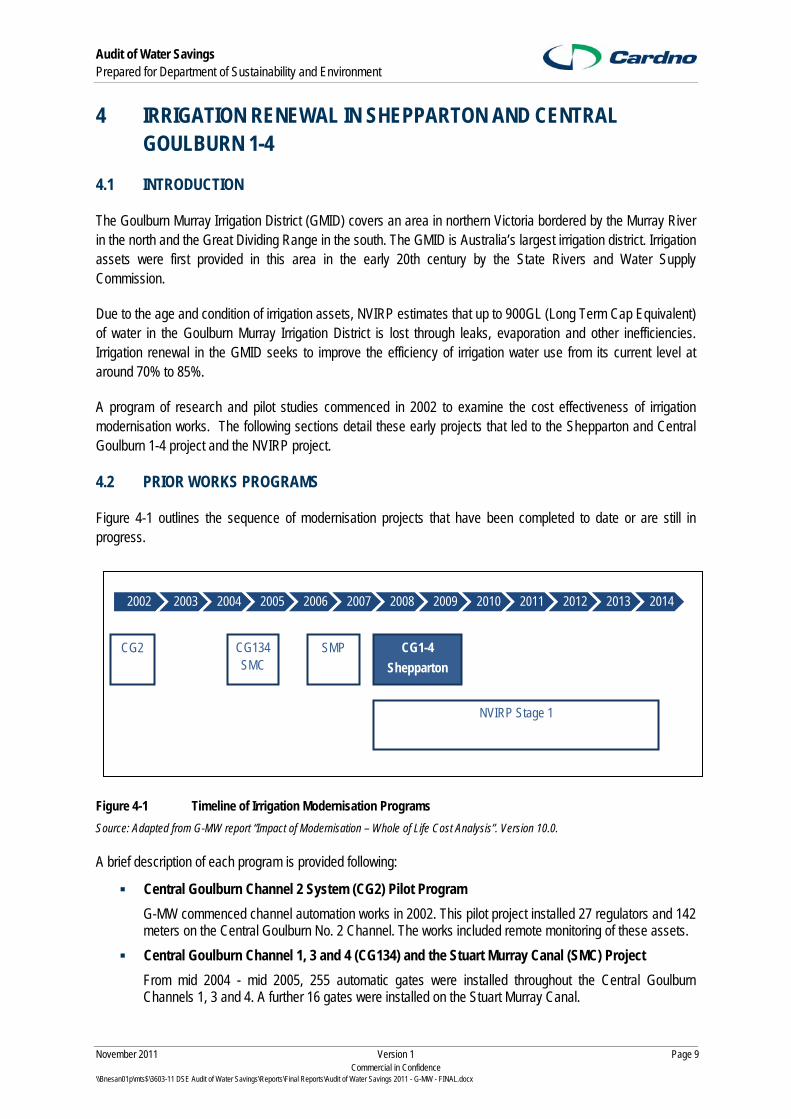
Figure 4-1 outlines the sequence of modernisation projects that have been completed to date or are still in progress.
Figure 4-1 Timeline of Irrigation Modernisation Programs
Source: Adapted from G-MW report “Impact of Modernisation – Whole of Life Cost Analysis”. Version 10.0.
A brief description of each program is provided following:
Central Goulburn Channel 2 System (CG2) Pilot Program
G-MW commenced channel automation works in 2002. This pilot project installed 27 regulators and 142 meters on the Central Goulburn No. 2 Channel. The works included remote monitoring of these assets.
Central Goulburn Channel 1, 3 and 4 (CG134) and the Stuart Murray Canal (SMC) Project
From mid 2004 - mid 2005, 255 automatic gates were installed throughout the Central Goulburn Channels 1, 3 and 4. A further 16 gates were installed on the Stuart Murray Canal.
2002 2003 2004 2005 2006 2007 2008 2009 2010 2011 2012 2013 2014
CG2 CG134SMC
SMP CG1-4
Shepparton
NVIRP Stage 1

Audit of Water Savings Prepared for Department of Sustainability and Environment
November 2011 Version 1 Page 10 Commercial in Confidence \\Bnesan01p\mts$\3603-11 DSE Audit of Water Savings\Reports\Final Reports\Audit of Water Savings 2011 - G-MW - FINAL.docx
Strategic Measurement Project (SMP)
The Strategic Measurement Project targeted the automation of important offtakes, inline regulators and outfalls. 374 gates were installed at 305 sites during the 2006/07 financial year.
4.3 SHEPPARTON AND CENTRAL GOULBURN 1-4 PROJECT
The Central Goulburn 1-4 and Shepparton project commenced in early 2008. The works were outlined in two separate business cases developed by G-MW and involved a more extensive implementation of modernisation works based on the earlier programs completed. The works were undertaken by the Futureflow alliance and were largely completed by late 2009.
The Central Goulburn project had three stages:
Channel automation on the 1, 2, 3 and 4 channels;
Leakage and seepage remediation of identified areas; and
Meter replacement or rationalisation of all farm outlets.
The works included replacement of approximately 900 meters and rationalisation of some 20% more, as well as channel remediation works.
The Shepparton modernisation project includes the following upgrade works:
Automation of around 960 channel regulators;
Replacement or rationalisation of approximately 1800 service points;
39km of channel rationalisation; and
Replacement of two channels with 27km of gravity pipeline.
4.4 NORTHERN VICTORIA IRRIGATION RENEWAL PROJECT
The Northern Victoria Irrigation Renewal Project (NVIRP) was established following completion of the initial projects described above and acceptance by the State Government of a business case for Stage 1 of modernisation works across the wider Goulburn Murray Irrigation District. The NVIRP Stage 1 works expand on the initial modernisation works and occur in five of the six irrigation areas.
The Stage 1 works area covers approximately 85% percent of the GMID and a total of around 6,000 km of channels. Stage 2 works are planned to occur following completion of the Stage 1 works pending acceptance of the related business case.
We discuss NVIRP and the water savings achieved by this project for the 2009/10 irrigation season in a separate report released concurrently with this report.

Audit of Water Savings Prepared for Department of Sustainability and Environment
November 2011 Version 1 Page 11 Commercial in Confidence \\Bnesan01p\mts$\3603-11 DSE Audit of Water Savings\Reports\Final Reports\Audit of Water Savings 2011 - G-MW - FINAL.docx
5 AUDIT FINDINGS – SYSTEMS AND PROCESSES
This section of the audit report is largely similar to that in the 2010/11 NVIRP water savings audit report due to the common systems and processes used by both for data management.
5.1 INTRODUCTION
Our audit considers the systems and processes in use by NVIRP and G-MW that support the calculation of water savings to determine whether they are sufficiently reliable to produce accurate, repeatable and transparent data. Our review of systems and processes focuses on those business areas central to the water savings estimates – asset commissioning and handover, flow measurement and recording, the Irrigation Planning Module (IPM) system for managing customer deliveries, and pondage testing investigations.
Because of the importance of demonstrating that the water savings have been calculated based on accurate information, we have complemented this review of systems and processes with trailing of selected data used in the calculations to their source. The data trailing undertaken is a combination of random and targeted sampling. The targeted sampling has been applied in particular to the outfall flow volumes where we have focused on the outfalls that contribute the most to the irrigation savings claimed. We discuss the data trailing undertaken in the following sections.
5.2 ASSET PLANNING, DESIGN, CONSTRUCTION AND HANDOVER
The Shepparton and Central Goulburn 1-4 early works were installed by G-MW with the Futureflow alliance completing the balance of the works. The alliance ceased construction works in late 2009. G-MW was a member of this alliance along with construction contractors and designers. The alliance undertook planning, design, construction and commissioning functions.
When regulator gates and service points are commissioned, an Inspection Test Procedure (ITP) certificate is produced which records relevant commissioning details. These ITP certificates were stored by Futureflow in hardcopy files along with other relevant construction documents. Because these irrigation works have largely been complete for at least one irrigation season, the commissioning date becomes less critical to the water savings calculations. However, it is still important to ensure that the assets claimed are actually installed.
While handover of assets to G-MW following a defects liability period is important for the successful ongoing operation of the modernisation works, we have focused on asset commissioning rather than handover as water savings are typically achieved from the time that an asset is commissioned.
We also note that when regulator gates and online service points are wet commissioned, the assets appear in G-MW’s SCADA and field data begins being received from this site. Therefore, when data begins being captured from the new site it can reasonably be assumed that the gate has been successfully commissioned. This provides an additional level of assurance in addition to the presence of ITP certificates that works have been installed and commissioned.
To complement our review of the systems used to manage asset delivery and commissioning, we have in previous years selected a sample of assets that have been delivered and requested that evidence of commissioning be provided to us. However, given that the works in the Shepparton and Central Goulburn areas are very near complete with very few assets commissioned in 2010/11, we did not select assets from these areas this year and instead focused on the NVIRP works area. The findings of these reviews are included in the NVIRP audit report.

Audit of Water Savings Prepared for Department of Sustainability and Environment
November 2011 Version 1 Page 12 Commercial in Confidence \\Bnesan01p\mts$\3603-11 DSE Audit of Water Savings\Reports\Final Reports\Audit of Water Savings 2011 - G-MW - FINAL.docx
5.3 INFORMATION SYSTEMS OVERVIEW
To manage its irrigation network, Goulburn Murray Water employs a number of information systems. The key systems are:
SCADA – provides real time monitoring of gate operation, including trending. Field readings are stored and can be accessed through a data warehouse;
GIS – records location of channels and control gates. Channel length and width is measured from here; and
IPM – takes customer orders, checks system capacity to deliver orders.
When an order is placed by a customer who is located on an automated channel, IPM directs the order to the customer’s outlet. The IPM specifies the times to open and close the customer outlet and the ordered flow rate. The automation system uses a combination of feedback control on water level with feed-forward on flow to control to the channel.
The SCADA system monitors the status of control gates along automated channels in the field. Data from the control gates (channel water levels, flow rates, accumulated flows, gate open position etc.) can be monitored in SCADA. It is also stored in the data warehouse and can be retrieved from here.

Audit of Water Savings Prepared for Department of Sustainability and Environment
November 2011 Version 1 Page 13 Commercial in Confidence \\Bnesan01p\mts$\3603-11 DSE Audit of Water Savings\Reports\Final Reports\Audit of Water Savings 2011 - G-MW - FINAL.docx
5.4 OUTFALL FLOW DATA
The volumes of flows through outfalls are an important data input into the water savings calculations as savings from outfalls currently comprise the largest component of all water savings achieved. G-MW as the system operator is responsible for recording all outfall flow volumes. These volumes are provided to NVIRP for input into the water savings calculations.
Most major outfalls in the GMID have online flow measurement which is recorded in the G-MW SCADA. A number of unmetered outfalls where flows are estimated by operators remain in operation. However, these account for only a small proportion of the water savings achieved.
Where an outfall has online measurement, field staff record the outfall volume each day in a logsheet. There is a separate logsheet for each irrigation area. The field staff review the SCADA data and if necessary make adjustments for any erroneous readings, e.g. if the water level in the channel is particularly low, the flow reading may be a false high reading when in fact no water is leaving the outfall.
5.4.1 Trailing of Outfall Volumes Data
We requested G-MW as the system operator demonstrate to us the outfall volumes recorded in the current year for a targeted sample of sites across the NVIRP works areas as well as Shepparton and Central Goulburn 1-4. Our sample focused on the outfalls with the largest savings to provide an appropriate level of assurance, as well as a selection of smaller sites to ensure that there were no systemic errors in the reported data.
To trail the outfall volumes, we reconciled the volumes used in the calculations for each outfall site with those recorded on the G-MW IPM system. Our review of outfall volumes found that for most sites, the outfall volumes used in the calculations did not agree with those recorded in IPM. This is because the calculation source flow data is taken from operator logsheets, while IPM includes raw data from SCADA. The operator logsheets take raw data from SCADA but adjustments are made for operational events and conveyance of flood waters in particular. For this year where there were significant flooding events across the irrigation areas, the differences between the volumes were significant due these conveyed volumes.
While we appreciate that the difference between the two data sets are explainable, we believe that G-MW can improve how outfall data is recorded and used for water savings calculations. This aligns with recommendations 2008/09 Item 9, 2008/09 Item 10, 2009/10 Item 4 and 2009/10 Item 5 made at previous audits and against which only moderate progress has been made. Our recommendation for this area is summarised included in our response to Item 4 from 2009/10 in Appendix A of the NVIRP Water Savings Audit Report for 2011. This recommendation is that G-MW prepares a procedure that clearly sets out how operators should:
Treat minor outfall volumes
Record volumes based on the level of accuracy of flowmeters
Record non-routine flows including volumes associated with discharging flood waters with reference to observed start and stop time of rainfall events
Record anomalous volumes and the reason for them
Any other item that G-MW considers important for the accurate and reliable recording of outfall volumes.
Prepare a template for recording of outfall volumes that is structured the same for all areas
Inform and train staff across all areas in the use of the procedure
Monitor through internal review and audits that operators are applying the procedure.

Audit of Water Savings Prepared for Department of Sustainability and Environment
November 2011 Version 1 Page 14 Commercial in Confidence \\Bnesan01p\mts$\3603-11 DSE Audit of Water Savings\Reports\Final Reports\Audit of Water Savings 2011 - G-MW - FINAL.docx
We believe that G-MW Operations must take the lead in these initiatives and that these should be largely implemented before the commencement of the 2012/13 irrigation season given that two years have passed since the first recommendations were made in this area.
5.5 IRRIGATION PLANNING MODULE
Irrigation Planning Module (IPM) is the business system used by G-MW to manage irrigation supply orders and plan the delivery of these orders. When an order is placed by a customer online or by telephone, it is sent to IPM. For customers on fully automated channels, IPM essentially sends the order to the customer’s outlet. The orders specify the times to open and close the customer outlet and the ordered flow rate.
IPM also provides management reporting facilities on a range of operational aspects and records delivery volumes for billing purposes. It also records delivery volumes against entitlements and rejects orders where supply is in excess of entitlement.
For the purposes of the water savings calculations, IPM is used to determine customer deliveries through service points, as well as season length. We reviewed the procedures for extracting this data from IPM and found them to adequately describe the process.
The following describes the results of our trailing of a selected sample of data sourced from IPM.
5.5.1 Trailing of customer deliveries volumes
We reviewed the 2010/11 usage through 43 customer service points (from both Futureflow and TSA works) that have been replaced by modernisation works. We compared the usage recorded for each service point in IPM with that used in the calculations. The review did not identify any sites where the volume sourced from IPM disagreed with that used in the calculations. This was true for service points with zero volumes also.
5.5.2 Trailing of total deliveries to irrigation areas
We trailed the volume of total customer deliveries in each irrigation area to corroborating documents, initially the G-MW Annual report. However, the volumes recorded here showed small divergences (1-4%) from those used in the calculations. G-MW explained that the differences were due to the two reports (one for the annual report, one for water savings calculations) being generated for different purposes with minor differences in selection criteria. G-MW provided an itemised breakdown of the inclusions and exclusions for each report. We accept that the correct total customer delivery volumes for the purpose of water savings have been used. We recommend that G-MW formalise the items to be included and excluded from the total customer delivery volumes report for water savings in a procedure or similar
5.6 PONDAGE TESTING
Pondage testing determines the rate of seepage in unlined channels. Goulburn Murray Water is responsible for undertaking pondage testing for both the NVIRP and its own areas. The results of pondage tests are used to determine the most cost effective channels to remediate and in water savings estimates. Goulburn Murray Water has prepared a procedure (#2708378) that sets out how pondage field tests are undertaken. The tests undertaken are static tests. A second procedure (#2708405) outlines how the results of field tests should be evaluated and leakage and seepage rates determined. We reviewed these procedures in 2009/10 and had their use demonstrated to us by Goulburn Murray Water. We concluded at this time that these procedures are sufficiently complete and reflect the analysis we saw undertaken by G-MW.

Audit of Water Savings Prepared for Department of Sustainability and Environment
November 2011 Version 1 Page 15 Commercial in Confidence \\Bnesan01p\mts$\3603-11 DSE Audit of Water Savings\Reports\Final Reports\Audit of Water Savings 2011 - G-MW - FINAL.docx
During field tests, logsheets are kept that detail the site conditions, any rainfall etc. If rainfall occurs, the measurements taken during and after that period are excluded. A test takes a minimum of four days to complete so that sufficient data is collected. The data used in the analysis is the change in water level in the channel over time and the volume of any flows into the channel. Both of these variables are measured on-line and recorded in SCADA.
We did not trail any pondage testing results for the Shepparton or Central Goulburn 1-4 areas for this audit because no new works were completed in 2010/11.
5.7 CONCLUSIONS
Our review of the systems and processes used by G-MW has found that they are generally sufficiently robust to generate data and inputs that are as accurate as could reasonably be expected for the purpose of calculating water savings.
We believe that G-MW must improve how it records and uses outfall data for the purpose of water savings calculations. Our recommendations for this area are summarised in our response to Item 4 from 2009/10 in Appendix A of the NVIRP audit report for this year. We are of the opinion that G-MW Operations must take the lead in these initiatives and that these should be largely implemented before the commencement of the 2012/13 irrigation season given that two years have passed since the first recommendations were made in this area.
We found no discrepancies in the meter delivery volumes used in calculations and sourced from IPM for individual service points. We found when trailing total customer delivery volumes that G-MW includes and excludes some different volumes for different reporting purposes. We are satisfied that the correct inclusions and exclusions have been made for the purposes of calculating water savings.
5.8 RECOMMENDATIONS
As noted last year, we recommend that SCADA be used as the primary point of reference for recording, storing and reporting outfall measurement data given that most major outfalls now have online measurement. Operators should continue to record where adjustments to flows need to be made, e.g. if a sensor is out of the flow. SCADA may be programmed to identify (automatically or prompted) flood water discharge events and thereby report an outfall figure that is net of flood volumes;
We recommend that G-MW undertakes reconciliation of its outfall information. The exercise should compare the outfall IPM number, structure number, SCADA reference, location in GIS and actual location recorded on site. The works should be prioritised so that those outfalls most critical to the water savings calculations be investigated first. This recommendation follows on from our 2009/10 recommendation that outfalls names used by G-MW should be reconciled with the outfall names used in SCADA; and
We recommend that G-MW formalise the items to be included and excluded from the total customer delivery volumes report for water savings in a procedure or similar.
We recommend that G-MW prepares a procedure that clearly sets out how operators should:
Treat minor outfall volumes
Record volumes based on the level of accuracy of flowmeters
Record non-routine flows including volumes associated with discharging flood waters with reference to observed start and stop time of rainfall events
Record anomalous volumes and the reason for them

Audit of Water Savings Prepared for Department of Sustainability and Environment
November 2011 Version 1 Page 16 Commercial in Confidence \\Bnesan01p\mts$\3603-11 DSE Audit of Water Savings\Reports\Final Reports\Audit of Water Savings 2011 - G-MW - FINAL.docx
Any other item that G-MW considers important for the accurate and reliable recording of outfall volumes.
Additionally, G-MW should:
Prepare a template for recording of outfall volumes that is structured the same for all areas;
Inform and train staff across all areas in the use of the procedure; and
Monitor through internal review and audits that operators are applying the procedure.
We believe that G-MW Operations must take the lead in these initiatives and that these should be largely implemented before the commencement of the 2012/13 irrigation season given that two years have passed since the first recommendations were made in this area.

Audit of Water Savings Prepared for Department of Sustainability and Environment
November 2011 Version 1 Page 17 Commercial in Confidence \\Bnesan01p\mts$\3603-11 DSE Audit of Water Savings\Reports\Final Reports\Audit of Water Savings 2011 - G-MW - FINAL.docx
6 AUDIT FINDINGS – WATER SAVINGS CALCULATIONS
6.1 APPLICATION OF THE TECHNICAL MANUAL FORMULAE AND DETERMINATION OF LONG-TERM SAVINGS
The purpose of the Technical Manual for the Quantification of Water Savings is to apply a transparent and consistent approach to determining the water savings achieved through irrigation modernisation projects at all project phases, but most importantly, the long term savings in the system following project completion. The Technical Manual defines four separate phases at which water savings calculations are applied to projects:
Phase 1: The initial ‘Business Case’ long term estimates of water savings for the planned program of works;
Phase 2: The annual pre-works estimates of interim water savings to be set aside within the water savings account;
Phase 3: The annual post-works measurement or verification of interim water savings able to be allocated from the water savings account; and
Phase 4: The assessment of the overall long term water savings achieved through the modernisation program.
The purpose of this audit report is to review the Phase 3 water savings achieved in the Shepparton Irrigation Area and Central Goulburn Channels 1-4 for the 2010/11 season and the Phase 4 savings based on the 2009/10 season. The Phase 3 savings are the actual water savings realised in the 2010/11 irrigation season while the Phase 4 savings represent the savings that would have been achieved over a comparable long term average year.
The following sections detail the application of the water savings calculations by intervention type – channel rationalisation, channel automation, service point replacement and rationalisation and channel remediation.
6.2 PHASE 4 WATER SAVINGS CALCULATIONS
The audit scope requires that Phase 4 water savings in the Shepparton and Central Goulburn 1-4 area be audited for the first time. The Phase 4 savings are based on .the 2009/10 irrigation season and not the 2010/11 season. The Phase 4 water savings estimates have previously been submitted to the Department of Sustainability and Environment and are presented as two separate components:
Central Goulburn 1-4 Stage 1 (Reference: #2979558v3); and
Shepparton and Central Goulburn 1-4 Stage 2 (Reference: #2979554v2).
The Central Goulburn Stage 1 works involved primarily channel automation with some replacement of service points. The Central Goulburn Stage 2 works involved service point replacement, channel rationalisation and channel remediation. We do not distinguish between the two stages of the Central Goulburn works in this report. As the Phase 4 estimates are based on the 2009/10 season, the input data will generally have been reviewed as part of our audit of the 2009/10 Phase 3 water savings estimates from Shepparton and Central Goulburn 1-4.
6.3 SAVINGS FROM CHANNEL RATIONALISATION
6.3.1 Scope of Irrigation Channel Rationalisation Works
Channel rationalisation involves redesigning the channel network so that channel length can be minimised while still providing service to customers. Channels that are determined to be redundant are abandoned and isolated from the distribution network and no flows enter them. This means that there is water savings due to reduced

Audit of Water Savings Prepared for Department of Sustainability and Environment
November 2011 Version 1 Page 18 Commercial in Confidence \\Bnesan01p\mts$\3603-11 DSE Audit of Water Savings\Reports\Final Reports\Audit of Water Savings 2011 - G-MW - FINAL.docx
evaporation, bank seepage and bank leakage. Channel rationalisation accounts for approximately 3% of the Phase 4 savings claimed by G-MW.
Both the Phase 3 and Phase 4 calculations are based on the same length of channels having been rationalised: 38.7km in the Shepparton irrigation area and 0.8km in the Central Goulburn 1-4 channels.
6.3.2 Overview
Water savings due to channel rationalisation are the sum of the savings due to water no longer being lost in the channel to seepage, bank leakage and evaporation:
Phase 3: WSYear X = WSSeepage + WSbank leakage + WSevaporation
Phase 4: WSYear X(LTCE) = WSSeepage(LTCE) + WSbank leakage(LTCE) + WSevaporation (LTCE)
6.3.3 Water Savings Calculations
Phase 3 Calculations
Phase 3 water savings have been calculated by G-MW using the Phase 3 channel rationalisation formulae from the Technical Manual:
WSSeepage = SBase x CL x tr x EF WSbank leakage = [(LBase x FL) + (LBase x VL x (DYear x / DBase)] x CL x t x EF WSevaporation = EBase x CL x tr x EF
Phase 4 Calculations
Phase 4 water savings due to channel rationalisation are estimated by the following equations from the Technical Manual:
WSSeepage (LTCE) = SBase x CL x tr x EFx DF WSbank leakage (LTCE) = [(LBase x FL) + (LBase x VL x F(LTCEYear x))] x CL x t x EF x DF WSevaporation (LTCE) = EBase x CL x tr x EF x DF
The only difference in the Phase 4 calculations compared with the Phase 3 is the addition of the durability factor DF and the replacement of the deliveries ratio with F(LTCE).
6.3.4 Input Data
The inputs required to calculate Phase 3 water savings due to channel rationalisation are summarised in Table 6-1 and Table 6-2. The first table details the parameters that are fixed or have been previously audited. The second table details the input data from the current year.

Audit of Water Savings Prepared for Department of Sustainability and Environment
November 2011 Version 1 Page 19 Commercial in Confidence \\Bnesan01p\mts$\3603-11 DSE Audit of Water Savings\Reports\Final Reports\Audit of Water Savings 2011 - G-MW - FINAL.docx
Table 6-1 Fixed Parameters and Baseline Year Parameters for Channel Rationalisation Water Savings Calculation
Parameter Description Source
SBase Seepage in Baseline Year Baseline Year water balance
LBase Leakage in Baseline Year Baseline Year water balance
EBase Evaporation in Baseline Year Baseline Year water balance
DBase Deliveries in Baseline Year Baseline Year water balance
FL Proportion of bank leakage recognised as variable Technical Manual
VL Proportion of bank leakage recognised as fixed Technical Manual
EF Effectiveness Factor for channel rationalisation Technical Manual
DF Durability factor to account for the durability of water savings Technical Manual
Table 6-2 Current Year Parameters for Channel Rationalisation Water Savings Calculation
Parameter Description Source
CL Ratio of length of spur channel length rationalised to total spur channel length in system
GIS and direct measurement
tr Ratio of the length of time a channel has been rationalised in the year in question relative to the irrigation season length in the Baseline Year Construction records
DYear x Customer deliveries in the year in question to the irrigation system IPM reports
F(LTCE) Long Term Cap Equivalent Factor to convert Current Year volumes to Long Term Cap Equivalent volume
Calculated from deliveries and base figure advised by Department of Sustainability and Environment
We have reviewed the input data and confirm that the fixed parameters sourced from the Technical Manual are correct. We trailed the inputs from the Baseline year water balance and found that G-MW had updated unmetered outfall volumes by applying an adjustment factor of 1.6 to the volumes recorded at unmetered outfalls in the baseline year to arrive at an adjusted baseline outfall volume. The factor previously used was 1.3, in line with Section 5.1 of the Technical Manual. G-MW has used the revised adjustment factor based on the Hydroenvironmental report Quantification of outfall losses (December 2010). We have reviewed this report and are satisfied that use of this revised figure is in accordance with the requirements of the Technical Manual for technical substantiation.
We also found that in the Phase 3 calculations there was some inconsistency in the length of season applied. Correcting for this error led to a small increase in the estimate of overall savings.
Our review of the current year parameters used in the calculations found the following:
Customer Deliveries in the Current Year (DYear X)
Customer deliveries through the meters replaced in each irrigation district are determined through IPM. These delivery volumes are used for customer billing and as noted previously, we therefore believe they will be reliable due to the scrutiny they are subject to by G-MW and customers. We outline the results of our data trailing of customer delivery volumes in Section 5.5.1. We did not identify any errors or have need to make adjustments to the customer delivery volumes used by G-MW.

Audit of Water Savings Prepared for Department of Sustainability and Environment
November 2011 Version 1 Page 20 Commercial in Confidence \\Bnesan01p\mts$\3603-11 DSE Audit of Water Savings\Reports\Final Reports\Audit of Water Savings 2011 - G-MW - FINAL.docx
Ratio of Channel Length Rationalised to Total Channel Length (CL)
This ratio is intended to be calculated with the total length of spur channels only (i.e. the backbone omitted). However, as G-MW does not have the Baseline Year seepage, leakage and evaporation loss components separated into spur and backbone volumes, it has determined this ratio using the entire length of channels as the denominator. This situation has arisen because all of the channels in these systems have been nominated as backbone channels. For Shepparton irrigation area, this factor is 6% and for Central Goulburn 1-4 it is 0.3%.
Ratio of Length of Time Channels Rationalised to Baseline Year (t)
Almost all channel rationalisation works were completed before the 2010/11 season. Therefore this factor is expected to be close to 1. However, due to cell reference error, initially G-MW used a figure of 0.01 for Phase 3 savings. We corrected this error at audit which led to a significant increase in savings from channel rationalisation.
6.3.5 Results
Correcting for the discrepancies noted, the audited water savings due to channel rationalisation are summarised in Table 6-3 and Table 6-4.
Table 6-3 Phase 3 Water Savings due to Chanel Rationalisation
Shepparton Central Goulburn 1-4
Seepage (ML) 964 21
Bank leakage (ML) 40 18
Evaporation (ML) 426 6
Total (ML) 1,430 45
Table 6-4 Phase 4 Water Savings due to Chanel Rationalisation
Shepparton Central Goulburn 1-4
Seepage (ML) 754 22
Bank leakage (ML) 420 33
Evaporation (ML) 493 8
Total (ML) 1,667 64

Audit of Water Savings Prepared for Department of Sustainability and Environment
November 2011 Version 1 Page 21 Commercial in Confidence \\Bnesan01p\mts$\3603-11 DSE Audit of Water Savings\Reports\Final Reports\Audit of Water Savings 2011 - G-MW - FINAL.docx
6.4 SAVINGS FROM CHANNEL AUTOMATION
6.4.1 Scope of Automation Works
Automation involves the replacement of manual flow control structures with modern automated gates that accurately measure flows, provide real time operational data and can be controlled to meet the flow demands of customers. Automation greatly reduces the water spillage from the end of channels (outfalls), and reduces bank leakage by maintaining the level of water within a pool in a relatively restricted band.
Both the Shepparton and Central Goulburn 1-4 districts have largely automated backbone channel networks. Spur channels will not be automated as these will most likely be rationalised in future years. Table 6-5 details the extent of automation in each irrigation area. The extent of automation is unchanged since 2008/09.
Table 6-5 Extent of Automation by Irrigation Area
System Length of Backbone (km)
Length Automated (km) % Automated
Shepparton 625 569 91%
Central Goulburn 1-4 264 258 98%
While the confirmation that automation works have been complete is ultimately evidenced by the reduction in outfall volumes from automated systems, we have undertaken the following additional checking to confirm that the regulator sites listed have been constructed and commissioned as indicated:
Site visit to a selection of sites that have been automated. We discussed this in Section 3.3 ; and
Witnessing of commissioning certificates for a sample of randomly selected automated regulator sites. We completed this for Shepparton and Central Goulburn 1-4 in 2010. For 2011 we focused on the more recent works in the NVIRP areas.
6.4.2 Overview
Water savings due to automation are the sum of the savings realised through reduced outfall volumes and through reduced bank leakage:
Phase 3: WSYear X = WSoutfalls + WSbank leakage
Phase 4: WSYear X(LTCE) = WSoutfalls(LTCE) + WSbank leakage(LTCE)
Water savings from outfalls account for the majority of water savings due to automation, and the majority of water savings overall, being around half of the Phase 4 savings for the Shepparton and Central Goulburn 1-4 areas. Therefore, we have subjected this element of the water savings calculations to particular scrutiny.
We note that while NVIRP has not included water savings due to the upper bank leakage component in its estimates this year, G-MW has. We recommend in the NVIRP audit report that more work should be completed to quantify savings due to reduced upper bank leakage following automation to confirm whether the savings outlined in the Technical Manual are begin realised. Following completion of this work, NVRIP and G-MW should consistently apply the findings to calculating savings due to reduced upper bank leakage following automation.

Audit of Water Savings Prepared for Department of Sustainability and Environment
November 2011 Version 1 Page 22 Commercial in Confidence \\Bnesan01p\mts$\3603-11 DSE Audit of Water Savings\Reports\Final Reports\Audit of Water Savings 2011 - G-MW - FINAL.docx
6.4.3 Water Savings Calculations
Phase3 Calculations
Phase 3 water savings have been calculated by G-MW using the Phase 3 outfalls formula and the Phase 2 bank leakage formula:
WSoutfalls = [(Obase x OPx x (DYear X / DBase)) – (OYearX)] WSBank Leakage = LBase x EF x A x t x (DYear X / DBase)
Phase 4 Calculations
Phase 4 water savings due to reduction in outfalls and bank lekage are estimated by the following equations from the Technical Manual:
WSoutfalls = [(Obase x F(LTCE base)) – (OYearX x F(LTCEYearX) x (1/OPx))] x DF
WSBank Leakage = [(VL x LBase x F(LTCEbase)) – VL x Lyear x x F(LTCEYear x))] x A x DF
6.4.4 Input Data
The inputs required to calculate Phase 3 water savings due to outfall automation are summarised in Table 6-6 and Table 6-7. The first table details the parameters that are fixed or have been previously audited, i.e. the baseline year parameters. The second table details the input data from the current year.
Table 6-6 Fixed Parameters and Baseline Year Parameters for Automation Water Savings Calculation
Parameter Description Source
OBase Outfalls in Baseline Year Baseline Year water balance
Dbase Customer Deliveries in the Baseline Year in the irrigation system Baseline Year water balance
LBase Leakage in Baseline Year Baseline Year water balance
EF Effectiveness Factor Channel automation (bank leakage) Technical Manual
DF Durability factor to account for the durability of water savings interventions
Technical Manual
F(LTCEBase) Long Term Cap Equivalent Factor to convert Baseline Year volumes to Long Term Cap Equivalent volume
Department of Sustainability and Environment
Table 6-7 Current Year Parameters for Automation Water Savings Calculation
Parameter Description Source
Oyearx Outfalls in Current Year SCADA and operator logsheets
OPyearx Ratio of the length of time a channel has been automated in the year in question relative to the irrigation season length in the Baseline Year Length of season
A Ratio of the length of channel to be or actually automated to the total length of channel in the defined system (%) Determined from G-MW GIS
Dyearx Customer Deliveries in the Current Year in the irrigation system IPM reports
F(LTCEYear X)
Long Term Cap Equivalent Factor to convert Current Year volumes to Long Term Cap Equivalent volume
Calculated from deliveries and base figure advised by Department of Sustainability and Environment

Audit of Water Savings Prepared for Department of Sustainability and Environment
November 2011 Version 1 Page 23 Commercial in Confidence \\Bnesan01p\mts$\3603-11 DSE Audit of Water Savings\Reports\Final Reports\Audit of Water Savings 2011 - G-MW - FINAL.docx
We have reviewed the input data and confirm that the fixed parameters sourced from the Technical Manual are correct. We also found that the parameters sourced from the Baseline Year Water Balance are correct. However, G-MW has used a different approach for estimating the bank leakage component in the baseline year for the Phase 3 calculations and Phase 4 calculations.
For the Phase 3 calculations, bank leakage in the baseline year has been estimated as the number of leaks observed multiplied by an assumed volume per leak. This totals 1,172ML for Shepparton in the baseline year. For the Phase 4 calculation, bank leakage is calculated as the term that closes the water balance. This method gives a value of 5,754ML for bank leakage in Shepparton in the baseline year. Both methods are valid in the Technical Manual but result in inputs that vary by a factor of five. This demonstrates the problems in the bank leakage component of the water balance when it is used to close the water balance. We recommend that more work be completed to quantify upper bank leakage before and after water savings interventions. An approach suggested in the SKM uncertainty analysis report is to undertake another baseline year water balance along with data reconciliation. We support this recommendation.
Water savings due to reduced bank leakage following automation are only a very minor component of overall savings, accounting for 0.04% of Phase 3 savings and 0.1% of Phase 4 savings. Therefore while there is significant uncertainty associated with the estimate of this component, it is not material.
We comment on the inputs from the current operating year following:
Outfalls in Current Year (Oyearx)
The largest outfalls responsible for the greatest water savings are generally measured on-line with feedback to Goulburn Murray Water’s SCADA. Operators review SCADA and enter daily volumes into logsheets. These logsheets are used as the source of the outfall flow volumes for the water savings calculations.
Given the importance of the outfall volumes to the water savings estimates, we reviewed these in detail. Our findings regarding systems for handling this data are included in Section 5.4 and the results of our data trailing are included in Section 5.4.1.
Ratio of Length of Channel Automated (A)
The ratio of length of channel automated is determined from the G-MW GIS. The calculation is limited to the length of backbone channel automated only as the spur channels will eventually be abandoned through the connections program. We consider that the automated length ratios used in the calculation of bank leakage are justified.
Customer Deliveries in the Current Year (DYear X)
Customer deliveries in each irrigation district are determined through IPM. These delivery volumes are used for customer billing. Therefore, we believe that they will be reliable due to the scrutiny they are subject to by G-MW and customers. We outline the results of our data trailing of customer delivery volumes in Section 5.5.1. Our data trailing did not identify any issues in individual customer delivery volumes.

Audit of Water Savings Prepared for Department of Sustainability and Environment
November 2011 Version 1 Page 24 Commercial in Confidence \\Bnesan01p\mts$\3603-11 DSE Audit of Water Savings\Reports\Final Reports\Audit of Water Savings 2011 - G-MW - FINAL.docx
Length of Time Channel Automated (OPYear X)
G-MW calculate this factor as a simple ratio of the length of the irrigation season over the Baseline Year season length as the automation has been in place for the entire season.
6.4.5 Results
The audited water savings due to channel automation are summarised in Table 6-8.
Table 6-8 Phase 3 and Phase 4 Water Savings due to Chanel Automation
Shepparton Central Goulburn 1-4
Inputs
Obase (ML) 19,888 485
Oyearx (ML)
2009/10 (Phase 4)
2010/11 (Phase 3)
895
1052
20
25
Dbase (ML) 191,844 78,951
OPyearx (ML) 1.01 0.99
Lbase (backbone) (ML)
Phase 4 (balancing item method)
Phase 3 (No. leaks x vol/leak)
5,746
1,172
8,912
9,831
Abackbone 0.91 0.98
ta 1.00 1.00
Phase 3 Water Savings
Outfalls (ML) 4,376 139
Bank Leakage (ML) 6 65
Total (ML) 4,382 204
Phase 4 Water Savings
Outfalls (ML) 22,197 4,621
Bank Leakage (ML) 56 0
Total (ML) 22,252 4,621
As noted in last year’s audit report, outfall SP497 had outfall flows during 2009/10 greater than the baseline year volumes adjusted for LTCE, meaning that there are small ‘negative’ savings from this site. These ‘negative’ savings are included in the calculated water savings totals in accordance with s10.3.1 of the Technical Manual as all outfalls in the Shepparton area are treated as a single group.
We believe that the theoretical basis for zeroing outfalls is not made sufficiently clear by the Technical Manual. We recommend that the justification for this adjustment be included in the Technical Manual.

Audit of Water Savings Prepared for Department of Sustainability and Environment
November 2011 Version 1 Page 25 Commercial in Confidence \\Bnesan01p\mts$\3603-11 DSE Audit of Water Savings\Reports\Final Reports\Audit of Water Savings 2011 - G-MW - FINAL.docx
6.5 SAVINGS FROM SERVICE POINT REPLACEMENT AND RATIONALISATION
6.5.1 Scope of Service Point Replacement and Rationalisation Works
Water savings are achieved when existing customer service points, usually Detheridge Wheels, are replaced with modern outlets. The modern designs are typically pipes with magflow meters or flume gates. The savings achieved are due to the improved construction of the service points preventing leakage through and around the meter, as well as the increased accuracy of the new meters which better account for water use. Savings may also be achieved when existing service points are removed and not replaced (i.e. rationalised).
In the Shepparton and Central Goulburn 1-4 areas, the program of service point replacement and rationalisation works was largely completed prior to the 2010/11 season. Table 6-9 shows the movement in meter replacement and rationalisation numbers between the 2009/10 audit and the 2010/11 audit. G-MW was not able to explain the negative movement in the number of meters rationalised in the Shepparton irrigation area. While the difference is immaterial, we would expect that movements such as this would be able to be tracked.
Table 6-9 Extent of Meter Replacement and Rationalisation by Irrigation Area at end of 2008/09 Season
2009/10 audit 2010/11 Phase 3 calculations Difference
Shepparton CG1-4 Shepparton CG1-4 Shepparton CG1-4
Number of Manual Meters Replaced (No.) 566 244 569 246 3 2
Number of Automatic Meters Replaced (No.) 1,064 307 1,073 308 9 1
Total Meters Replaced (No.) 1,630 551 1,642 554 12 3
Number of Meters Rationalised (No.) 302 59 301 59 -1 0
The variations in meters replaced and rationalised observed does not materially affect the water savings estimates. However, G-MW should be able to reconcile the two sets of figures.
6.5.2 Overview
Water savings due to service point replacements and rationalisations are the sum of the savings realised through reduced meter errors, lowered leakage through and around the old meter, previously unmetered volumes and reduced unauthorised use. The same high level Phase 3 equation applies to both replacements and rationalisations although the individual components are determined differently.. G-MW has not included water savings due to meter error from rationalisations as it assumes that all flows through rationalised meters will now pass through new meters and the savings will be counted under service point replacement. This is a reasonable assumption. The high level equations are the same for both Phase 3 and Phase 4 savings:
Phase 3:
WSYear X = WSmeter error + WSleakage through + WSleakage around + WSunauthorised
Like NVIRP, G-MW has not included water savings due to meter error from rationalisations of meters on the backbone as it assumes that all flows through rationalised meters will now pass through new meters on the backbone and the savings will be counted under service point replacement. This is a reasonable assumption but may slightly underestimate the savings achieved.

Audit of Water Savings Prepared for Department of Sustainability and Environment
November 2011 Version 1 Page 26 Commercial in Confidence \\Bnesan01p\mts$\3603-11 DSE Audit of Water Savings\Reports\Final Reports\Audit of Water Savings 2011 - G-MW - FINAL.docx
Service point replacements are the next most significant source of water savings after channel automation, accounting for around 38% of all Phase 4 savings. Service point rationalisation only accounts for a small fraction of savings estimated to date (2.4% of Phase 4) due to the small scope of works completed.
6.5.3 Water Savings Calculations
Phase 3 Calculations – Service Point Replacement
Phase 3 water savings have been calculated by G-MW using the formula in the Technical Manual:
WSmeter error = DMYear X x (1/MCF) x (MCF – 1) x EFerror
WSleakage through = Nreplaced x tm x LTT x EFleakage through
WSleakage around = Nreplaced x tm x LTA x EFleakage around
WSunauthorised = Nreplaced x UBase x EFunauthorised x (DYear X/Dbase) x tm
Phase 3 Calculations – Service Point Rationalisation
Phase 3 water savings due to service point rationalisation have been calculated by G-MW using the formula in the Technical Manual:
WSleakage through = Nrationalised x tm x LTT x EFleakage through
WSleakage around = Nrationalised x tm x LTA x EFleakage around
WSunauthorised = Nrationalised x UBase x EFunauthorised x (DYear X/Dbase) x tm
Phase 4 Calculations – Service Point Replacement
Phase 4 water savings have been calculated by G-MW using the formula in the Technical Manual:
WSmeter error = DMYear X x (1/MCF) x (MCF – 1) x EFerror x DFerror x F(LTCEYear X)
WSleakage through = Nreplaced x tm x LTT x EFleakage through x DFleakage through
WSleakage around = Nreplaced x tm x LTA x EFleakage around x DFleakge around
WSunauthorised = Nreplaced x UBase x EFunauthorised x tm x DFunauthorised x F(LTCEbase)
Phase 4 Calculations – Service Point Rationalisation
Phase 4 water savings due to service point rationalisation have been calculated by G-MW using the formula in the Technical Manual, however the unmetered component has been omitted as discussed:
WSleakage through = Nrationalised x tm x LTT x EFleakage through x DFleakage through
WSleakage around = Nrationalised x tm x LTA x EFleakage around x DFleakage around
WSunauthorised = Nrationalised x UBase x EFunauthorised x DFunauthorised x F(LTCEBase) x tm

Audit of Water Savings Prepared for Department of Sustainability and Environment
November 2011 Version 1 Page 27 Commercial in Confidence \\Bnesan01p\mts$\3603-11 DSE Audit of Water Savings\Reports\Final Reports\Audit of Water Savings 2011 - G-MW - FINAL.docx
6.5.4 Input Data
The inputs required to calculate Phase 3 water savings due to service point replacement and rationalisation are summarised in Table 6-10 and Table 6-11. The first table details the parameters that are fixed or have been previously audited. The second table details the input data from the current year.
Table 6-10 Fixed Parameters and Baseline Year Parameters for Service Point Replacement and Rationalisation Water Savings Calculation
Parameter Description Source
MCF Adopted Meter Correction Factor for Dethridge Meter Service Points or associated with deemed Service Points Technical Manual
EFerror Effectiveness Factor for reducing measurement error Technical Manual
EFleakage through Effectiveness Factor for reducing leakage through the meter Technical Manual
EFleakage around Effectiveness Factor for reducing leakage around the meter Technical Manual
EFunauthorised Effectiveness Factor for reducing unauthorised use Technical Manual
LTA Defined Fixed Leakage Rate (ML/year/service point) around service points Technical Manual
LTT Defined Fixed Leakage Rate (ML/year/service point) through service points Technical Manual
UBase Unauthorised use loss in the Baseline Year Technical Manual
DBase Customer Deliveries in the Baseline Year Baseline Year water balance
DMbase Customer deliveries through the Rationalised meters in the Baseline Year
Baseline Year water balance
Vd Deemed customer deliveries through individual unmetered service points in the Baseline Year
Baseline Year water balance
DFerror Durability factor for reducing measurement error Technical Manual
DFleakage through Durability factor for reducing leakage through the meter Technical Manual
DFleakage around Durability factor for reducing leakage around the meter Technical Manual
DFunauthorised Durability factor for reducing unauthorised use Technical Manual
F(LTCEbase) Long Term Cap Equivalent Conversion Factor for the baseline year Department of Sustainability and Environment

Audit of Water Savings Prepared for Department of Sustainability and Environment
November 2011 Version 1 Page 28 Commercial in Confidence \\Bnesan01p\mts$\3603-11 DSE Audit of Water Savings\Reports\Final Reports\Audit of Water Savings 2011 - G-MW - FINAL.docx
Table 6-11 Current Year Parameters for Service Point Replacement and Rationalisation Water Savings Calculation
Parameter Description Source
DMYear X Customer deliveries through the replaced meters for the year in question IPM reports
DYear X Customer deliveries in the year in question to the irrigation system IPM reports
Nreplaced Number of meters replaced Construction records
Nrationalised Number of meters rationalised Construction records
tm Ratio of the length of time that the service point was replaced for irrigation purposes in the year in question to the irrigation season length in the Baseline Year
Construction records – date commissioned
F(LTCEYear X) Long Term Cap Equivalent Factor to convert Current Year volumes to Long Term Cap Equivalent volume Calculated from deliveries
We have reviewed the input data and confirm that the fixed parameters sourced from the Technical Manual are correct. G-MW has correctly applied the different effectiveness factors for preventing leakage through automated (100%) and manual (90%) meters.
We also found that the parameters sourced from the Baseline Year Water Balance are correct. We comment on the inputs from the current operating year following:
Customer Deliveries through Replaced Service Points (DMYear X) and in the Irrigation System (DYear X)
We have commented on this variable before and the results of our data trailing of customer delivery volumes are outlined in Section 5.5.1. We did not identify any errors in individual customer delivery volumes.
Number of Service Points Replaced and Rationalised (Nreplaced, Nrationalised)
The number of meters replaced and rationalised is determined from construction records. We have noted that there is a discrepancy between the number of service points replaced and rationalised in 2009/10 compared with 2010/11 despite no works being undertaken. While the difference is not material, we believe that G-MW should be able to account for this movement.
Ratio of time Service Point in use compared to Baseline Year (tm)
All works have been completed for the current season. As noted for the 2009/10 audit, G-MW uses the length of a standard irrigation season when calculating tm for service point rationalisation.
6.5.5 Results
The audited water savings due to service point replacements are summarised in Table 6-12 and the savings due to service point rationalisation are summarised in Table 6-13.

Audit of Water Savings Prepared for Department of Sustainability and Environment
November 2011 Version 1 Page 29 Commercial in Confidence \\Bnesan01p\mts$\3603-11 DSE Audit of Water Savings\Reports\Final Reports\Audit of Water Savings 2011 - G-MW - FINAL.docx
Table 6-12 Phase 3 and Phase 4 Water Savings due to Service Point Replacement
Shepparton CG 1-4
Phase 3 Water Savings
Meter error (ML) 2,167 1,189
Leakage through service points (ML) 3,111 758
Leakage around service points (ML) 678 167
Unauthorised Use (ML) 333 101
Total (ML) 6,290 2,215
Phase 4 Water Savings
Meter error (ML) 9,312 4,951
Leakage through service points (ML) 2,393 1,039
Leakage around service points (ML) 620 269
Unauthorised Use (ML) 1,527 664
Total (ML) 13,851 6,923
Table 6-13 Phase 3 and Phase Water Savings due to Service Point Rationalisation
Shepparton CG 1-4
Phase 3 Water Savings
Leakage through service points (ML) 590 113
Leakage around service points (ML) 124 24
Unauthorised Use (ML) 76 18
Total (ML) 790 155
Phase 4 Water Savings
Leakage through service points (ML) 574 139
Leakage around service points (ML) 121 29
Unauthorised Use (ML) 353 85
Total (ML) 1,048 253
6.6 SAVINGS FROM CHANNEL REMEDIATION
6.6.1 Scope of Irrigation Channel Remediation Works
Channel remediation involves lining earthen channels, installing pipelines and bank remodelling. These works can generate irrigation water savings through reduced evaporation, reduced bank seepage and reduced bank leakage. Channel remediation accounts for around 7% of the Phase 4 savings claimed by G-MW.
6.6.2 Overview
The type of calculation employed for determining water savings due to channel remediation depends on the availability of pre and post works pondage data as detailed in Table 6-14.

Audit of Water Savings Prepared for Department of Sustainability and Environment
November 2011 Version 1 Page 30 Commercial in Confidence \\Bnesan01p\mts$\3603-11 DSE Audit of Water Savings\Reports\Final Reports\Audit of Water Savings 2011 - G-MW - FINAL.docx
Table 6-14 Calculation methods for Channel remediation works
Data availability Calculation method
No pre or post remediation pondage testing data available Theoretical method (No pre-works pondage test data)
Pre remediation pondage testing only available Theoretical method (using pre-works pondage test data)
Both pre and post remediation pondage testing data available Direct method
Both direct and theoretical equations have the same high level form:
WSYear X = WSbank leakage + WSseepage + WSevaporation
For the works completed in the Shepparton and Central Goulburn 1-4 irrigation areas, no post-works pondage data has been collected. Therefore, the theoretical method is used for all savings estimates.
6.6.3 Water Savings Calculations
Theoretical Phase 3 calculations where no pre-works pondage testing data is available are not discussed as these only apply to the 2008 works. These were reviewed in 2009/10 and there has been no change since this time.
Theoretical Method - Phase 3 Calculations– No pre-works pondage test data available
As noted, where no pre or post works pondage test data is available, the theoretical equation has been used which incorporates the Baseline Year leakage:
WSleakage = {[(Lbase x VL x (DYear X/Dbase)) – (VL x LYear X)] +[(FLx LBase) – (FL x LYear X)]} x RL
WSseepage = (SBase – SYear X) x RL
WSEvaporation = (EBase – EYear X) x RL
Theoretical Method - Phase 3 Calculations– Pre-works pondage test data available
WSleakage = [(Lpre works x VL x (DYear X/Dbase)) + (Lpre works x FL)] x RL x EF x F(PA)
WSseepage = SBase x EF x RL x F(PA)
Theoretical Method - Phase 4 Calculations– Pre-works pondage test data available
WSleakage = [(Lpre works x VL x LTCE) + (Lpre works x FL)] x DF x EF x F(PA)
WSseepage = Spre works x EF x DF x RL x F(PA)
6.6.4 Input Data
The inputs required to calculate Phase 3 water savings due to channel remediation are summarised in Table 6-15 and Table 6-16. The first table details the parameters that are fixed or have been previously audited. The second table details the input data from the current year.

Audit of Water Savings Prepared for Department of Sustainability and Environment
November 2011 Version 1 Page 31 Commercial in Confidence \\Bnesan01p\mts$\3603-11 DSE Audit of Water Savings\Reports\Final Reports\Audit of Water Savings 2011 - G-MW - FINAL.docx
Table 6-15 Fixed Parameters and Baseline Year Parameters for Channel Remediation Water Savings Calculation
Parameter Description Source
VL Proportion of bank leakage recognised as variable Technical Manual
FL Proportion of bank leakage recognised as fixed Technical Manual
Dbase Effectiveness Factor for reducing measurement error Baseline Year water balance
EF Effectiveness Factor for channel remediation Technical Manual
LBase Leakage in the Baseline Year Baseline Year water balance
Sbase Seepage in the Baseline Year Baseline Year water balance
Table 6-16 Current Year Parameters for Channel Remediation Water Savings Calculation
Parameter Description Source
LPre works Pre works bank leakage Pondage testing or theoretical estimate
LPost works Post works bank leakage Pondage testing
DYear X Customer deliveries in the year in question to the irrigation system IPM reports
RL Ratio of length of channel length remediated to total channel length in system
GIS and direct measurement
F(PA) Pondage Testing Adjustment Factor to account for dynamic losses in addition to static losses
Technical Manual and soil type
Spre works Pre works seepage Pondage testing or theoretical estimate
Spost works Post works seepage Pondage testing
We have reviewed the input data and confirm that the fixed parameters sourced from the Technical Manual are correct, as is the deliveries in the Baseline Year sourced from the Baseline Year Water Balance. We comment following on the current year parameters.
Pre Works and Post Works Bank Leakage and Seepage (Lpre works, LPost works, Spre works, SPost works)
Where pondage testing data is available, pre and post works leakage and seepage are determined through evaluation of site testing results. We discuss these tests in Section 5.6. We believe that the pre and post works pondage estimates determined through site testing are sound.
Customer Deliveries in the Current Year (DYear X)
We have commented on this variable before and the results of our data trailing of customer delivery volumes are outlined in Section 5.5.1.
Ratio of Channel Length remediated to Total Channel Length (RL)
As discussed in Section 5.6, channel remediation lengths are determined using GIS and through direct measurement on site. We are satisfied that these measurements are sufficiently accurate.

Audit of Water Savings Prepared for Department of Sustainability and Environment
November 2011 Version 1 Page 32 Commercial in Confidence \\Bnesan01p\mts$\3603-11 DSE Audit of Water Savings\Reports\Final Reports\Audit of Water Savings 2011 - G-MW - FINAL.docx
6.6.5 Results
The audited water savings due to channel remediation are summarised in Table 6-17. Unusually, the Phase 3 water savings exceed the Phase 4 water savings. This is due to the different methods used to calculate each.
Table 6-17 Phase 3 Water Savings due to Channel Remediation
Shepparton Central Goulburn 1-4
Phase 3 water savings
Bank leakage (ML) 129 909
Seepage (ML) 575 125
Evaporation (ML) 329 0
Total 1,032 1,034
Phase 4 water savings
Bank leakage (ML) 184 3,377
Seepage (ML) 15 219
Evaporation (ML) 4 -
Total (ML) 203 3,596

Audit of Water Savings Prepared for Department of Sustainability and Environment
November 2011 Version 1 Page 33 Commercial in Confidence \\Bnesan01p\mts$\3603-11 DSE Audit of Water Savings\Reports\Final Reports\Audit of Water Savings 2011 - G-MW - FINAL.docx
7 PROGRESS AGAINST PREVIOUS AUDIT RECOMMENDATIONS
The Audit Protocol requires the current year audit to report on the progress made by the relevant organisations in achieving the recommendations from previous audits. The recommendations made in previous year’s audit reports season have been discussed by NVIRP, G-MW and DSE at a number of regular meetings.
We have outlined the progress against these recommendations in the 2010/11 NVIRP water savings audit report so do not repeat them here.

Audit of Water Savings Prepared for Department of Sustainability and Environment
November 2011 Version 1 Page 34 Commercial in Confidence \\Bnesan01p\mts$\3603-11 DSE Audit of Water Savings\Reports\Final Reports\Audit of Water Savings 2011 - G-MW - FINAL.docx
8 RECOMMENDATIONS ON TECHNICAL MANUAL AND WATER SAVINGS APPROACH
The Department of Sustainability and Environment request that comment be made following audit work regarding:
Potential improvements to estimate the water savings in the areas of :
data collection,
data analysis,
assumptions and
methods.
Recommended changes to the Technical Manual for the Quantification of Water Savings.
We make the following recommendations in these areas. These recommendations have been included within the body of this report and in the water savings report for the areas that G-MW is responsible for. We have repeated this recommendations section in each report for completeness:
Data Collection, Data Analysis, Assumptions and Methods
As noted last year, we recommend that SCADA be used as the primary point of reference for recording, storing and reporting outfall measurement data given that most major outfalls now have online measurement. Operators should continue to record where adjustments to flows need to be made, e.g. if a sensor is out of the flow. SCADA may be programmed to identify (automatically or prompted) flood water discharge events and thereby report an outfall figure that is net of flood volumes;
We recommend that G-MW undertakes reconciliation of its outfall information. The exercise should compare the outfall IPM number, structure number, SCADA reference, location in GIS and actual location recorded on site. The works should be prioritised so that those outfalls most critical to the water savings calculations be investigated first. This recommendation follows on from our 2009/10 recommendation that outfalls names used by G-MW should be reconciled with the outfall names used in SCADA; and
We recommend that G-MW formalise the items to be included and excluded from the total customer delivery volumes report for water savings in a procedure or similar.
We recommend that G-MW prepares a procedure that clearly sets out how operators should:
Treat minor outfall volumes
Record volumes based on the level of accuracy of flowmeters
Record non-routine flows including volumes associated with discharging flood waters with reference to observed start and stop time of rainfall events
Record anomalous volumes and the reason for them
Any other item that G-MW considers important for the accurate and reliable recording of outfall volumes.
Additionally, G-MW should:
Prepare a template for recording of outfall volumes that is structured the same for all areas
Inform and train staff across all areas in the use of the procedure
Monitor through internal review and audits that operators are applying the procedure.

Audit of Water Savings Prepared for Department of Sustainability and Environment
November 2011 Version 1 Page 35 Commercial in Confidence \\Bnesan01p\mts$\3603-11 DSE Audit of Water Savings\Reports\Final Reports\Audit of Water Savings 2011 - G-MW - FINAL.docx
We believe that G-MW Operations must take the lead in these initiatives and that these should be largely implemented before the commencement of the 2012/13 irrigation season given that two years have passed since the first recommendations were made in this area.
Technical Manual
More work should be completed in the area of savings due to reduced upper bank leakage following automation to confirm whether the quantities of savings outlined in the Technical Manual are begin realised. Following completion of this work, NVRIP and G-MW should consistently apply the findings to calculating savings due to reduced upper bank leakage following automation.
We believe that there is value in completing another audit of an annual water balance before the end of the project. The benefit of this exercise will be to provide a data set to complement the 2004/05 annual audit. An updated data set would help to reflect changes in the nature of the irrigation system since 2004/05 and it would provide additional insight into loss components, notably upper bank leakage and unauthorised use. However, conducting another audit of an annual water balance would present problems in the interpretation of the data against the 2004/05 water balance. Therefore, intent and expected outcomes of the exercise should be planned in advance. The SKM uncertainty analysis also included a recommendation to complete a water balance along with data reconciliation to reduce the uncertainty in estimates.
As noted in 2009/10, we believe that the theoretical basis for zeroing these outfalls is not made sufficiently clear in the Technical Manual. We recommend that the justification for this adjustment be included in future revisions of the Technical Manual. The practice of setting these negative savings to zero should particularly be reviewed for sites where negative savings are observed in successive years.
There is an incomplete sentence on page 12 of the manual.

Audit of Water Savings Prepared for Department of Sustainability and Environment
Commercial in Confidence Version 1 November 2011 \\Bnesan01p\mts$\3603-11 DSE Audit of Water Savings\Reports\Final Reports\Audit of Water Savings 2011 - G-MW - FINAL.docx Appendix
Appendix 1
Schedule of Sites Visited

Audit of Water Savings Prepared for Department of Sustainability and Environment
Commercial in Confidence Version 1 November 2011 \\Bnesan01p\mts$\3603-11 DSE Audit of Water Savings\Reports\Final Reports\Audit of Water Savings 2011 - G-MW - FINAL.docx Appendix
ID No Photo
MV669 G1
MV666
MV5398

Audit of Water Savings Prepared for Department of Sustainability and Environment
Commercial in Confidence Version 1 November 2011 \\Bnesan01p\mts$\3603-11 DSE Audit of Water Savings\Reports\Final Reports\Audit of Water Savings 2011 - G-MW - FINAL.docx Appendix
ID No Photo
MV565
MV410
MV331

Audit of Water Savings Prepared for Department of Sustainability and Environment
Commercial in Confidence Version 1 November 2011 \\Bnesan01p\mts$\3603-11 DSE Audit of Water Savings\Reports\Final Reports\Audit of Water Savings 2011 - G-MW - FINAL.docx Appendix
ID No Photo
MV2270
MV337
MV346

Audit of Water Savings Prepared for Department of Sustainability and Environment
Commercial in Confidence Version 1 November 2011 \\Bnesan01p\mts$\3603-11 DSE Audit of Water Savings\Reports\Final Reports\Audit of Water Savings 2011 - G-MW - FINAL.docx Appendix
ID No Photo
MV741 G1
MV1004

Audit of Water Savings Prepared for Department of Sustainability and Environment
Commercial in Confidence Version 1 November 2011 \\Bnesan01p\mts$\3603-11 DSE Audit of Water Savings\Reports\Final Reports\Audit of Water Savings 2011 - G-MW - FINAL.docx Appendix
Appendix 2
Schedule of Documents Received

Audit of Water Savings Prepared for Department of Sustainability and Environment
Commercial in Confidence Version 1 November 2011 \\Bnesan01p\mts$\3603-11 DSE Audit of Water Savings\Reports\Final Reports\Audit of Water Savings 2011 - G-MW - FINAL.docx Appendix
Document Received from
Meter Works step 1 combined meter works Peter Roberts
Meter Works step 2 meters list sorted into area and type of work Peter Roberts
SPREAD- PLAN -v9 Backbone Service Point Outle Peter Roberts
SPREAD- PLAN -v10 Backbone Service Point Outlet Water Savings 2010 2011 -040911 - svw audit
Peter Roberts
SPREAD- PLAN -v10 Backbone Service Point Outlet Water Savings 2010 2011 -040911 Peter Roberts
SPREAD- PLAN -v10 Backbone Service Point Outlet Water Savings 2010 2011 -040911 Peter Roberts
SPREAD-PLAN- V9- Estimate of Channel remediation Peter Roberts
SPREAD-PLAN- V9- Estimate of Channel remediation water savings remediated 273 day option - 310811 (Autosaved)
Peter Roberts
SPREAD-PLAN- V10- Estimate of Channel remediation water savings - 310811 (Autosaved) Peter Roberts
SPREAD-PLAN- V10- Estimate of Channel remediation water savings - 310811 (Autosaved) Peter Roberts
SPREAD-PLAN- v11 Automation - estimated Automation Water Savings - SVW audit notes Peter Roberts
SPREAD-PLAN- v11 Automation - estimated Automation Water Savings from regulator rollout1 Peter Roberts
SPREAD-PLAN- v11 Automation - estimated Automation Water Savings Peter Roberts
SPREAD-PLAN -v9 Backbone Service Point Outlet Water Savings 2010 2011 -310811 Peter Roberts
v3 check of split adjustment backbone and spur meter error savings based on 04 05 delivery data
Peter Roberts
v6 channel removal for audit 2011 Peter Roberts
v8 Summary Water Savings Peter Roberts
v10 spurs Service Point Outlet Water Savings 2010 2011 273 days Peter Roberts
v10 spurs Service Point Outlet Water Savings 2010 2011 273 days Peter Roberts
v10 Summary Water Savings (3) Peter Roberts
NVIRP-11-0278-A0-L CG Regulator Works Updatel Peter Roberts
NVIRP-11-0278-A0-L MV Regulator Works Updatel Peter Roberts
NVIRP-11-0278-A0-L PB Regulator Works Updatel Peter Roberts
NVIRP-11-0278-A0-L RO Regulator Works Updatel (2) Peter Roberts
NVIRP-11-0278-A0-L TO Regulator Works Updatel Peter Roberts
NVIRP-11-0308-A0-L CG RO Channel Automation Rollout Peter Roberts
NVIRP-11-0308-A0-L MV Channel Automation Rollout Peter Roberts
NVIRP-11-0308-A0-L PB Channel Automation Rollout Peter Roberts
Copy of pondage test summary for Roberts 28 July 2011 Peter Roberts
DOC130510 leter vex GMW with loss reates for 2010 sites Peter Roberts
v2 2010 2011 NVIRP Water Savings Estimation Procedures 020911 Peter Roberts
v5 Backbone & Spur Connections Meter Water Savings Procedures Peter Roberts
WSP9 Estimation of Water Savings -Spur Channel Rationalisation Peter Roberts
WSP10a Estimation of Water Savings Channel Automation Outfalls v2 Peter Roberts
WSP11a Estimation of Water Savings - Reduction in Leakage Around Replaced Outlets v2 Peter Roberts
WSP11b Estimation of Water Savings - Reduction in Leakage Thruough Replaced Outlets v2 Peter Roberts
WSP11c Estimation of Water Savings - Reduction in Unauthorised Use Replaced Outlets Peter Roberts

Audit of Water Savings Prepared for Department of Sustainability and Environment
Commercial in Confidence Version 1 November 2011 \\Bnesan01p\mts$\3603-11 DSE Audit of Water Savings\Reports\Final Reports\Audit of Water Savings 2011 - G-MW - FINAL.docx Appendix
Document Received from
WSP11d Estimation of Water Savings - Reduction in Metering Error Replacment of Outlets Peter Roberts
WSP12a Estimation of Water Savings - Reduction in Leakage Around Rationalised Outlets v2 Peter Roberts
WSP12b Estimation of Water Savings - Reduction in Leakage Through Rationalised Outlets v2 Peter Roberts
WSP12c Estimation of Water Savings - Reduction in Leakage Around Rationalised Meters open outlets v2
Peter Roberts
WSP12c Estimation of Water Savings - Reduction in Unauthorised Use Rationalised Outlets Peter Roberts
WSP12d Estimation of Water Savings - Reduction in Unauthorised Use via Rationalisation v2 Peter Roberts
WSP13a Estimation of Water Savings -Channel remediation - Direct Method Peter Roberts
WSP13b Estimation of Water Savings -Channel remediation - Measured L pre works data only Peter Roberts
WSP13c Estimation of Water Savings -Channel remediation Theortetical Method both Lbase L yrx good
Peter Roberts
WSP13d Estimation of Water Savings -Channel remediation - Estimate L pre works Peter Roberts
101215 LGW Quantification of Outfall Losses ver2 Peter Roberts
Minutes Water Savings Group Meeting # 14 Peter Roberts
2010/2011 Phase 3 Water Savings Estimator - February 2011 Mike Schulz
Docs References for Procedures for Water Savings Mike Schulz
Documents supplied by GMW to Water Savings Auditor (Cardno, Steven Walker), Sep 2011 Mike Schulz
Creating and Amending Water Balance and Water Savings Calculation Spreadsheets Mike Schulz
Description of G-MW Business Systems for Phase 3 Audit Mike Schulz
Procedure for Audit – Determining the Split of Losses between Backbone and Spur Channels Mike Schulz
Instructions for updating Phase 2 Water Savings Estimates Mike Schulz
Instructions for undertaking Current Year Water Balance and Phase 3 Water Savings Estimates Mike Schulz
Determination of System Loss for Modernisation Projects Mike Schulz
Determining Murray Valley Baseline Deliveries by Excluding Broken Creek Flows Mike Schulz
Estimation Natural Carrier Losses – Torrumbarry Mike Schulz
Collection of Outfall Data Flow Chart Mike Schulz
Collection of Outfall Data – Method Mike Schulz
Determining Outfall Savings – Data Analyses Mike Schulz
Collection of Service Point Usage Data Flow Chart Mike Schulz
Determining Deliveries through Dethridge meters and Open outlets and the number of Dethridge and Open Outlets
Mike Schulz
Standard Irrigation Area Meter Reading Procedure Mike Schulz
Determining System Loss associated with Small Pipe Outlets Mike Schulz
Determining the Deliveries through New Service Points Mike Schulz
Determination of Leakage for Modernisation Projects Mike Schulz
Determining Average Daily Weather Values for Irrigation Seasons Mike Schulz
Calculating Seepage Rates for GMID Channel Sections based on Soil Type Mike Schulz Pondage Tests – Field Component Mike Schulz Pondage Tests – Data Analysis Mike Schulz Pondage Test Adjustment Factor F(PA) Mike Schulz
Measurement of Channel Width Correction Mike Schulz

Audit of Water Savings Prepared for Department of Sustainability and Environment
Commercial in Confidence Version 1 November 2011 \\Bnesan01p\mts$\3603-11 DSE Audit of Water Savings\Reports\Final Reports\Audit of Water Savings 2011 - G-MW - FINAL.docx Appendix
Document Received from
Procedure for Audit – Determining Channel Surface Areas in Irrigation Areas from #2713840 Mike Schulz
Estimation of System Fill Mike Schulz
Determination of the Start and Finish of the Irrigation Season Mike Schulz
Asset Rationalisation for Modernisation Projects Mike Schulz
Response to Site Visit Issues - Water Savings Audit September 2011 Mike Schulz
Site Visit Maps - Water Savings Audit September 2011 supplied to auditor as separate jpg files; Mike Schulz
Map-MV east overview
Map-MV west overview
Map-MV331-337 lining channel 7on2
Map-MV346 channel 16on7on2
Map-MV399 channel 1on9on2
Map-MV410 channel 9on2
Map-MV565 channel 2on5
Map-MV670 channel 9on5
Map-MV741 channel 20on5 new lining
Map-MV800 channel 5
Map-MV996 channel 13on6
Map-MV1004 channel 13on6
Map-rationalised channel 19on6
Map-rationalised channel 29on6
Mike Schulz
Compiled and Cleansed List of Individual Outfall Site Information with Volumes for all Years Including Baseline Year
Mike Schulz
Goulburn-Murray Water Annual Report 2010-11 Irrigation Deliveries Mike Schulz
Rubicon Dump of Last Recorded Usage to Aug 2011 - Water Savings Audit September 2011
suppled to auditor as;
Data- Rubicon dump of IPM last recorded usage to Aug 2011
Mike Schulz
Data-IPM Outlets - Water Savings Audit September 2011
supplied to auditor as;
Data-IPM outlets
Mike Schulz
Pondage Test Summary - GMID All Years Mike Schulz
Pondage Test Analysis 2009/10 - Murray Valley – 2009.09 (Sep) Mike Schulz
Pondage Test Analysis 2009/10 - Rochester – 2010.02 (Feb) Mike Schulz
Pondage Test Analysis 2010/11 - Rochester – 2010.08 Season Start Channel 20 To 23 Mike Schulz
Pondage Test Combined Charts 2009/11 - Rochester Mike Schulz
Pondage Test Combined Charts 2009/11 - Murray Valley Mike Schulz
Pondage Test Analysis 2010/11 - Murray Valley – 2010.12 Lined Pools Mike Schulz
Pondage Test Analysis 2010/11 - Rochester – 2011.05 Season End Mike Schulz
Shepparton Irrigation Area Loss Management Program – 2010/11 Mike Schulz
Meter Readings IPM Reports - Water Savings Audit September 2011 Mike Schulz
Outfall Reports - Water Savings Audit September 2011 Mike Schulz
Thiess Monitoring Site 405738A description - Water Savings Audit September 2011 Mike Schulz