audit committee 30 january 2019 item no. summary …
TRANSCRIPT

AUDIT COMMITTEE 30 JANUARY 2019
ITEM NO. ......................
PRUDENTIAL INDICATORS AND TREASURY MANAGEMENT STRATEGY REPORT 2019/20
SUMMARY REPORT
Purpose of the Report
1. This report requests Audit Committee to review and scrutinise the following prior to forwarding to Cabinet and Council for their approval and adoption :-
(a) The Prudential Indicators and Limits for 2019/20 to 2021/22 relating to capital expenditure and Treasury Management activity.
(b) A policy statement relating to the Minimum Revenue Provision.
(c) The Treasury Management Strategy 2019/20, which includes the Annual Investment Strategy for 2019/20
2. The report outlines the Council’s prudential indicators for 2019/20 – 2021/22 and sets out the expected treasury operations for this period. It fulfils key legislative and guidance requirements:
(a) The reporting of the prudential indicators setting out the expected capital activities and treasury management prudential indicators included as treasury indicators in the CIPFA Treasury Management Code of Practice
(b) The Council’s Minimum Revenue Provision (MRP) Policy, which sets out how the Council will pay for capital assets through revenue each year.
(c) The treasury management strategy statement which sets out how the Council’s treasury service will support capital decisions taken above, the day to day treasury management and the limitations on activity through treasury prudential indicators.
(d) The key indicator is the authorised limit, the maximum amount of debt the Council could afford in the short term, but which is not sustainable in the longer term.
(e) The investment strategy which sets out the Council’s criteria for choosing the investment counterparties and limiting exposures to the risk of loss.
Prudential_Indicators_and_Treasury_Management_Strat - 1 of 38 -egy_Report_2019-20.docx20 Audit Committee

3. The information contained in the report regarding the Councils expenditure plans, Treasury Management and Prudential Borrowing activities indicate that they are:-
(a) Within the statutory framework and consistent with the relevant codes of practice.
(b) Prudent, affordable and sustainable.
(c) An integral part of the Council’s Revenue and Capital Medium Term Financial Plans.
Recommendation
4. It is recommended that the Audit Committee examine the following and pass on any comments to the Council via Cabinet in order that they approve them:-
(a) The Prudential Indicators and limits for 2019/20 to 2021/22 summarised in Tables 1 and 2.
(b) The Minimum Revenue Provision (MRP) statement (paragraphs 37 - 41).
(c) The Treasury Management Strategy 2019/20 to 2021/22 as summarised in paragraphs 45 to 70.
(d) The Annual Investment Strategy 2019/20 contained in paragraphs 71 to 112.
Reasons
5. The recommendations are supported by the following reasons :-
(a) In order to comply with the Prudential Code for Capital Finance in Local Authorities and the Department for Communities and Local Government (CLG) guidance on investments.
(b) To comply with the requirements of the Local Government Act 2003.
(c) To approve a framework for officers to work within when making investment decisions.
Paul Wildsmith Managing Director
Background Papers (i) Annual Statement of Account 2017/18 (ii) Draft Capital MTFP 2019/20 to 2022/23 (iii) Link Asset Services Economic Report Dec 2018
Peter Carrick: Extension 5401
Prudential Indicators and Treasury Management Strategy Report 2019/20 Audit Committee - 2 of 38 -

S17 Crime and Disorder This report has no implications for S 17 Crime and Disorder.
Health and Well Being This report has no implications for the Council’s Health and Well being agenda.
Carbon Impact This report has no implications for the Council’s Carbon Emissions.
Diversity This report has no implications for the Council’s Diversity agenda.
Wards Affected All Wards Groups Affected All Groups Budget and Policy Framework This report must be considered by Council. Key Decision This is not an executive decision Urgent Decision For the purposes of call in this report is not an
urgent decision. One Darlington: Perfectly Placed
This report has no particular implications for the sustainable Community Strategy.
Efficiency The report refers to actions taken to reduce costs and manage risks.
Impact on Looked After Children and Care Leavers
This report has no impact on Looked After Children or Care Leavers.
MAIN REPORT
Information and Analysis
Background
6. The Council is required to operate a balanced budget, which broadly means that cash raised during the year will meet cash expenditure. Part of the treasury management operation is to ensure that this cash flow is adequately planned, with cash being available when it is needed. Surplus monies are invested in counterparties or instruments commensurate with the Council’s risk appetite, providing adequate liquidity initially before considering investment return.
7. The second main function of the treasury management service is the funding of the Council’s capital plans. These capital plans provide a guide to the borrowing need of the Council, essentially the longer term cash flow planning to ensure that the Council can meet its capital spending obligations. This management of longer term cash may involve arranging long or short term loans, or using longer term cash flow surpluses. On occasion, when it is prudent and economic, any debt previously drawn may be restructured to meet Council risk or cost objectives.
8. The contribution the treasury management function makes to the authority is critical, as the balance of debt and investment operations ensure liquidity or the ability to meet spending commitments as they fall due, either on day-to-day revenue or for larger capital projects. The treasury operations will see a balance of the interest costs of debt and the investment income arising from cash deposits affecting the available budget. Since cash balances generally result from reserves
Prudential Indicators and Treasury Management Strategy Report 2019/20 Audit Committee - 3 of 38 -

and balances, it is paramount to ensure adequate security of the sums invested, as a loss of principal will in effect result in a loss to the General Fund Balance.
9. Whilst any commercial initiatives or loans to third parties will impact on the treasury function, these activities are generally classed as non-treasury activities, (arising usually from capital expenditure), and are separate from the day to day treasury management activities.
10. CIPFA defines treasury management as:
“The management of the local authority’s investments and cash flows, its banking, money market and capital market transactions; the effective control of the risks associated with those activities; and the pursuit of optimum performance consistent with those risks.”
11. Revised reporting is required for the 2019/20 reporting cycle due to revisions of the MHCLG Investment Guidance, the MHCLG Minimum Revenue Provision (MRP) Guidance, the CIPFA Prudential Code and the CIPFA Treasury Management Code. The primary reporting changes include the introduction of a capital strategy, to provide a longer-term focus to the capital plans, and greater reporting requirements surrounding any commercial activity undertaken under the Localism Act 2011. The capital strategy is being reported separately alongside the 2019/20 MTFP.
Reporting requirements
Capital Strategy
12. The revised 2017 CIPFA Prudential and Treasury Management Codes require, for 2019-20, all local authorities to prepare an additional report, a capital strategy report, which will provide the following:
• a high-level long term overview of how capital expenditure, capital financing and treasury management activity contribute to the provision of services
• an overview of how the associated risk is managed • the implications for future financial sustainability
13. The aim of this capital strategy is to ensure that all elected members on the full council fully understand the overall long-term policy objectives and resulting capital strategy requirements, governance procedures and risk appetite.
14. This capital strategy is reported separately from the Treasury Management Strategy Statement; non-treasury investments will be reported through the former. This ensures the separation of the core treasury function under security, liquidity and yield principles, and the policy and commercialism investments usually driven by expenditure on an asset. The capital strategy will show:
• The corporate governance arrangements for these types of activities; • Any service objectives relating to the investments; • The expected income, costs and resulting contribution; • The debt related to the activity and the associated interest costs; • The payback period (MRP policy); • For non-loan type investments, the cost against the current market value;
Prudential Indicators and Treasury Management Strategy Report 2019/20 Audit Committee - 4 of 38 -
• The risks associated with each activity
15. Where a physical asset is being bought, details of market research, advisers used, (and their monitoring), ongoing costs and investment requirements and any credit information will be disclosed, including the ability to sell the asset and realise the investment cash.
16. Where the Council has borrowed to fund any non-treasury investment, there should also be an explanation of why borrowing was required and why the MHCLG Investment Guidance and CIPFA Prudential Code have not been adhered to.
17. If any non-treasury investment sustains a loss during the final accounts and audit process, the strategy and revenue implications will be reported through the same procedure as the capital strategy.
18. To demonstrate the proportionality between the treasury operations and the non-treasury operation, high-level comparators are shown throughout this report.
Treasury Management Reporting
19. The Council is required by legislation to receive and approve, as a minimum, three main reports each year, which incorporate a variety of policies, estimates and actuals. These reports are required to be adequately scrutinised before being recommended to the Council. This role is undertaken by the Audit Committee.
Prudential and Treasury Indicators and Treasury Strategy (this report)
20. The first, and most important report is forward looking and covers:
(a) The capital plans (including prudential indicators); (b) A minimum revenue provision (MRP) policy (how residual capital
expenditure is charged to revenue over time); (c) The treasury management strategy, (how the investments and borrowings
are to be organised), including treasury indicators; and (d) An investment strategy, (the parameters on how investments are to be
managed).
A Mid Year Treasury Management Report
21. This will update members with the progress on the capital position, amending prudential indicators as necessary, and whether the treasury function is meeting the strategy or whether any policies require revision.
An Annual Treasury Report
22. This is a backward looking review document and provides details of a selection of actual prudential and treasury indicators and actual treasury operations compared to the estimates within the strategy.
Prudential Indicators and Treasury Management Strategy Report 2019/20 Audit Committee - 5 of 38 -

Treasury Management Strategy for 2019/20
23. The strategy for 2019/20 covers two main areas:
(a) Capital Issues: the capital expenditure plans and the prudential indicators; the minimum revenue provision (MRP) policy.
(b) Treasury Management Issues: the current treasury position; treasury indicators which will limit the treasury risk and
activities of the Council; prospects for interest rates; the borrowing strategy; policy on borrowing in advance of need; debt rescheduling; the investment strategy; creditworthiness policy; and policy on use of external service providers.
24. These elements cover the requirements of the Local Government Act 2003, the CIPFA Prudential Code, MHCLG MRP Guidance, the CIPFA Treasury Management Code and the MHCLG Investment Guidance.
25. A summary of the key prudential indicators and limits are contained inTables 1 and 2 and further details are contained further on in this report.
Table 1 – Capital Expenditure and Borrowing
2018/19Revised
2019/20Estimated
2020/21Estimated
2021/22Estimated
Capital Expenditure Table 3 and 4
£38.427m £34.149m £15.146m £13.133m
Capital financing requirement Table 5
£319.487m £326.703m £324.934m £323.179m
Ratio of financing costs to net revenue stream – General Fund See paragraph 43/44 Table 6
3.03% 2.74% 2.98% 3.03%
Ratio of financing costs to net revenue stream – HRA See paragraph 43/44 Table 6
15.03% 17.48% 16.72% 18.15%
Operational boundary for external debt Table 8
£300.653m £310.498m £309.358m £308.232m
Authorised limit for external debt Table 9
£315.686m £326.023m £324.826m £323.644m
Prudential Indicators and Treasury Management Strategy Report 2019/20 Audit Committee - 6 of 38 -

Table 2 – Treasury Management
2019/20UpperLimit
2020/21UpperLimit
2021/22UpperLimit
Limits on fixed interest rates 100% 100% 100% Limits on variable interest rates 40% 40% 40% Maximum principal sumsinvested > 364 days
£50m £50m £50m
Maturity Structure of fixed interest rate borrowing 2019/20
Lower Limit
UpperLimit
Under 12 months 0% 40%
12 months to 2 years 0% 50% 2 years to 5 years 0% 60% 5 years to 10 years 0% 80% 10 years and above 0% 100%
Training
26. The CIPFA code requires the responsible officer to ensure that Members with responsibility for treasury management receive adequate training in treasury management. This especially applies to Members responsible for scrutiny. Training was undertaken by a number of Members during 2 sessions held in March 2018 and further training will be arranged as required. The training needs of treasury management officers are periodically reviewed.
Treasury Management Consultants
27. The Council uses Link Asset Services, Treasury solutions as its external treasury management advisors. The Council recognises that responsibility for treasury decisions remains with the organisation at all times and will ensure that undue reliance is not placed upon our external service providers. All decisions will be undertaken with regards to all available information, including, but not solely, our treasury advisors.
28. It also recognises that there is value in employing external providers of treasury management services in order to acquire access to specialist skills and resources. The officers of the Council will ensure that the terms of their appointment and the methods by which their value will be assessed are properly agreed and documented and subject to regular review.
The Capital Prudential Indicators 2019/20– 2021/22
29. The Council’s capital expenditure plans are the key driver of treasury management activity. The output of the capital expenditure plans are reflected in the prudential indicators, which are designed to assist members’ overview and confirm capital expenditure plans.
Prudential Indicators and Treasury Management Strategy Report 2019/20 Audit Committee - 7 of 38 -

Capital Expenditure
30. This Prudential Indicator is a summary of the Council’s capital expenditure plans, both those agreed previously, and those forming part of this budget cycle. Members are asked to approve the capital expenditure forecasts:
Table 3 Capital Expenditure
2018/19Revised
£m
2019/20Estimate
£m
2020/21Estimate
£m
2021/22Estimate
£m General Fund 15.746 7.615 5.512 3.999 HRA 17.681 22.534 9.634 9.134 Estimated CapitalExpenditure
33.427 30.149 15.146 13.133
Loans Facility to Registered Social Landlords (RSL’s)
0.000 0.000 0.000 0.000
Loans to Joint Ventures
5.000 4.000 0.000 0.000
Total 38.427 34.149 15.146 13.133
31. The financing need above excludes other long term liabilities, such as PFI and leasing arrangements which already include borrowing instruments.
32. The table below summarises the above capital expenditure plans and how these plans are being financed by capital or revenue resources. Any shortfall of resources results in a financing need (borrowing).
Table 4 Financing of the Capital Programme
2018/19Revised
£m
2019/20Estimate
£m
2020/21Estimate
£m
2021/22Estimate
£m General Fund 15.746 7.615 5.512 3.999 HRA 17.681 22.534 9.634 9.134 Loans to RSL’s 0.000 0.000 0.000 0.000 Loans to Joint Ventures 5.000 4.000 0.000 0.000 Total Capital 38.427 34.149 15.146 13.133 Financed by: Capital receipts-General Fund
3.511 1.686 1.863 0.350
Capital receipts Housing 0.198 0.200 0.222 0.234 Capital grants 12.235 5.929 3.649 3.649 Revenue Contributions (Housing)
17.483 10.634 9.412 8.900
Total excludingborrowing
33.427 18.449 15.146 13.133
Borrowing need 5.000 15.700 0.000 0.000
Prudential Indicators and Treasury Management Strategy Report 2019/20 Audit Committee - 8 of 38 -

The Council’s Borrowing Need (the Capital Financing Requirement)
33. The second prudential indicator is the Council’s Capital Financing Requirement (CFR). The CFR is simply the total historic outstanding capital expenditure which has not yet been paid for from either revenue or capital resources. It is essentially a measure of the Council’s indebtedness and so its underlying borrowing need. Any capital expenditure above, which has not immediately been paid for through a revenue or capital resource, will increase the CFR.
34. The CFR does not increase indefinitely, as the minimum revenue provision (MRP) is a statutory annual revenue charge which broadly reduces the borrowing need in line with each asset life, and so changes the economic consumption of capital assets as they are used.
35. The CFR includes any other long-term liabilities (e.g. PFI schemes, finance leases) brought onto the balance sheet. Whilst this increases the CFR, and therefore the Council’s borrowing requirement, these types of schemes include a borrowing facility by the PFI or lease provider and so the Council is not required to separately borrow for these schemes. The Council currently has £12.653m of such schemes within the CFR.
36. The Council is asked to approve the CFR projections below:
Table 5 – CFR Projections
2018/19Revised
£m
2019/20Estimate
£m
2020/21Estimate
£m
2021/22Estimate
£m CFR – General Fund 132.238 137.238 137.238 137.238 CFR – PFI and Finance leases
12.653 11.498 10.358 9.218
CFR - housing 69.596 68.967 68.338 67.709 CFR Loans to RSL’s 100.000 100.000 100.000 100.000 CFR Loans to Joint Ventures
5.000 9.000 9.000 9.000
Total CFR 319.487 326.703 324.934 323.179 Movement in CFR 20.297 7.216 (1.769) (1.755)
MRP Policy Statement
37. The Council is required to pay off an element of the accumulated General Fund capital spend each year (the CFR) through a revenue charge (the minimum revenue provision - MRP). It is also allowed to undertake additional voluntary payments if desired (voluntary revenue provision - VRP).
38. MHCLG regulations have been issued which require the full Council to approve an MRP Statement in advance of each year. A variety of options are provided to councils, so long as there is a prudent provision.
Prudential Indicators and Treasury Management Strategy Report 2019/20 Audit Committee - 9 of 38 -

39. It is proposed that Darlington Borough Council’s MRP policy statement for 2019/20 will be:
(a) For Capital expenditure incurred before 1 April 2008 and expenditure which was granted through credit approvals since that date MRP will be calculated on an annuity basis (2%) over 50 years or the useful life of the asset.
(b) Capital Expenditure from 1 April 2008 for all unsupported borrowing MRP will be based on the estimated life of the assets, repayments will be on an annuity basis (2%)
(c) Repayments relating to the PFI scheme will be based on the life of the asset of 60 years from 1st April 2008 on an annuity basis (2%).
(d) Where MRP has been overcharged in previous years, the recovery of the overcharge will be affected by reducing the MRP charges, due in full or in part for 2019/20 and in future years, which would otherwise have been made. The MRP adjustment for 2019/20 and in future years charge will be done in such a way as to ensure that:-
the total MRP after applying the adjustment will not be less than zero in any financial year,
the cumulative amount adjusted for will never exceed the amount over-charged,
the extent of the adjustment will be reviewed on an annual basis.
40. There is no requirement on the HRA to make a minimum revenue provision but there is a requirement for a charge for depreciation to be made.
41. Repayments included in annual PFI or finance leases are applied as MRP.
Affordability Prudential Indicators
42. The previous sections cover the overall capital and control of borrowing prudential indicators, but within this framework prudential indicators are required to assess the affordability of the capital investment plans. These provide an indication of the impact of the capital investment plans on the Council’s overall finances. The Council is asked to approve the following indicators.
Estimates of the ratio of financing costs to net revenue stream.
43. This indicator identifies the trend in the cost of capital (borrowing and other long term obligation costs net of investment income) against the net revenue stream.
Prudential Indicators and Treasury Management Strategy Report 2019/20 Audit Committee - 10 of 38 -

Table 6 - Ratio of financing costs to net revenue stream
2018/19Revised
£m
2019/20Estimate
£m
2020/21Estimate
£m
2021/22Estimate
£m General Fund 3.03% 2.74% 2.98% 3.03% HRA 15.03% 17.48% 16.72% 18.15%
44. The estimates of financing costs include current commitments and the proposals in this year’s MTFP report.
Treasury Management Strategy
Borrowing
45. The capital expenditure plans set out in the previous paragraphs provide details of the service activity of the Council. The treasury management function ensures that the Council’s cash is organised in accordance with the the relevant professional codes, so that sufficient cash is available to meet this service activity and the Council’s capital strategy. This will involve both the organisation of the cash flow and, where capital plans require, the organisation of approporiate borrowing facilities. The strategy covers the relevant treasury / prudential indicators, the current and projected debt positions and the annual investment strategy.
Under Borrowing position
46. Over the last ten years the Council had maintained an underborrowed position i.e. the amount of our gross external borrowing has been less than our balance sheet Capital Financing Requirement. This strategy has served the Council well in a period where returns on investment have been low and borrowing costs have been relatively high. This has also meant that we have had less in the form of investments and so reduced counterparty risk. To support the MTFP for 2017/18 and onwards it was agreed that longer term investments would be pursued. These would give a return over and above the cost of any additional borrowing that would be taken. Following due diligence the Council has now invested in 3 Property Funds, £10 million in each fund and these are expected to bring a net return of around 2.5% over the life of the MTFP. Additional borrowing of £25m has been undertaken which has resulted in the underborrowed position being reduced.
Current Portfolio Position
47. The Council’s expected treasury portfolio position at 31 March 2019, with forward projections are summarised below at Table 7. The table shows the actual external debt (the treasury management operations), against the underlying capital borrowing need (the Capital Financing Requirement - CFR), highlighting any over or under borrowing.
Prudential Indicators and Treasury Management Strategy Report 2019/20 Audit Committee - 11 of 38 -
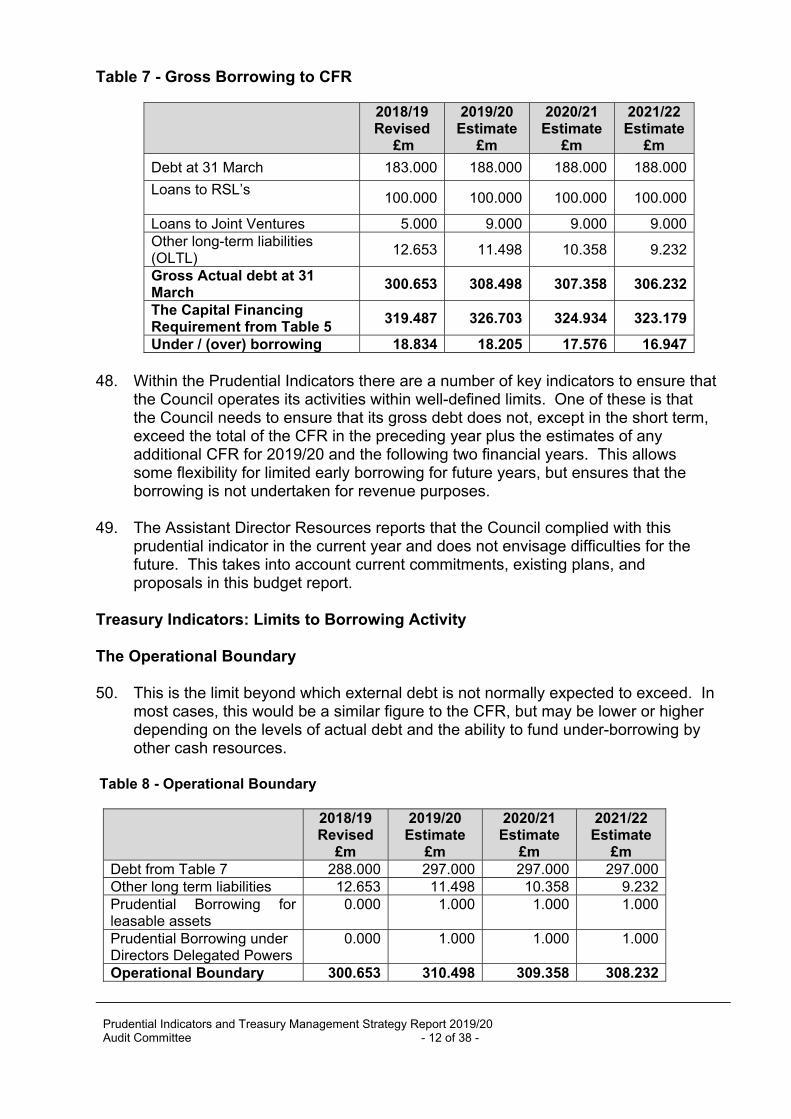
Table 7 - Gross Borrowing to CFR
2018/19Revised
£m
2019/20Estimate
£m
2020/21Estimate
£m
2021/22Estimate
£m
Debt at 31 March 183.000 188.000 188.000 188.000
Loans to RSL’s 100.000 100.000 100.000 100.000
Loans to Joint Ventures 5.000 9.000 9.000 9.000 Other long-term liabilities (OLTL)
12.653 11.498 10.358 9.232
Gross Actual debt at 31 March
300.653 308.498 307.358 306.232
The Capital FinancingRequirement from Table 5
319.487 326.703 324.934 323.179
Under / (over) borrowing 18.834 18.205 17.576 16.947
48. Within the Prudential Indicators there are a number of key indicators to ensure that the Council operates its activities within well-defined limits. One of these is that the Council needs to ensure that its gross debt does not, except in the short term, exceed the total of the CFR in the preceding year plus the estimates of any additional CFR for 2019/20 and the following two financial years. This allows some flexibility for limited early borrowing for future years, but ensures that the borrowing is not undertaken for revenue purposes.
49. The Assistant Director Resources reports that the Council complied with this prudential indicator in the current year and does not envisage difficulties for the future. This takes into account current commitments, existing plans, and proposals in this budget report.
Treasury Indicators: Limits to Borrowing Activity
The Operational Boundary
50. This is the limit beyond which external debt is not normally expected to exceed. In most cases, this would be a similar figure to the CFR, but may be lower or higher depending on the levels of actual debt and the ability to fund under-borrowing by other cash resources.
Table 8 - Operational Boundary
2018/19Revised
£m
2019/20Estimate
£m
2020/21Estimate
£m
2021/22Estimate
£m Debt from Table 7 288.000 297.000 297.000 297.000 Other long term liabilities 12.653 11.498 10.358 9.232 Prudential Borrowing for leasable assets
0.000 1.000 1.000 1.000
Prudential Borrowing under Directors Delegated Powers
0.000 1.000 1.000 1.000
Operational Boundary 300.653 310.498 309.358 308.232
Prudential Indicators and Treasury Management Strategy Report 2019/20 Audit Committee - 12 of 38 -

The Authorised Limit for external debt
51. This is a key prudential indicator and represents a control on the maximum level of borrowing. This represents a legal limit beyond which external debt is prohibited, and this limit needs to be set or revised by full Council. It reflects the level of external debt which, while not desired, could be afforded in the short term, but is not sustainable in the longer term:
52. This is the statutory limit determined under section 3 (1) of the Local Government Act 2003. The Government retains an option to control either the total of all councils’ plans, or those of a specific council, although this power has not yet been exercised.
53. The Council is asked to approve the following Authorised Limit:
Table 9 – Authorised Limit
2018/19Revised
£m
2019/20Estimate
£m
2020/21Estimate
£m
2021/22Estimate
£m
Operational Boundary 300.653 310.498 309.358 308.232 Additional Headroom 5% 15.033 15.525 15.468 15.412 Authorised Limit 315.686 326.023 324.826 323.644
54. It is proposed that the additional headroom for years 2019/20 to 2021/22 is 5% above the operational boundary this would allow for any additional cashflow needs throughout the years.
55. Separately, the Council is also limited to a maximum HRA CFR through the HRA self-financing regime. This limit is currently £74.394m and is included within both the Operational Boundary and the Authorised Limit:
Table 10 – HRA Debt Limit
2018/19Revised
£m
2019/20Estimate
£m
2020/21Estimate
£m
2021/22Estimate
£m HRA debt cap * 74.394 74.394 74.394 74.394
HRA CFR 69.596 68.967 68.338 67.709 HRA Headroom 4.798 5.427 6.056 6.685
*Note - Abolition of HRA debt cap. In October 2018, the Prime Minister anounced a policy change of abolition of the HRA debt cap and the applicable date was 29.10.2018.
Prospects for Interest Rates
56. The Council has appointed Link Asset Services as its treasury advisor and part of their service is to assist the Council to formulate a view on interest rates. The
Prudential Indicators and Treasury Management Strategy Report 2019/20 Audit Committee - 13 of 38 -

following table gives Link Asset Services’s central view for future interest rates and the economic background to that view is shown at Appendix 1.
Table 11
Annual Average
%
Bank Rate %
PWLB Borrowing Rates %(including *certainty rate adjustment)
5 year 10 year 25 year 50 year Mar 2019 0.75 1.90 2.30 2.70 2.50 Jun 2019 1.00 2.00 2.40 2.80 2.60 Sep 2019 1.00 2.00 2.40 2.90 2.70 Dec 2019 1.00 2.10 2.50 2.90 2.70 Mar 2020 1.25 2.10 2.60 3.00 2.80 Jun 2020 1.25 2.20 2.70 3.10 2.90 Sep 2020 1.25 2.30 2.70 3.10 2.90 Dec 2020 1.50 2.30 2.80 3.20 3.00 Mar 2021 1.50 2.40 2.80 3.20 3.00 Jun 2021 1.75 2.40 2.90 3.30 3.10 Sep 2021 1.75 2.50 2.90 3.30 3.10 Dec 2021 1.75 2.60 3.00 3.40 3.20 Mar 2022 2.00 2.60 3.00 3.40 3.20
* The certainty rate adjustment is a reduced rate by 0.20% for those councils like Darlington Borough Council who have submitted more detail on future borrowing requirement to the Treasury
Investment and borrowing rates
57. Investment returns are likely to remain low during 2019/20 but on a gently rising trend over the next few years.
58. Borrowing interest rates have been volatile so far in 2018/19 and whilst they were on a rising trend during the first half of the year, they have back tracked since then until early January. The policy of avoiding new borrowing by running down spare cash balances has served well over the last few years. However, this needs to be carefully reviewed to avoid incurring higher borrowing costs in the future when the Council may not be able to avoid new borrowing to finance capital expenditure and/or the refinancing of maturing debt.
59. There will remain a cost of carry, (the difference between higher borrowing costs and lower investment returns), to any new long-term borrowing that causes a temporary increase in cash balances as this position will, most likely, incur a revenue cost.
Borrowing Strategy
60. The Council is currently maintaining an under-borrowed position although this has reduced from previous years. This means that the capital borrowing need (the Capital Financing Requirement), has not been fully funded with loan debt as cash
Prudential Indicators and Treasury Management Strategy Report 2019/20 Audit Committee - 14 of 38 -

supporting the Council’s reserves, balances and cash flow has been used as a temporary measure. This strategy is prudent as investment returns are low and counterparty risk is still an issue to be considered.
61. Against this background and the risks within the economic forecast, caution will be adopted with the 2019/20 treasury operations. The Assistant Director Resources will monitor interest rates in financial markets and adopt a pragmatic approach to changing circumstances:
(a) If it was felt that there was a significant risk of a sharp FALL in long and short term rates (eg due to a marked increase of risks around relapse into recession or of risks of deflation), then long term borrowings will be postponed, and potential rescheduling from fixed rate funding into short term borrowing will be considered.
(b) If it was felt that there was a significant risk of a much sharper RISE in long and short term rates than that currently forecast, perhaps arising from an acceleration in the rate of increase in central rates in the USA and UK, an increase in world econonmic activity or a sudden increase in inflation risks, then the portfolio position will be re-appraised. Most likely, fixed rate funding will be drawn whilst interest rates are lower than they are projected to be in the next few years.
Treasury Management Limits on Activity
62. There are three debt related treasury activity limits. The purpose of these are to restrain the activity of the treasury function within certain limits, thereby managing risk and reducing the impact of any adverse movement in interest rates. However, if these are set to be too restrictive they will impair the opportunities to reduce costs/improve performance. The indicators are:
(a) Upper limits on variable interest rate exposure. This identifies a maximum limit for variable interest rates based upon the debt position net of investments
(b) Upper limits on fixed interest rate exposure. This is similar to the previous indicator and covers a maximum limit on fixed interest rates;
(c) Maturity structure of borrowing. These gross limits are set to reduce the Council’s exposure to large fixed rate sums falling due for refinancing, and are required for upper and lower limits. The Council is asked to approve the following treasury indicators and limits:
Prudential Indicators and Treasury Management Strategy Report 2019/20 Audit Committee - 15 of 38 -

Table 12 Interest Rate Exposure
2019/20 2020/21 2021/22 Upper Upper Upper
Limits on fixed interest rates based on net debt
100% 100% 100%
Limits on variable interest rates based on net debt
40% 40% 40%
Maturity Structure of fixed interest rate borrowing 2019/20 Lower Upper
Under 12 months 0% 40%
12 months to 2 years 0% 50% 2 years to 5 years 0% 60% 5 years to 10 years 0% 80% 10 years and above 0% 100%
Policy on Borrowing in Advance of Need
63. The CFR Determines the Council’s need to borrow. Any decision to borrow in advance of need will be within forward approved Capital Financing Requirement estimates, and will be considered carefully to ensure that value for money can be demonstrated and that the Council can ensure the security of such funds through its investment strategy.
64. Risks associated with any borrowing in advance activity will be subject to prior appraisal and subsequent reporting through the mid-year or annual reporting mechanism.
Debt Rescheduling
65. As short-term borrowing rates will be considerably cheaper than longer term fixed interest rates, there may be potential opportunities to generate savings by switching from long-term debt to short-term debt. However, these savings will need to be considered in the light of the current treasury position and the size of the cost of debt repayment (premiums incurred).
66. The reasons for any rescheduling to take place will include:
(a) the generation of cash savings and / or discounted cash flow savings;
(b) helping to fulfil the treasury strategy;
(c) enhance the balance of the portfolio (amend the maturity profile and/or the balance of volatility).
67. Consideration will also be given to identify if there is any residual potential for making savings by running down investment balances to repay debt prematurely
Prudential Indicators and Treasury Management Strategy Report 2019/20 Audit Committee - 16 of 38 -

as short term rates on investments are likely to be lower than rates paid on current debt.
68. All rescheduling will be reported to Committee at the earliest meeting following its action.
69. An opportunity arose in December 2018 to repay 2 of the Council’s Lender Option Borrower Options (LOBO’s) loans early and even taking account of the associated premium for early settlement the savings to the Council in cash terms are £26.740m over the remaining 42 years and £12.658m at discounted rates.
Municipal Bond Agency
70. It is possible that the Municipal Bond Agency will be offering loans to local authorities in the future. The Agency hopes that the borrowing rates will be lower than those offered by the Public Works loans Board (PWLB). This Council may make use of this new source of borrowing as and when appropriate.
Annual Investment Strategy
Investment and Creditworthiness Policy
71. The MHCLG and CIPFA have extended the meaning of ‘investments’ to include both financial and non-financial investments. This report deals soley with financial investments, and non-financial investments, essentially the purchase of income yielding assets, are covered in the Capital Strategy.
72. The Council’s investment policy has regard to the following:
(a) MHCLG’s Guidance on Local Government Investments (“the Guidance”) (b) CIPFA Treasury Management in Public Services Code of Practice and
Cross Sectoral Guidance Notes 2017 (“the CIPFA TM Code”) (c) CIPFA Treasury Management Guidance Notes 2018
73. The Council’s investment priorities will be security first, liquidity second and then yield (return).
74. In accordance with the above guidance from MHCLG and CIPFA, and in order to minimise the risk to investments, the Council applies minimum acceptable credit criteria in order to generate a list of highly creditworthy counterparties which enables diversification and thus avoidance of concentration risk. The key ratings used to monitor counterparties are the short term and long-term ratings.
75. Further, the Council’s officers recognise that ratings should not be the sole determinant of the quality of an institution and that it is important to continually assess and monitor the financial sector on both a micro and macro basis and in relation to the economic and political environments in which institutions operate. The assessment will also take account of information that reflects the opinion of the markets. To achieve this the Council will engage with its advisors to maintain a monitor on market pricing such as “Credit Default Swaps” and overlay that
Prudential Indicators and Treasury Management Strategy Report 2019/20 Audit Committee - 17 of 38 -

information on top of the credit ratings. This is encapsulated within the credit methodology provided by the advisors, Link Asset Services.
76. Other information sources used will include the financial press, share price and other such information pertaining to the banking sector in order to establish the most robust scrutiny process on the suitability of potential investment counterparties.
77. The intention of the strategy is to provide security of investment and minimisation of risk.
78. Investment instruments identified for use in the financial year are listed in Appendix 2 under the ‘Specified’ and ‘Non-Specified’ Investments categories. Counterparty limits will be as set through the Council’s Treasury Management Practices – Schedules.
(a) Specified investments are those with a high level of credit quality and subject to a maturity limit of one year.
(b) Non-specified investments are those with less high credit quality, may be for periods in excess of one year, and/or are more complex instruments which require greater consideration by Members and officers before being authorised for use.
Investment Counterparty Selection Criteria
79. The primary principle governing the Council’s investment criteria is the security of its investments, although the yield or return on the investment is also a key consideration. After this main principle the Council will ensure that:
(a) It maintains a policy covering both the categories of investment types it will invest in, criteria for choosing investment counterparties with adequate security, and monitoring their security. This is set out in the Specified and Non-Specified investment sections below; and
(b) It has sufficient liquidity in its investments. For this purpose it will set out procedures for determining the maximum periods for which funds may prudently be committed. These procedures also apply to the Council’s prudential indicators covering the maximum principal sums invested.
80. The Assistant Director Resources will maintain a counterparty list in compliance with the following criteria and will revise the criteria and submit them to Council for approval as necessary. These criteria are separate to that which determines which types of investment instrument are either Specified or Non-Specified (See appendix 2 for definitions) as it provides an overall pool of counterparties considered high quality which the Council may use, rather than defining what types of investment instruments are to be used.
81. The rating criteria use the lowest common denominator method of selecting counterparties and applying limits. This means that the application of the Council’s minimum criteria will apply to the lowest available rating for any
Prudential Indicators and Treasury Management Strategy Report 2019/20 Audit Committee - 18 of 38 -
institution. For instance, if an institution is rated by two agencies, one meets the Council’s criteria, the other does not, the institution will fall outside the lending criteria. This is in compliance with a CIPFA Treasury Management Panel recommendation in March 2009 and the CIPFA Treasury Management Code of Practice.
82. Credit rating information is supplied by Link Asset Services, our treasury advisors, on all active counterparties that comply with the criteria below. Any counterparty failing to meet the criteria would be omitted from the counterparty (dealing) list. Any rating changes, rating watches (notification of a likely change), rating Outlooks (notification of a longer term bias outside the central rating view) are provided to officers almost immediately after they occur and this information is considered before dealing. For instance, a negative rating watch applying to a counterparty at the minimum Council criteria will be suspended from use, with all others being reviewed in light of market conditions.
83. Any investment in Property Funds/ Corporate Bond Funds/ Asset Backed Investment Products will be subject to due diligence for each and every fund considered. The maximum amount invested in any one fund will be £20million with a maximum of £50million total for all funds.
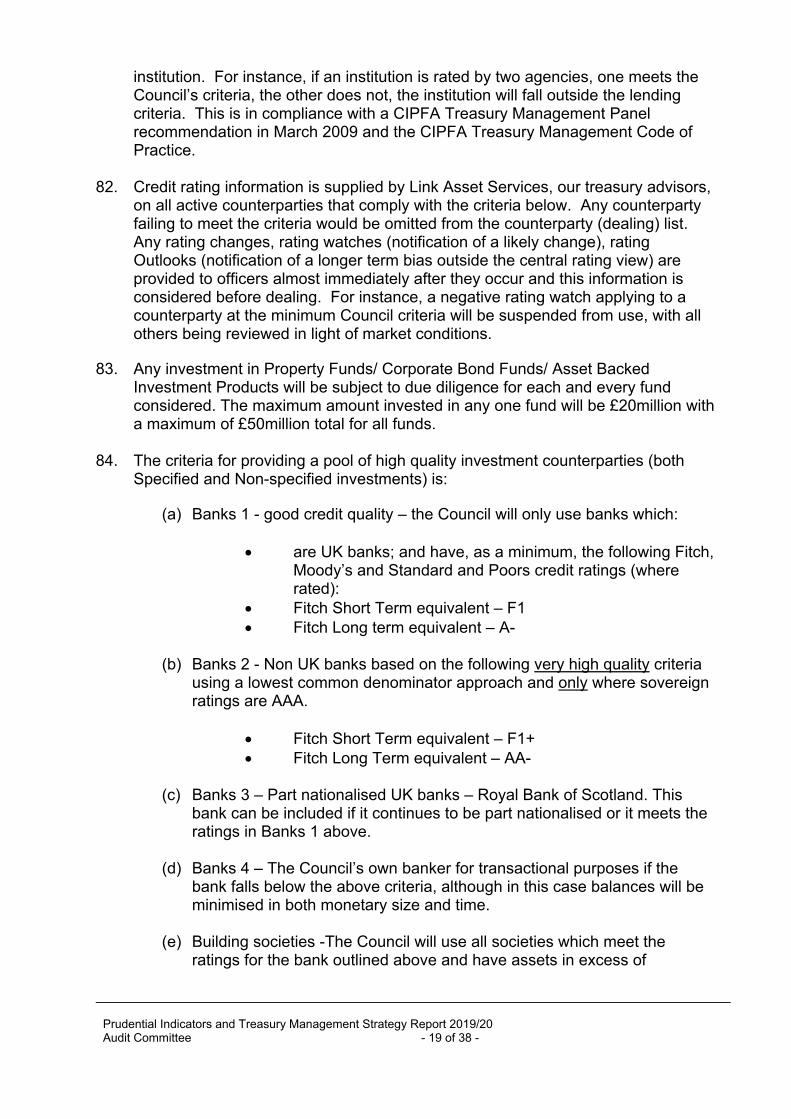
84. The criteria for providing a pool of high quality investment counterparties (both Specified and Non-specified investments) is:
(a) Banks 1 - good credit quality – the Council will only use banks which:
are UK banks; and have, as a minimum, the following Fitch, Moody’s and Standard and Poors credit ratings (where rated):
Fitch Short Term equivalent – F1 Fitch Long term equivalent – A-
(b) Banks 2 - Non UK banks based on the following very high quality criteria using a lowest common denominator approach and only where sovereign ratings are AAA.
Fitch Short Term equivalent – F1+ Fitch Long Term equivalent – AA-
(c) Banks 3 – Part nationalised UK banks – Royal Bank of Scotland. This bank can be included if it continues to be part nationalised or it meets the ratings in Banks 1 above.
(d) Banks 4 – The Council’s own banker for transactional purposes if the bank falls below the above criteria, although in this case balances will be minimised in both monetary size and time.
(e) Building societies -The Council will use all societies which meet the ratings for the bank outlined above and have assets in excess of
Prudential Indicators and Treasury Management Strategy Report 2019/20 Audit Committee - 19 of 38 -

£1,000m.
(f) Money Market Funds (MMFs) CNAV AAA (g) Money Market Funds (MMF’s) LNVAV AAA (h) Money Market Funds (MMF’s) VNAV AAA
(i) Ultra-Short Dated Bond Funds AAA
(j) UK Government (including gilts, Treasury Bills and the Debt Management Office)
(k) Local authorities, parish councils etc
(l) Supranational institutions
(m) Housing associations
(n) Property Funds, Corporate Bond Funds and Asset Backed Investment Products.
85. A limit of £50m will be applied to the use of Non-Specified investments.
Use of additional information other than credit ratings
86. Additional requirements under the Code require the Council to supplement credit rating information. Whilst the above criteria relies primarily on the application of credit ratings to provide a pool of appropriate counterparties for officers to use, additional operational market information will be applied before making any specific investment decision from the agreed pool of counterparties. This additional market information (for example Credit Default Swaps, negative rating watches/outlooks) will be applied to compare the relative security of differing investment counterparties.
Time and monetary limits applying to investments.
87. The time and monetary limits for institutions on the Council’s counterparty list are as follows (these will cover both Specified and Non-Specified Investments)
88. In order to determine time limits for investments the Council applies the creditworthiness service provided by Link Asset Services. This service employs a sophisticated modelling approach utlilising credit ratings from the three main credit rating agencies - Fitch, Moodys and Standard and Poors. The credit ratings of counterparties are supplemented with the following overlays:
(a) credit watches and credit outlooks from credit rating agencies;
(b) Credit Default Swap price spreads to give early warning of likely changes in credit ratings;
Prudential Indicators and Treasury Management Strategy Report 2019/20 Audit Committee - 20 of 38 -

(c) sovereign ratings to select counterparties from only the most creditworthy countries.
89. The Council will therefore use the following durational bands when applying time limits to investments
(a) Yellow Maximum 2 years *This only relates to AAA rated government debt or its equivalent
(b) Purple Maximum 2 years (c) Blue 1 year (only applies to nationalised or semi nationalised UK
Banks) (d) Orange 1 year (e) Red 6 months (f) Green 3 months
Table 13 – Time and monetary limits applying to investments
Fitch Long term Rating
(or equivalent)
Money Limit
Time Limit
Banks 1 category high quality AA- £5m
Maximum of 2 years Suggested duration using Link Asset Services colour coding (CDS adjusted with
manual override)
Banks 1 category medium quality A £4m
Maximum of 1 year Suggested duration using Link Asset Services colour coding (CDS adjusted with
manual override)
Banks 1 category lower quality A- £3m
Maximum of 1 year Suggested duration using Link Asset Services colour coding (CDS adjusted with
manual override)
Banks 2 Non UK (Only where sovereign ratings are AAA)
AA- £3m
Maximum of 1 year Suggested duration using Link Asset Services colour coding (CDS adjusted with
manual override)
Banks 3 category – part nationalised N/A £5m Maximum of 1 years
Banks 4 category – Council’s banker (not meeting Banks 1, 2 and 3)
£3m 1 day
DMADF (Debt Management Office) AAA unlimited 6 months
UK Government Treasury Bills UK sovereign
rating unlimited Maximum of 1 year
Local authorities N/A £5m per
Local Authority
Up to 2 years
Prudential Indicators and Treasury Management Strategy Report 2019/20 Audit Committee - 21 of 38 -

Money market Funds (CNAV, LVNAV & VNAV) and Ultra Short Dated Bond Funds
AAA £5m per
Fund liquid
Property Funds, Corporate Bond Funds and other Asset backed Investment products
Non Rated Due Diligence required
£20m per Fund
10 years
90. In addition to sterling deposits either on a fixed term call or notice basis deposits in banks or Building Societies which meet our criteria, may be made via certificates of deposits where appropriate.
91. The proposed criteria for Specified and Non-Specified investments are shown in Appendix 2 for approval.
92. All credit ratings will be monitored daily. The Council is alerted to changes to ratings of all three agencies through its use of the Link Asset Services creditworthiness service.
(a) if a downgrade results in the counterparty / investment scheme no longer meeting the Council’s minimum criteria, its further use as a new investment will be withdrawn immediately.
(b) in addition to the use of credit ratings the Council will be advised of information in movements in Credit Default Swap against the iTraxx benchmark and other market data on a weekly basis. Extreme market movements may result in downgrade of an institution or removal from the Council’s lending list.
93. Sole reliance will not be placed on the use of this external service. In addition this Council will also use market data and market information, information on government support for banks and the credit ratings of that government support.
Investment Strategy
In-house funds
94. Investments will be made with reference to the core balance and cash flow requirements and the outlook for short-term interest rates (i.e. rates for investments up to 12 months). Greater returns are usually obtainable by investing for longer periods. While most balances are required in order to manage the ups and downs of cash flow, where cash sums can be identified that could be invested for longer periods, the value to be obtained from longer term investments will be carefully assessed.
If it is thought that Bank Rate is likely to rise significantly within the time horizon being considered, then consideration will be given to keeping the most investments as being short term or variable.
Conversely, if it is thought that Bank Rate is likely to fall within that time period, consideration will be given to locking in higher rates currently obtainable, for longer periods.
Prudential Indicators and Treasury Management Strategy Report 2019/20 Audit Committee - 22 of 38 -

Investment returns expectations
95. On the assumption that the UK and EU agree a Brexit deal in spring 2019, then Bank Rate is forecast to increase steadily but slowly over the next few years to reach 2.00% by quarter 1 2022. Bank Rate forecasts for financial year ends (March) are:
(a) 2018/19 0.75% (b) 2019/20 1.25% (c) 2020/21 1.50% (d) 2021/22 2.00%
96. The suggested budgeted investment earnings rates for returns on investments placed for periods up to about 3 months during each financial year are as follows:-
(a) 2018/19 0.75% (b) 2019/20 1.00% (c) 2020/21 1.50% (d) 2021/22 1.75% (e) 2022/23 1.75% (f) 2023/24 2.00% (g) Later years 2.50%
97. The overall balance of risks to economic growth in the UK is probably neutral.
98. The balance of risks to increases in Bank Rate and shorter term PWLB rates are probably also even and are dependent on how strong GDP growth turns out, how slowly inflation pressures subside, and how quickly the Brexit negotiations move forward positively.
Investment treasury indicator and limit
99. Total principal funds invested for greater than 365 days. These limits are set with regard to the Council’s liquidity requirements and to reduce the need for early sale of an investment, and are based on the availability of funds after each year-end.
100. The Council is asked to approve the treasury indicator and limit: -
Table 14 – Maximum Principal sums invested
2019/20 2020/21 2021/22 Principal sums invested greater than 365 days
£50m £50m £50m
101. For its cash flow generated balances, the Council will seek to utilise its instant access accounts, 15 and 30 day notice accounts, money market funds and short-dated deposits (overnight to three months) in order to benefit from the compounding of interest.
Prudential Indicators and Treasury Management Strategy Report 2019/20 Audit Committee - 23 of 38 -

Investment Risk Benchmarking
102. These benchmarks are simple guides to maximum risk, so they may be breached from time to time, depending on movements in interest rates and counterparty criteria. They relate to Investments that are not Property Funds. The purpose of the benchmark is that officers will monitor the current and trend position and amend the operational strategy to manage risk as conditions change. Any breach of the benchmarks will be reported, with supporting reasons in the Mid-Year or Annual Report.
103. Security - The Council’s maximum security risk benchmark for the current portfolio, when compared to these historic default tables, is:
0.077% historic risk of default when compared to the whole portfolio.
104. Liquidity – in respect of this area the Council seeks to maintain:
(a) Bank overdraft - £0.100m
(b) Liquid short term deposits of at least £3.000m available with a week’s notice
(c) Weighted Average Life benchmark is expected to be 1 year.
105. Yield - local measures of yield benchmarks are:
(a) Investments – Short Term- cashflow investment rate returned against comparative interest rates
(b) Investments – Longer term – capital investment rates returned against comparative average rates
106. And in addition that the security benchmark for each individual year is:
Table 15 - Security Benchmark
1 year 2 years Maximum 0.077% 0.077%
Note: This benchmark is an average risk of default measure, and would not constitute an expectation of loss against a particular investment.
107. The above reported benchmarks for Security Liquidity and Yield all relate to Deposits with Banks and Money Market Funds but would not relate to Property Funds.
108. It is proposed that property funds will be benchmarked for performance against the IPD All Balanced Fund index which is the universe of all property funds, data for this can be provided by our Treasury Management advisors Link Asset Services.
Prudential Indicators and Treasury Management Strategy Report 2019/20 Audit Committee - 24 of 38 -

End of year investment report
109. At the end of the financial year, the Council will report on its investment activity as part of its Annual Treasury Report.
Policy on the use of external service providers
110. The Council uses Link Asset Services as its external treasury management advisors. The company provides a range of services which include:
(a) Technical support on treasury matters, capital finance issues and the drafting of Member reports;
(b) Economic and interest rate analysis;
(c) Debt services which includes advice on the timing of borrowing;
(d) Debt rescheduling advice surrounding the existing portfolio;
(e) Generic investment advice on interest rates, timing and investment instruments;
(f) Credit ratings from the three main rating agencies and other market information on counterparties.
111. The Council recognises that responsibility for treasury management decisions remains with the organisation at all times and will ensure that undue reliance is not placed upon our external service providers.
112. It also recognises that there is value in employing external providers of treasury management services in order to acquire access to specialist skills and resources. The Council will ensure that the terms of their appointment and the methods by which their value will be assessed are properly agreed and documented, and subjected to regular review.
Outcome of Consultation
113. No consultation was undertaken in the production of this report.
Prudential Indicators and Treasury Management Strategy Report 2019/20 Audit Committee - 25 of 38 -

APPENDIX 1 Economic Background provided by Link Asset Services
1. GLOBAL OUTLOOK. World growth has been doing reasonably well, aided by strong growth in the US. However, US growth is likely to fall back in 2019 and together with weakening economic activity in China and the eurozone, overall world growth is likely to weaken.
2. Inflation has been weak during 2018 but, at long last, unemployment falling to remarkably low levels in the US and UK has led to a marked acceleration of wage inflation. The US Fed has therefore increased rates nine times and the Bank of England twice. However, the ECB is unlikely to start raising rates until late in 2019 at the earliest.
3. KEY RISKS - central bank monetary policy measures Looking back on nearly ten years since the financial crash of 2008 when liquidity suddenly dried up in financial markets, it can be assessed that central banks’ monetary policy measures to counter the sharp world recession were successful. The key monetary policy measures they used were a combination of lowering central interest rates and flooding financial markets with liquidity, particularly through unconventional means such as Quantitative Easing (QE), where central banks bought large amounts of central government debt and smaller sums of other debt.
4. The key issue now is that that period of stimulating economic recovery and warding off the threat of deflation is coming towards its close. A new period is well advanced in the US, and started more recently in the UK, of reversing those measures i.e. by raising central rates and (for the US) reducing central banks’ holdings of government and other debt. These measures are now required in order to stop the trend of a reduction in spare capacity in the economy, and of unemployment falling to such low levels that the re-emergence of inflation is viewed as a major risk. It is, therefore, crucial that central banks get their timing right and do not cause shocks to market expectations that could destabilise financial markets. In particular, a key risk is that because QE-driven purchases of bonds drove up the price of government debt, and therefore caused a sharp drop in income yields, this also encouraged investors into a search for yield and into investing in riskier assets such as equities. Consequently, prices in both bond and equity markets rose to historically high valuation levels simultaneously. This meant that both asset categories were exposed to the risk of a sharp downward correction and we have indeed, seen a sharp fall in equity values in the last quarter of 2018. It is important, therefore, that central banks only gradually unwind their holdings of bonds in order to prevent destabilising the financial markets. It is also likely that the timeframe for central banks unwinding their holdings of QE debt purchases will be over several years. They need to balance their timing to neither squash economic recovery, by taking too rapid and too strong action, or, conversely, let inflation run away by taking action that was too slow and/or too weak. The potential for central banks to get this timing and strength of action wrong are now key risks. At the time of writing, (early January 2019), financial markets are very concerned that the Fed is being too aggressive with its policy for raising interest rates and was likely to cause a recession in the US economy
Prudential Indicators and Treasury Management Strategy Report 2019/20 Audit Committee - 26 of 38 -

5. The world economy also needs to adjust to a sharp change in liquidity creation over the last five years where the US has moved from boosting liquidity by QE purchases, to reducing its holdings of debt, (currently about $50bn per month). In addition, the European Central Bank ended QE purchases in December 2018.
6. UK. The flow of positive economic statistics since the end of the first quarter of 2018 has shown that pessimism was overdone about the poor growth in quarter 1 when adverse weather caused a temporary downward blip. Quarter 1 at 0.1% growth in GDP was followed by a return to 0.4% in quarter 2 and by a strong performance in quarter 3 of +0.6%. However, growth in quarter 4 is expected to weaken significantly.
7. At their November quarterly inflation meeting, the MPC repeated their well-worn phrase that future Bank Rate increases would be gradual and would rise to a much lower equilibrium rate, (where monetary policy is neither expansionary of contractionary), than before the crash; indeed they gave a figure for this of around 2.5% in ten years time but declined to give a medium term forecast. However, with so much uncertainty around Brexit, they warned that the next move could be up or down, even if there was a disorderly Brexit. While it would be expected that Bank Rate could be cut if there was a significant fall in GDP growth as a result of a disorderly Brexit, so as to provide a stimulus to growth, they warned they could also raise Bank Rate in the same scenario if there was a boost to inflation from a devaluation of sterling, increases in import prices and more expensive goods produced in the UK replacing cheaper goods previously imported, and so on. In addition, the Chancellor could potentially provide fiscal stimulus to support economic growth, though at the cost of increasing the budget deficit above currently projected levels.
8. It is unlikely that the MPC would increase Bank Rate in February 2019, ahead of the deadline in March for Brexit. Getting parliamentary approval for a Brexit agreement on both sides of the Channel will take well into spring 2019. However, in view of the hawkish stance of the MPC at their November meeting, the next increase in Bank Rate is now forecast to be in May 2019 (on the assumption that a Brexit deal is agreed by both the UK and the EU). The following increases are then forecast to be in February and November 2020 before ending up at 2.0% in February 2022.
9. Inflation. The Consumer Price Index (CPI) measure of inflation has been falling from a peak of 3.1% in November 2017 to 2.3% in November 2018. In the November Bank of England quarterly inflation report, inflation was forecast to still be marginally above its 2% inflation target two years ahead, (at about 2.1%), given a scenario of minimal increases in Bank Rate. This inflation forecast is likely to be amended upwards due to the Bank’s report being produced prior to the Chancellor’s announcement of a significant fiscal stimulus in the Budget; this is likely to add 0.3% to GDP growth at a time when there is little spare capacity left in the economy, particularly of labour.
10. As for the labour market figures in October 2018, unemployment at 4.1% was marginally above a 43 year low of 4% on the Independent Labour Organisation measure. A combination of job vacancies hitting an all-time high in July, together with negligible growth in total employment numbers, indicates that employers are now having major difficulties filling job vacancies with suitable staff. It was therefore
Prudential Indicators and Treasury Management Strategy Report 2019/20 Audit Committee - 27 of 38 -

unsurprising that wage inflation picked up to 3.3%, (3 month average regular pay, excluding bonuses). This meant that in real terms, (i.e. wage rates less CPI inflation), earnings are currently growing by about 1.0%, the highest level since 2009. This increase in household spending power is likely to feed through into providing some support to the overall rate of economic growth in the coming months. This tends to confirm that the MPC was right to start on a cautious increase in Bank Rate in August as it views wage inflation in excess of 3% as increasing inflationary pressures within the UK economy.
11. In the political arena, there is a risk that the current Conservative minority government may be unable to muster a majority in the Commons over Brexit. However, our central position is that Prime Minister May’s government will endure, despite various setbacks, along the route to reaching an orderly Brexit in March 2019. If, however, the UK faces a general election in the next 12 months, this could result in a potential loosening of monetary and fiscal policy and therefore medium to longer dated gilt yields could rise on the expectation of a weak pound and concerns around inflation picking up.
12. USA. President Trump’s massive easing of fiscal policy is fuelling a, (temporary), boost in consumption which has generated an upturn in the rate of strong growth which rose from 2.2%, (annualised rate), in quarter 1 to 4.2% in quarter 2 and 3.5%, (3.0% y/y), in quarter 3, but also an upturn in inflationary pressures. The strong growth in employment numbers and the reduction in the unemployment rate to 3.9%, near to a recent 49 year low, has fed through to an upturn in wage inflation which hit 3.2% in November, however, CPI inflation overall fell to 2.2% in November and looks to be on a falling trend to drop below the Fed’s target of 2% during 2019. The Fed has continued on its series of increases in interest rates with another 0.25% increase in December to between 2.25% and 2.50%, this being the fifth increase in 2018 and the ninth in this cycle. However, they did also reduce their forecast for further increases from three to two. This latest increase compounded investor fears that the Fed is over doing the rate and level of increases in rates and that it is going to cause a US recession as a result. There is also much evidence in previous monetary policy cycles, of the Fed’s series of increases doing exactly that. Consequently, we have seen stock markets around the world plunging under the weight of fears around the Fed’s actions, the trade war between the US and China, an expectation that world growth will slow, Brexit etc.
13. The tariff war between the US and China has been generating a lot of heat during 2018, but it is not expected that the current level of actual action would have much in the way of a significant effect on US or world growth. However, there is a risk of escalation if an agreement is not reached soon between the US and China. The results of the mid-term elections are not expected to have a material effect on the economy.
14. Eurozone. Growth was 0.4% in quarters 1 and 2 but fell back to 0.2% in quarter 3, though this was probably just a temporary dip. In particular, data from Germany has been mixed and it could be negatively impacted by US tariffs on a significant part of manufacturing exports e.g. cars. For that reason, although growth is still expected to be in the region of nearly 2% for 2018, the horizon is less clear than it seemed just a short while ago. Having halved its quantitative easing purchases of debt in October
Prudential Indicators and Treasury Management Strategy Report 2019/20 Audit Committee - 28 of 38 -

2018 to €15bn per month, the European Central Bank ended all further purchases in December 2018. The ECB is forecasting inflation to be a little below its 2% top limit through the next three years so it may find it difficult to warrant a start on raising rates by the end of 2019 if the growth rate of the EU economy is on a weakening trend.
15. China. Economic growth has been weakening over successive years, despite repeated rounds of central bank stimulus; medium term risks are increasing. Major progress still needs to be made to eliminate excess industrial capacity and the stock of unsold property, and to address the level of non-performing loans in the banking and credit systems. Progress has been made in reducing the rate of credit creation, particularly from the shadow banking sector, which is feeding through into lower economic growth. There are concerns that official economic statistics are inflating the published rate of growth.
16. Japan - has been struggling to stimulate consistent significant GDP growth and to get inflation up to its target of 2%, despite huge monetary and fiscal stimulus. It is also making little progress on fundamental reform of the economy. It is likely that loose monetary policy will endure for some years yet to try to stimulate growth and modest inflation.
17. Emerging countries. Argentina and Turkey are currently experiencing major headwinds and are facing challenges in external financing requirements well in excess of their reserves of foreign exchange. However, these countries are small in terms of the overall world economy, (around 1% each), so the fallout from the expected recessions in these countries will be minimal.
INTEREST RATE FORECASTS
18. The interest rate forecasts provided by Link Asset Services in paragraph 3.2 are predicated on an assumption of an agreement being reached on Brexit between the UK and the EU. In the event of an orderly non-agreement exit, it is likely that the Bank of England would take action to cut Bank Rate from 0.75% in order to help economic growth deal with the adverse effects of this situation. This is also likely to cause short to medium term gilt yields to fall. If there was a disorderly Brexit, then any cut in Bank Rate would be likely to last for a longer period and also depress short and medium gilt yields correspondingly. It is also possible that the government could act to protect economic growth by implementing fiscal stimulus.
19. The balance of risks to the UK The overall balance of risks to economic growth in the UK is probably
neutral. The balance of risks to increases in Bank Rate and shorter term
PWLB rates, are probably also even and are broadly dependent on how strong GDP growth turns out, how slowly inflation pressures subside, and how quickly the Brexit negotiations move forward positively.
20. One risk that is both an upside and downside risk, is that all central banks are now working in very different economic conditions than before the 2008 financial crash as there has been a major increase in consumer and other debt due to the exceptionally
Prudential Indicators and Treasury Management Strategy Report 2019/20 Audit Committee - 29 of 38 -

low levels of borrowing rates that have prevailed for ten years since 2008. This means that the neutral rate of interest in an economy, (i.e. the rate that is neither expansionary nor deflationary), is difficult to determine definitively in this new environment, although central banks have made statements that they expect it to be much lower than before 2008. Central banks could therefore either over or under do increases in central interest rates.
21. Downside risks to current forecasts for UK gilt yields and PWLB rates currently include:
Brexit – if it were to cause significant economic disruption and a major downturn in the rate of growth.
Bank of England monetary policy takes action too quickly, or too far, over the next three years to raise Bank Rate and causes UK economic growth, and increases in inflation, to be weaker than we currently anticipate.
A resurgence of the Eurozone sovereign debt crisis, possibly in Italy, due to its high level of government debt, low rate of economic growth and vulnerable banking system, and due to the election in March of a government which has made a lot of anti-austerity noise. The EU rejected the initial proposed Italian budget and demanded cuts in government spending which the Italian government has refused. However, a fudge was subsequently agreed but only by delaying the planned increases in expenditure to a later year. The rating agencies have started on downgrading Italian debt to one notch above junk level. If Italian debt were to fall below investment grade, many investors would be unable to hold it. Unsurprisingly, investors are becoming increasingly concerned by the words and actions of the Italian government and consequently, Italian bond yields have risen – at a time when the government faces having to refinance large amounts of debt maturing in 2019.
Weak capitalisation of some European banks. Italian banks are particularly vulnerable; one factor is that they hold a high level of Italian government debt - debt which is falling in value. This is therefore undermining their capital ratios and raises the question of whether they will need to raise fresh capital to plug the gap.
German minority government. In the German general election of September 2017, Angela Merkel’s CDU party was left in a vulnerable minority position dependent on the fractious support of the SPD party, as a result of the rise in popularity of the anti-immigration AfD party. Then in October 2018, the results of the Bavarian and Hesse state elections radically undermined the SPD party and showed a sharp fall in support for the CDU. As a result, the SPD is reviewing whether it can continue to support a coalition that is so damaging to its electoral popularity. After the result of the Hesse state election, Angela Merkel announced that she would not stand for re-election as CDU party leader at her party’s convention in December 2018. However, this makes little practical difference as she is still expected to aim to continue for now as the Chancellor. However, there are five more state elections coming up in 2019 and EU parliamentary elections in May/June; these could result in a further loss of electoral support for both the CDU and SPD which could also undermine her leadership.
Prudential Indicators and Treasury Management Strategy Report 2019/20 Audit Committee - 30 of 38 -

Other minority eurozone governments. Spain, Portugal, Ireland, Netherlands and Belgium all have vulnerable minority governments dependent on coalitions which could prove fragile. Sweden is also struggling to form a government due to the anti-immigration party holding the balance of power, and which no other party is willing to form a coalition with. The Belgian coalition collapsed in December 2018 but a minority caretaker government has been appointed until May EU wide general elections.
Austria, the Czech Republic and Hungary now form a strongly anti-immigration bloc within the EU while Italy, this year, has also elected a strongly anti-immigration government. Elections to the EU parliament are due in May/June 2019.
Further increases in interest rates in the US could spark a sudden flight of investment funds from more risky assets e.g. shares, into bonds yielding a much improved yield. Throughout the last quarter of 2018, we saw a sharp fall in equity markets but this has been limited, as yet. Emerging countries which have borrowed heavily in dollar denominated debt, could be particularly exposed to this risk of an investor flight to safe havens e.g. UK gilts.
There are concerns around the level of US corporate debt which has swollen massively during the period of low borrowing rates in order to finance mergers and acquisitions. This has resulted in the debt of many large corporations being downgraded to a BBB credit rating, close to junk status. Indeed, 48% of total investment grade corporate debt is now rated at BBB. If such corporations fail to generate profits and cash flow to reduce their debt levels as expected, this could tip their debt into junk ratings which will increase their cost of financing and further negatively impact profits and cash flow.
Geopolitical risks, especially North Korea, but also in Europe and the Middle East, which could lead to increasing safe haven flows.
22. Upside risks to current forecasts for UK gilt yields and PWLB rates Brexit – if both sides were to agree a compromise that removed all
threats of economic and political disruption. The Fed causing a sudden shock in financial markets through
misjudging the pace and strength of increases in its Fed. Funds Rate and in the pace and strength of reversal of QE, which then leads to a fundamental reassessment by investors of the relative risks of holding bonds, as opposed to equities. This could lead to a major flight from bonds to equities and a sharp increase in bond yields in the US, which could then spill over into impacting bond yields around the world.
The Bank of England is too slow in its pace and strength of increases in Bank Rate and, therefore, allows inflation pressures to build up too strongly within the UK economy, which then necessitates a later rapid series of increases in Bank Rate faster than we currently expect.
UK inflation, whether domestically generated or imported, returning to sustained significantly higher levels causing an increase in the inflation premium inherent to gilt yields.
Prudential Indicators and Treasury Management Strategy Report 2019/20 Audit Committee - 31 of 38 -

Prudential Indicators and Treasury Management Strategy Report 2019/20 Audit Committee - 32 of 38 -

Appendix 2
Treasury Management Practice (TMP1) – Credit and Counterparty Risk Management
1. The MHCLG issued Investment Guidance in 2018, and this forms the structure of the Council’s policy below. These guidelines do not apply to either trust funds or pension funds which operate under a different regulatory regime.
2. The key intention of the Guidance is to maintain the current requirement for Councils to invest prudently, and that priority is given to security and liquidity before yield. In order to facilitate this objective the guidance requires this Council to have regard to the CIPFA publication Treasury Management in the Public Services: Code of Practice and Cross-Sectoral Guidance Notes. This Council adopted the Code on 21st March 2002 and will apply its principles to all investment activity. In accordance with the Code, the Assistant Director Resources has produced its Treasury Management Practices (TMPs). This part, TMP 1(1), covering investment counterparty policy requires approval each year.
Annual Investment Strategy
3. The key requirements of both the Code and the investment guidance are to set an annual investment strategy, as part of its annual treasury strategy for the following year, covering the identification and approval of the following:
a) The strategy guidelines for choosing and placing investments, particularly non-specified investments.
b) The principles to be used to determine the maximum periods for which funds can be committed.
c) Specified investments that the Council will use. These are high security (i.e. high credit rating, although this is defined by the Council, and no guidelines are given), and high liquidity investments in sterling and with a maturity of no more than a year.
d) Non-specified investments, clarifying the greater risk implications, identifying the general types of investment that may be used and a limit to the overall amount of various categories that can be held at any time.
4. The investment policy proposed for the Council is:
Strategy Guidelines
5. The main strategy guidelines are contained in the body of the treasury strategy statement.
Prudential Indicators and Treasury Management Strategy Report 2019/20 Audit Committee - 33 of 38 -

All Investments
6. The criteria for providing a pool of high quality investment counterparties (both Specified and Non-specified investments) is:
(a) Banks 1 - good credit quality – the Council will only use banks which:
i. are UK banks; and have, as a minimum, the following Fitch, Moody’s and Standard and Poors credit ratings (where rated):
a. Fitch Short Term equivalent – F1 b. Fitch Long term equivalent – A-
(b) Banks 2 Non UK banks based on the following very high quality criteria using a lowest common denominator approach and only where sovereign ratings are AAA.
a. Fitch Short Term equivalent – F1+ b. Fitch Long Term equivalent – AA-
(c) Banks 3 – Part nationalised UK banks – Lloyds Bank Group and Royal Bank of Scotland. These banks can be included if they continue to be part nationalised or they meet the ratings in Banks 1 above.
(d) Banks 4 – The Council’s own banker for transactional purposes if the bank falls below the above criteria, although in this case balances will be minimised in both monetary size and time.
(e) Building societies The Council will use all societies which:
i. meet the ratings for banks outlined above and have assets in excess of £1,000m
(f) Money Market Funds (CNAV, LVNAV & VNAV) AAA
(g) Ultra Short Dated Bond Funds AAA
(h) UK Government (including gilts Treasury Bills and the Debt Management Office)
(i) Local authorities, parish councils etc
(j) Supranational institutions
(k) Property Funds ,Corporate Bond Funds and Asset Backed Investment Products
7. A limit of £50M will be applied to the use of Non-Specified investments.
Prudential Indicators and Treasury Management Strategy Report 2019/20 Audit Committee - 34 of 38 -

Specified Investments
8. These investments are sterling investments of not more than one-year maturity, or those which could be for a longer period but where the Council has the right to be repaid within 12 months if it wishes. These are considered low risk assets where the possibility of loss of principal or investment income is small. These would include sterling investments which would not be defined as capital expenditure with:
(a) The UK Government (such as the Debt Management Account deposit facility, UK Treasury Bills or a Gilt with less than one year to maturity).
(b) Supranational bonds of less than one year’s duration. (c) A local authority, housing association, parish council or community council. (d) Pooled investment vehicles (such as money market funds) that have been
awarded a high credit rating by a credit rating agency. For category f. above, this covers pooled investment vehicles, such as money market funds, rated AAA by Standard and Poor’s, Moody’s and/or Fitch rating agencies.
(e) A body that is considered of a high credit quality (such as a bank or building society). For category a and b this covers bodies with a minimum short term rating of F1 (or the equivalent) as rated by Standard and Poor’s, Moody’s and/or Fitch rating agencies.
9. Within these bodies, and in accordance with the Code, the Council has set additional criteria to set the time and amount of monies which will be invested in these bodies. These criteria are:
Prudential Indicators and Treasury Management Strategy Report 2019/20 Audit Committee - 35 of 38 -

Fitch Long term Rating
(or equivalent)
Money Limit
Time Limit
Banks 1 category high quality AA- £5M
Maximum of 2 years Suggested duration usingLink Asset Services colour coding (CDS adjusted withmanual override)
Banks 1 category medium quality
A £4M
Maximum of 1 year Suggested duration usingLink Asset Services colour coding (CDS adjusted withmanual override)
Banks 1 category lower quality A- £3M
Maximum of 1 year Suggested duration usingLink Asset Services colour coding (CDS adjusted withmanual override)
Banks 2 Non UK (only where sovereign ratings are AAA)
AA- £3M
Maximum of 1 year Suggested duration usingLink Asset Services colour coding (CDS adjusted withmanual override)
Banks 3 category – part nationalised
N/A £5M Maximum of 1 year
Banks 4 category – Council’s banker (not meeting Banks 1,2and3)
£3M 1 day
DMADF (Debt Management Office)
AAA unlimited 6 months
Local authorities N/A £5M per
Local Authority
Up to 1 years
Money market Funds (CNAV, LVNAV & VNAV) and Ultra Short Dated Bond Funds
AAA £5M per
Fund liquid
10. The Council will therefore use the following durational bands supplied by Link Asset Service’s creditworthiness service when applying time limits to investments
a. Yellow equivalent
Maximum 2 years *This only relates to AAA rated government debt or its
b. c. d.
Purple Maximum 2 years Blue 1 year (only applies to nationalised or semi nationalised UK Banks) Orange 1 year
e. Red 6 months f. Green 3 months
Prudential Indicators and Treasury Management Strategy Report 2019/20 Audit Committee - 36 of 38 -

Non-Specified Investments
11. Non-specified investments are any other type of investment (i.e. not defined as Specified above). The identification and rationale supporting the selection of these other investments and the maximum limits to be applied are set out below. Non specified investments would include any sterling investments with:
Non Specified Investment Category Limit (£ or %)
a. Supranational Bonds greater than 1 year to maturity (a) Multilateral development bank bonds - These are bonds defined as an international financial institution having as one of its objects economic development, either generally or in any region of the world (e.g. European Reconstruction and Development Bank etc.). (b) A financial institution that is guaranteed by the United Kingdom Government (e.g. National Rail, The Guaranteed Export Finance Company {GEFCO})
The security of interest and principal on maturity is on a par with the Government and so very secure. These bonds usually provide returns above equivalent gilt edged securities. However the value of the bond may rise or fall before maturity and losses may accrue if the bond is sold before maturity.
AAA long term ratings
b. Gilt edged securities with a maturity of greater than one year. These are Government bonds and so provide the highest security of interest and the repayment of principal on maturity. Similar to category (a) above, the value of the bond may rise or fall before maturity and losses may accrue if the bond is sold before maturity.
c. The Council’s own banker if it fails to meet the basic credit criteria. In this instance balances will be minimised as far as is possible.
£3m
d. Building societies not meeting the basic security requirements under the specified investments. The operation of some building societies does not require a credit rating, although in every other respect the security of the society would match similarly sized societies with ratings.
£5m
e. Any bank or building society that has a minimum long term credit rating of AA-, for deposits with a maturity of greater than one year (including forward deals in excess of one year from inception to repayment).
£5m
f. Local Authorities £5m per authority
g. Property Funds, Corporate Bond Funds and Other Asset backed Investment productsThe use of these instruments can be deemed to be capital expenditure, and as such will be an application (spending) of capital resources. This Authority will seek guidance on the status of any fund it may consider using
£20m per Fund
Prudential Indicators and Treasury Management Strategy Report 2019/20 Audit Committee - 37 of 38 -

12. Within categories c and d, and in accordance with the Code, the Council has developed additional criteria to set the overall amount of monies which will be invested in these bodies. Time limits will be applied to banks using the creditworthiness service provided by Link Asset Services. And for part-nationalised banks will be up to 2 years.
13. Time limits for Property Funds, Corporate Bond Funds and Asset Backed Investment Products will be up to 10 Years, Local Authorities up to 2 years.
The Monitoring of Investment Counterparties
14. The credit rating of counterparties will be monitored regularly. The Council receives credit rating information (changes, rating watches and rating outlooks) from Link Asset Services as and when ratings change, and counterparties are checked promptly. On occasion ratings may be downgraded when an investment has already been made. The criteria used are such that a minor downgrading should not affect the full receipt of the principal and interest. Any counterparty failing to meet the criteria will be removed from the list immediately by the Assistant Director Resources, and if required new counterparties which meet the criteria will be added to the list.
Prudential Indicators and Treasury Management Strategy Report 2019/20 Audit Committee - 38 of 38 -