au-ni nanoparticles phase diagram prediction, … spinodal decomposition has been also observed...
TRANSCRIPT
Contents lists available at ScienceDirect
CALPHAD: Computer Coupling of Phase Diagrams andThermochemistry
journal homepage: www.elsevier.com/locate/calphad
Au-Ni nanoparticles: Phase diagram prediction, synthesis, characterization,and thermal stability
J. Sopoušeka,b,⁎, A. Kryštofováa, M. Premovićc, O. Zobača, S. Polsterováa, P. Broža,b, J. Buršíkd
a Masaryk University, Faculty of Science, Department of Chemistry, Kotlářská 2, 611 37 Brno, Czech Republicb Masaryk University, Central European Institute of Technology, CEITEC, Kamenice 753/5, 625 00 Brno, Czech Republicc University of Pristina, Faculty of Technical Science, Kos. Mitrovica, Kneza Milosa 7, 4000 Kos. Mitrovica, Serbiad Institute of Physics of Materials, Academy of Sciences of the Czech Republic, Žižkova 22, 616 62 Brno, Czech Republic
A R T I C L E I N F O
Keywords:NanoalloyCAPHADPhase diagramSpinodal decomposition
A B S T R A C T
The Au-Ni nanoparticles (NPs) were prepared by oleylamine solvothermal synthesis from metal precursors. TheAu-Ni phase diagram prediction respecting the particle size was calculated by the CALPHAD method. Thehydrodynamic size of the AuNi NPs in a nonpolar organic solvent was measured by the dynamic light scattering(DLS) method. The average hydrodynamic sizes of the nanoparticle samples were between 18 and 25 nm. Themetallic composition of the AuNi NP samples was obtained by inductively-coupled plasma atomic emissionspectroscopy (ICP-OES). The metallic fraction inside AuNi NPs was varied Au-(30–70) wt%Ni. The stericalkylamine stabilization was observed. The individual AuNi NPs were investigated by transmission electronmicroscopy (TEM). The dry nanopowder was also studied. The structures of the aggregated samples wereinvestigated by scanning electron microscopy (SEM). The AuNi NPs reveal randomly mixed face-centered cubic(FCC) crystal lattices. The phase transformations were studied under inert gas and air. The samples werestudied by differential scanning calorimetry (DSC).
1. Introduction
The behavior of the macro-sized alloy (bulk alloy) differs from asystem of individual nano alloy particles (nanoalloy) despite that bothbulk and nanoalloy have the same composition. The fundamentalreasons are a high ratio between numbers of surface and volumeatoms and the presence of the adsorbed or bonded molecules (ligands)on the nanoparticle surface. The main function of the ligands is tostabilize nanoparticles. The second function is to functionalize thenanoparticle surface for subsequent applications.
The AuNi nanoparticles could provide opportunities to combineproperties of gold nanoparticles, which are considered as non-toxic andare intensively investigated now, in conjunction with magnetic proper-ties of nickel atoms. These nanoparticles could be promising carriersfor surface anchored agents in diagnostics, medicine, drug delivery, etc.
The phase behavior of the AuNi alloy in the macroscopic form(bulk) is well known. The stable phase diagram was clarified experi-mentally during the 20th century. The AuNi bulk alloy represents anon-ideal system with limited mutual miscibility of the metals in thesolid state at low-temperature region [1].
At the beginning of this century (2005), Wang and colleaguesperformed a detailed thermodynamic assessment of the phases of the
AuNi system using the CALPHAD method [1]. The result of their workwas the accurate phase diagram of the Au-Ni system, which reveals thecritical point at 816 °C (Au-74 at%Ni) and the congruent point at941 °C (Au-36 at%Ni). The accepted description of the phases of theAuNi system [1] is in accordance with the thermodynamic data, such asentropy and enthalpy of mixing, the activity of both gold and nickel inthe AuNi bulk.
Despite the FCC lattice of pure Au and Ni, their alloy revealsdecomposition to the Au-rich FCC phase (FCC_Au) and the Ni-richFCC phase (FCC_Ni) at temperatures below the critical point. Thethermodynamic equilibrium of the two phases (FCC_Au + FCC_Ni) iscreated by either discontinuous precipitation or by the spinodaldecomposition of the supersaturated FCC AuNi alloy [2]. The spinodaldecomposition occurs at a low-temperature range up to 250 °C. Thediscontinuous precipitation (nucleation and growth) takes place athigh-temperature range (250–816) °C. The kinetics of both phasetransformations is slow [2]. The earlier time of the start of thediscontinuous precipitation is 250 s at 600 °C. The earlier time of thestart of the spinodal decomposition is 1000 s at 150 °C. It appears thatboth kinds of the phase transformations are diffusion controlled. Ratesof chemical diffusion of gold and nickel in the fcc AuNi bulk alloy canbe obtained from diffusional mobilities of both gold and nickel [3].
http://dx.doi.org/10.1016/j.calphad.2017.05.002Received 21 December 2016; Received in revised form 3 May 2017; Accepted 6 May 2017
⁎ Corresponding author at: Masaryk University, Faculty of Science, Department of Chemistry, Kotlářská 2, 611 37 Brno, Czech Republic.E-mail address: [email protected] (J. Sopoušek).
CALPHAD: Computer Coupling of Phase Diagrams and Thermochemistry 58 (2017) 25–33
0364-5916/ © 2017 Published by Elsevier Ltd.
MARK
Irradiation-induced spinodal decomposition has been also observed in-situ on thin AuNi foil in an electron microscope with 0.4–1 MeVelectron irradiation up to approx. 600 °C [4].
The properties of AuNi nanoparticles should be inferred from theproperties of the bulk alloys but deviations caused by nanoscale particlesize and by the presence of ligands on the surface were observed. Thepreparations of the AuNi nanoparticles was realized using physicalmethods and by routes of chemical synthesis. The products of thesemethods are different types of nanoparticles as core@shell, super-saturated AuNi NPs, and Janus NPs. The last type is a special type ofnanoparticle, its surface has two or more distinct physical properties.
A simple physical technique for preparing of AuNi particles is adewetting method [5,6]. The first step of the procedure is physicalvapor deposition (PVD) of thin Au/Ni bilayer on a suitable substrate.The heating of the sample at temperatures in two phase region causesseparation of the metal bilayer from the substrate surface and theformation of Janus Au/Ni bimetallic particles. Herz et al. [6] preparedby this way submicron particles that were formed by (FCC_Au +FCC_Ni) phases. It is possible to homogenize the particles if they areannealed at a high temperature in the FCC AuNi single phase region.Consequently, the formation of the FCC magnetic supersaturated AuNiparticles is possible after cooling to ambient temperature [7]. The maindisadvantage of the dewetting method is that particles below approx.0.1 µm cannot be prepared.
Core@shell nanoparticles that consist of Au cores covered by Ni(Au@Ni) can be prepared by the metal gas condensation method [8].The product has a huge magnetization generated by Faraday Induction.The magnetism is not lost even if the oxidation of the Au@Ninanoparticles to particles containing NiO occurred.
The wet chemical synthesis of AuNi NPs is more promising thanphysical methods. The synthesis can use inorganic Ni2+ salts andtetrachloroauric acid. Sodium tetrahydroborate (NaBH4) is often usedas a reducing agent. Different electrochemical potentials of the goldand the less noble nickel adversely affect the reduction step. Therefore,it is easier to synthesize the core@shell nanoparticles (Au@Ni NPs)than to prepare nanoparticles with a homogeneous supersaturatedcomposition (AuNi NPs). The Au@Ni NPs were prepared by Chiu et al.in 2009 [9] using a water-in-oil microemulsion. Also, other authorsobtained similar products [10,11]. Alternatively, laser ablation of Nitarget in Au colloidal solution can also be used for NP synthesis [12]. Atthese conditions, the formation of bimetallic Au@Ni NPs and complexNiO:Au nanoparticles occurred. The preparation of the Ni@Au nano-particles (Ni in the center, shell enriched in Au!) that are stable at roomtemperature is also very interesting research that was done by Authenand a team in 2008 [13]. They obtained the magnetic Ni-Au nano-particles of a small size (3 nm) using PAMAM (polyamidoamine)dendrimer and inorganic salts of Au and Ni.
The nanoparticles based on AuNi alloys are considered promisingcatalysts for chemical reactions [14]. For example aerobic oxidativeesterification of aldehydes with alcohols [15], hydrogen generation byhydrolysis of basic NaBH4 solutions [16], electrocatalyzed borohydrideoxidation [11]. Fine nanoparticles of Ni on pNIPAM-coated Aunanoparticles can be used for the preparation of special sensors [17].
Generally, the nanoparticles consisting of gold and nickel areobjects, which are discussed in theoretical and experimental nanopar-ticle research. The phenomenon of the phase separation of the super-saturated Au-Ni nanoparticle was theoretically investigated by thegroups of Herz, Friák, and others [18] but the experimental prepara-tion of the supersaturated AuNi nanoparticles represents a greatchallenge to the synthetic research.
2. Prediction of Au-Ni nanoalloy phase diagram
Phase diagram prediction of AuNi nanoalloys was performed usinga similar method as presented by Lee and Park [19,20] and others[21,22]. The employed CALPHAD method [20] is based on the
minimization of the molar Gibbs energy of the phases present in theentire system. The Gibbs energy of the phase (liquid or FCC solid) thatinvolve 1 mol of the individual nanoparticles is given by Eq. (1).
G G G= +Total Bulk Surface (1)
where GBulk is the Gibbs energies of the bulk binary phase expressedas Eq. (2).
G x G x G RT x x x x G= + + ( ln + ln ) +BulkA A
oB B
oA A B B
Ex Bulk, (2)
xA and xB are mole fractions of A and B, GAo and GB
o are the standardGibbs energies of A and B, R is the universal gas constant, T is thetemperature and GEx Bulk, is the excess Gibbs energy of the bulk which isgiven by Eq. (3).
∑G x x L T x x= ( )( − )Ex BulkA B
υ
υB A
υ,
(3)
where index υ = 0, 1, 2, ... in temperature dependent parameters
L T a b T c T T( ) = + ⋅ + ⋅ ⋅ ln( )υυ υ υ
The second term in Eq. (1) is the Gibbs energy of the surface of thenanoparticles GSurface. This surface energy for isotropic sphericalparticles is expressed by
G CσVr
= 2Surface(4)
where C is a correction factor considering the effects from the shape thesurface strain due to nonuniformity, and the uncertainty of the surfacetension measurements, estimated for a liquid to be 1.00 and for an fccsolid structure 1.05 [23], σ is the surface tension, r is the radius of theparticle and V is the molar volume.
The molar volume for the binary system is expressed as the sum offractions of each constituent (Eq. (5)).
V x V x V= +A A B B (5)
For calculation of the surface tension of a binary liquid alloy theButler equation [24] can be used expressed by
⎛⎝⎜
⎞⎠⎟
⎛⎝⎜
⎞⎠⎟
σ σA
G G RTA
xx
σA
G G RTA
xx
= + 1 ( − ) + ln 1 −1 −
= + 1 ( − ) + ln
AA
ASurface
AEx Bulk
A
BS
B
BB
BSurface
BEx Bulk
B
BS
B
,
,
(6)
where σA and σB are the surface tensions of pure species A and B, AAand AB are the superficial areas occupied by the liquid component Aand B,GA
Surface and GBSurface are the partial Gibbs energies of component A
and B in the surface and GAEx Bulk, , GB
Ex Bulk, are the partial Gibbs energiesof component A and B in bulk.
The partial Gibbs energy GASurface of component A is presented as Eq.
(7).
G β G=ASurface mix Ex Bulk, (7)
where βmix is a parameter corresponding to the ratio of thecoordination number in the surface in the bulk and equal to βPure
and the parameter is estimated to be 0.83 [25] and later on 0.85 [20].The parameter βPure is determined from Eq. (8).
σ A β ΔH= (1 − )A APure
LG A, (8)
where ΔHLG A, is the heat for the liquid-gas transformation of metalA. A similar equation for solid βPure is given by Eq. (9).
σ A β ΔH= (1 − )A APure
SG A, (9)
where ΔHSG A, is the heat for solid–gas transformation of metal A.The parameter βPure for solid state was estimated to be 0.84 [20],
which is close to liquid metals. Accordingly, it is considered that thesurface relaxation and rearrangement effects are almost the same forboth liquid and solid metals. Therefore, if the differences in shape andsurface strain with respect to composition are ignorable. According to
J. Sopoušek et al. CALPHAD: Computer Coupling of Phase Diagrams and Thermochemistry 58 (2017) 25–33
26
this conclusion, the surface tension of solid alloys can be predicted alsoby the Butler equation [24].
The Butler Eq. (6) [24] is implemented in the software packagestxs-xbt.exe [26]. This software was used for the calculation of surfacetensions of liquid and solidus alloy phases. Necessary data for thecalculation are summarized in Table 1..
Data for surface tension of pure nickel are average values of surfacetension from literature [30,32–37] that are summarized in reference[22].
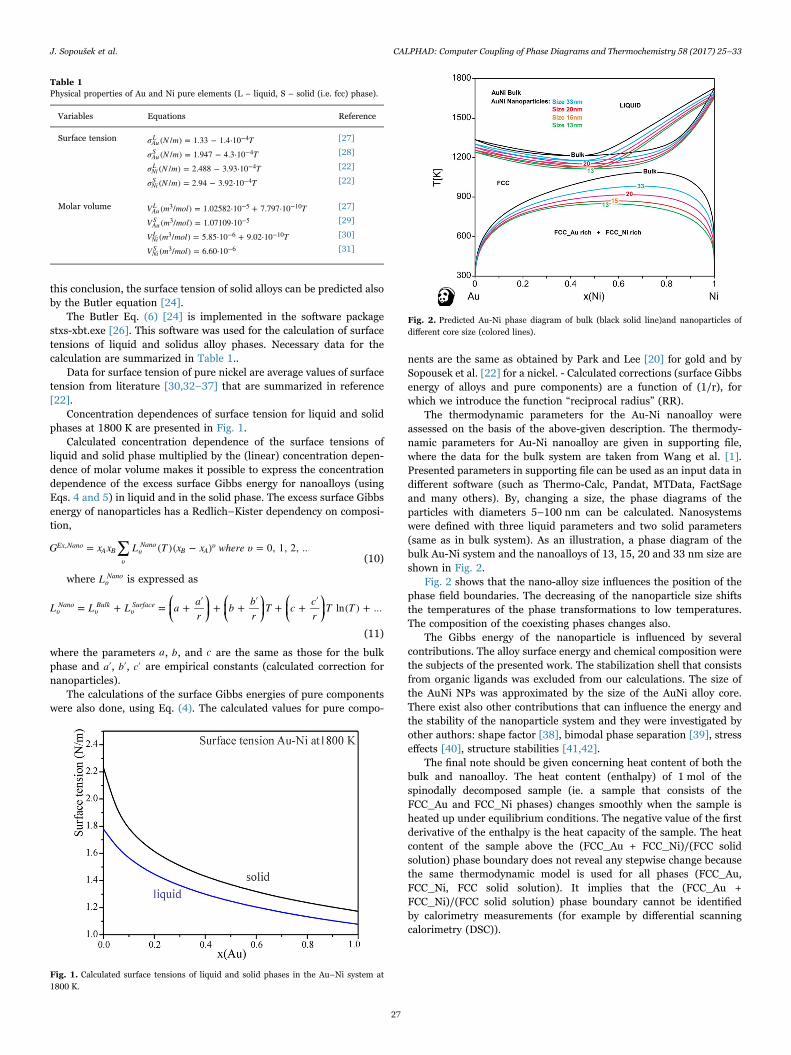
Concentration dependences of surface tension for liquid and solidphases at 1800 K are presented in Fig. 1.
Calculated concentration dependence of the surface tensions ofliquid and solid phase multiplied by the (linear) concentration depen-dence of molar volume makes it possible to express the concentrationdependence of the excess surface Gibbs energy for nanoalloys (usingEqs. 4 and 5) in liquid and in the solid phase. The excess surface Gibbsenergy of nanoparticles has a Redlich–Kister dependency on composi-tion,
∑G x x L T x x where υ= ( )( − ) = 0, 1, 2, ...Ex NanoA B
υυNano
B Aυ,
(10)
where LυNano is expressed as
⎛⎝⎜
⎞⎠⎟
⎛⎝⎜
⎞⎠⎟
⎛⎝⎜
⎞⎠⎟L L L a a
rb b
rT c c
rT T= + = +
′+ +
′+ +
′ln( ) + ...υ
NanoυBulk
υSurface
(11)
where the parameters a, b, and c are the same as those for the bulkphase and a′, b′, c′ are empirical constants (calculated correction fornanoparticles).
The calculations of the surface Gibbs energies of pure componentswere also done, using Eq. (4). The calculated values for pure compo-
nents are the same as obtained by Park and Lee [20] for gold and bySopousek et al. [22] for a nickel. - Calculated corrections (surface Gibbsenergy of alloys and pure components) are a function of (1/r), forwhich we introduce the function “reciprocal radius” (RR).
The thermodynamic parameters for the Au-Ni nanoalloy wereassessed on the basis of the above-given description. The thermody-namic parameters for Au-Ni nanoalloy are given in supporting file,where the data for the bulk system are taken from Wang et al. [1].Presented parameters in supporting file can be used as an input data indifferent software (such as Thermo-Calc, Pandat, MTData, FactSageand many others). By, changing a size, the phase diagrams of theparticles with diameters 5–100 nm can be calculated. Nanosystemswere defined with three liquid parameters and two solid parameters(same as in bulk system). As an illustration, a phase diagram of thebulk Au-Ni system and the nanoalloys of 13, 15, 20 and 33 nm size areshown in Fig. 2.
Fig. 2 shows that the nano-alloy size influences the position of thephase field boundaries. The decreasing of the nanoparticle size shiftsthe temperatures of the phase transformations to low temperatures.The composition of the coexisting phases changes also.
The Gibbs energy of the nanoparticle is influenced by severalcontributions. The alloy surface energy and chemical composition werethe subjects of the presented work. The stabilization shell that consistsfrom organic ligands was excluded from our calculations. The size ofthe AuNi NPs was approximated by the size of the AuNi alloy core.There exist also other contributions that can influence the energy andthe stability of the nanoparticle system and they were investigated byother authors: shape factor [38], bimodal phase separation [39], stresseffects [40], structure stabilities [41,42].
The final note should be given concerning heat content of both thebulk and nanoalloy. The heat content (enthalpy) of 1 mol of thespinodally decomposed sample (ie. a sample that consists of theFCC_Au and FCC_Ni phases) changes smoothly when the sample isheated up under equilibrium conditions. The negative value of the firstderivative of the enthalpy is the heat capacity of the sample. The heatcontent of the sample above the (FCC_Au + FCC_Ni)/(FCC solidsolution) phase boundary does not reveal any stepwise change becausethe same thermodynamic model is used for all phases (FCC_Au,FCC_Ni, FCC solid solution). It implies that the (FCC_Au +FCC_Ni)/(FCC solid solution) phase boundary cannot be identifiedby calorimetry measurements (for example by differential scanningcalorimetry (DSC)).
Table 1Physical properties of Au and Ni pure elements (L – liquid, S – solid (i.e. fcc) phase).
Variables Equations Reference
Surface tension σ N m T( / ) = 1.33 − 1.4⋅10AuL −4 [27]
σ N m T( / ) = 1.947 − 4.3⋅10AuS −4 [28]
σ N m T( / ) = 2.488 − 3.93⋅10NiL −4 [22]
σ N m T( / ) = 2.94 − 3.92⋅10NiS −4 [22]
Molar volume V m mol T( / ) = 1.02582⋅10 + 7.797⋅10AuL 3 −5 −10 [27]
V m mol( / ) = 1.07109⋅10AuS 3 −5 [29]
V m mol T( / ) = 5.85⋅10 + 9.02⋅10NiL 3 −6 −10 [30]
V m mol( / ) = 6.60⋅10NiS 3 −6 [31]
Fig. 1. Calculated surface tensions of liquid and solid phases in the Au–Ni system at1800 K.
Fig. 2. Predicted Au-Ni phase diagram of bulk (black solid line)and nanoparticles ofdifferent core size (colored lines).
J. Sopoušek et al. CALPHAD: Computer Coupling of Phase Diagrams and Thermochemistry 58 (2017) 25–33
27
3. Experimental section
3.1. Materials
The following chemicals were all used as obtained: pure gold metal(5 N purity), aqua regia mixed from hydrochloric acid (HCl, 35%,chemical grade: purists p. a., Penta) and nitric acid (HNO3, 69%,purum, Penta) in a 3:1 vol ratio, water (deionized, < 1μS/cm), liquidnitrogen ( > 5 N, Messer), oleylamine (ACROS Organics, C18H35NH2,redestilled from tech. 80–90% grade, stored above calcium hydrideCaH2 under nitrogen), tetraoctylammonium chloride (N(C8H17)4Cl,viscose liquid, 90%), nickel(II) acetylacetonate (Ni(AcAc)2, 95%,Aldrich), octadecene (C18H36, redistilled from 98% grade, stored abovesodium metal under nitrogen, Aldrich), hexane (purum, Lachner).Chromafil 0.45 µm PES filter (Machery-Nagel) was used.
3.2. Preparation of metal precursors
The synthesis of the gold precursor was started from gold metal,which was dissolved in aqua regia to tetrachloro auric acid (HAuCl4) at70 °C. The volume of the HAuCl4 solution was reduced to approx. 90%at a temperature close to 105 °C. The crystallization of HAuCl4 wasfinished by slow evaporating of the solution at 40 °C. The yellowcrystals of HAuCl4 were prepared. HAuCl4 was dissolved in water(12 mg Au/ml), filtered with 0.45 µm PES filter, and saved for next use.
The adapted procedure derived from instructions given by Leff [43]was used for the HAuCl4 substance transfer from water to oleylaminephase. The tetraoctylammonium chloride N(C8H17)4Cl was used as aphase converter in the following procedure. The aqueous solution(5 ml) of HAuCl4 (60 mg, i.e. nAu =0.305 mmol of gold metal) wasmixed with the toluene solution (5 ml) involving approx. 2.5 nAu mmol(383 mg) of N(C8H17)4Cl. Thus two-phase extraction system wascreated. Under gentle stirring at rotary extractor (20 min), the goldin the form of HAuCl4 (in aqueous solution) was transferred to the[N(C8H17)4]
+[AuCl4]- complex (in toluene solution). The transfer was
indicated by yellow color moving from water to toluene phase. Theextraction efficiency near 95% was evaluated by the gravimetricmethod (i. e. toluene was evaporated and the solid residue was heatedup to the formation of anhydrous HAuCl4 at 350 °C or the formation ofgold metal at 800 °C). Once the extraction was finished, the aqueousphase was separated and discarded. The extraction procedure was donealways before the nanoparticle synthesis because of low stability of thegold precursor in the organic phase.
The exact gold content (in the form of [N(C8H17)4]+[AuCl4]
-
complex) in toluene solution was evaluated after extraction by anoscillating densitometer (DMA 5000 M, Anton Paar, accuracy ±0.000001 g/ml). It was found that the density of toluene solution withthe gold complex is a linear function of the gold metal content.
The subsequent step was transferring gold from toluene intooleylamine. The toluene solution of the gold complex was slowlytitrated by the 5 vol% oleylamine in toluene. During this procedure,the yellow color has changed to brown. The titration was stopped whenthe color did not change anymore. Finally, 8 ml of oleylamine wasadded and the mixture was concentrated under vacuum to volumeclose to 8 ml. The solution of the gold precursor in oleylamine was aclear liquid with a yellow/brown color.
The nickel(II) acetylacetonate Ni(AcAc)2 was used as a nickelprecursor. Dissolving of solid Ni(AcAc)2 in oleylamine needed heatingto approx. 40 °C.
3.3. Nanoparticle synthesis
The samples of the AuNi nanoparticles were synthesized bysolvothermal co-reduction of gold and nickel precursors. The synthesiswas similar to the preparation given in our previous report [44]. Thetetrachloro auric acid (HAuCl4) and nickel(II) acetylacetonate
(Ni(AcAc)2) in oleylamine (OAm) were used as gold and nickelprecursors, respectively. The main step of the synthesis is an injectionof the metal precursors into the solvent mixture of oleylamine andoctadecene.
The synthesis of nanoparticles was performed in a three-neckedflask (250 ml), which was filled with a mixture of octadecene (30 ml)and oleylamine (22 ml). This arrangement enabled to heat the solventmixture in the flask on a SnPb metal bath, to work under a nitrogenatmosphere at the elevated temperature, and stirring. The solventmixture in the flask was degassed under vacuum at 140 °C. Nitrogenwas then blown through the flask and the solvent mixture was heatedup to 230 °C.
The preparation of the nanoparticles with an Au50at%Ni stoichio-metry composition was performed as follows. The solution containingNi(AcAc)2 (39 mg, 0.152 mmol) in 4 ml of oleylamine was preparedand mixed with the solution that was obtained during extractionprocedure and contained 30 mg (0.152 mmol) of gold in the form ofthe gold complex in 4 ml of oleylamine. A transparent green solutionwas created by mixing the precursor solutions. The particular masses ofthe precursors were used for preparing nanoparticles outside Au50at%Ni stoichiometry.
The precursor mixture was injected into the solvent mixture thatwas preheated to 230 °C. Coloration of the reaction mixture to darkbrown was observed after injection. The constant temperature 230 °Cwas held within 10 min, after that the flask with the reaction mixturewas removed from the metal bath and cooled by ambient air. Acolloidal brown/pink solution of AuNi nanoparticles in the solventmixture was obtained.
The synthesized bimetallic AuNi nanoparticles were separated in ahigh-speed centrifuge. The product was purified by repeated dissolvingin hexane and by subsequent centrifuging. The AuNi nanoparticleswere protected from oxidation by storing under a layer of hexane.
3.4. Instrumentations
3.4.1. Dynamic light scattering (DLS)The hexane colloidal solutions of the nanoparticles (at 25 °C) were
characterized by the DLS method on a Zetasizer Nano ZS ZEN 3500instrument (Malvern UK) working at the scattering angle of 173°. Themethod measures a hydrodynamic size of NPs, which is given by boththe metal core and the stabilizing organic layer of the core.
3.4.2. Overall chemical analysisThe chemical composition of the AuNi NP samples was obtained by
elemental analysis. The AuNi colloid was gently dried under vacuum ata laboratory temperature. The powder was weighed and dissolved innitric acid at elevated temperature. The Au and Ni metal content wasanalyzed by inductively-coupled plasma atomic emission spectroscopy(ICP-OES) calibrated on Au and Ni pure metals. The differencebetween the mass of the dry sample and the weight of the metalcontent was presumed to be the mass of organic matter.
3.4.3. Infrared spectroscopy (IR)FTIR spectra were measured on a Bruker Tensor 27 spectrometer
(the spectral range 4000–400 cm–1, resolution 4 cm–1) equipped with aDiamond-ATR accessory device. The IR spectra were evaluated withthe OPUS 7.2 software.
3.4.4. UV–vis spectroscopyThe spectra of the AuNi colloids in the range (200–900) nm were
obtained using a UNICAM UV/Vis Spectrometer UV4 and quartzcuvettes.
3.4.5. Transmission electron microscopy (TEM and HRTEM)The metal cores of the AuNi NPs were investigated by electron
microscopy because this technique is sensitive to heavier elements and
J. Sopoušek et al. CALPHAD: Computer Coupling of Phase Diagrams and Thermochemistry 58 (2017) 25–33
28
less sensitive to light elements that form an organic stabilizing layer ofthe NPs. To prepare samples, a drop of a diluted AuNi colloidalsuspension was placed on a holey carbon film coated Cu grid andallowed to dry by evaporation at ambient temperature. The size andshape of AuNi NP cores were investigated using a Philips CM12 STEMmicroscope with a thermoemission source operated at 120 kV and aJEOL JEM 2100 F high-resolution TEM (HRTEM) with an FEG sourceoperated at 200 kV (point resolution of 2.3 Å). Both transmissionelectron microscopes were equipped with energy dispersive X-ray(EDX) detectors.
3.4.6. Powder X-ray diffraction (XRD)Measurements were carried out on a GNR Europe XRD 600
diffractometer equipped with a Co lamp, λKα =1.7903 Å, 40 kV,15 mA, with theta/2theta configuration. Samples were measured instep scan of 0.2 deg for 10 s in reflection mode on plastic or aluminiumsample holders. A 1D detector DECTRIS Mythen2R was used. Thesamples were treated under air at ambient temperature.
3.4.7. High-temperature X-ray powder diffraction (HTXRD)X´Pert PRO PANalytical (Netherlands) diffractometer with CoKα
radiation was used for HTXRD. An HTK-16N Anton Paar heatingchamber was applied in step mode that enables sample heating on theplatinum strip. The XRD diffractograms were collected under vacuum(10−4 mbar) and in the air holding at each temperature duringcollecting data. The average heating rate included sample heatingand hold at temperature during measurement were 5 K/min. TheHTXRD pattern computation enabled evaluation of phase composition,lattice constants of phases, and crystallinity by Rietveld method.
3.4.8. Differential scanning calorimetry (DSC)The thermal properties of AuNi NPs were examined on a Netzsch
STA 409 CD/3/403/5/G apparatus under flowing (70 cm3 min−1) pure(6 N) argon with the heating rate of 10 K/min from room temperatureto approx. 1100 °C. The samples (approx. 10 mg) were measured inY2O3-coated alumina crucibles covered with a lid. The oxygen-freeatmosphere was maintained by a metallic zirconium trap located in the
hot zone of the calorimeter.
3.4.9. Scanning electron microscopy (SEM)Morphology and overall composition of the AuNi samples after
HTXRD heat treatment and DSC measurement were observed byscanning electron microscopy (SEM) using a TESCAN LYRA 3XMUFEG/SEM microscope with an X-Max 80 EDX Oxford Instrumentsdetector.
4. Results and discussion
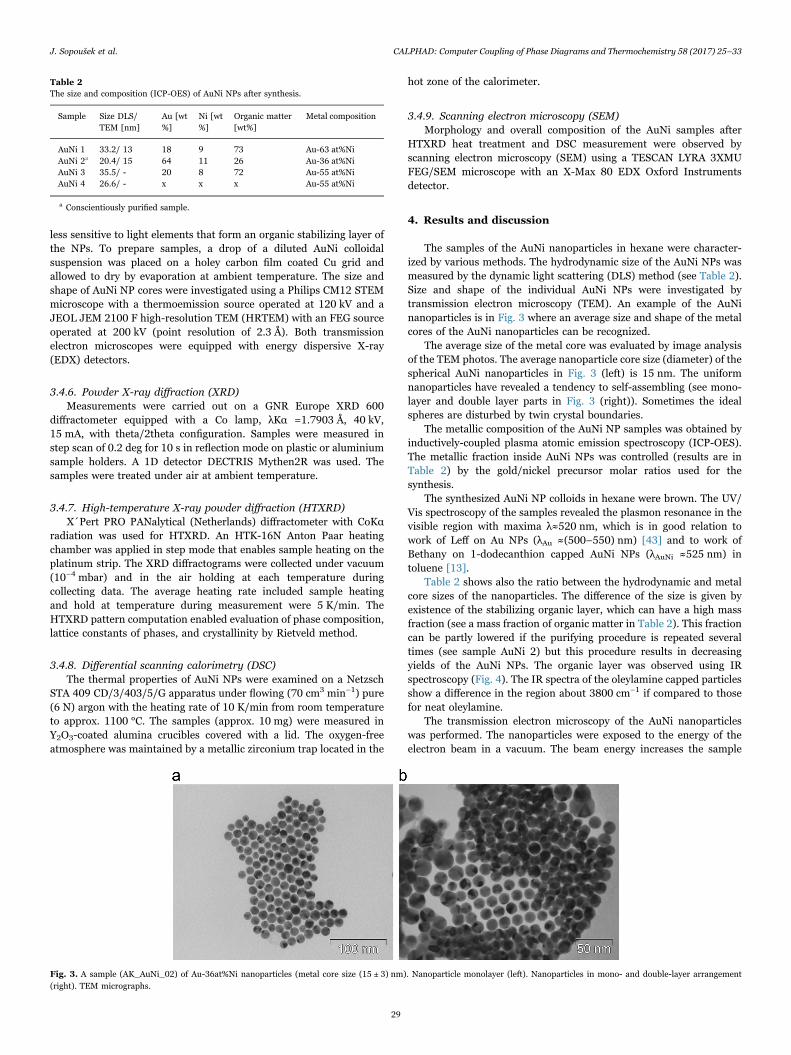
The samples of the AuNi nanoparticles in hexane were character-ized by various methods. The hydrodynamic size of the AuNi NPs wasmeasured by the dynamic light scattering (DLS) method (see Table 2).Size and shape of the individual AuNi NPs were investigated bytransmission electron microscopy (TEM). An example of the AuNinanoparticles is in Fig. 3 where an average size and shape of the metalcores of the AuNi nanoparticles can be recognized.
The average size of the metal core was evaluated by image analysisof the TEM photos. The average nanoparticle core size (diameter) of thespherical AuNi nanoparticles in Fig. 3 (left) is 15 nm. The uniformnanoparticles have revealed a tendency to self-assembling (see mono-layer and double layer parts in Fig. 3 (right)). Sometimes the idealspheres are disturbed by twin crystal boundaries.
The metallic composition of the AuNi NP samples was obtained byinductively-coupled plasma atomic emission spectroscopy (ICP-OES).The metallic fraction inside AuNi NPs was controlled (results are inTable 2) by the gold/nickel precursor molar ratios used for thesynthesis.
The synthesized AuNi NP colloids in hexane were brown. The UV/Vis spectroscopy of the samples revealed the plasmon resonance in thevisible region with maxima λ≈520 nm, which is in good relation towork of Leff on Au NPs (λAu ≈(500–550) nm) [43] and to work ofBethany on 1-dodecanthion capped AuNi NPs (λAuNi ≈525 nm) intoluene [13].
Table 2 shows also the ratio between the hydrodynamic and metalcore sizes of the nanoparticles. The difference of the size is given byexistence of the stabilizing organic layer, which can have a high massfraction (see a mass fraction of organic matter in Table 2). This fractioncan be partly lowered if the purifying procedure is repeated severaltimes (see sample AuNi 2) but this procedure results in decreasingyields of the AuNi NPs. The organic layer was observed using IRspectroscopy (Fig. 4). The IR spectra of the oleylamine capped particlesshow a difference in the region about 3800 cm−1 if compared to thosefor neat oleylamine.
The transmission electron microscopy of the AuNi nanoparticleswas performed. The nanoparticles were exposed to the energy of theelectron beam in a vacuum. The beam energy increases the sample
Table 2The size and composition (ICP-OES) of AuNi NPs after synthesis.
Sample Size DLS/TEM [nm]
Au [wt%]
Ni [wt%]
Organic matter[wt%]
Metal composition
AuNi 1 33.2/ 13 18 9 73 Au-63 at%NiAuNi 2a 20.4/ 15 64 11 26 Au-36 at%NiAuNi 3 35.5/ - 20 8 72 Au-55 at%NiAuNi 4 26.6/ - x x x Au-55 at%Ni
a Conscientiously purified sample.
Fig. 3. A sample (AK_AuNi_02) of Au-36at%Ni nanoparticles (metal core size (15 ± 3) nm). Nanoparticle monolayer (left). Nanoparticles in mono- and double-layer arrangement(right). TEM micrographs.
J. Sopoušek et al. CALPHAD: Computer Coupling of Phase Diagrams and Thermochemistry 58 (2017) 25–33
29
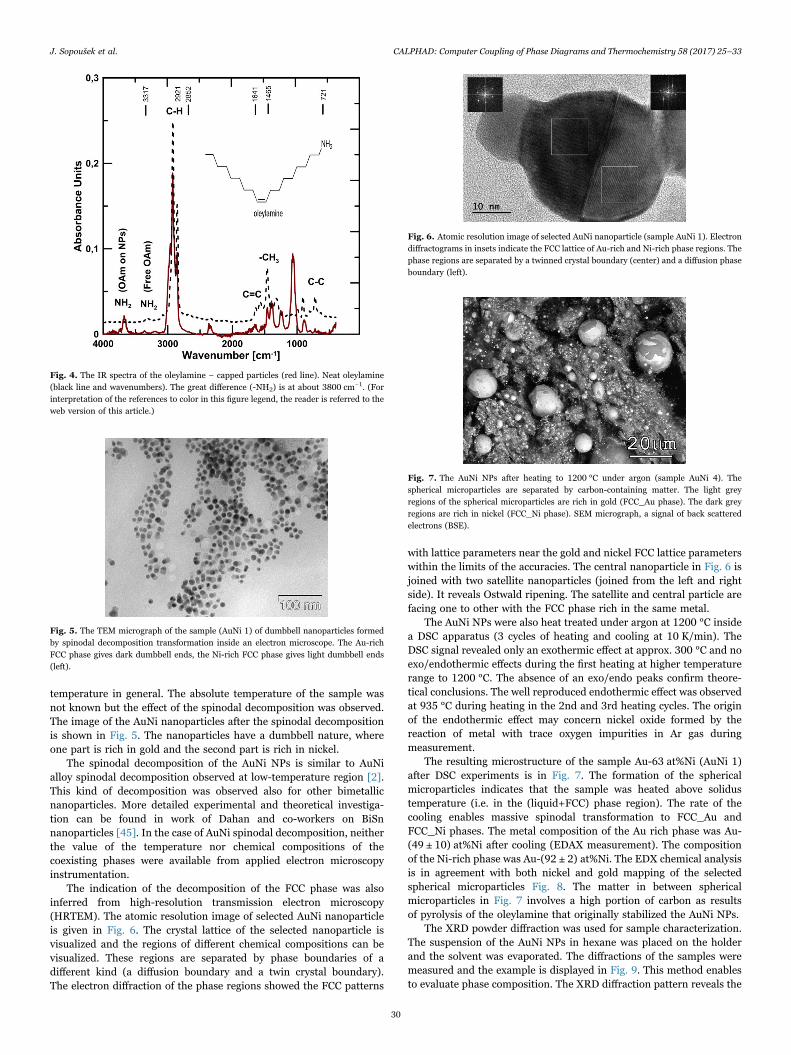
temperature in general. The absolute temperature of the sample wasnot known but the effect of the spinodal decomposition was observed.The image of the AuNi nanoparticles after the spinodal decompositionis shown in Fig. 5. The nanoparticles have a dumbbell nature, whereone part is rich in gold and the second part is rich in nickel.
The spinodal decomposition of the AuNi NPs is similar to AuNialloy spinodal decomposition observed at low-temperature region [2].This kind of decomposition was observed also for other bimetallicnanoparticles. More detailed experimental and theoretical investiga-tion can be found in work of Dahan and co-workers on BiSnnanoparticles [45]. In the case of AuNi spinodal decomposition, neitherthe value of the temperature nor chemical compositions of thecoexisting phases were available from applied electron microscopyinstrumentation.
The indication of the decomposition of the FCC phase was alsoinferred from high-resolution transmission electron microscopy(HRTEM). The atomic resolution image of selected AuNi nanoparticleis given in Fig. 6. The crystal lattice of the selected nanoparticle isvisualized and the regions of different chemical compositions can bevisualized. These regions are separated by phase boundaries of adifferent kind (a diffusion boundary and a twin crystal boundary).The electron diffraction of the phase regions showed the FCC patterns
with lattice parameters near the gold and nickel FCC lattice parameterswithin the limits of the accuracies. The central nanoparticle in Fig. 6 isjoined with two satellite nanoparticles (joined from the left and rightside). It reveals Ostwald ripening. The satellite and central particle arefacing one to other with the FCC phase rich in the same metal.
The AuNi NPs were also heat treated under argon at 1200 °C insidea DSC apparatus (3 cycles of heating and cooling at 10 K/min). TheDSC signal revealed only an exothermic effect at approx. 300 °C and noexo/endothermic effects during the first heating at higher temperaturerange to 1200 °C. The absence of an exo/endo peaks confirm theore-tical conclusions. The well reproduced endothermic effect was observedat 935 °C during heating in the 2nd and 3rd heating cycles. The originof the endothermic effect may concern nickel oxide formed by thereaction of metal with trace oxygen impurities in Ar gas duringmeasurement.
The resulting microstructure of the sample Au-63 at%Ni (AuNi 1)after DSC experiments is in Fig. 7. The formation of the sphericalmicroparticles indicates that the sample was heated above solidustemperature (i.e. in the (liquid+FCC) phase region). The rate of thecooling enables massive spinodal transformation to FCC_Au andFCC_Ni phases. The metal composition of the Au rich phase was Au-(49 ± 10) at%Ni after cooling (EDAX measurement). The compositionof the Ni-rich phase was Au-(92 ± 2) at%Ni. The EDX chemical analysisis in agreement with both nickel and gold mapping of the selectedspherical microparticles Fig. 8. The matter in between sphericalmicroparticles in Fig. 7 involves a high portion of carbon as resultsof pyrolysis of the oleylamine that originally stabilized the AuNi NPs.
The XRD powder diffraction was used for sample characterization.The suspension of the AuNi NPs in hexane was placed on the holderand the solvent was evaporated. The diffractions of the samples weremeasured and the example is displayed in Fig. 9. This method enablesto evaluate phase composition. The XRD diffraction pattern reveals the
Fig. 4. The IR spectra of the oleylamine − capped particles (red line). Neat oleylamine(black line and wavenumbers). The great difference (-NH2) is at about 3800 cm−1. (Forinterpretation of the references to color in this figure legend, the reader is referred to theweb version of this article.)
Fig. 5. The TEM micrograph of the sample (AuNi 1) of dumbbell nanoparticles formedby spinodal decomposition transformation inside an electron microscope. The Au-richFCC phase gives dark dumbbell ends, the Ni-rich FCC phase gives light dumbbell ends(left).
Fig. 6. Atomic resolution image of selected AuNi nanoparticle (sample AuNi 1). Electrondiffractograms in insets indicate the FCC lattice of Au-rich and Ni-rich phase regions. Thephase regions are separated by a twinned crystal boundary (center) and a diffusion phaseboundary (left).
Fig. 7. The AuNi NPs after heating to 1200 °C under argon (sample AuNi 4). Thespherical microparticles are separated by carbon-containing matter. The light greyregions of the spherical microparticles are rich in gold (FCC_Au phase). The dark greyregions are rich in nickel (FCC_Ni phase). SEM micrograph, a signal of back scatteredelectrons (BSE).
J. Sopoušek et al. CALPHAD: Computer Coupling of Phase Diagrams and Thermochemistry 58 (2017) 25–33
30
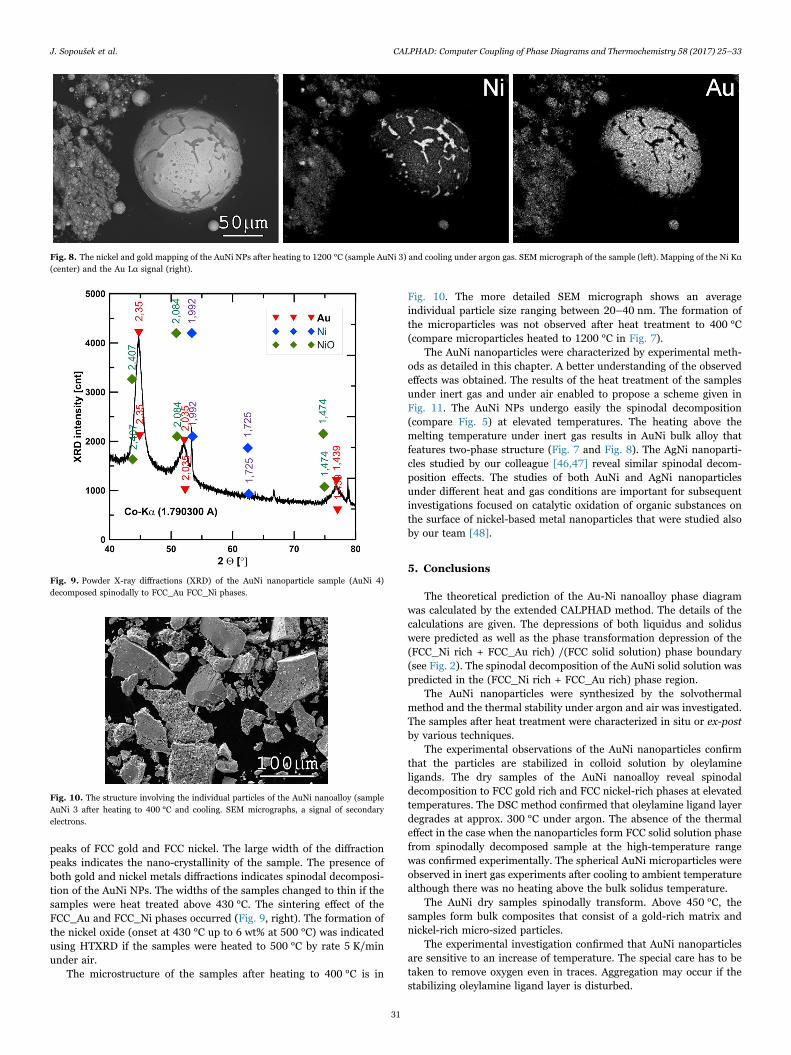
peaks of FCC gold and FCC nickel. The large width of the diffractionpeaks indicates the nano-crystallinity of the sample. The presence ofboth gold and nickel metals diffractions indicates spinodal decomposi-tion of the AuNi NPs. The widths of the samples changed to thin if thesamples were heat treated above 430 °C. The sintering effect of theFCC_Au and FCC_Ni phases occurred (Fig. 9, right). The formation ofthe nickel oxide (onset at 430 °C up to 6 wt% at 500 °C) was indicatedusing HTXRD if the samples were heated to 500 °C by rate 5 K/minunder air.
The microstructure of the samples after heating to 400 °C is in
Fig. 10. The more detailed SEM micrograph shows an averageindividual particle size ranging between 20–40 nm. The formation ofthe microparticles was not observed after heat treatment to 400 °C(compare microparticles heated to 1200 °C in Fig. 7).
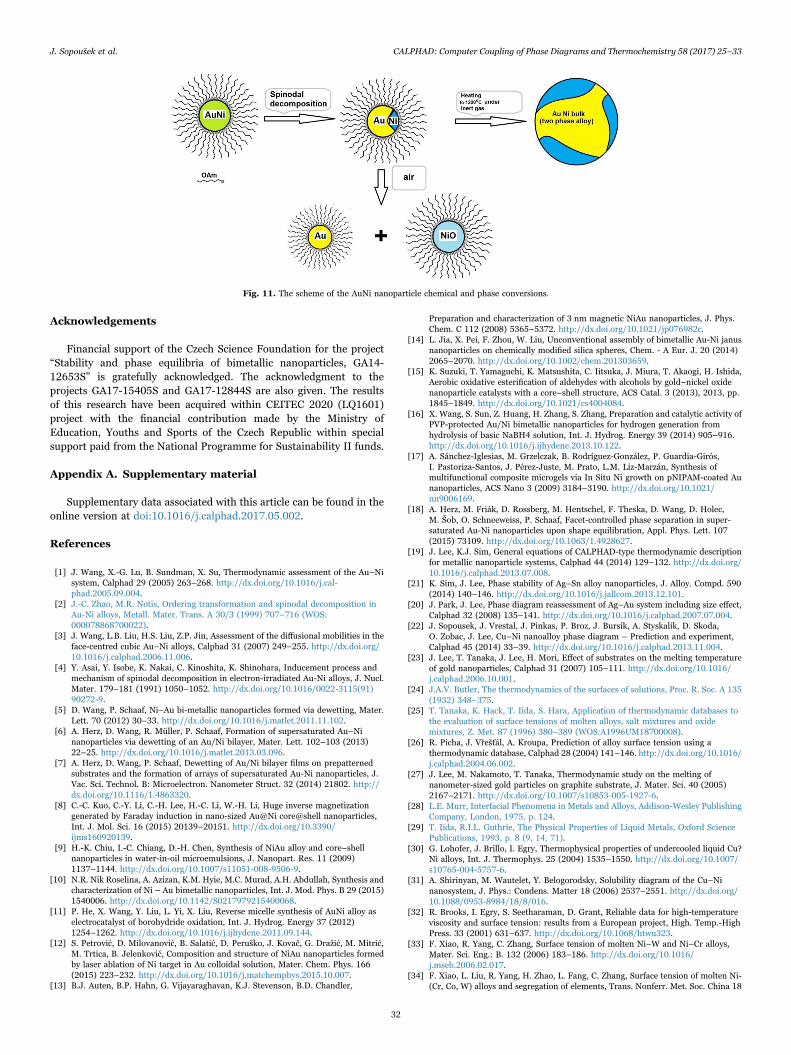
The AuNi nanoparticles were characterized by experimental meth-ods as detailed in this chapter. A better understanding of the observedeffects was obtained. The results of the heat treatment of the samplesunder inert gas and under air enabled to propose a scheme given inFig. 11. The AuNi NPs undergo easily the spinodal decomposition(compare Fig. 5) at elevated temperatures. The heating above themelting temperature under inert gas results in AuNi bulk alloy thatfeatures two-phase structure (Fig. 7 and Fig. 8). The AgNi nanoparti-cles studied by our colleague [46,47] reveal similar spinodal decom-position effects. The studies of both AuNi and AgNi nanoparticlesunder different heat and gas conditions are important for subsequentinvestigations focused on catalytic oxidation of organic substances onthe surface of nickel-based metal nanoparticles that were studied alsoby our team [48].
5. Conclusions
The theoretical prediction of the Au-Ni nanoalloy phase diagramwas calculated by the extended CALPHAD method. The details of thecalculations are given. The depressions of both liquidus and soliduswere predicted as well as the phase transformation depression of the(FCC_Ni rich + FCC_Au rich) /(FCC solid solution) phase boundary(see Fig. 2). The spinodal decomposition of the AuNi solid solution waspredicted in the (FCC_Ni rich + FCC_Au rich) phase region.
The AuNi nanoparticles were synthesized by the solvothermalmethod and the thermal stability under argon and air was investigated.The samples after heat treatment were characterized in situ or ex-postby various techniques.
The experimental observations of the AuNi nanoparticles confirmthat the particles are stabilized in colloid solution by oleylamineligands. The dry samples of the AuNi nanoalloy reveal spinodaldecomposition to FCC gold rich and FCC nickel-rich phases at elevatedtemperatures. The DSC method confirmed that oleylamine ligand layerdegrades at approx. 300 °C under argon. The absence of the thermaleffect in the case when the nanoparticles form FCC solid solution phasefrom spinodally decomposed sample at the high-temperature rangewas confirmed experimentally. The spherical AuNi microparticles wereobserved in inert gas experiments after cooling to ambient temperaturealthough there was no heating above the bulk solidus temperature.
The AuNi dry samples spinodally transform. Above 450 °C, thesamples form bulk composites that consist of a gold-rich matrix andnickel-rich micro-sized particles.
The experimental investigation confirmed that AuNi nanoparticlesare sensitive to an increase of temperature. The special care has to betaken to remove oxygen even in traces. Aggregation may occur if thestabilizing oleylamine ligand layer is disturbed.
Fig. 8. The nickel and gold mapping of the AuNi NPs after heating to 1200 °C (sample AuNi 3) and cooling under argon gas. SEM micrograph of the sample (left). Mapping of the Ni Kα(center) and the Au Lα signal (right).
Fig. 9. Powder X-ray diffractions (XRD) of the AuNi nanoparticle sample (AuNi 4)decomposed spinodally to FCC_Au FCC_Ni phases.
Fig. 10. The structure involving the individual particles of the AuNi nanoalloy (sampleAuNi 3 after heating to 400 °C and cooling. SEM micrographs, a signal of secondaryelectrons.
J. Sopoušek et al. CALPHAD: Computer Coupling of Phase Diagrams and Thermochemistry 58 (2017) 25–33
31
Acknowledgements
Financial support of the Czech Science Foundation for the project“Stability and phase equilibria of bimetallic nanoparticles, GA14-12653S” is gratefully acknowledged. The acknowledgment to theprojects GA17-15405S and GA17-12844S are also given. The resultsof this research have been acquired within CEITEC 2020 (LQ1601)project with the financial contribution made by the Ministry ofEducation, Youths and Sports of the Czech Republic within specialsupport paid from the National Programme for Sustainability II funds.
Appendix A. Supplementary material
Supplementary data associated with this article can be found in theonline version at doi:10.1016/j.calphad.2017.05.002.
References
[1] J. Wang, X.-G. Lu, B. Sundman, X. Su, Thermodynamic assessment of the Au–Nisystem, Calphad 29 (2005) 263–268. http://dx.doi.org/10.1016/j.cal-phad.2005.09.004.
[2] J.-C. Zhao, M.R. Notis, Ordering transformation and spinodal decomposition inAu-Ni alloys, Metall. Mater. Trans. A 30/3 (1999) 707–716 (WOS:000078868700022).
[3] J. Wang, L.B. Liu, H.S. Liu, Z.P. Jin, Assessment of the diffusional mobilities in theface-centred cubic Au–Ni alloys, Calphad 31 (2007) 249–255. http://dx.doi.org/10.1016/j.calphad.2006.11.006.
[4] Y. Asai, Y. Isobe, K. Nakai, C. Kinoshita, K. Shinohara, Inducement process andmechanism of spinodal decomposition in electron-irradiated Au-Ni alloys, J. Nucl.Mater. 179–181 (1991) 1050–1052. http://dx.doi.org/10.1016/0022-3115(91)90272-9.
[5] D. Wang, P. Schaaf, Ni–Au bi-metallic nanoparticles formed via dewetting, Mater.Lett. 70 (2012) 30–33. http://dx.doi.org/10.1016/j.matlet.2011.11.102.
[6] A. Herz, D. Wang, R. Müller, P. Schaaf, Formation of supersaturated Au–Ninanoparticles via dewetting of an Au/Ni bilayer, Mater. Lett. 102–103 (2013)22–25. http://dx.doi.org/10.1016/j.matlet.2013.03.096.
[7] A. Herz, D. Wang, P. Schaaf, Dewetting of Au/Ni bilayer films on prepatternedsubstrates and the formation of arrays of supersaturated Au-Ni nanoparticles, J.Vac. Sci. Technol. B: Microelectron. Nanometer Struct. 32 (2014) 21802. http://dx.doi.org/10.1116/1.4863320.
[8] C.-C. Kuo, C.-Y. Li, C.-H. Lee, H.-C. Li, W.-H. Li, Huge inverse magnetizationgenerated by Faraday induction in nano-sized Au@Ni core@shell nanoparticles,Int. J. Mol. Sci. 16 (2015) 20139–20151. http://dx.doi.org/10.3390/ijms160920139.
[9] H.-K. Chiu, I.-C. Chiang, D.-H. Chen, Synthesis of NiAu alloy and core–shellnanoparticles in water-in-oil microemulsions, J. Nanopart. Res. 11 (2009)1137–1144. http://dx.doi.org/10.1007/s11051-008-9506-9.
[10] N.R. Nik Roselina, A. Azizan, K.M. Hyie, M.C. Murad, A.H. Abdullah, Synthesis andcharacterization of Ni – Au bimetallic nanoparticles, Int. J. Mod. Phys. B 29 (2015)1540006. http://dx.doi.org/10.1142/S0217979215400068.
[11] P. He, X. Wang, Y. Liu, L. Yi, X. Liu, Reverse micelle synthesis of AuNi alloy aselectrocatalyst of borohydride oxidation, Int. J. Hydrog. Energy 37 (2012)1254–1262. http://dx.doi.org/10.1016/j.ijhydene.2011.09.144.
[12] S. Petrović, D. Milovanović, B. Salatić, D. Peruško, J. Kovač, G. Dražić, M. Mitrić,M. Trtica, B. Jelenković, Composition and structure of NiAu nanoparticles formedby laser ablation of Ni target in Au colloidal solution, Mater. Chem. Phys. 166(2015) 223–232. http://dx.doi.org/10.1016/j.matchemphys.2015.10.007.
[13] B.J. Auten, B.P. Hahn, G. Vijayaraghavan, K.J. Stevenson, B.D. Chandler,
Preparation and characterization of 3 nm magnetic NiAu nanoparticles, J. Phys.Chem. C 112 (2008) 5365–5372. http://dx.doi.org/10.1021/jp076982c.
[14] L. Jia, X. Pei, F. Zhou, W. Liu, Unconventional assembly of bimetallic Au-Ni janusnanoparticles on chemically modified silica spheres, Chem. - A Eur. J. 20 (2014)2065–2070. http://dx.doi.org/10.1002/chem.201303659.
[15] K. Suzuki, T. Yamaguchi, K. Matsushita, C. Iitsuka, J. Miura, T. Akaogi, H. Ishida,Aerobic oxidative esterification of aldehydes with alcohols by gold–nickel oxidenanoparticle catalysts with a core–shell structure, ACS Catal. 3 (2013), 2013, pp.1845–1849. http://dx.doi.org/10.1021/cs4004084.
[16] X. Wang, S. Sun, Z. Huang, H. Zhang, S. Zhang, Preparation and catalytic activity ofPVP-protected Au/Ni bimetallic nanoparticles for hydrogen generation fromhydrolysis of basic NaBH4 solution, Int. J. Hydrog. Energy 39 (2014) 905–916.http://dx.doi.org/10.1016/j.ijhydene.2013.10.122.
[17] A. Sánchez-Iglesias, M. Grzelczak, B. Rodríguez-González, P. Guardia-Girós,I. Pastoriza-Santos, J. Pérez-Juste, M. Prato, L.M. Liz-Marzán, Synthesis ofmultifunctional composite microgels via In Situ Ni growth on pNIPAM-coated Aunanoparticles, ACS Nano 3 (2009) 3184–3190. http://dx.doi.org/10.1021/nn9006169.
[18] A. Herz, M. Friák, D. Rossberg, M. Hentschel, F. Theska, D. Wang, D. Holec,M. Šob, O. Schneeweiss, P. Schaaf, Facet-controlled phase separation in super-saturated Au-Ni nanoparticles upon shape equilibration, Appl. Phys. Lett. 107(2015) 73109. http://dx.doi.org/10.1063/1.4928627.
[19] J. Lee, K.J. Sim, General equations of CALPHAD-type thermodynamic descriptionfor metallic nanoparticle systems, Calphad 44 (2014) 129–132. http://dx.doi.org/10.1016/j.calphad.2013.07.008.
[21] K. Sim, J. Lee, Phase stability of Ag–Sn alloy nanoparticles, J. Alloy. Compd. 590(2014) 140–146. http://dx.doi.org/10.1016/j.jallcom.2013.12.101.
[20] J. Park, J. Lee, Phase diagram reassessment of Ag–Au system including size effect,Calphad 32 (2008) 135–141. http://dx.doi.org/10.1016/j.calphad.2007.07.004.
[22] J. Sopousek, J. Vrestal, J. Pinkas, P. Broz, J. Bursik, A. Styskalik, D. Skoda,O. Zobac, J. Lee, Cu–Ni nanoalloy phase diagram – Prediction and experiment,Calphad 45 (2014) 33–39. http://dx.doi.org/10.1016/j.calphad.2013.11.004.
[23] J. Lee, T. Tanaka, J. Lee, H. Mori, Effect of substrates on the melting temperatureof gold nanoparticles, Calphad 31 (2007) 105–111. http://dx.doi.org/10.1016/j.calphad.2006.10.001.
[24] J.A.V. Butler, The thermodynamics of the surfaces of solutions, Proc. R. Soc. A 135(1932) 348–375.
[25] T. Tanaka, K. Hack, T. Iida, S. Hara, Application of thermodynamic databases tothe evaluation of surface tensions of molten alloys, salt mixtures and oxidemixtures, Z. Met. 87 (1996) 380–389 (WOS:A1996UM18700008).
[26] R. Picha, J. Vřešťál, A. Kroupa, Prediction of alloy surface tension using athermodynamic database, Calphad 28 (2004) 141–146. http://dx.doi.org/10.1016/j.calphad.2004.06.002.
[27] J. Lee, M. Nakamoto, T. Tanaka, Thermodynamic study on the melting ofnanometer-sized gold particles on graphite substrate, J. Mater. Sci. 40 (2005)2167–2171. http://dx.doi.org/10.1007/s10853-005-1927-6.
[28] L.E. Murr, Interfacial Phenomena in Metals and Alloys, Addison-Wesley PublishingCompany, London, 1975, p. 124.
[29] T. Iida, R.I.L. Guthrie, The Physical Properties of Liquid Metals, Oxford SciencePublications, 1993, p. 8 (9, 14, 71).
[30] G. Lohofer, J. Brillo, I. Egry, Thermophysical properties of undercooled liquid Cu?Ni alloys, Int. J. Thermophys. 25 (2004) 1535–1550. http://dx.doi.org/10.1007/s10765-004-5757-6.
[31] A. Shirinyan, M. Wautelet, Y. Belogorodsky, Solubility diagram of the Cu–Ninanosystem, J. Phys.: Condens. Matter 18 (2006) 2537–2551. http://dx.doi.org/10.1088/0953-8984/18/8/016.
[32] R. Brooks, I. Egry, S. Seetharaman, D. Grant, Reliable data for high-temperatureviscosity and surface tension: results from a European project, High. Temp.-HighPress. 33 (2001) 631–637. http://dx.doi.org/10.1068/htwu323.
[33] F. Xiao, R. Yang, C. Zhang, Surface tension of molten Ni–W and Ni–Cr alloys,Mater. Sci. Eng.: B. 132 (2006) 183–186. http://dx.doi.org/10.1016/j.mseb.2006.02.017.
[34] F. Xiao, L. Liu, R. Yang, H. Zhao, L. Fang, C. Zhang, Surface tension of molten Ni-(Cr, Co, W) alloys and segregation of elements, Trans. Nonferr. Met. Soc. China 18
Fig. 11. The scheme of the AuNi nanoparticle chemical and phase conversions.
J. Sopoušek et al. CALPHAD: Computer Coupling of Phase Diagrams and Thermochemistry 58 (2017) 25–33
32
(2008) 1184–1188. http://dx.doi.org/10.1016/S1003-6326(08)60202-2.[35] H.Y. Hou, G.L. Chen, G. Chen, Y.L. Shao, A molecular dynamics simulation on
surface tension of liquid Ni and Cu, Comput. Mater. Sci. 46 (2009) 516–519.http://dx.doi.org/10.1016/j.commatsci.2009.04.001.
[36] S.D. Korkmaz, ş. Korkmaz, Investigation of surface properties of liquid transitionmetals: surface tension and surface entropy, Appl. Surf. Sci. 257 (2010) 261–265.http://dx.doi.org/10.1016/j.apsusc.2010.06.082.
[37] J. Brillo, I. Egry, Surface tension of nickel, copper, iron and their binary alloys, J.Mater. Sci. 40 (2005) 2213–2216. http://dx.doi.org/10.1007/s10853-005-1935-6.
[38] W.H. Qi, M.P. Wang, Q.H. Liu, Shape factor of nonspherical nanoparticles, J.Mater. Sci. 40 (2005) 2737–2739. http://dx.doi.org/10.1007/s10853-005-2119-0.
[39] J.-G. Lee, H. Mori, H. Yasuda, In situ high-resolution electron microscopeobservation of phase change in nanometer-sized alloy particles, J. Mater. Res. 20(2005) 1708–1721. http://dx.doi.org/10.1557/JMR.2005.0223.
[40] G. Guisbiers, M. Wautelet, Size, shape and stress effects on the melting temperatureof nano-polyhedral grains on a substrate, Nanotechnology 17 (2006) 2008–2011.http://dx.doi.org/10.1088/0957-4484/17/8/036.
[41] A. Zhang, Z. Zhu, Y. He, G. Ouyang, Structure stabilities and transitions inpolyhedral metal nanocrystals: an atomic-bond-relaxation approach, Appl. Phys.Lett. 100 (2012) 171912. http://dx.doi.org/10.1063/1.4706260.
[42] E. Ringe, R.P. Van Duyne, L.D. Marks, Wulff construction for alloy nanoparticles,Nano Lett. 11 (2011) 3399–3403. http://dx.doi.org/10.1021/nl2018146.
[43] D.V. Leff, L. Brandt, J.R. Heath, Synthesis and characterization of hydrophobic,organically-soluble gold nanocrystals functionalized with primary amines,Langmuir 12 (1996) 4723–4730. http://dx.doi.org/10.1021/la960445u.
[44] J. Sopoušek, J. Pinkas, P. Brož, J. Buršík, V. Vykoukal, D. Škoda, A. Stýskalík,O. Zobač, J. Vřešťál, A. Hrdlička, J. Šimbera, Ag-Cu colloid synthesis: bimetallicnanoparticle characterisation and thermal treatment, J. Nanomater. 2014 (2014)1–13. http://dx.doi.org/10.1155/2014/638964.
[45] Y. Dahan, G. Makov, R.Z. Shneck, Nanometric size dependent phase diagram of Bi–Sn, Calphad 53 (2016) 136–145. http://dx.doi.org/10.1016/j.cal-phad.2016.04.006.
[46] Vit, Vykoukal, Jiri Bursik, Pavla Roupcova, Jiri, Pinkas, ‘Solvothermal hot injectionsynthesis of AgNi nanoalloy‘, conference proceedings Nanotech France, 2016.
[47] Vit Vykoukal, Jiri Bursik, Pavla Roupcova, Jiri Pinkas, ‘Solvothermal Hot InjectionSynthesis of AgNi Nanoalloy‘, manuscript in preparation.
[48] P. Brož, M. Hejduková, V. Vykoukal, F. Zelenka, J. Sopoušek, J. Buršík, O. Zobač:Study of surface effects and catalytic properties of selected Ni-based bimetallicnanoparticles by Knudsen effusion mass spectrometry, Calphad, prepared forpublication.
J. Sopoušek et al. CALPHAD: Computer Coupling of Phase Diagrams and Thermochemistry 58 (2017) 25–33
33