attributable risk hss4303b march 25, 2010 erin russell msc. candidate, epidemiology
TRANSCRIPT
Attributable Risk
HSS4303B
March 25, 2010
Erin Russell
MSc. Candidate, Epidemiology
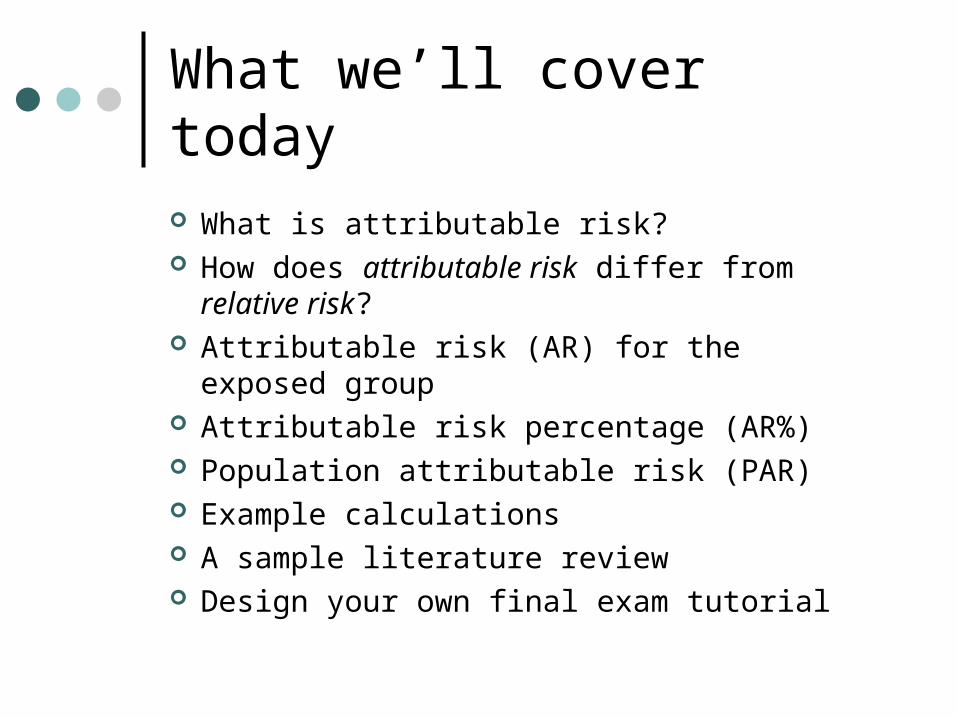
What we’ll cover today
What is attributable risk? How does attributable risk differ from
relative risk? Attributable risk (AR) for the exposed group Attributable risk percentage (AR%) Population attributable risk (PAR) Example calculations A sample literature review Design your own final exam tutorial

What is Attributable Risk?
AKA - Measure of impact The amount or proportion of disease
incidence (or disease risk) that can be attributed to a specific exposure.
For example, “How much of the lung cancer risk experienced by smokers can be attributed to smoking?”
In practice, “How much of the risk (incidence) of disease can we hope to prevent if we eliminate exposure to the agent in question?”

Relative vs. Attributable Risk
Relative risk is important as a measure of the strength of the association Important in establishing etiological
relationships Attributable risk is more about: “How much
of the disease that occurs can be attributed to a certain exposure?” Important in clinical practice and public
health
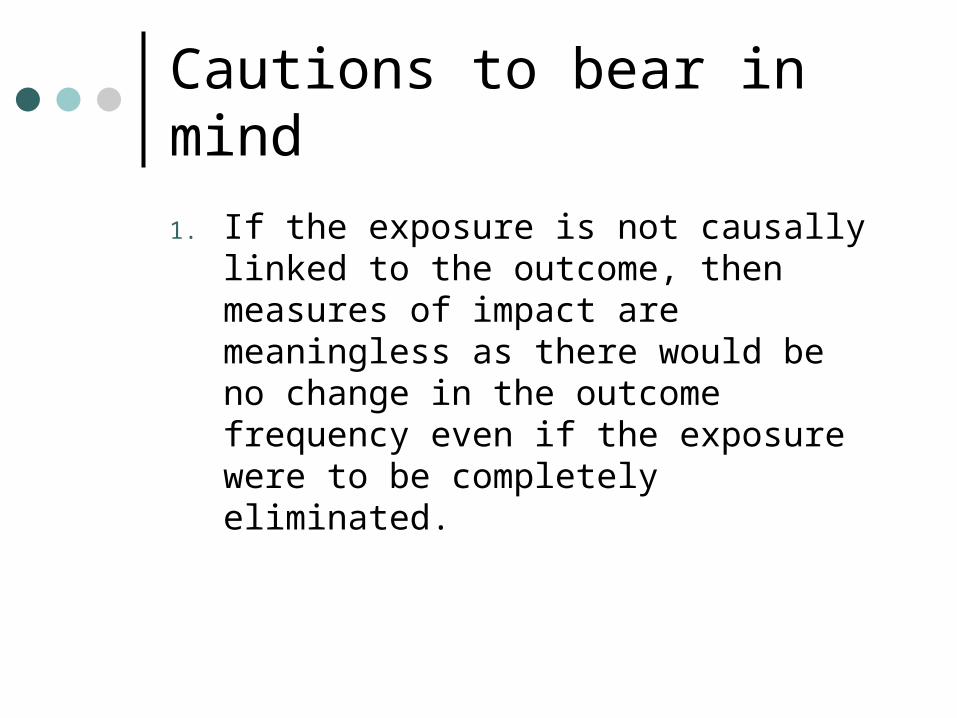
Cautions to bear in mind
1. If the exposure is not causally linked to the outcome, then measures of impact are meaningless as there would be no change in the outcome frequency even if the exposure were to be completely eliminated.
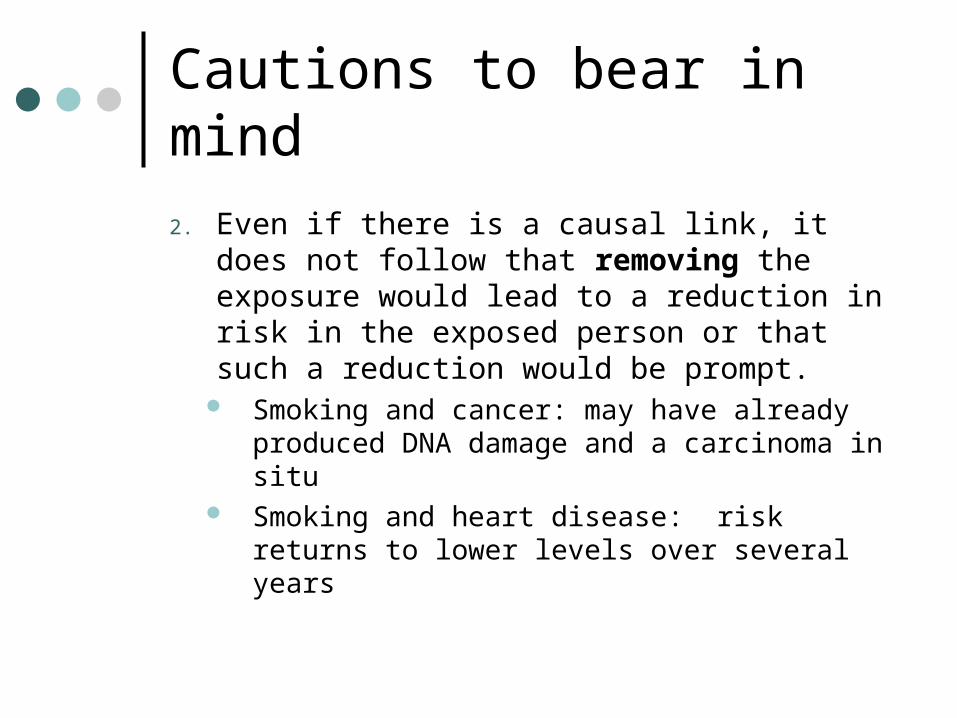
Cautions to bear in mind
2. Even if there is a causal link, it does not follow that removing the exposure would lead to a reduction in risk in the exposed person or that such a reduction would be prompt.
Smoking and cancer: may have already produced DNA damage and a carcinoma in situ
Smoking and heart disease: risk returns to lower levels over several years
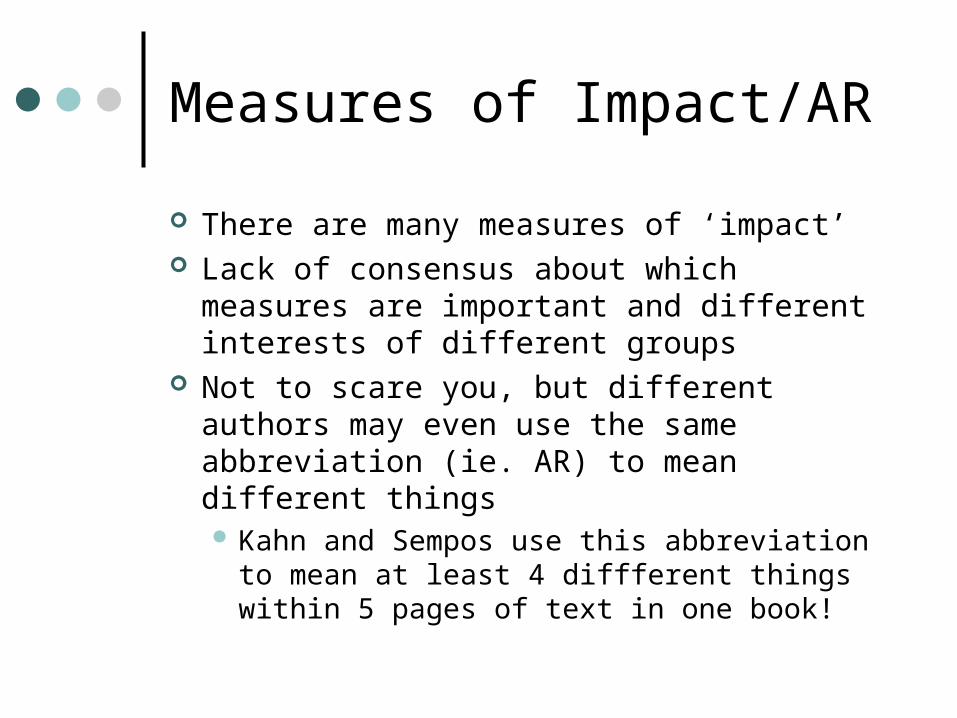
Measures of Impact/AR
There are many measures of ‘impact’ Lack of consensus about which measures
are important and different interests of different groups
Not to scare you, but different authors may even use the same abbreviation (ie. AR) to mean different things Kahn and Sempos use this abbreviation to
mean at least 4 diffferent things within 5 pages of text in one book!

Attributable Risk (AR) - Exposed This is simply the risk difference between
the Cumulative Incidences for the two groups:
AR = CIExposed – CIUnexposed

Attributable Risk Percentage (AR%) This is also called the Attributable Risk
Fraction, the Etiologic Fraction Exposed, and the Attributable Fraction Exposed.
Whatever you call it, this number refers to the proportion of the risk among the exposed population which could be attributed to the exposure:
AR% = CI1 – CI0
CI1

Population Attributable Risk Percentage (AR(P)) This is also called the Attributable Risk
(Population), the Etiologic Fraction Population, and the Population Attributable Fraction Proportion.
It refers to the entire population (including both exposed and unexposed people)
It gives the proportion of the outcome risk in the entire population which could be attributed to the people who were exposed.

Population Attributable Risk Percentage (AR(P))
The value of the AR(P) depends on:a) What proportion of the population
has been exposed.
b) The extent to which exposure increases risk.
AR(P) = CItotal – CIunexposed
CItotal
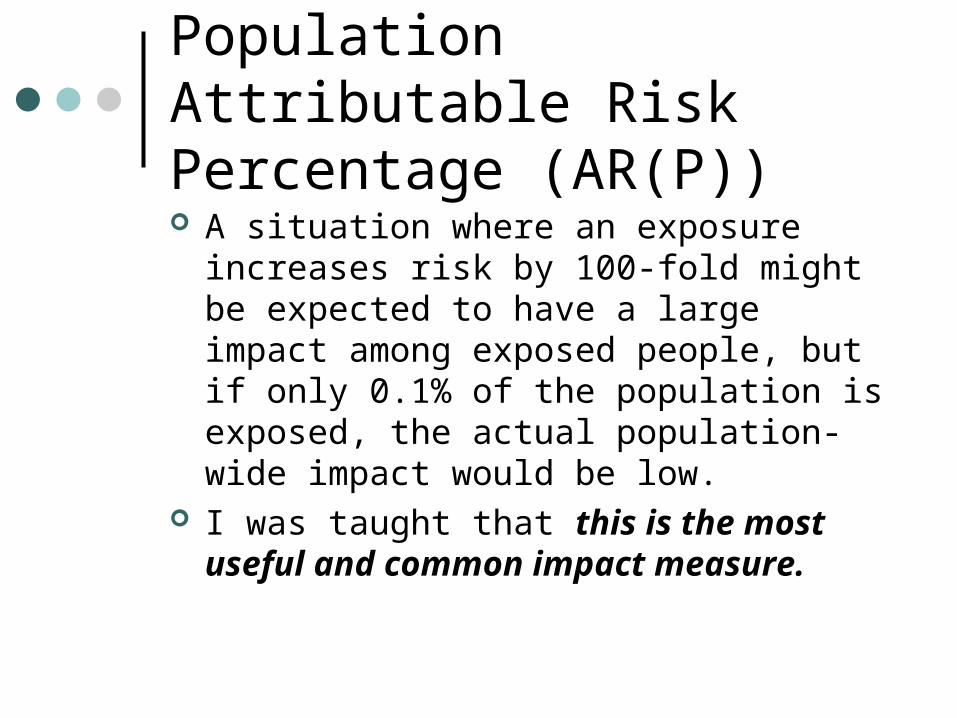
Population Attributable Risk Percentage (AR(P)) A situation where an exposure increases
risk by 100-fold might be expected to have a large impact among exposed people, but if only 0.1% of the population is exposed, the actual population-wide impact would be low.
I was taught that this is the most useful and common impact measure.
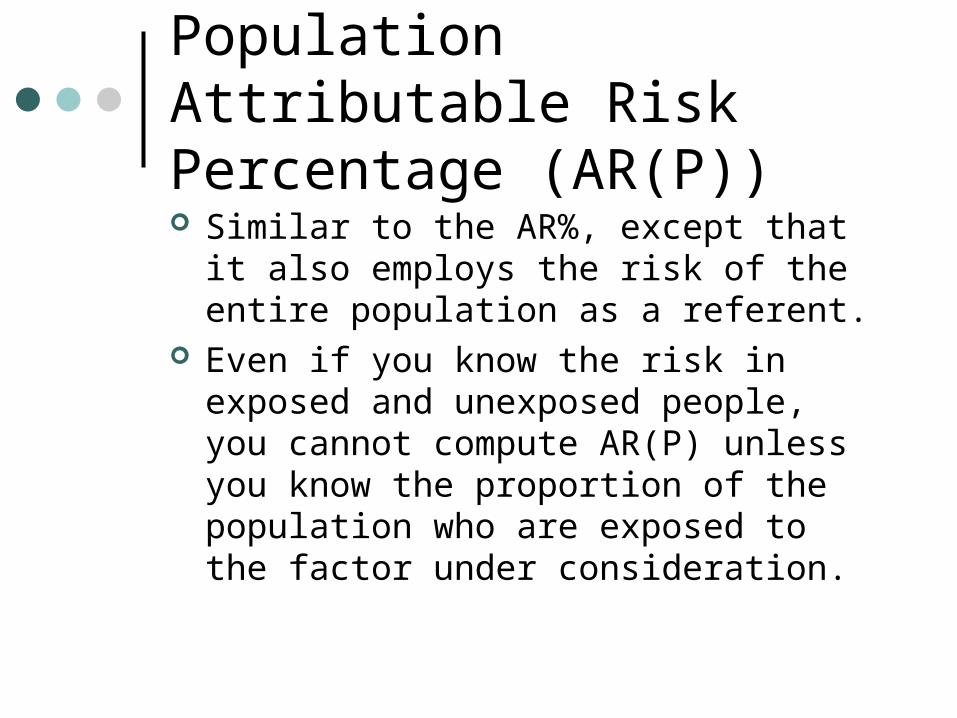
Population Attributable Risk Percentage (AR(P)) Similar to the AR%, except that it also
employs the risk of the entire population as a referent.
Even if you know the risk in exposed and unexposed people, you cannot compute AR(P) unless you know the proportion of the population who are exposed to the factor under consideration.
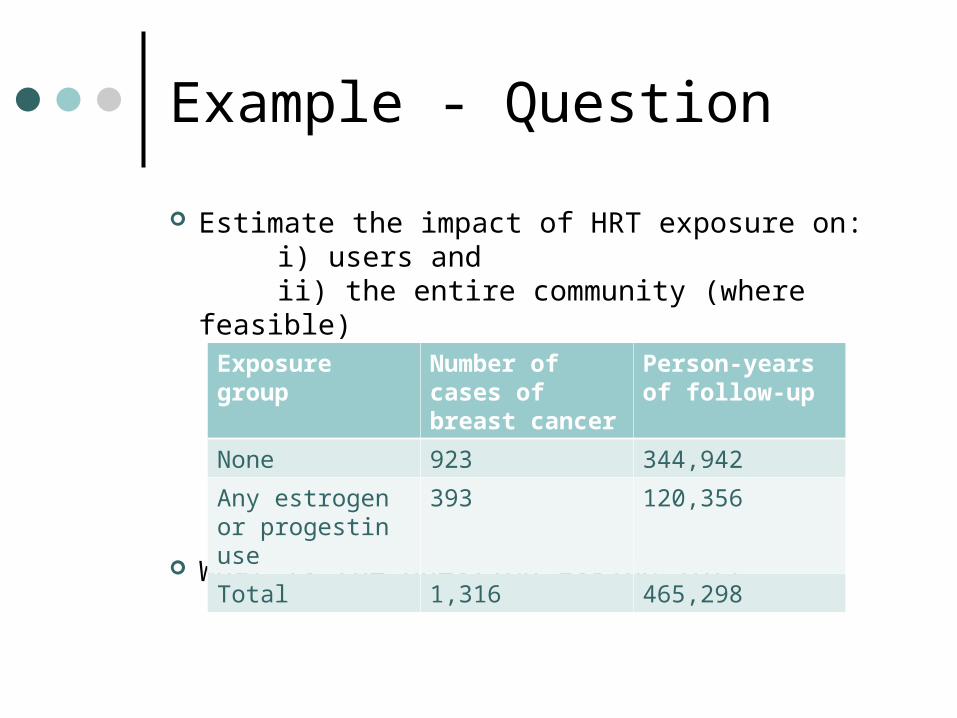
Example - Question
Estimate the impact of HRT exposure on: i) users and ii) the entire community (where feasible)
What is the question asking for?
Exposure group Number of cases of breast cancer
Person-years of follow-up
None 923 344,942
Any estrogen or progestin use
393 120,356
Total 1,316 465,298

Example – Step one
AR = CI1 – CI0
= 393/120356 - 923/344,942
= 3.265/1000 PYs – 2.676/1000 PYs
= 58.9 cases/100,000 person-years
Exposure group Number of cases of breast cancer
Person-years of follow-up
None 923 344,942
Any estrogen or progestin use
393 120,356
Total 1,316 465,298
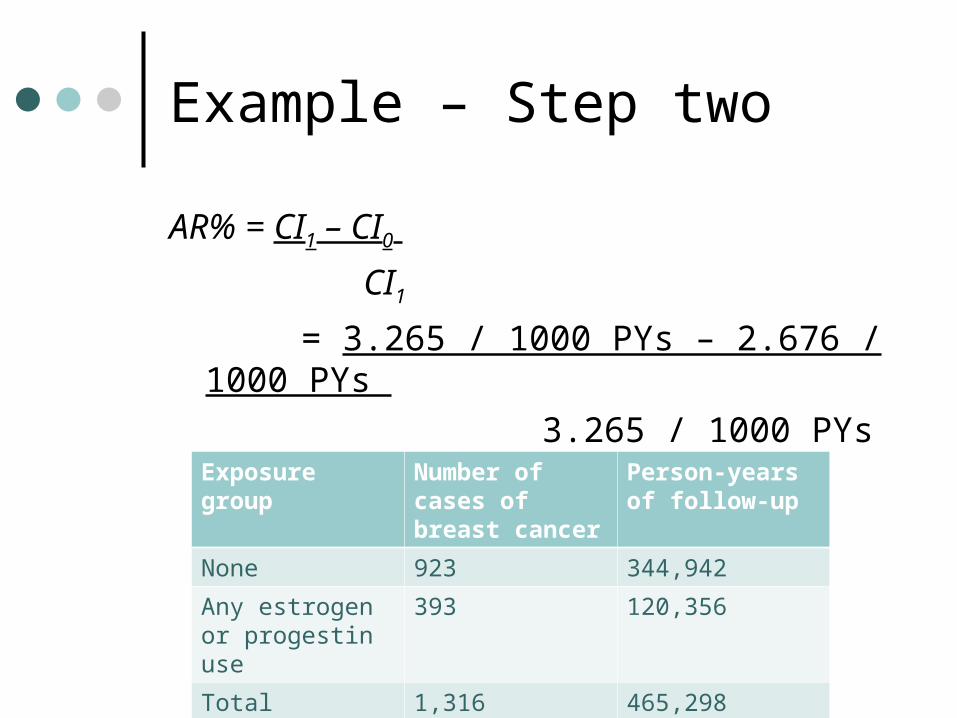
Example – Step two
AR% = CI1 – CI0
CI1
= 3.265 / 1000 PYs – 2.676 / 1000 PYs
3.265 / 1000 PYs
= 18.0%Exposure group Number of cases of breast cancer
Person-years of follow-up
None 923 344,942
Any estrogen or progestin use
393 120,356
Total 1,316 465,298
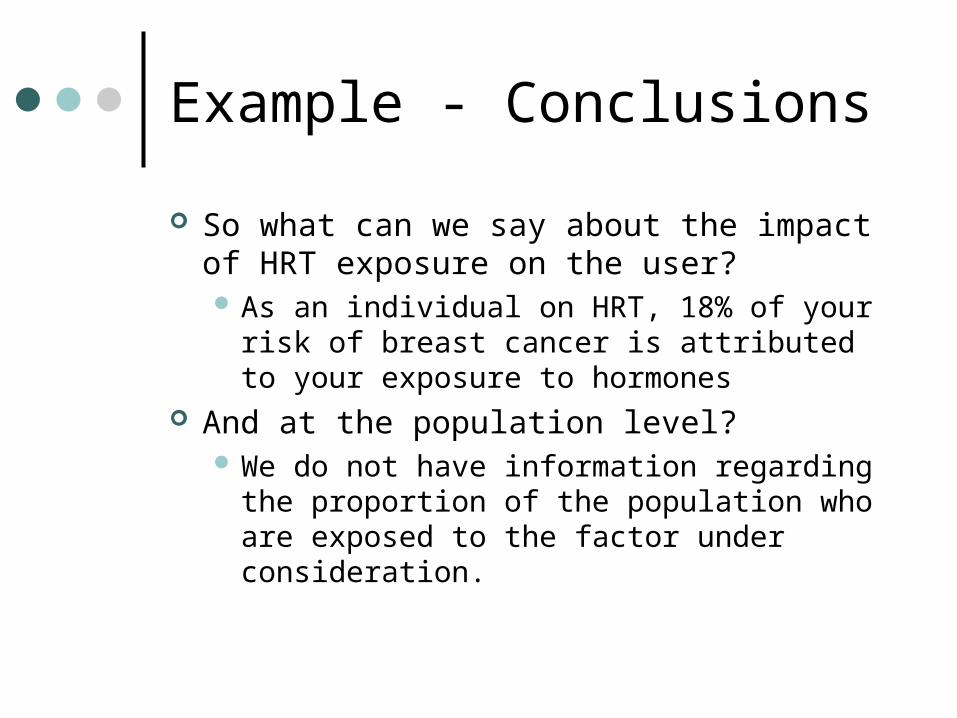
Example - Conclusions
So what can we say about the impact of HRT exposure on the user? As an individual on HRT, 18% of your risk of
breast cancer is attributed to your exposure to hormones
And at the population level? We do not have information regarding the
proportion of the population who are exposed to the factor under consideration.

Your posters are due in 16 days, do you know what you’re doing?
If not, how can I help?

Question and protocol development
Knowledge syntheses use rigorous scientific methods to identify, assess and synthesize the available evidence (worldwide)
Consult widely to ensure that the review is relevant and addresses the needs of different potential stakeholder audiences

Why have a protocol?
Literature reviews are scientific research
Plan methods Reduce bias Avoid duplication of effort Rest of review follows
Focus for thinking about reviewPlanning and allocating tasks

Developing a protocol
1. Title/review authors
2. Background
3. Objectives
4. Selection criteria
5. Search Strategy
6. Methods

Review authors
Technical expertise Content expertise Organizational expertise Knowledge users
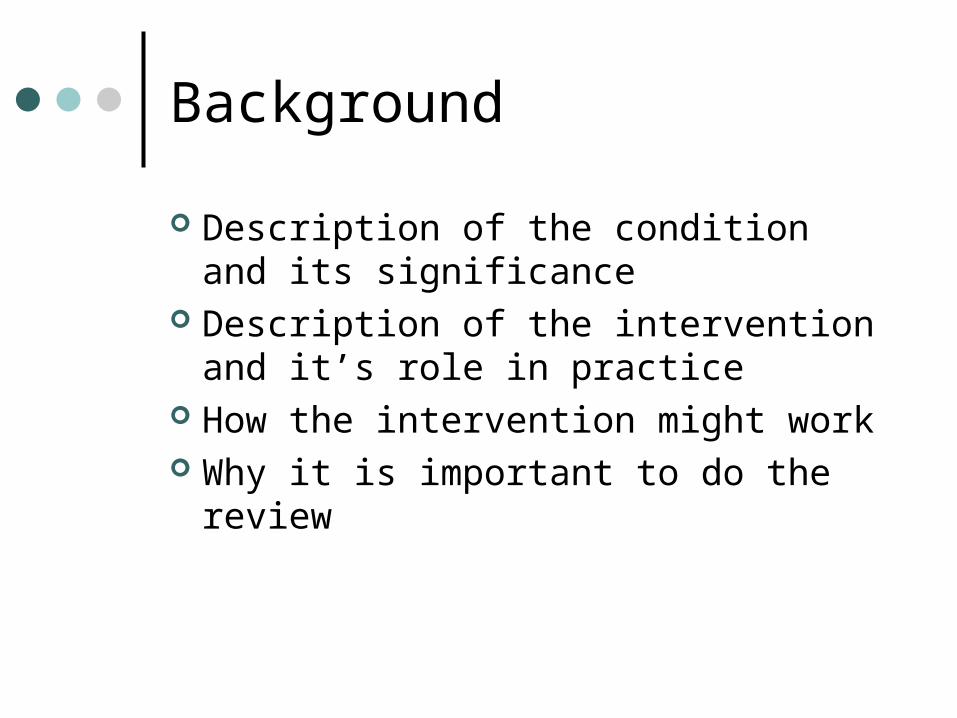
Background
Description of the condition and its significance
Description of the intervention and it’s role in practice
How the intervention might work Why it is important to do the review

Objectives
Follow naturally from the background What are the questions? Questions should be clearly framed

Selection criteria
Help you design the search Selecting studies Start thinking about the analysis One way to minimize bias Follow naturally from the objectives
P – population I – Intervention C – comparison O – outcomes S – setting C - context

Diverse synthesis questions
What are the benefits, harms, and costs of treatment x?
What are the benefits, harms, and costs of a new delivery service configuration?
What is the accuracy of diagnostic test y? Does use of diagnostic test y lead to better
outcomes? What is the prevalence of condition a?
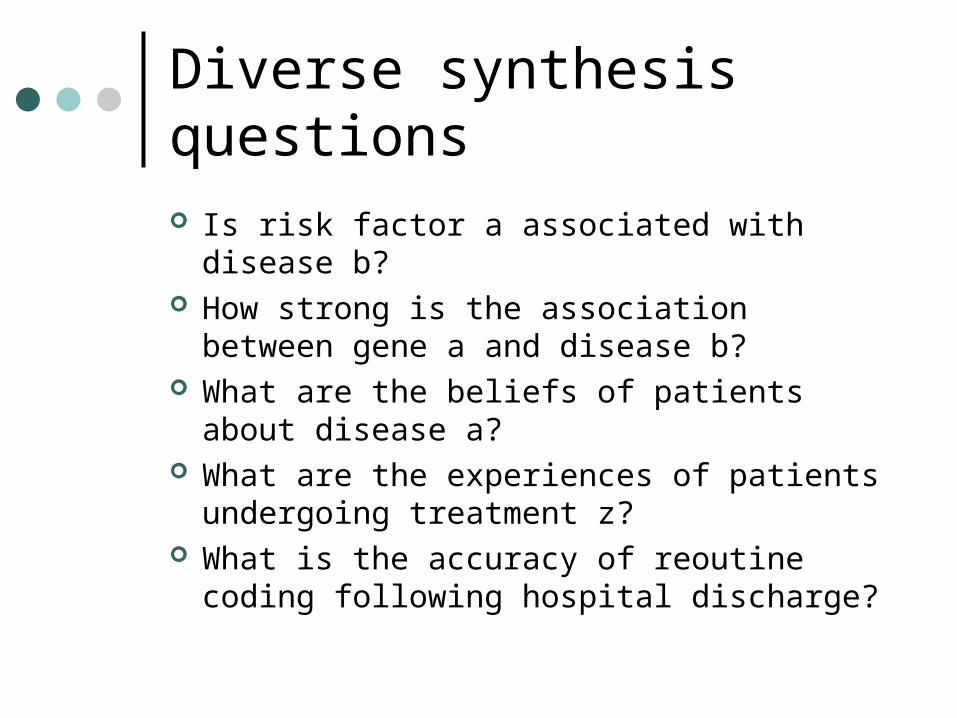
Diverse synthesis questions
Is risk factor a associated with disease b? How strong is the association between gene
a and disease b? What are the beliefs of patients about
disease a? What are the experiences of patients
undergoing treatment z? What is the accuracy of reoutine coding
following hospital discharge?

Search strategy
Search strategy should follow from review question and selection criteria
Highly technical Development of search strategy involves
trade-offs between sensitivity and specificity Be aware of assumptions as they can
dramatically impact on workload (if searches have poor specificity) and value of review (if searches have poor sensitivity)
Key issue is transparency

Why is a rigorous approach to searching important?
To achieve up-to-date, relevant, unbiased reviews
Searching is often a matter of trying terms and seeing what results you get
Protocol should state planned searches (post-hoc modifications can be made if appropriate)

Methods
How searches will be screened How full text articles will be retrieved and
screened How data abstraction will be undertaken What data will be abstracted (cross
reference back to the selection criteria) How the risk of bias/quality of included
studies will be assessed Planned comparisons, subgroup analyses

Would you like an example?I have two to offer
1. Dairy consumption as a risk factor for breast cancer.
2. A review of the current economic literature regarding the use of antiplatelet agents in the secondary prevention of vascular events in adults undergoing percutaneous coronary intervention.

Design your own final exam tutorial
Who wants to come?
When should it be?
What material should we cover?

When should it be?
Sun Mon Tues Wed Thurs Fri Sat
1
11:30 Tutorial
2 3
4 5
Last class
6 7 8
11:30 Tutorial
9 10
Research Day
11 12 13 14 15
11:30 Tutorial
16 17
Erin in Halifax
18
Erin in Halifax
19
Erin in Halifax
20
Erin in Halifax
21 22
11:30 Final Tutorial
23 24
25 26 27 28 29
Exam
Day
30
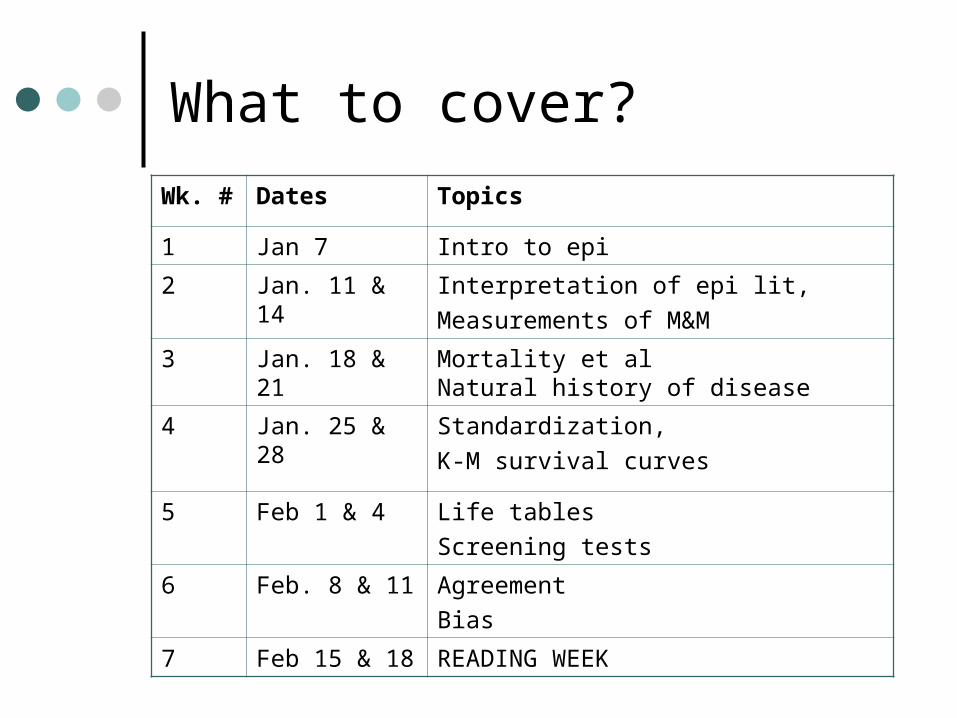
What to cover?
Wk. # Dates Topics
1 Jan 7 Intro to epi
2 Jan. 11 & 14 Interpretation of epi lit,
Measurements of M&M
3 Jan. 18 & 21 Mortality et alNatural history of disease
4 Jan. 25 & 28 Standardization,
K-M survival curves
5 Feb 1 & 4 Life tables
Screening tests
6 Feb. 8 & 11 Agreement
Bias
7 Feb 15 & 18 READING WEEK

What to cover?
Wk. # Dates Topics
8 Feb. 22 & 25 Midterm review,Midterm
9 March 1 & 4 Study design,Attack rates
10 March 15 & 18
Randomization,
Molecular and genetic epidemiology
11 March 22 & 25
Risk estimation, Attributable risk
12 March 29 & Apr. 1
Bias and confounding,Causal relationships
13 April 5 Genetic and environmental factors in disease causation,Evaluation of health services,
Evaluation of screening programs