attitudes of kenyans to the national & … national & county budget making process –...
TRANSCRIPT

ATTITUDES OF KENYANS TO
THE NATIONAL & COUNTY
BUDGET MAKING PROCESS –
COMPREHENSIVE SURVEY
REPORT
December 2016
Prepared by:

INTRODUCTION

Research Background
Budget tracking constitutes a set of actions guided by pre-determined tools to
monitor expenditure of resources according to laid down plans. It is an important
process of ensuring transparency and accountability in the use of resources.
The process of budget tracking can and should be done by the general public and
all other entities required by law bringing in the element of public participation in
budget making and review.
The Constitution of Kenya provides the broad principles of public finance whereas
the Public Finance Management Act, 2012 sets out the rules of how the national
and county governments can raise and spend money.

Study Objectives
To document, through questions inserted into a national representative survey, the
attitudes of Kenyans about distributional questions.
To demonstrate that, given a certain set of baseline attitudes, people who participate in
a deliberative forum and are given particular kinds of information are able to change
their views about questions of distribution, and exhibit higher levels of satisfaction with
the deliberative process when compared to people who do not participate in such
processes.
A small pre and post-test survey to demonstrate impact, as well as a repeat of the
post-test sometime after the event to check for attenuation may be needed.
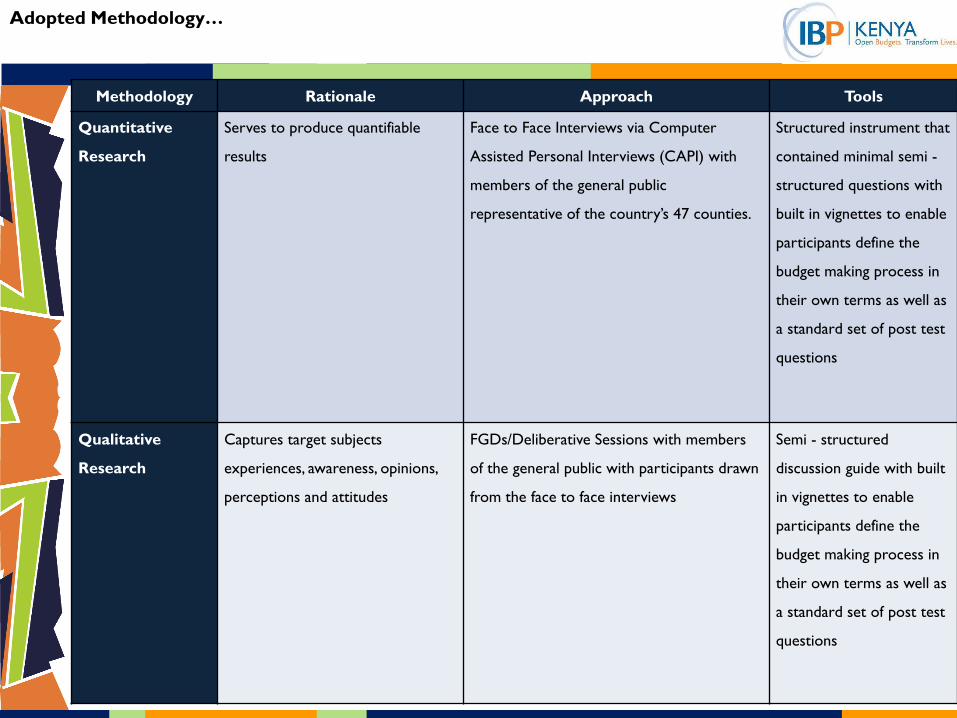
Adopted Methodology…
Methodology Rationale Approach Tools
Quantitative
Research
Serves to produce quantifiable
results
Face to Face Interviews via Computer
Assisted Personal Interviews (CAPI) with
members of the general public
representative of the country’s 47 counties.
Structured instrument that
contained minimal semi -
structured questions with
built in vignettes to enable
participants define the
budget making process in
their own terms as well as
a standard set of post test
questions
Qualitative
Research
Captures target subjects
experiences, awareness, opinions,
perceptions and attitudes
FGDs/Deliberative Sessions with members
of the general public with participants drawn
from the face to face interviews
Semi - structured
discussion guide with built
in vignettes to enable
participants define the
budget making process in
their own terms as well as
a standard set of post test
questions
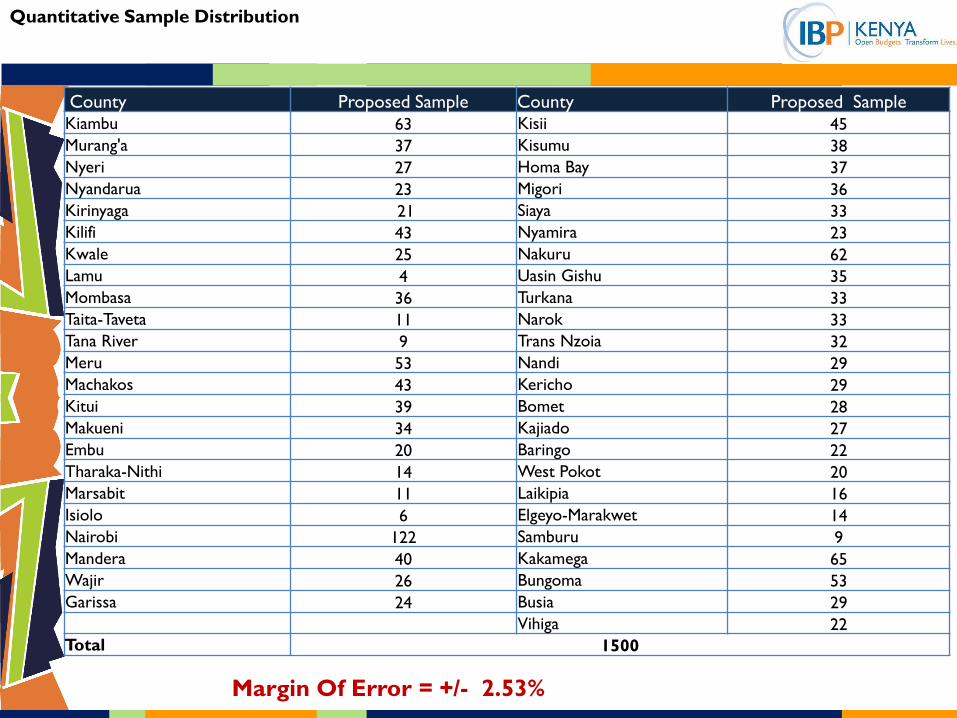
Quantitative Sample Distribution
County Proposed Sample County Proposed Sample Kiambu 63 Kisii 45
Murang'a 37 Kisumu 38
Nyeri 27 Homa Bay 37
Nyandarua 23 Migori 36
Kirinyaga 21 Siaya 33
Kilifi 43 Nyamira 23
Kwale 25 Nakuru 62
Lamu 4 Uasin Gishu 35
Mombasa 36 Turkana 33
Taita-Taveta 11 Narok 33
Tana River 9 Trans Nzoia 32
Meru 53 Nandi 29
Machakos 43 Kericho 29
Kitui 39 Bomet 28
Makueni 34 Kajiado 27
Embu 20 Baringo 22
Tharaka-Nithi 14 West Pokot 20
Marsabit 11 Laikipia 16
Isiolo 6 Elgeyo-Marakwet 14
Nairobi 122 Samburu 9
Mandera 40 Kakamega 65
Wajir 26 Bungoma 53
Garissa 24 Busia 29
Vihiga 22
Total 1500
Margin Of Error = +/- 2.53%
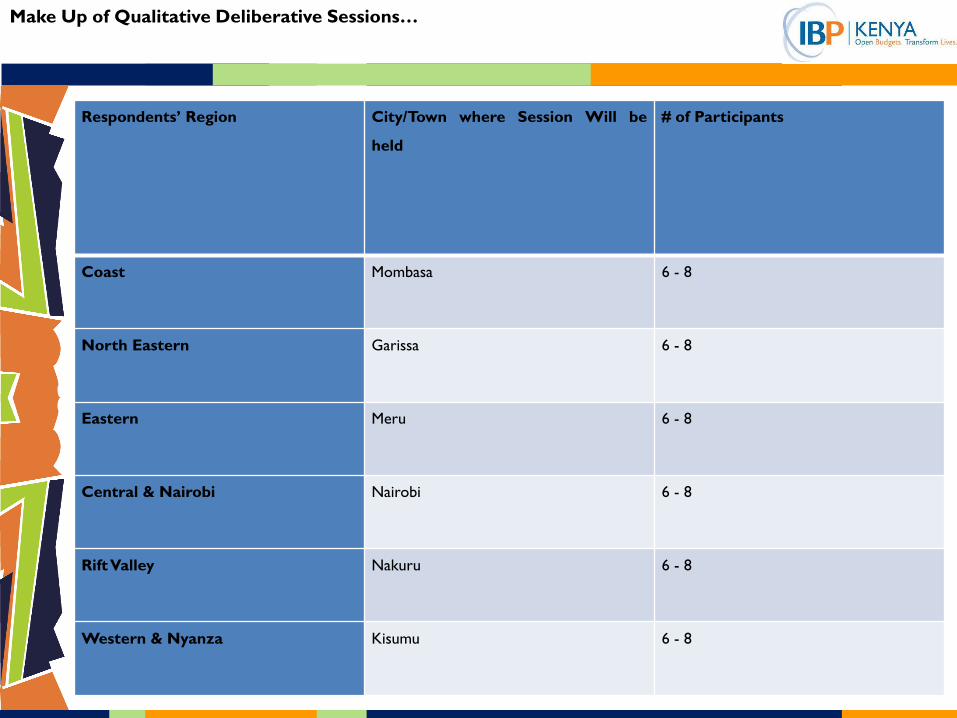
Make Up of Qualitative Deliberative Sessions…
Respondents’ Region City/Town where Session Will be
held
# of Participants
Coast Mombasa 6 - 8
North Eastern Garissa 6 - 8
Eastern Meru 6 - 8
Central & Nairobi Nairobi 6 - 8
Rift Valley Nakuru 6 - 8
Western & Nyanza Kisumu 6 - 8

PART 1:
FINDINGS FROM THE FACE TO
FACE HOUSEHOLD
INTERVIEWS

Sectors of National Government

The national government is organized into ten sectors for purposes of budgeting. Each sector
contains ministries, agencies, and state corporations. Looking at the ten sectors below, and
assuming that you were in charge of the national budget, determine the share of the total (100%)
that you would give to each sector:
Respondents’ Proposed Allocations to the Share of the Total (100%) per Sector for
Purposes of Budgeting
Mean Max Min Mode Median S. Dev
Education 16.3 50 2 20 15 6.2
Health 14.8 50 0 15 15 5.9
Agriculture, Rural and Urban Development 13.8 95 0 10 11 8.4
Energy, Infrastructure and ICT 11.2 60 0 10 10 6
National Security 9.7 35 0 10 10 4.5
Environmental Protection, Water and Natural
Resources 8.2 40 0 10 8 4.6
General Economic and Commercial Affairs 7.4 43 0 5 6 4
Public Administration & International Relations 6.5 25 0 5 5 3.4
Governance, Justice, Law and Order 6.3 30 0 5 5 3.2
Social Protection, Culture and Recreation 5.8 23 0 5 5 3.1
N=1500
The surveyed respondents allocated the largest share of the budget to Education at 16.3% and
allocated the least to Social Protection, Culture and Recreation at 5.8%

Respondents’ Proposed Allocations to the Share of the Total (100%) per Sector for
Purposes of Budgeting by Gender
Gender
Overall
Male Female
Mean Mean
Education 16.0 16.7 16.3
Health 14.8 14.8 14.8
Agriculture, Rural and Urban
Development 13.6 14.2 13.8
Energy, Infrastructure and ICT 11.4 10.9 11.2
National Security 9.8 9.6 9.7
Environmental Protection, Water
and Natural Resources 8.3 8.0 8.2
General Economic and Commercial
Affairs 7.4 7.3 7.4
Public Administration &
International Relations 6.5 6.4 6.5
Governance, Justice, Law and Order 6.4 6.2 6.3
Social Protection, Culture and
Recreation 5.7 6.0 5.8
N=1500
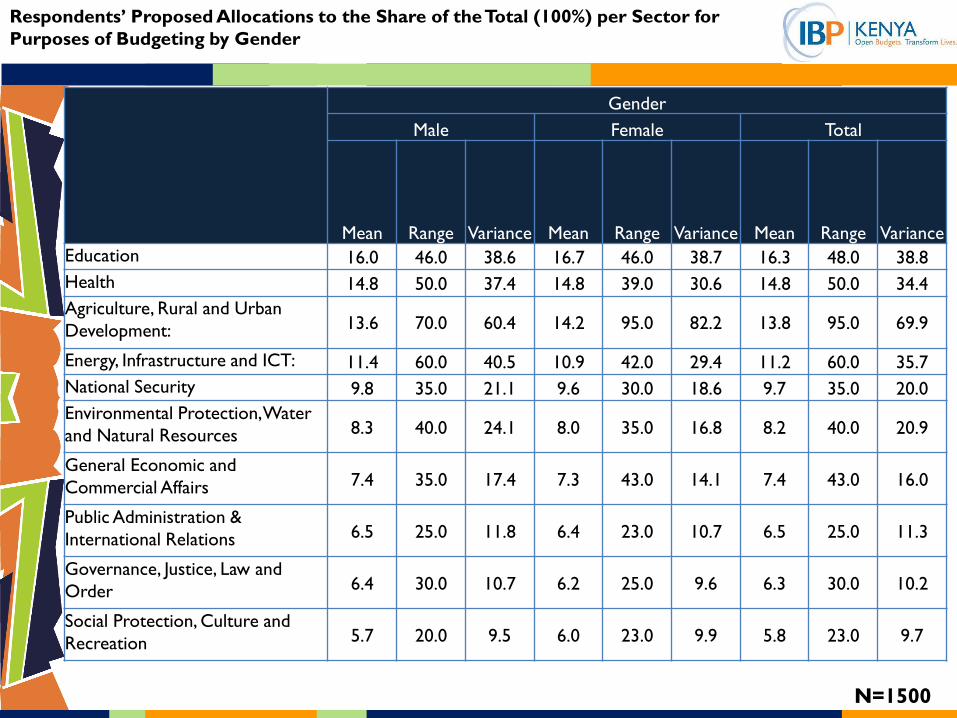
Respondents’ Proposed Allocations to the Share of the Total (100%) per Sector for
Purposes of Budgeting by Gender
Gender
Male Female Total
Mean Range Variance Mean Range Variance Mean Range Variance
Education 16.0 46.0 38.6 16.7 46.0 38.7 16.3 48.0 38.8
Health 14.8 50.0 37.4 14.8 39.0 30.6 14.8 50.0 34.4
Agriculture, Rural and Urban
Development: 13.6 70.0 60.4 14.2 95.0 82.2 13.8 95.0 69.9
Energy, Infrastructure and ICT: 11.4 60.0 40.5 10.9 42.0 29.4 11.2 60.0 35.7
National Security 9.8 35.0 21.1 9.6 30.0 18.6 9.7 35.0 20.0
Environmental Protection, Water
and Natural Resources 8.3 40.0 24.1 8.0 35.0 16.8 8.2 40.0 20.9
General Economic and
Commercial Affairs 7.4 35.0 17.4 7.3 43.0 14.1 7.4 43.0 16.0
Public Administration &
International Relations 6.5 25.0 11.8 6.4 23.0 10.7 6.5 25.0 11.3
Governance, Justice, Law and
Order 6.4 30.0 10.7 6.2 25.0 9.6 6.3 30.0 10.2
Social Protection, Culture and
Recreation 5.7 20.0 9.5 6.0 23.0 9.9 5.8 23.0 9.7
N=1500

The national government is organized into ten sectors for purposes of budgeting. Each sector
contains ministries, agencies, and state corporations. Looking at the ten sectors below, and
assuming that you were in charge of the national budget, determine the share of the total (100%)
that you would give to each sector:
Respondents’ Proposed Allocations to the Share of the Total (100%) per Sector for
Purposes of Budgeting by Location
Location
Rural Urban Total
Mean Max Min Mean Max Min Mean Max Min
Education 16.3 42.0 4.0 16.3 50.0 2.0 16.3 50.0 2.0
Health 14.9 50.0 2.0 14.8 50.0 0.0 14.8 50.0 0.0
Agriculture, Rural and Urban Development 14.0 95.0 1.0 13.7 90.0 0.0 13.8 95.0 0.0
Energy, Infrastructure and ICT 11.2 50.0 0.0 11.2 60.0 0.0 11.2 60.0 0.0
National Security 9.7 30.0 0.0 9.6 35.0 0.0 9.7 35.0 0.0
Environmental Protection, Water and
Natural Resources 8.0 40.0 0.0 8.4 35.0 0.0 8.2 40.0 0.0
General Economic and Commercial Affairs 7.4 35.0 0.0 7.3 43.0 0.0 7.4 43.0 0.0
Public Administration & International
Relations 6.4 25.0 0.0 6.5 25.0 0.0 6.5 25.0 0.0
Governance, Justice, Law and Order 6.4 30.0 0.0 6.2 25.0 0.0 6.3 30.0 0.0
Social Protection, Culture and Recreation 5.8 23.0 0.0 6.0 20.0 0.0 5.8 23.0 0.0
N=1500

Respondents’ Proposed Allocations to the Share of the Total (100%) per Sector for
Purposes of Budgeting by Region
Regions
Overall
Central Coast Eastern Nairobi
North
Eastern Nyanza
Rift
Valley Western
Mean Mean Mean Mean Mean Mean Mean Mean
Education 17.0 16.5 17.3 13.4 15.4 17.4 15.6 16.9 16.3
Health 14.9 14.2 14.4 12.6 18.4 14.3 14.4 17.1 14.8
Agriculture, Rural and
Urban Development: 11.4 12.5 12.8 11.7 10.4 13.1 15.7 18.8 13.8
Energy, Infrastructure and
ICT 12.1 11.8 12.1 12.1 7.2 10.9 12.2 8.4 11.2
National Security 9.9 10.7 9.4 11.3 10.5 10.8 9.1 7.5 9.7
Environmental Protection,
Water and Natural
Resources
6.9 7.0 8.8 9.1 13.7 8.3 7.4 7.5 8.2
General Economic and
Commercial Affairs 8.1 8.0 7.2 8.1 6.9 7.2 7.1 7.0 7.4
Public Administration &
International Relations 6.7 7.0 6.3 8.2 6.2 6.1 6.6 5.2 6.5
Governance, Justice, Law
and Order 7.1 6.5 6.2 6.7 6.7 5.9 6.2 5.9 6.3
Social Protection, Culture
and Recreation 6.0 5.7 5.6 6.9 4.6 5.9 5.7 6.2 5.8
N=1500

Which Political Party Do You Feel Closest To?
TNA
United
Republ
ican
Party
(URP)
Jubilee
Allianc
e
Party
(JAP) ODM
WIPE
R
DEMO
CRATI
C
MOVE
MENT
KENY
A
(WD
M – K)
FORD
-
KENY
A
Amani
Nation
al
Congr
ess
(ANC)
Chama
Cha
Mashin
ani -
Kenya
(CCM
K) KANU
Nation
al
Rainbo
w
Coaliti
on
(NAR
C)
Nation
al
Rainbo
w
Coaliti
on-
Kenya
(NAR
C-
Kenya) Total
Mean Mean Mean Mean Mean Mean Mean Mean Mean Mean Mean Mean
Education 15.7 15.6 16.4 16.3 16.4 16.9 15.7 17.8 16.6 17.2 20.0 16.3
Health 14.0 15.3 14.4 15.0 14.5 16.6 17.1 14.6 15.5 13.3 16.0 14.8
Agriculture, Rural and Urban Development 14.4 11.8 13.6 13.9 14.1 17.0 16.6 14.3 13.5 14.8 12.8 13.8
Energy, Infrastructure and ICT 13.0 10.2 12.0 10.6 11.0 8.6 9.3 10.5 10.5 9.0 7.0 11.2
National Security 8.7 10.1 10.2 9.5 10.3 10.1 8.2 11.8 8.7 11.7 11.2 9.7
Environmental Protection, Water and Natural
Resources 7.4 10.7 7.7 8.4 8.4 8.4 6.6 5.8 7.6 9.1 7.2 8.2
General Economic and Commercial Affairs 8.2 7.1 7.4 7.5 6.9 5.9 7.4 5.3 6.9 8.2 4.8 7.4
Public Administration & International Relations 6.5 6.8 6.6 6.4 6.4 5.3 5.5 9.6 7.0 6.5 6.0 6.5
Governance, Justice, Law and Order 6.4 6.4 6.3 6.3 6.7 6.1 7.4 5.6 6.9 4.5 5.7 6.3
Social Protection, Culture and Recreation 5.8 6.2 5.7 5.9 5.3 5.2 6.3 4.7 6.9 5.7 9.3 5.8
Respondents’ Proposed Allocations to the Share of the Total (100%) per Sector for
Purposes of Budgeting by Political Party Affiliation
N=1500
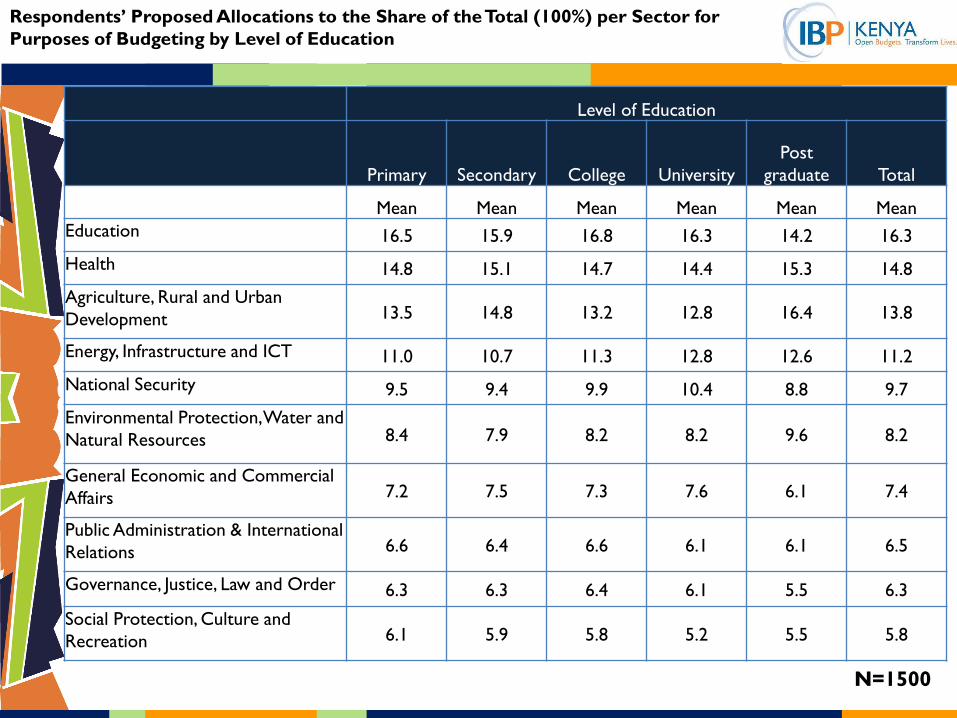
Respondents’ Proposed Allocations to the Share of the Total (100%) per Sector for
Purposes of Budgeting by Level of Education
Level of Education
Primary Secondary College University
Post
graduate Total
Mean Mean Mean Mean Mean Mean
Education 16.5 15.9 16.8 16.3 14.2 16.3
Health 14.8 15.1 14.7 14.4 15.3 14.8
Agriculture, Rural and Urban
Development 13.5 14.8 13.2 12.8 16.4 13.8
Energy, Infrastructure and ICT 11.0 10.7 11.3 12.8 12.6 11.2
National Security 9.5 9.4 9.9 10.4 8.8 9.7
Environmental Protection, Water and
Natural Resources 8.4 7.9 8.2 8.2 9.6 8.2
General Economic and Commercial
Affairs 7.2 7.5 7.3 7.6 6.1 7.4
Public Administration & International
Relations 6.6 6.4 6.6 6.1 6.1 6.5
Governance, Justice, Law and Order 6.3 6.3 6.4 6.1 5.5 6.3
Social Protection, Culture and
Recreation 6.1 5.9 5.8 5.2 5.5 5.8
N=1500

Respondents’ Proposed Allocations to the Share of the Total (100%) per Sectors for
Purposes of Budgeting by Employment Status
Employment status
Employed Un-employed Self-employed Total
Mean Mean Mean Mean
Education 15.9 16.0 16.9 16.3
Health 14.5 14.7 15.3 14.8
Agriculture, Rural and Urban
Development 14.0 13.7 13.9 13.8
Energy, Infrastructure and ICT 11.9 10.9 11.1 11.2
National Security 10.2 9.6 9.5 9.7
Environmental Protection, Water
and Natural Resources 8.0 8.3 8.1 8.2
General Economic and
Commercial Affairs 7.4 7.5 7.3 7.4
Public Administration &
International Relations 6.5 6.8 6.1 6.5
Governance, Justice, Law and
Order 6.3 6.5 6.2 6.3
Social Protection, Culture and
Recreation 5.6 6.3 5.6 5.8
N=1500

Please explain the reasons behind your choice for the sector receiving the most.
Respondents’ Reasons Behind their Choices on the Share of the Total (100%) per Sector
for Purposes of Budgeting (1/2)
Education
• Reduces Illiteracy in the society
• Education is the backbone of the society
• To have more schools/access to education facilities
• Education promotes growth and development
• Education creates employment
• Reduce theft and strikes
Health
• Improved health leads to development
• Access to proper healthcare reduces death rates
• A healthy nation is a productive society
• Better health sector increase access to health facilities
• Basic need/most important
• To get people health cover/cheaper health services
• In order to remunerate doctors and nurses well thus reducing strikes
Agriculture
• Agriculture is the backbone of the society
• Produce sufficient food
• Agriculture promotes economic stability

Please explain the reasons behind your choice for the sector receiving the least.
Government, Justice and Law
• Corruption is high/Funds are stolen
• Already established
• No insecurity in the area
• It has performed poorly in the past/No justice in courts
• Nothing much can be done to improve this
• Only leadership and integrity can lead to better governance
Social Protection, Culture, Recreation
• Culture earns income from tourism
• Does not have many needs/less money required
• Not required at the grassroots
• This sector is not important
• Culture is non-existent/Culture is changing
• Contributes least to GDP
• The returns are low
Public Administration & International Relations
• International nations are already developed no need for relations
• International Affairs are sponsored by developed nations
• There are enough competent personnel
• Least important to the community
• Government has already done a good job
• No major problem in this sector
• Do not have huge cash requirement
Respondents’ Reasons Behind their Choices on the Share of the Total (100%) per Sector
for Purposes of Budgeting (2/2)
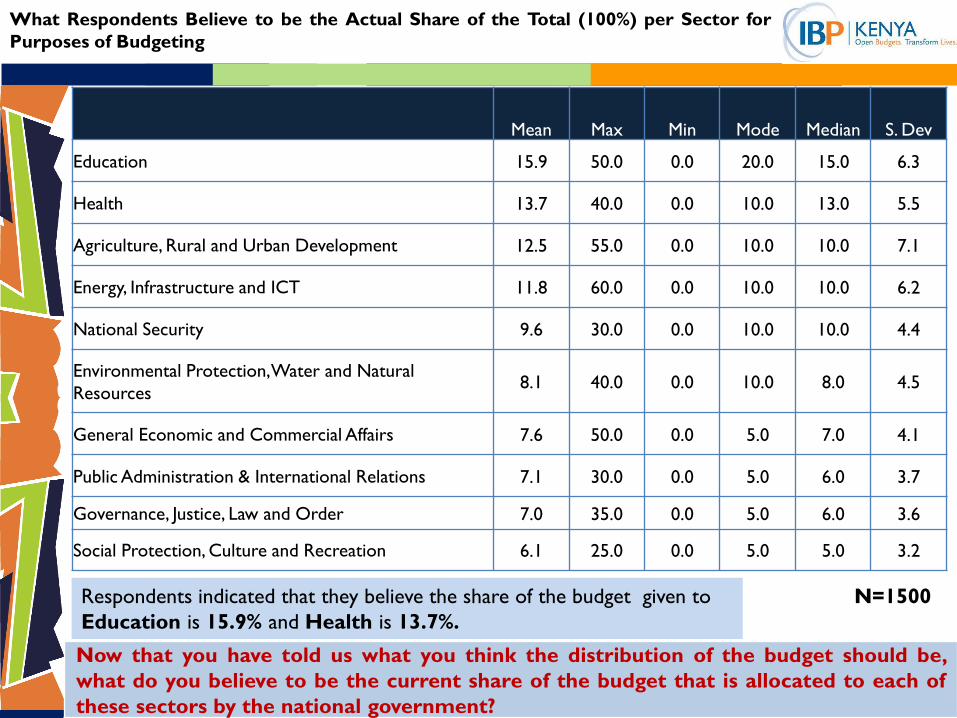
Now that you have told us what you think the distribution of the budget should be,
what do you believe to be the current share of the budget that is allocated to each of
these sectors by the national government?
What Respondents Believe to be the Actual Share of the Total (100%) per Sector for
Purposes of Budgeting
Mean Max Min Mode Median S. Dev
Education 15.9 50.0 0.0 20.0 15.0 6.3
Health 13.7 40.0 0.0 10.0 13.0 5.5
Agriculture, Rural and Urban Development 12.5 55.0 0.0 10.0 10.0 7.1
Energy, Infrastructure and ICT 11.8 60.0 0.0 10.0 10.0 6.2
National Security 9.6 30.0 0.0 10.0 10.0 4.4
Environmental Protection, Water and Natural
Resources 8.1 40.0 0.0 10.0 8.0 4.5
General Economic and Commercial Affairs 7.6 50.0 0.0 5.0 7.0 4.1
Public Administration & International Relations 7.1 30.0 0.0 5.0 6.0 3.7
Governance, Justice, Law and Order 7.0 35.0 0.0 5.0 6.0 3.6
Social Protection, Culture and Recreation 6.1 25.0 0.0 5.0 5.0 3.2
N=1500 Respondents indicated that they believe the share of the budget given to
Education is 15.9% and Health is 13.7%.

Now that you have told us what you think the distribution of the budget should be,
what do you believe to be the current share of the budget that is allocated to each of
these sectors by the national government?
What Respondents Believe to be the Share of the Total (100%) per Sector for
Purposes of Budgeting by Gender
Gender
Total
Male Female
Mean Mean
Education 15.6 16.2 15.9
Health 13.5 14.0 13.7
Agriculture, Rural and Urban Development 12.4 12.5 12.4
Energy, Infrastructure and ICT 12.1 11.5 11.8
National Security 9.9 9.3 9.7
Environmental Protection, Water and Natural Resources 8.2 8.0 8.2
General Economic and Commercial Affairs 7.7 7.4 7.6
Public Administration & International Relations 7.1 7.0 7.1
Governance, Justice, Law and Order 7.0 7.0 7.0
Social Protection, Culture and Recreation 6.1 6.2 6.1
N=1500

Now that you have told us what you think the distribution of the budget should be,
what do you believe to be the current share of the budget that is allocated to each of
these sectors by the national government?
What Respondents Believe to be the Share of the Total (100%) per Sector for
Purposes of Budgeting by Gender
Gender
Male Female Total
Mean Variance Range Mean Variance Range Mean Variance Range
Education 15.6 37.9 50.0 16.2 41.9 48.0 15.9 39.7 50.0
Health 13.5 28.9 40.0 14.0 31.1 40.0 13.7 29.9 40.0
Agriculture, Rural and Urban
Development: 12.4 45.8 55.0 12.5 56.4 50.0 12.5 50.4 55.0
Energy, Infrastructure and ICT: 12.1 41.4 60.0 11.5 34.3 40.0 11.8 38.4 60.0
National Security 9.9 19.1 30.0 9.3 18.8 23.0 9.6 19.0 30.0
Environmental Protection, Water
and Natural Resources 8.2 22.0 40.0 8.0 18.8 30.0 8.1 20.6 40.0
General Economic and Commercial
Affairs 7.7 18.3 50.0 7.4 14.5 40.0 7.6 16.6 50.0
Public Administration &
International Relations 7.1 13.3 30.0 7.0 14.1 25.0 7.1 13.6 30.0
Governance, Justice, Law and Order 7.0 12.1 35.0 7.0 13.7 25.0 7.0 12.8 35.0
Social Protection, Culture and
Recreation 6.1 9.8 25.0 6.2 10.6 25.0 6.1 10.1 25.0
N=1500

Now that you have told us what you think the distribution of the budget should be,
what do you believe to be the current share of the budget that is allocated to each of
these sectors by the national government?
What Respondents Believe to be the Share of The Total (100%) per Sector for Purposes
of Budgeting by Location
Location
Rural Urban Total
Mean Max Min Mean Max Min Mean Max Min
Education 15.9 42.0 0.0 15.8 50.0 0.0 15.9 50.0 0.0
Health 13.6 40.0 0.0 13.8 40.0 0.0 13.7 40.0 0.0
Agriculture, Rural and Urban
Development: 12.5 55.0 0.0 12.4 50.0 0.0 12.5 55.0 0.0
Energy, Infrastructure and ICT 12.0 40.0 0.0 11.6 60.0 0.0 11.8 60.0 0.0
National Security 9.5 30.0 0.0 9.8 27.0 0.0 9.6 30.0 0.0
Environmental Protection, Water and
Natural Resources 8.0 40.0 0.0 8.3 30.0 0.0 8.1 40.0 0.0
General Economic and Commercial Affairs 7.6 40.0 0.0 7.4 50.0 0.0 7.6 50.0 0.0
Public Administration & International
Relations 6.9 25.0 0.0 7.3 30.0 0.0 7.1 30.0 0.0
Governance, Justice, Law and Order 7.0 25.0 0.0 7.0 35.0 0.0 7.0 35.0 0.0
Social Protection, Culture and Recreation 6.1 25.0 0.0 6.2 25.0 0.0 6.1 25.0 0.0
N=1500

Now that you have told us what you think the distribution of the budget should be,
what do you believe to be the current share of the budget that is allocated to each of
these sectors by the national government?
What Respondents Believe to be the Share of the Total (100%) per Sector for Purposes
of Budgeting by Region
Regions
Central Coast Eastern Nairobi
North
Eastern Nyanza
Rift
Valley
Wester
n Total
Mean Mean Mean Mean Mean Mean Mean Mean
Education 15.9 15.3 16.9 12.6 15.8 17.4 15.7 16.1 15.9
Health 13.3 12.3 13.3 10.4 18.4 13.7 13.8 15.3 13.7
Agriculture, Rural and Urban
Development 8.9 12.0 11.8 10.8 10.4 12.1 14.1 16.2 12.4
Energy, Infrastructure and ICT 12.1 12.8 12.5 11.7 6.9 12.0 13.7 8.0 11.8
National Security 9.7 9.9 9.4 11.6 9.8 10.1 9.5 7.7 9.7
Environmental Protection, Water
and Natural Resources 7.0 6.4 9.1 9.7 14.0 8.4 7.0 7.0 8.2
General Economic and Commercial
Affairs 9.3 8.3 7.0 9.4 6.8 6.9 7.3 6.3 7.6
Public Administration &
International Relations 8.5 8.0 6.7 8.8 6.6 7.0 6.6 5.6 7.1
Governance, Justice, Law and Order 8.7 7.9 7.1 8.0 6.8 6.5 6.4 5.7 7.0
Social Protection, Culture and
Recreation 6.5 7.1 6.1 7.1 4.5 6.1 5.8 6.0 6.1
N=1500

Now that you have told us what you think the distribution of the budget should be,
what do you believe to be the current share of the budget that is allocated to each of
these sectors by the national government?
What Respondents Believe to be the Share of The Total (100%) per Sector for Purposes
of Budgeting by Political Party Affiliation
Which Political Party Do You Feel Closest To?
TNA
United
Republi
can
Party
(URP)
Jubilee
Alliance
Party
(JAP) ODM
WIPER
DEMO
CRATIC
MOVEM
ENT
KENYA
(WDM
– K)
FORD-
KENYA
Amani
Nationa
l
Congres
s
(ANC)
Chama
Cha
Mashina
ni -
Kenya
(CCMK
) KANU
Nationa
l
Rainbo
w
Coalitio
n
(NARC)
Nationa
l
Rainbo
w
Coalitio
n-Kenya
(NARC-
Kenya) Total
Mean Mean Mean Mean Mean Mean Mean Mean Mean Mean Mean Mean
Education 15.9 15.7 15.5 16.3 16.1 16.5 13.3 19.1 16.3 15.4 16.8 15.9
Health 13.7 15.0 13.0 13.8 14.0 15.4 16.4 13.8 13.8 11.5 13.9 13.7
Agriculture, Rural and Urban
Development: 13.2 11.0 11.3 13.1 13.5 15.1 14.3 13.0 12.8 17.0 12.5 12.4
Energy, Infrastructure and ICT 12.2 10.4 13.1 11.3 10.8 9.4 9.7 11.7 12.0 12.5 8.1 11.8
National Security 8.7 10.7 10.2 9.4 10.6 8.3 8.7 13.1 8.8 8.3 10.9 9.7
Environmental Protection,
Water and Natural Resources 7.7 10.7 7.8 8.1 8.8 7.3 7.8 6.2 7.7 8.5 7.4 8.2
General Economic and
Commercial Affairs 8.5 7.1 7.7 7.5 7.1 5.9 8.5 5.5 7.3 8.1 8.9 7.6
Public Administration &
International Relations 6.8 6.6 7.6 7.2 6.5 5.9 6.0 7.4 7.1 6.6 7.5 7.1
Governance, Justice, Law and
Order 7.2 6.6 7.3 7.0 6.8 5.9 7.6 5.4 7.3 6.7 7.1 7.0
Social Protection, Culture and
Recreation 6.0 6.3 6.2 6.2 5.8 5.5 7.8 4.9 7.0 5.4 6.8 6.1
N=1500

What Respondents Believe to be the Share of The Total (100%) per Sector for Purposes
of Budgeting by Level of Education
Level of Education
Primary Secondary College University
Post
Graduate Total
Mean Mean Mean Mean Mean Mean
Education 16.1 15.5 16.4 15.5 15.1 15.9
Health 13.6 13.7 13.9 13.4 15.2 13.7
Agriculture, Rural and Urban
Development 12.5 13.1 12.0 11.2 14.9 12.5
Energy, Infrastructure and ICT 11.9 11.4 11.7 13.2 10.1 11.8
National Security 9.5 9.4 9.9 10.2 8.0 9.6
Environmental Protection, Water and
Natural Resources 8.3 7.9 8.2 8.0 10.9 8.1
General Economic and Commercial
Affairs 7.6 7.8 7.4 7.3 6.4 7.6
Public Administration & International
Relations 7.0 6.9 7.4 7.0 5.5 7.1
Governance, Justice, Law and Order 7.0 7.0 7.1 6.9 7.4 7.0
Social Protection, Culture and
Recreation 6.3 6.2 6.1 5.8 6.0 6.1
Now that you have told us what you think the distribution of the budget should be,
what do you believe to be the current share of the budget that is allocated to each of
these sectors by the national government?
N=1500

Now that you have told us what you think the distribution of the budget should be,
what do you believe to be the current share of the budget that is allocated to each of
these sectors by the national government?
What Respondents Believe to be the Share of The Total (100%) per Sector for Purposes
of Budgeting by Employment Status
Employment status
Employed Un-employed Self-employed Total
Mean Mean Mean Mean
Education 15.4 15.6 16.5 15.9
Health 13.3 13.8 13.8 13.7
Agriculture, Rural and Urban Development 12.4 12.4 12.6 12.5
Energy, Infrastructure and ICT 12.4 11.4 11.9 11.8
National Security 10.1 9.8 9.1 9.6
Environmental Protection, Water and Natural
Resources 8.2 8.3 7.8 8.1
General Economic and Commercial Affairs 7.7 7.6 7.4 7.6
Public Administration & International Relations 7.0 7.2 7.0 7.1
Governance, Justice, Law and Order 7.1 7.1 6.7 7.0
Social Protection, Culture and Recreation 6.2 6.5 5.7 6.1
N=1500

Some people have proposed that the allocation for next year to the ten sectors be as
follows: Now that you know, would you insert changes in the allocations you have
proposed
Respondents’ Decisions to Change Initial Proposed Budget Allocations Based on
Proposals by “Some People”
8.6%
76.2%
15.2%
Yes No Don't Know N=750
76.2% of the surveyed respondents indicated that they WOULD NOT change the their
proposed allocations to the budget based on the proposals of other individuals.

Some people have proposed that the allocation for next year to the ten sectors be as
follows: Now that you know, would you insert changes in the allocations you have
proposed
Yes No Don't Know
Male 10.4% 74.1% 15.5%
Female 6.0% 79.1% 15.0%
Overall 8.6% 76.2% 15.2%
0.0%
10.0%
20.0%
30.0%
40.0%
50.0%
60.0%
70.0%
80.0%
90.0%
Respondents’ Decisions to Change Initial Proposed Budget Allocations by Gender
Based on Proposals by “Some People”
N=750
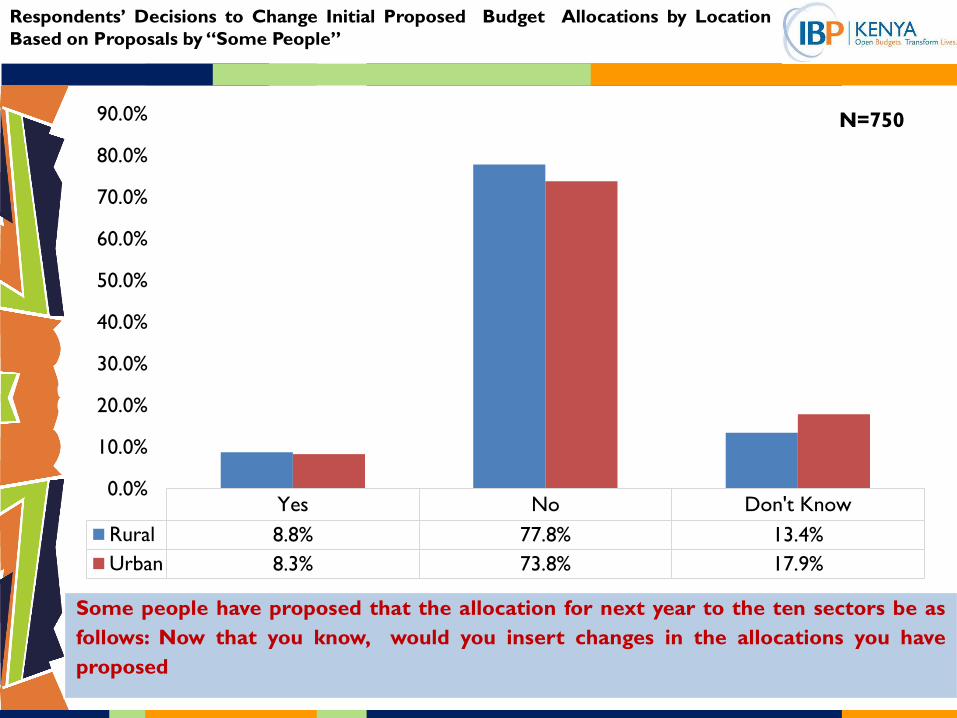
Some people have proposed that the allocation for next year to the ten sectors be as
follows: Now that you know, would you insert changes in the allocations you have
proposed
Yes No Don't Know
Rural 8.8% 77.8% 13.4%
Urban 8.3% 73.8% 17.9%
0.0%
10.0%
20.0%
30.0%
40.0%
50.0%
60.0%
70.0%
80.0%
90.0%
Respondents’ Decisions to Change Initial Proposed Budget Allocations by Location
Based on Proposals by “Some People”
N=750

Respondents’ Decisions to Change Initial Proposed Budget Allocations by Region
Based on Proposals by “Some People”
Regions
Central Coast Eastern Nairobi
North
Eastern Nyanza Rift Valley Western Total
Yes 2.3% 8.4% 14.7% 5.5% 2.6% 1.6% 13.1% 12.2% 8.6%
No 89.2% 83.9% 62.6% 61.8% 87.1% 81.9% 76.1% 68.5% 76.2%
Don't Know 8.4% 7.7% 22.7% 32.7% 10.3% 16.5% 10.9% 19.3% 15.2%
Some people have proposed that the allocation for next year to the ten sectors be as
follows: Now that you know, would you insert changes in the allocations you have
proposed
N=750

Respondents’ Decisions to Change Initial Proposed Budget Allocations by Political
Party Affiliation Based on Proposals by “Some People”
Which Political Party Do You Feel Closest To?
TNA
United
Republic
an Party
(URP)
Jubilee
Alliance
Party
(JAP) ODM
WIPER
DEMO
CRATIC
MOVEM
ENT
KENYA
(WDM
– K)
FORD-
KENYA
Amani
National
Congres
s (ANC)
Chama
Cha
Mashina
ni -
Kenya
(CCMK) KANU
National
Rainbo
w
Coalitio
n
(NARC)
National
Rainbo
w
Coalitio
n-Kenya
(NARC-
Kenya) Total
Yes 10.1% 10.3% 7.2% 7.6% 7.2% 0.0% 9.8% 49.6% 8.8% 0.0% 0.0% 8.6%
No 73.2% 71.9% 80.9% 76.8% 66.3% 77.0% 80.5% 50.4% 91.2% 27.0% 60.7% 76.2%
Don't
Know 16.7% 17.7% 11.9% 15.5% 26.5% 23.0% 9.8% 0.0% 0.0% 73.0% 39.3% 15.2%
Some people have proposed that the allocation for next year to the ten sectors be as
follows: Now that you know, would you insert changes in the allocations you have
proposed
N=750

Respondents’ Decisions to Change Initial Proposed Budget Allocations by Level of
Education Based on Proposals by “Some People”
Level of Education
Primary Secondary College University Post Graduate Total
Yes 10.3% 8.4% 8.4% 7.0% 0.0% 8.6%
No 77.3% 75.7% 74.7% 78.5% 85.4% 76.2%
Don't Know 12.4% 15.8% 17.0% 14.6% 14.6% 15.2%
Some people have proposed that the allocation for next year to the ten sectors be as
follows: Now that you know, would you insert changes in the allocations you have
proposed
N=750

Some people have proposed that the allocation for next year to the ten sectors be as
follows: Now that you know, would you insert changes in the allocations you have
proposed
Yes No Don't Know
Employed 7.5% 76.9% 15.6%
Un-employed 8.3% 75.1% 16.6%
Self-employed 9.5% 76.9% 13.5%
Overall 8.6% 76.2% 15.2%
0.0%
10.0%
20.0%
30.0%
40.0%
50.0%
60.0%
70.0%
80.0%
90.0%
Respondents’ Decisions to Change Proposed Initial Budget Allocations by Employment
Status Based on Proposals by “Some People”
N=750

Mean Max Min Mode Median S. Dev
Health 15 30 4 10 15 6
Education 15 25 5 10 15 6
Agriculture, Rural and Urban Development: 14 40 4 10 10 7
Energy, Infrastructure and ICT: 11 24 2 15 10 5
National Security 10 35 2 10 10 5
Environmental Protection, Water and Natural
Resources 9 40 2 5 9 6
General Economic and Commercial Affairs 7 20 1 5 6 4
Public Administration & International Relations 7 20 0 5 6 4
Social Protection, Culture and Recreation 7 25 1 5 5 4
Governance, Justice, Law and Order 6 13 1 5 5 3
Some people have proposed that the allocation for next year to the ten sectors be as
follows: Now that you know, would you insert changes in the allocations you have
proposed, If yes please insert
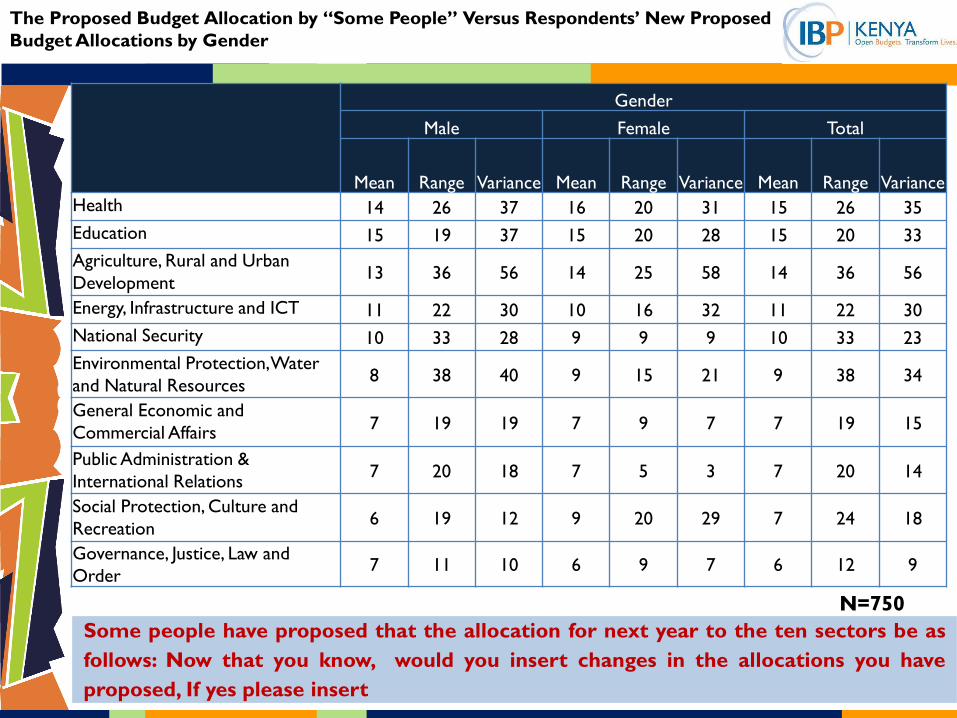
The Proposed Budget Allocation by “Some People” Versus Respondents’ New Proposed
Budget Allocations
N=750

Some people have proposed that the allocation for next year to the ten sectors be as
follows: Now that you know, would you insert changes in the allocations you have
proposed, If yes please insert
The Proposed Budget Allocation by “Some People” Versus Respondents’ New Proposed
Budget Allocations by Gender
Gender
Total
Male Female
Mean Mean
Health 14 16 15
Education 15 15 15
Agriculture, Rural and Urban Development 13 14 14
Energy, Infrastructure and ICT 11 10 11
National Security 10 9 10
Environmental Protection, Water and Natural Resources 8 9 9
General Economic and Commercial Affairs 7 7 7
Public Administration & International Relations 7 7 7
Social Protection, Culture and Recreation 6 9 7
Governance, Justice, Law and Order 7 6 6
N=750
Some people have proposed that the allocation for next year to the ten sectors be as
follows: Now that you know, would you insert changes in the allocations you have
proposed, If yes please insert
The Proposed Budget Allocation by “Some People” Versus Respondents’ New Proposed
Budget Allocations by Gender
Gender
Male Female Total
Mean Range Variance Mean Range Variance Mean Range Variance
Health 14 26 37 16 20 31 15 26 35
Education 15 19 37 15 20 28 15 20 33
Agriculture, Rural and Urban
Development 13 36 56 14 25 58 14 36 56
Energy, Infrastructure and ICT 11 22 30 10 16 32 11 22 30
National Security 10 33 28 9 9 9 10 33 23
Environmental Protection, Water
and Natural Resources 8 38 40 9 15 21 9 38 34
General Economic and
Commercial Affairs 7 19 19 7 9 7 7 19 15
Public Administration &
International Relations 7 20 18 7 5 3 7 20 14
Social Protection, Culture and
Recreation 6 19 12 9 20 29 7 24 18
Governance, Justice, Law and
Order 7 11 10 6 9 7 6 12 9
N=750

Some people have proposed that the allocation for next year to the ten sectors be as
follows: Now that you know, would you insert changes in the allocations you have
proposed, If yes please insert
Location
Rural Urban Total
Mean Max Min Mean Max Min Mean Max Min
Health 15 30 5 15 30 4 15 30 4
Education 14 25 5 16 24 8 15 25 5
Agriculture, Rural and Urban Development 15 40 5 11 23 4 14 40 4
Energy, Infrastructure and ICT 11 24 3 11 23 2 11 24 2
National Security 9 17 2 11 35 4 10 35 2
Environmental Protection, Water and
Natural Resources 9 40 2 7 15 3 9 40 2
General Economic and Commercial Affairs 7 20 1 7 17 1 7 20 1
Public Administration & International
Relations 7 15 2 8 20 0 7 20 0
Social Protection, Culture and Recreation 7 20 2 7 25 1 7 25 1
Governance, Justice, Law and Order 6 10 2 7 13 1 6 13 1
The Proposed Budget Allocation by “Some People” Versus Respondents’ New Proposed
Budget Allocations by Location
N=750

Some people have proposed that the allocation for next year to the ten sectors be as
follows: Now that you know, would you insert changes in the allocations you have
proposed, If yes please insert
The Proposed Budget Allocation by “Some People” Versus Respondents’ New Proposed
Budget Allocations by Region
Regions
Total Central Coast Eastern Nairobi
North
Eastern Nyanza
Rift
Valley Western
Mean Mean Mean Mean Mean Mean Mean Mean
Health 8 13 16 14 7 12 15 18 15
Education 10 13 13 16 10 18 17 15 15
Agriculture, Rural and Urban
Development 15 10 13 10 5 19 13 17 14
Energy, Infrastructure and ICT 10 14 11 8 5 8 12 8 11
National Security 12 17 9 11 10 8 10 8 10
Environmental Protection, Water and
Natural Resources 10 7 9 8 40 8 7 10 9
General Economic and Commercial
Affairs 12 7 8 11 5 8 6 6 7
Public Administration & International
Relations 7 7 7 5 5 7 9 4 7
Social Protection, Culture and
Recreation 10 7 7 11 10 5 5 10 7
Governance, Justice, Law and Order 7 7 7 7 3 8 6 5 6
N=750

Some People have proposed that the allocation for next year to the ten sectors be as
follows: Now that you know, would you insert changes in the allocations you have
proposed, If yes please insert
Which Political Party Do You Feel Closest To?
TNA
United
Republic
an Party
(URP)
Jubilee
Alliance
Party
(JAP) ODM
WIPER
DEMO
CRATIC
MOVEM
ENT
KENYA
(WDM
– K)
FORD-
KENYA
Amani
National
Congres
s (ANC)
Chama
Cha
Mashina
ni -
Kenya
(CCMK
) KANU
National
Rainbo
w
Coalitio
n
(NARC)
National
Rainbo
w
Coalitio
n-Kenya
(NARC-
Kenya) Total
Mean Mean Mean Mean Mean Mean Mean Mean Mean Mean Mean Mean
Health 16 13 13 17 15 - 13 19 20 - - 15
Education 15 13 15 16 11 - 10 14 25 - - 15
Agriculture, Rural and Urban
Development: 11 12 12 17 24 - 10 19 15 - - 14
Energy, Infrastructure and ICT: 11 10 13 9 9 - 10 5 4 - - 10
National Security 10 8 11 10 7 - 10 14 10 - - 10
Environmental Protection,
Water and Natural Resources 10 16 7 6 12 - 10 6 6 - - 9
General Economic and
Commercial Affairs 6 8 8 7 5 - 10 6 5 - - 7
Public Administration &
International Relations 7 5 8 6 6 - 5 9 8 - - 7
Social Protection, Culture and
Recreation 6 8 7 6 5 - 20 6 5 - - 7
Governance, Justice, Law and
Order 7 6 7 6 5 - 2 5 2 - - 6
The Proposed Budget Allocation by “Some People” Versus Respondents’ New Proposed
Budget Allocations by Political Party Affiliation
N=750
Some people have proposed that the allocation for next year to the ten sectors be as
follows: Now that you know, would you insert changes in the allocations you have
proposed, If yes please insert
The Proposed Budget Allocation by “Some People” Versus Respondents’ New Proposed
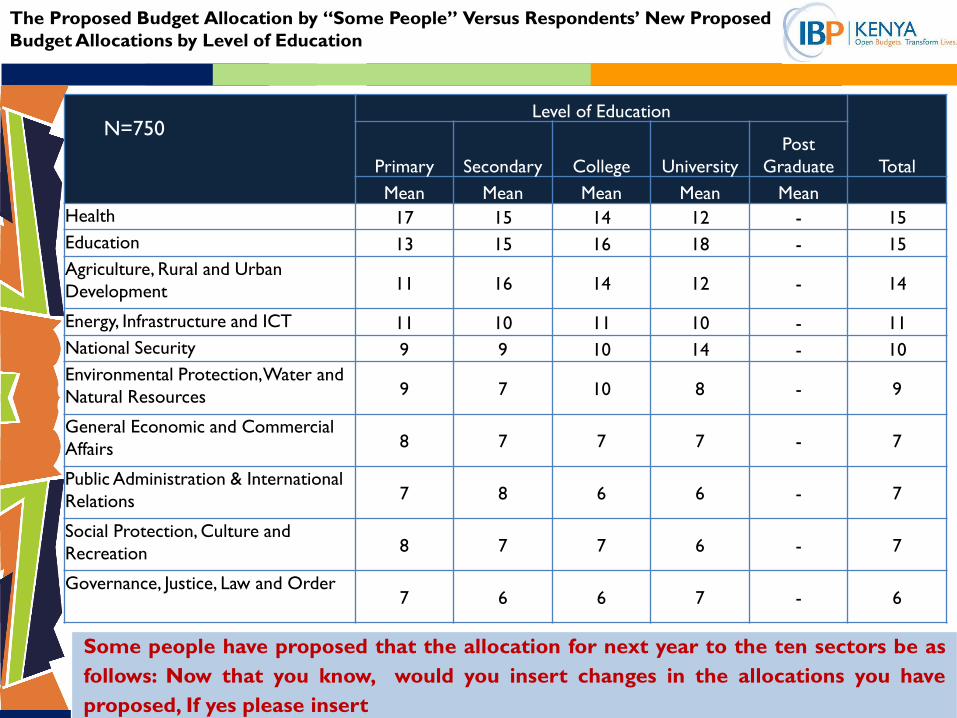
Budget Allocations by Level of Education
Level of Education
Total Primary Secondary College University
Post
Graduate
Mean Mean Mean Mean Mean
Health 17 15 14 12 - 15
Education 13 15 16 18 - 15
Agriculture, Rural and Urban
Development 11 16 14 12 - 14
Energy, Infrastructure and ICT 11 10 11 10 - 11
National Security 9 9 10 14 - 10
Environmental Protection, Water and
Natural Resources 9 7 10 8 - 9
General Economic and Commercial
Affairs 8 7 7 7 - 7
Public Administration & International
Relations 7 8 6 6 - 7
Social Protection, Culture and
Recreation 8 7 7 6 - 7
Governance, Justice, Law and Order 7 6 6 7 - 6
N=750

Some people have proposed that the allocation for next year to the ten sectors be as
follows: Now that you know, would you insert changes in the allocations you have
proposed, If yes please insert
The Proposed Budget Allocation by “Some People” Versus Respondents’ New Proposed
Budget Allocations by Employment Status
Employment Status
Employed Un-employed Self-employed Total
Mean Mean Mean Mean
Health 14 16 14 15
Education 16 15 14 15
Agriculture, Rural and Urban Development 12 14 14 14
Energy, Infrastructure and ICT 12 10 10 11
National Security 10 11 9 10
Environmental Protection, Water and Natural
Resources 7 8 10 9
General Economic and Commercial Affairs 8 7 7 7
Public Administration & International Relations 8 7 7 7
Social Protection, Culture and Recreation 5 7 8 7
Governance, Justice, Law and Order 8 6 6 6
N=750

The National Government has proposed that the allocation for next year to the ten
sectors be as follows: Now that you know, would you insert changes in the allocations
you have proposed
9.6%
75.0%
15.5%
Yes No Don't Know
Respondents’ Decisions to Change Initial Proposed Budget Allocations Based on
Proposals by the National Government
N=750
75.0% of the surveyed respondents indicated that they WOULD NOT change the their
proposed allocations to the budget based on the proposals of the National
Government.
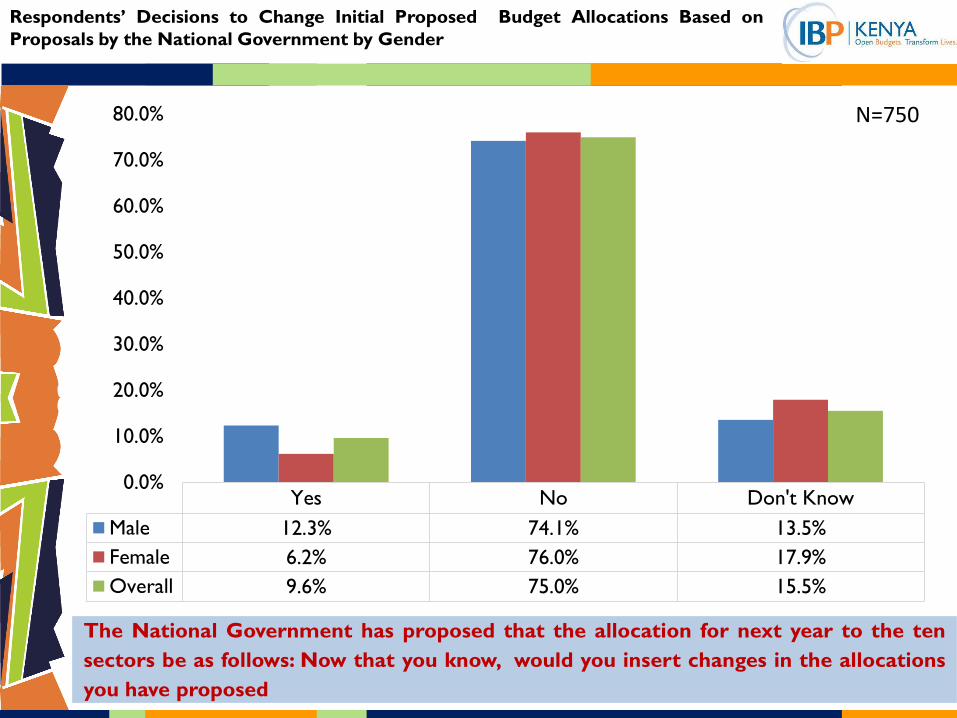
The National Government has proposed that the allocation for next year to the ten
sectors be as follows: Now that you know, would you insert changes in the allocations
you have proposed
Yes No Don't Know
Male 12.3% 74.1% 13.5%
Female 6.2% 76.0% 17.9%
Overall 9.6% 75.0% 15.5%
0.0%
10.0%
20.0%
30.0%
40.0%
50.0%
60.0%
70.0%
80.0%
Respondents’ Decisions to Change Initial Proposed Budget Allocations Based on
Proposals by the National Government by Gender
N=750

The National Government has proposed that the allocation for next year to the ten
sectors be as follows: Now that you know, would you insert changes in the allocations
you have proposed
Yes No Don't Know
Rural 10.4% 76.1% 13.5%
Urban 8.5% 73.5% 18.0%
0.0%
10.0%
20.0%
30.0%
40.0%
50.0%
60.0%
70.0%
80.0%
Respondents’ Decisions to Change Initial Proposed Budget Allocations Based on
Proposals by the National Government by Location
N=750

The National Government has proposed that the allocation for next year to the ten
sectors be as follows: Now that you know, would you insert changes in the allocations
you have proposed
Regions
Central Coast Eastern Nairobi
North
Eastern Nyanza Rift Valley Western Total
Mean Mean Mean Mean Mean Mean Mean Mean Mean
Yes 0.0% 17.4% 12.0% 7.3% 8.0% 10.3% 8.9% 14.0% 9.6%
No 90.7% 72.9% 63.9% 63.6% 92.0% 76.0% 78.5% 64.9% 75.0%
Don't Know 9.3% 9.7% 24.1% 29.1% 0.0% 13.7% 12.6% 21.1% 15.5%
Respondents’ Decisions to Change Initial Proposed Budget Allocations Based on
Proposals by the National Government by Region
N=750

Respondents’ Decisions to Change Initial Proposed Budget Allocations Based on
Proposals by the National Government by Political Party Affiliation
Which Political Party Do You Feel Closest To?
TNA
United
Republic
an Party
(URP)
Jubilee
Alliance
Party
(JAP) ODM
WIPER
DEMO
CRATIC
MOVEM
ENT
KENYA
(WDM
– K)
FORD-
KENYA
Amani
National
Congres
s (ANC)
Chama
Cha
Mashina
ni -
Kenya
(CCMK) KANU
National
Rainbow
Coalitio
n
(NARC)
National
Rainbow
Coalitio
n-Kenya
(NARC-
Kenya) Total
Yes 9.6% 9.6% 8.2% 10.4% 9.6% 0.0% 26.3% 0.0% 0.0% 0.0% 0.0% 9.6%
No 77.2% 77.0% 78.8% 72.1% 68.9% 90.4% 48.1% 72.8% 86.4% 100.0% 100.0% 75.0%
Don't
Know 13.2% 13.4% 13.0% 17.4% 21.5% 9.6% 25.6% 27.2% 13.6% 0.0% 0.0% 15.5%
The National Government has proposed that the allocation for next year to the ten
sectors be as follows: Now that you know, would you insert changes in the allocations
you have proposed
N=750

The National Government has proposed that the allocation for next year to the ten
sectors be as follows: Now that you know, would you insert changes in the allocations
you have proposed
Level of Education
Primary Secondary College University Post Graduate Total
Mean Mean Mean Mean Mean Mean
Yes 8.3% 11.8% 7.2% 12.1% 0.0% 9.6%
No 75.0% 74.6% 74.2% 80.5% 60.9% 75.0%
Don't Know 16.7% 13.7% 18.6% 7.4% 39.1% 15.5%
Respondents’ Decisions to Change Initial Proposed Budget Allocations Based on
Proposals by the National Government by Level of Education
N=750

The National Government has proposed that the allocation for next year to the ten
sectors be as follows: Now that you know, would you insert changes in the allocations
you have proposed
Employment Status
Employed Un-employed Self-employed Total
Yes 12.0% 8.2% 9.4% 9.6%
No 69.7% 78.2% 74.8% 75.0%
Don't Know 18.2% 13.5% 15.8% 15.5%
Respondents’ Decisions to Change Initial Proposed Budget Allocations Based on
Proposals by the National Government by Employment Status
N=750

Mean Max Min Mode Median S. Dev
Education 16 38 4 10 15 6
Health 15 29 4 10 15 6
Agriculture, Rural and Urban Development 14 35 3 10 10 8
Energy, Infrastructure and ICT 12 24 2 10 10 6
National Security 10 30 2 10 10 5
Environmental Protection, Water and Natural Resources 8 25 0 10 8 5
Public Administration & International Relations 7 20 1 5 5 4
General Economic and Commercial Affairs 7 22 1 5 5 5
Governance, Justice, Law and Order 7 18 1 5 6 3
Social Protection, Culture and Recreation 5 10 1 5 5 3
The National Government has proposed that the allocation for next year to the ten
sectors be as follows: Now that you know, would you insert changes in the allocations
you have proposed, If yes please insert
The Proposed Budget Allocation by the National Government Versus Respondents’
New Proposed Budget Allocations
N=750

The National Government has proposed that the allocation for next year to the ten
sectors be as follows: Now that you know, would you insert changes in the allocations
you have proposed, If yes please insert
Gender
Total
Male Female
Mean Mean
Education 16 16 16
Health 14 16 15
Agriculture, Rural and Urban Development 14 14 14
Energy, Infrastructure and ICT 11 12 12
National Security 10 8 10
Environmental Protection, Water and Natural Resources 8 9 8
Public Administration & International Relations 7 7 7
General Economic and Commercial Affairs 8 5 7
Governance, Justice, Law and Order 7 7 7
Social Protection, Culture and Recreation 5 6 5
The Proposed Budget Allocation by the National Government Versus Respondents’ New
Proposed Budget Allocations by Gender
N=750

The National Government has proposed that the allocation for next year to the ten
sectors be as follows: Now that you know, would you insert changes in the allocations
you have proposed, If yes please insert
The Proposed Budget Allocation by the National Government Versus Respondents’ New
Proposed Budget Allocations by Gender
Gender
Male Female Total
Mean Range Variance Mean Range Variance Mean Range Variance
Education 16 34 40 16 18 35 16 34 38
Health 14 25 41 16 20 29 15 25 37
Agriculture, Rural and Urban Development 14 30 61 14 31 93 14 32 68
Energy, Infrastructure and ICT 11 20 31 12 19 40 12 22 33
National Security 10 28 21 8 18 23 10 28 22
Environmental Protection, Water and Natural
Resources 8 19 19 9 25 37 8 25 24
Public Administration & International Relations 7 19 18 7 14 15 7 19 17
General Economic and Commercial Affairs 8 21 24 5 14 12 7 21 21
Governance, Justice, Law and Order 7 16 11 7 9 8 7 17 10
Social Protection, Culture and Recreation 5 9 8 6 8 6 5 9 7
N=750

The National Government has proposed that the allocation for next year to the ten
sectors be as follows: Now that you know, would you insert changes in the allocations
you have proposed, If yes please insert
Location
Rural Urban Total
Mean Max Min Mean Max Min Mean Max Min
Education 15 38 4 18 25 9 16 38 4
Health 15 29 5 15 25 4 15 29 4
Agriculture, Rural and Urban Development: 14 35 5 12 32 3 14 35 3
Energy, Infrastructure and ICT 11 20 2 13 24 4 12 24 2
National Security 10 30 2 9 20 2 10 30 2
Environmental Protection, Water and
Natural Resources 8 25 0 8 15 2 8 25 0
Public Administration & International
Relations 7 20 1 8 18 1 7 20 1
General Economic and Commercial Affairs 8 22 1 6 18 1 7 22 1
Governance, Justice, Law and Order 7 18 1 6 10 2 7 18 1
Social Protection, Culture and Recreation 5 10 1 6 10 1 5 10 1
The Proposed Budget Allocation by the National Government Versus Respondents’ New
Proposed Budget Allocations by Location
N=750

The National Government has proposed that the allocation for next year to the ten
sectors be as follows: Now that you know, would you insert changes in the allocations
you have proposed, If yes please insert
Regions
Total
Central Coast Eastern Nairobi
North
Eastern Nyanza
Rift
Valley Western
Mean Mean Mean Mean Mean Mean Mean Mean
Education - 15 14 14 10 17 19 18 16
Health - 15 14 13 16 16 12 19 15
Agriculture, Rural and Urban
Development - 9 16 8 10 14 11 21 14
Energy, Infrastructure and ICT - 11 12 14 8 10 15 8 12
National Security - 11 10 10 10 14 8 6 10
Environmental Protection, Water
and Natural Resources - 9 10 9 19 7 7 5 8
Public Administration &
International Relations - 7 6 9 8 5 9 7 7
General Economic and
Commercial Affairs - 8 6 11 8 8 6 6 7
Governance, Justice, Law and
Order - 7 6 8 9 5 7 6 7
Social Protection, Culture and
Recreation - 7 7 5 4 4 5 4 5
The Proposed Budget Allocation by the National Government Versus Respondents’ New
Proposed Budget Allocations by Region
N=750

The National Government has proposed that the allocation for next year to the ten sectors be as
follows: Now that you know, would you insert changes in the allocations you have proposed, If
yes please insert
Which Political Party Do You Feel Closest To?
TNA
United
Republic
an Party
(URP)
Jubilee
Alliance
Party
(JAP) ODM
WIPER
DEMO
CRATIC
MOVEM
ENT
KENYA
(WDM
– K)
FORD-
KENYA
Amani
National
Congres
s (ANC)
Chama
Cha
Mashina
ni -
Kenya
(CCMK
) KANU
National
Rainbo
w
Coalitio
n
(NARC)
National
Rainbo
w
Coalitio
n-Kenya
(NARC-
Kenya) Total
Mean Mean Mean Mean Mean Mean Mean Mean Mean Mean Mean Mean
Education 13 22 15 16 15 - 13 - - - - 16
Health 13 13 15 15 19 - 18 - - - - 15
Agriculture, Rural and
Urban Development 15 9 11 16 16 - 8 - - - - 13
Energy, Infrastructure and
ICT 12 14 12 12 6 - 13 - - - - 12
National Security 11 9 11 10 6 - 5 - - - - 10
Environmental Protection,
Water and Natural
Resources 11 7 9 7 12 - 10 - - - - 8
General Economic and
Commercial Affairs 7 8 7 7 5 - 13 - - - - 7
Public Administration &
International Relations 5 4 8 7 7 - 8 - - - - 7
Governance, Justice, Law
and Order 6 6 8 7 6 - 8 - - - - 7
Social Protection, Culture
and Recreation 6 8 5 4 7 - 8 - - - - 5
The Proposed Budget Allocation by the National Government Versus Respondents’ New
Proposed Budget Allocations by Political Party Affiliation
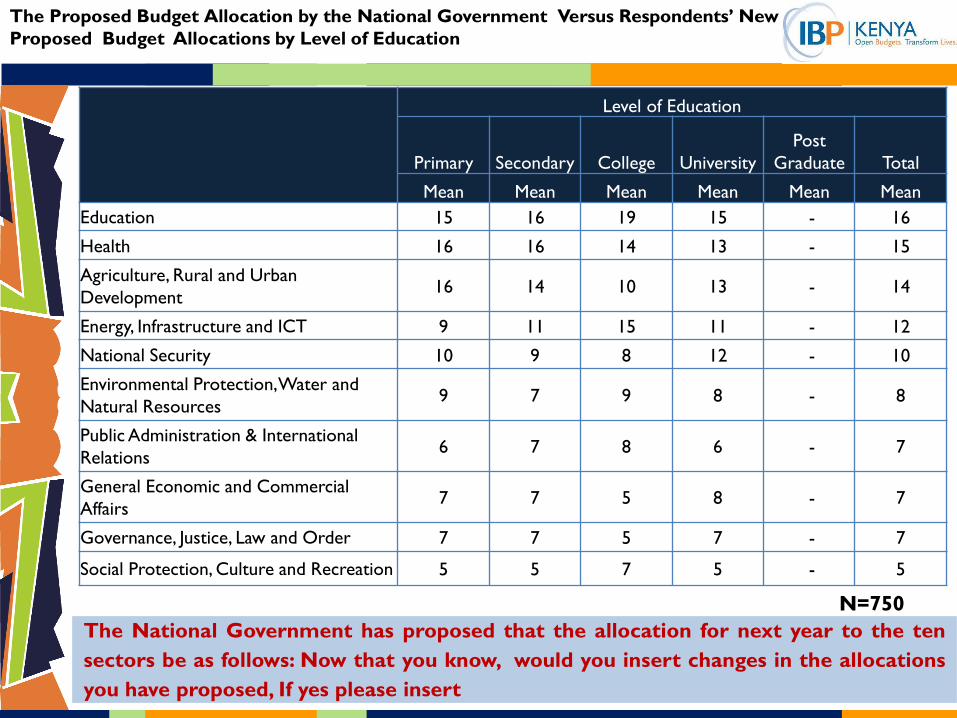
The Proposed Budget Allocation by the National Government Versus Respondents’ New
Proposed Budget Allocations by Level of Education
Level of Education
Primary Secondary College University
Post
Graduate Total
Mean Mean Mean Mean Mean Mean
Education 15 16 19 15 - 16
Health 16 16 14 13 - 15
Agriculture, Rural and Urban
Development 16 14 10 13 - 14
Energy, Infrastructure and ICT 9 11 15 11 - 12
National Security 10 9 8 12 - 10
Environmental Protection, Water and
Natural Resources 9 7 9 8 - 8
Public Administration & International
Relations 6 7 8 6 - 7
General Economic and Commercial
Affairs 7 7 5 8 - 7
Governance, Justice, Law and Order 7 7 5 7 - 7
Social Protection, Culture and Recreation 5 5 7 5 - 5
The National Government has proposed that the allocation for next year to the ten
sectors be as follows: Now that you know, would you insert changes in the allocations
you have proposed, If yes please insert
N=750

The National Government has proposed that the allocation for next year to the ten
sectors be as follows: Now that you know, would you insert changes in the allocations
you have proposed, If yes please insert
Employment Status
Employed Un-employed Self-employed Total
Mean Mean Mean Mean
Education 16 14 19 16
Health 13 15 16 15
Agriculture, Rural and Urban Development 11 14 16 14
Energy, Infrastructure and ICT 14 11 10 12
National Security 11 10 8 10
Environmental Protection, Water and Natural
Resources 7 11 6 8
Public Administration & International Relations 8 7 6 7
General Economic and Commercial Affairs 8 7 6 7
Governance, Justice, Law and Order 7 7 6 7
Social Protection, Culture and Recreation 6 5 5 5
The Proposed Budget Allocation by the National Government Versus Respondents’ New
Proposed Budget Allocations by Employment Status
N=750

When the national government makes decisions about the sector allocation of the
budget, it listens to wananchi like me:
52.2%
24.2%
15.6%
6.3%
1.7%
Not at all A little Somewhat Don’t know A lot
Respondents’ Perceptions on Whether the National Government Involves Citizens
When it Makes Decisions about the Sector Allocation of The Budget
N=1500
52.2% of the surveyed respondents indicated that the National Government does not listen to ordinary citizens at all when it makes decisions about the sector allocation of the budget.

When the national government makes decisions about the sector allocation of the
budget, it listens to wananchi like me:
Not at all A little Somewhat Don’t know A lot
Male 55.2% 24.8% 12.8% 5.4% 1.9%
Female 48.3% 23.4% 19.3% 7.6% 1.5%
Overall 52.2% 24.2% 15.6% 6.3% 1.7%
0.0%
10.0%
20.0%
30.0%
40.0%
50.0%
60.0%
Respondents’ Perceptions on Whether the National Government Involves Citizens
When it Makes Decisions about the Sector Allocation of The Budget by Gender
N=1500

When the national government makes decisions about the sector allocation of the
budget, it listens to wananchi like me:
Not at all A little Somewhat Don’t know A lot
Rural 53.8% 22.3% 15.6% 6.6% 1.7%
Urban 49.8% 26.8% 15.6% 6.0% 1.7%
Overall 52.2% 24.2% 15.6% 6.3% 1.7%
0.0%
10.0%
20.0%
30.0%
40.0%
50.0%
60.0%
Respondents’ Perceptions on Whether the National Government Involves Citizens
When it Makes Decisions about the Sector Allocation of The Budget by Location
N=1500

When the national government makes decisions about the sector allocation of the
budget, it listens to wananchi like me:
Regions
Central Coast Eastern Nairobi
North
Eastern Nyanza Rift Valley Western Total
Not at all 47.4% 58.1% 39.8% 60.8% 41.9% 54.1% 46.1% 79.4% 52.2%
A little 26.8% 23.0% 29.7% 26.6% 44.6% 18.1% 24.1% 10.1% 24.2%
Somewhat 13.2% 5.6% 28.0% 7.7% 9.7% 15.6% 21.9% 4.1% 15.6%
Don’t know 11.5% 10.4% 1.2% 4.9% 3.8% 8.5% 5.5% 6.4% 6.3%
A lot 1.2% 2.8% 1.3% 0.0% 0.0% 3.7% 2.4% 0.0% 1.7%
Respondents’ Perceptions on Whether the National Government Involves Citizens
When it Makes Decisions about the Sector Allocation of The Budget by Region
N=1500

Respondents’ Perceptions on Whether the National Government Involves Citizens When it
Makes Decisions about the Sector Allocation of The Budget by Political Party Affiliation
Which Political Party Do You Feel Closest To?
TNA
United
Republica
n Party
(URP)
Jubilee
Alliance
Party
(JAP) ODM
WIPER
DEMOC
RATIC
MOVEME
NT
KENYA
(WDM –
K)
FORD-
KENYA
Amani
National
Congress
(ANC)
Chama
Cha
Mashinani
- Kenya
(CCMK) KANU
National
Rainbow
Coalition
(NARC)
National
Rainbow
Coalition
-Kenya
(NARC-
Kenya) Total
Not at all 38.6% 46.0% 51.3% 60.0% 33.9% 58.2% 56.8% 52.9% 43.5% 27.8% 75.8% 52.2%
A little 28.1% 32.5% 23.1% 19.8% 38.7% 22.1% 21.4% 36.7% 25.0% 41.9% 24.2% 24.2%
Somewhat 22.3% 18.4% 16.4% 13.1% 24.5% 8.5% 17.3% 0.0% 14.4% 16.3% 0.0% 15.6%
Don’t know 8.5% 3.1% 7.1% 5.6% 2.9% 8.5% 4.4% 10.4% 13.4% 13.9% 0.0% 6.3%
A lot 2.5% 0.0% 2.1% 1.6% 0.0% 2.8% 0.0% 0.0% 3.7% 0.0% 0.0% 1.7%
When the national government makes decisions about the sector allocation of the
budget, it listens to wananchi like me:
N=1500

Respondents’ Perceptions on Whether the National Government Involves Citizens When
it Makes Decisions about the Sector Allocation of The Budget by Level of Education
Level of Education
Primary Secondary College University
Post
Graduate Total
Not at all 52.1% 54.3% 53.0% 45.7% 36.0% 52.2%
A little 22.6% 21.2% 25.4% 32.5% 32.7% 24.2%
Somewhat 15.8% 16.3% 15.3% 11.9% 31.3% 15.6%
Don’t know 7.2% 6.8% 4.4% 8.8% 0.0% 6.3%
A lot 2.3% 1.4% 2.0% 1.0% 0.0% 1.7%
When the national government makes decisions about the sector allocation of the
budget, it listens to wananchi like me:
N=1500
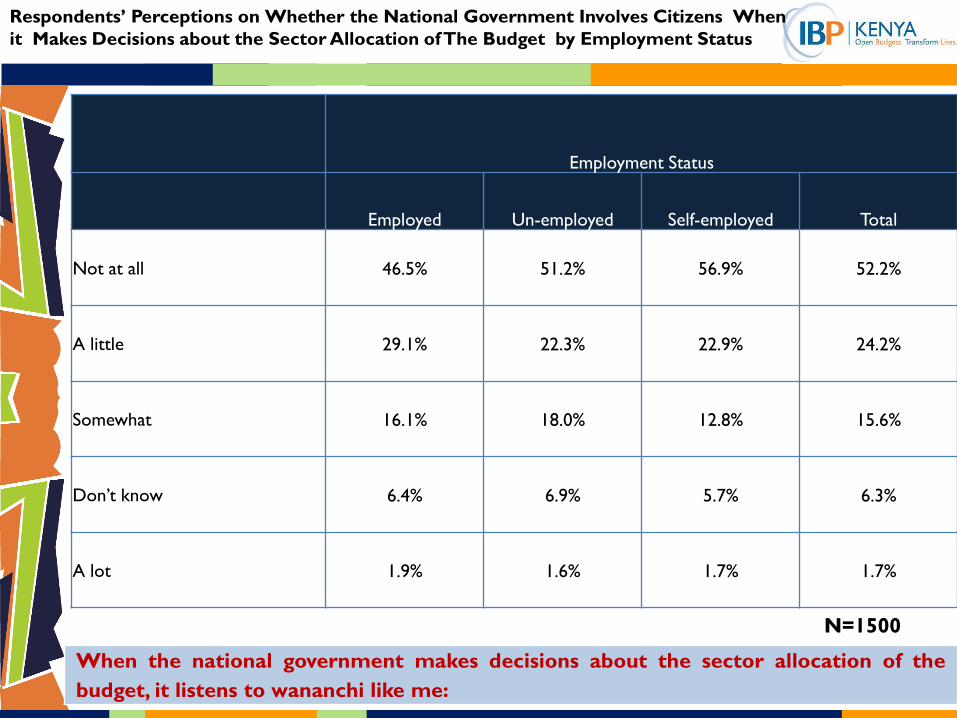
When the national government makes decisions about the sector allocation of the
budget, it listens to wananchi like me:
Employment Status
Employed Un-employed Self-employed Total
Not at all 46.5% 51.2% 56.9% 52.2%
A little 29.1% 22.3% 22.9% 24.2%
Somewhat 16.1% 18.0% 12.8% 15.6%
Don’t know 6.4% 6.9% 5.7% 6.3%
A lot 1.9% 1.6% 1.7% 1.7%
Respondents’ Perceptions on Whether the National Government Involves Citizens When
it Makes Decisions about the Sector Allocation of The Budget by Employment Status
N=1500

When the county government makes decisions about the sector allocation of the
budget, it listens to wananchi like me:
47.8%
29.8%
15.1%
4.4% 2.9%
Not at all A little Somewhat Don’t know A lot
47.8% of the surveyed respondents indicated that the County Governments do not listen to ordinary citizens at all when they make decisions about the sector allocation of the budget.
Respondents’ Perceptions on Whether County Governments Involve Citizens When it
Makes Decisions about the Sector Allocation of The Budget
N=1500

When the county government makes decisions about the sector allocation of the
budget, it listens to wananchi like me:
Not at all A little Somewhat Don’t know A lot
Male 49.5% 30.4% 13.7% 3.7% 2.8%
Female 45.6% 29.1% 16.9% 5.5% 2.9%
Overall 47.8% 29.8% 15.1% 4.4% 2.9%
0.0%
10.0%
20.0%
30.0%
40.0%
50.0%
60.0%
Respondents’ Perceptions on Whether County Governments Involve Citizens When it
Makes Decisions about the Sector Allocation of The Budget by Gender
N=1500

When the county government makes decisions about the sector allocation of the
budget, it listens to wananchi like me:
Not at all A little Somewhat Don’t know A lot
Rural 52.0% 28.3% 13.8% 3.3% 2.6%
Urban 41.7% 32.1% 16.9% 6.1% 3.2%
Overall 47.8% 29.8% 15.1% 4.4% 2.9%
0.0%
10.0%
20.0%
30.0%
40.0%
50.0%
60.0%
Respondents’ Perceptions on Whether County Governments Involve Citizens When it
Makes Decisions about the Sector Allocation of The Budget by Location
N=1500

When the county government makes decisions about the sector allocation of the
budget, it listens to wananchi like me:
Regions
Central Coast Eastern Nairobi
North
Eastern Nyanza Rift Valley Western Total
Not at all 50.7% 58.8% 37.8% 48.3% 50.1% 46.9% 35.0% 78.3% 47.8%
A little 32.6% 27.3% 33.3% 35.7% 38.0% 26.5% 33.6% 11.6% 29.8%
Somewhat 8.1% 4.9% 25.8% 10.5% 6.3% 16.9% 21.8% 6.0% 15.1%
Don’t know 6.9% 7.6% 1.0% 5.6% 5.6% 5.9% 3.2% 3.7% 4.4%
A lot 1.8% 1.4% 2.1% 0.0% 0.0% 3.7% 6.4% 0.4% 2.9%
Respondents’ Perceptions on Whether County Governments Involve Citizens When it
Makes Decisions about the Sector Allocation of The Budget by Region
N=1500
Respondents’ Perceptions on Whether County Governments Involve Citizens When it
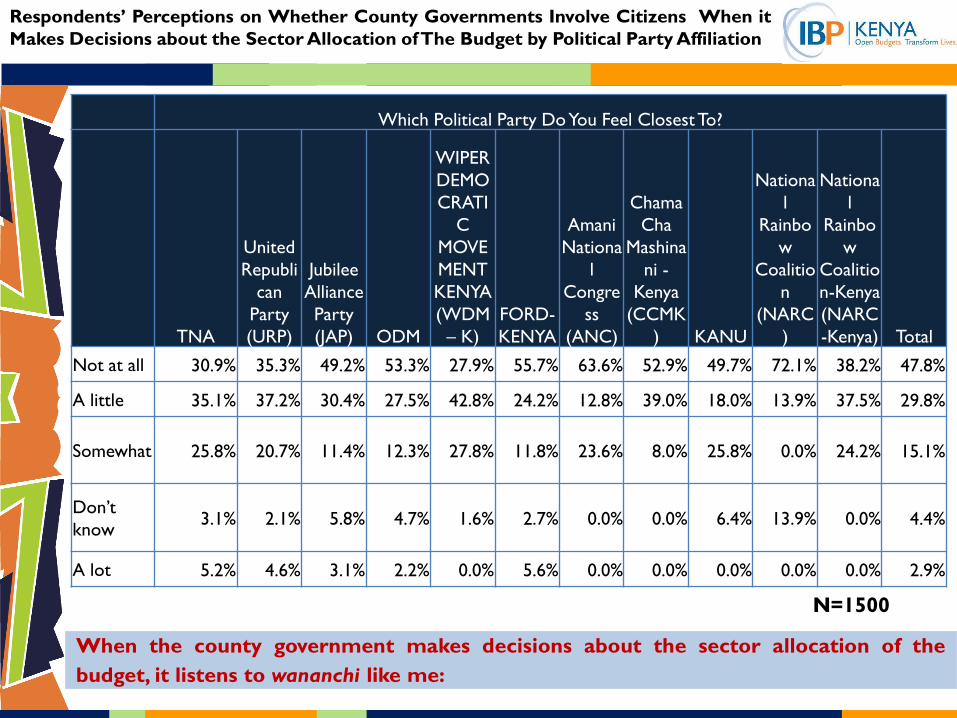
Makes Decisions about the Sector Allocation of The Budget by Political Party Affiliation
Which Political Party Do You Feel Closest To?
TNA
United
Republi
can
Party
(URP)
Jubilee
Alliance
Party
(JAP) ODM
WIPER
DEMO
CRATI
C
MOVE
MENT
KENYA
(WDM
– K)
FORD-
KENYA
Amani
Nationa
l
Congre
ss
(ANC)
Chama
Cha
Mashina
ni -
Kenya
(CCMK
) KANU
Nationa
l
Rainbo
w
Coalitio
n
(NARC
)
Nationa
l
Rainbo
w
Coalitio
n-Kenya
(NARC
-Kenya) Total
Not at all 30.9% 35.3% 49.2% 53.3% 27.9% 55.7% 63.6% 52.9% 49.7% 72.1% 38.2% 47.8%
A little 35.1% 37.2% 30.4% 27.5% 42.8% 24.2% 12.8% 39.0% 18.0% 13.9% 37.5% 29.8%
Somewhat 25.8% 20.7% 11.4% 12.3% 27.8% 11.8% 23.6% 8.0% 25.8% 0.0% 24.2% 15.1%
Don’t
know 3.1% 2.1% 5.8% 4.7% 1.6% 2.7% 0.0% 0.0% 6.4% 13.9% 0.0% 4.4%
A lot 5.2% 4.6% 3.1% 2.2% 0.0% 5.6% 0.0% 0.0% 0.0% 0.0% 0.0% 2.9%
When the county government makes decisions about the sector allocation of the
budget, it listens to wananchi like me:
N=1500

Respondents’ Perceptions on Whether County Governments Involve Citizens When it
Makes Decisions about the Sector Allocation of The Budget by Level of Education
Level of Education
Primary Secondary College University
Post
Graduate Total
Not at all 50.7% 48.6% 47.4% 42.8% 25.8% 47.8%
A little 27.9% 26.1% 33.3% 33.6% 56.5% 29.8%
Somewhat 14.7% 17.3% 12.8% 14.8% 12.8% 15.1%
Don’t know 3.5% 5.0% 3.9% 5.7% 4.9% 4.4%
A lot 3.1% 3.0% 2.6% 3.2% 0.0% 2.9%
When the county government makes decisions about the sector allocation of the
budget, it listens to wananchi like me:
N=1500

When the county government makes decisions about the sector allocation of the
budget, it listens to wananchi like me:
Employment Status
Employed Un-employed Self-employed Total
Not at all 42.2% 49.1% 49.9% 47.8%
A little 32.6% 26.5% 31.6% 29.8%
Somewhat 16.9% 17.2% 11.6% 15.1%
Don’t know 5.2% 4.5% 3.9% 4.4%
A lot 3.1% 2.7% 3.0% 2.9%
Respondents’ Perceptions on Whether County Governments Involve Citizens When it
Makes Decisions about the Sector Allocation of The Budget by Employment Status
N=1500

When the government makes choices in the budget, it sometimes provides a reason or
justification for those choices. On a scale of 1 – 5 where 1 is “Extremely dissatisfied” 3
is “Somehow satisfied” and 5 is “Very satisfied”, how satisfied are you with the kinds of
justifications that the national government provides for these choices?
39.8%
34.4%
13.7%
10.5%
1.6%
0.0%
5.0%
10.0%
15.0%
20.0%
25.0%
30.0%
35.0%
40.0%
45.0%
Somewhat
satisfied
Disatisfied Satisfied Very Disatisfied Very Satisfied
Satisfaction with the National Government’s Justifications for Budget Allocation
N=1500
39.8% of the surveyed respondents indicated that they
were “somewhat satisfied” with the justifications the
National Government gives for its budget choices.
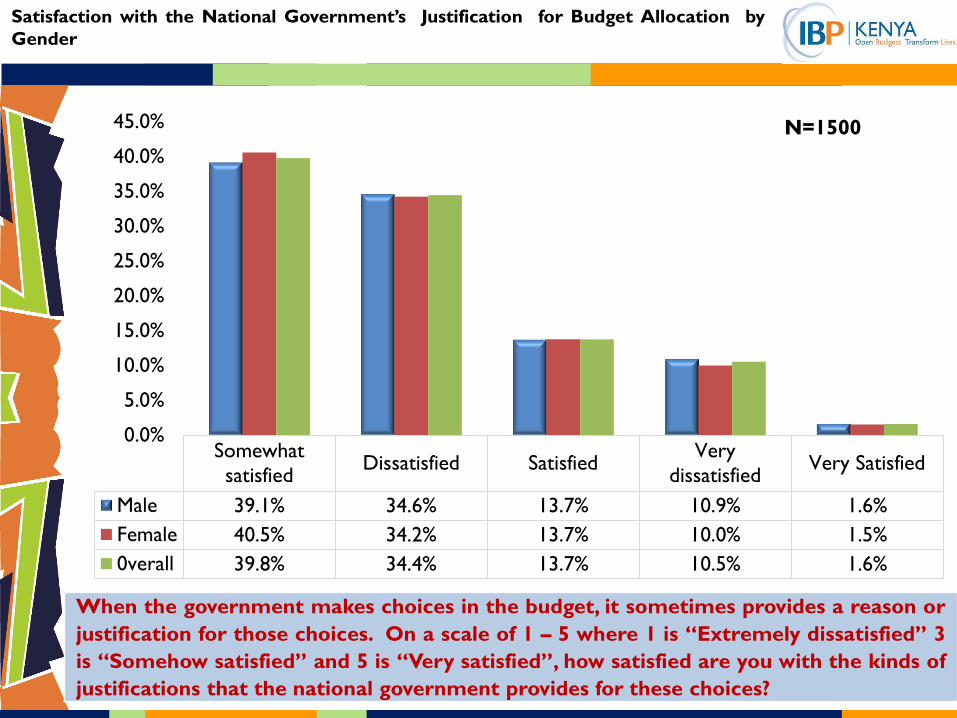
When the government makes choices in the budget, it sometimes provides a reason or
justification for those choices. On a scale of 1 – 5 where 1 is “Extremely dissatisfied” 3
is “Somehow satisfied” and 5 is “Very satisfied”, how satisfied are you with the kinds of
justifications that the national government provides for these choices?
Satisfaction with the National Government’s Justification for Budget Allocation by
Gender
Somewhat
satisfiedDissatisfied Satisfied
Very
dissatisfiedVery Satisfied
Male 39.1% 34.6% 13.7% 10.9% 1.6%
Female 40.5% 34.2% 13.7% 10.0% 1.5%
0verall 39.8% 34.4% 13.7% 10.5% 1.6%
0.0%
5.0%
10.0%
15.0%
20.0%
25.0%
30.0%
35.0%
40.0%
45.0% N=1500

When the government makes choices in the budget, it sometimes provides a reason or
justification for those choices. On a scale of 1 – 5 where 1 is “Extremely dissatisfied” 3
is “Somehow satisfied” and 5 is “Very satisfied”, how satisfied are you with the kinds of
justifications that the national government provides for these choices?
Satisfaction with the National Government’s Justification for Budget Allocation by
Location
Somewhat
satisfiedDissatisfied Satisfied
Very
dissatisfiedVery Satisfied
Rural 37.6% 36.0% 13.5% 11.9% 1.0%
Urban 42.8% 32.2% 14.1% 8.5% 2.4%
0verall 39.8% 34.4% 13.7% 10.5% 1.6%
0.0%
5.0%
10.0%
15.0%
20.0%
25.0%
30.0%
35.0%
40.0%
45.0% N=1500

When the government makes choices in the budget, it sometimes provides a reason or
justification for those choices. On a scale of 1 – 5 where 1 is “Extremely dissatisfied” 3
is “Somehow satisfied” and 5 is “Very satisfied”, how satisfied are you with the kinds of
justifications that the national government provides for these choices?
Satisfaction with the National Government’s Justification for Budget Allocation by
Region
Regions
Total Central Coast Eastern Nairobi
North
Eastern Nyanza Rift Valley Western
Somewhat satisfied 51.5% 41.9% 44.6% 53.8% 61.0% 29.1% 37.7% 16.6% 39.8%
Dissatisfied 33.8% 39.2% 23.8% 32.9% 29.3% 48.1% 22.9% 58.7% 34.4%
Satisfied 11.9% 10.5% 18.0% 6.3% 3.4% 5.8% 22.8% 12.4% 13.7%
Very dissatisfied 2.8% 8.5% 12.7% 6.3% 6.3% 14.3% 13.0% 11.8% 10.5%
Very Satisfied 0.0% 0.0% .8% .7% 0.0% 2.9% 3.6% 0.5% 1.6%
N=1500

Satisfaction with the National Government’s Justification for Budget Allocation by
Political Party Affiliation
Which Political Party Do You Feel Closest To?
TNA
United
Republi
can
Party
(URP)
Jubilee
Alliance
Party
(JAP) ODM
WIPER
DEMO
CRATI
C
MOVE
MENT
KENYA
(WDM
– K)
FORD-
KENYA
Amani
Nationa
l
Congres
s
(ANC)
Chama
Cha
Mashina
ni -
Kenya
(CCMK
) KANU
Nationa
l
Rainbo
w
Coalitio
n
(NARC)
Nationa
l
Rainbo
w
Coalitio
n-Kenya
(NARC-
Kenya) Total
Somewhat
satisfied 47.9% 48.1% 46.0% 31.2% 39.9% 46.4% 18.1% 19.5% 44.4% 39.5% 42.5% 39.8%
Dissatisfied 27.4% 20.9% 30.0% 47.5% 12.0% 25.7% 43.0% 59.7% 14.3% 30.3% 19.2% 34.4%
Satisfied 17.1% 21.7% 13.1% 10.4% 21.8% 17.2% 14.6% 20.8% 18.3% 16.3% 0.0% 13.7%
Very
dissatisfied 6.4% 6.1% 9.1% 9.5% 26.2% 10.8% 24.4% 0.0% 19.3% 13.9% 38.2% 10.5%
Very Satisfied 1.2% 3.2% 1.9% 1.4% 0.0% 0.0% 0.0% 0.0% 3.7% 0.0% 0.0% 1.6%
When the government makes choices in the budget, it sometimes provides a reason or
justification for those choices. On a scale of 1 – 5 where 1 is “Extremely dissatisfied” 3
is “Somehow satisfied” and 5 is “Very satisfied”, how satisfied are you with the kinds of
justifications that the national government provides for these choices?
N=1500

When the government makes choices in the budget, it sometimes provides a reason or
justification for those choices. On a scale of 1 – 5 where 1 is “Extremely dissatisfied” 3
is “Somehow satisfied” and 5 is “Very satisfied”, how satisfied are you with the kinds of
justifications that the national government provides for these choices?
Satisfaction with the National Government’s Justification for Budget Allocation by
Level of Education
Level of Education
Total Primary Secondary College University Post Graduate
Somewhat satisfied 36.7% 39.3% 40.8% 42.9% 52.5% 39.8%
Dissatisfied 37.5% 33.6% 33.3% 34.2% 33.4% 34.4%
Satisfied 13.4% 13.5% 14.5% 13.1% 14.1% 13.7%
Very dissatisfied 11.0% 11.7% 10.1% 8.2% 0.0% 10.5%
Very Satisfied 1.5% 1.9% 1.3% 1.6% 0.0% 1.6%
N=1500
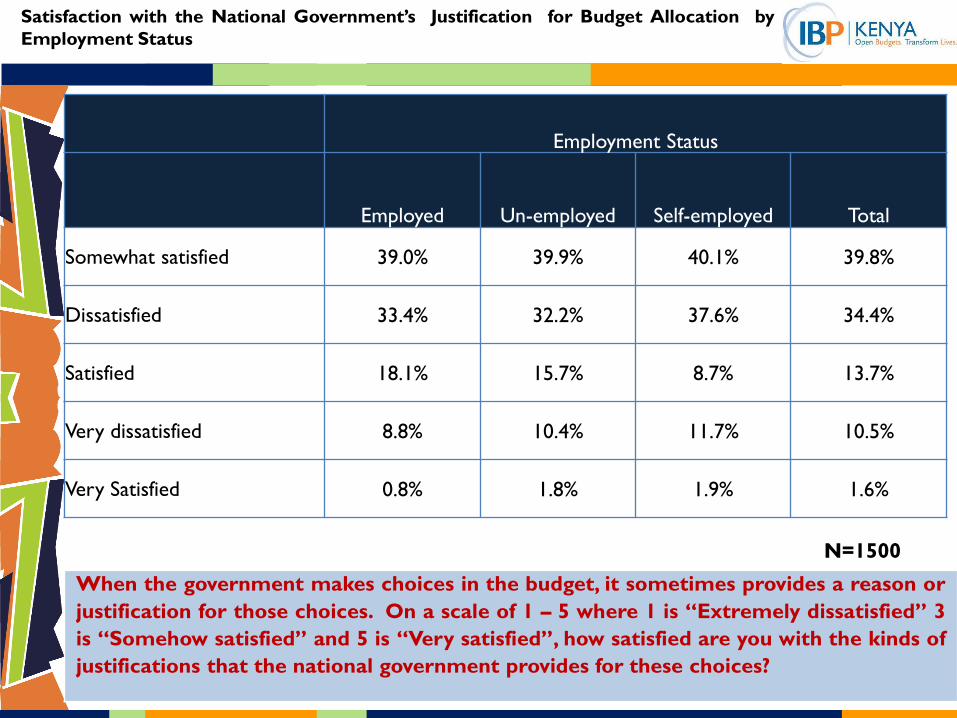
When the government makes choices in the budget, it sometimes provides a reason or
justification for those choices. On a scale of 1 – 5 where 1 is “Extremely dissatisfied” 3
is “Somehow satisfied” and 5 is “Very satisfied”, how satisfied are you with the kinds of
justifications that the national government provides for these choices?
Satisfaction with the National Government’s Justification for Budget Allocation by
Employment Status
Employment Status
Employed Un-employed Self-employed Total
Somewhat satisfied 39.0% 39.9% 40.1% 39.8%
Dissatisfied 33.4% 32.2% 37.6% 34.4%
Satisfied 18.1% 15.7% 8.7% 13.7%
Very dissatisfied 8.8% 10.4% 11.7% 10.5%
Very Satisfied 0.8% 1.8% 1.9% 1.6%
N=1500

Using the same scale as Q.7 above, how satisfied are you with the justifications that the
county governments provide when they make budget choices?
37.1% 36.7%
13.0% 12.0%
1.3%
0.0%
5.0%
10.0%
15.0%
20.0%
25.0%
30.0%
35.0%
40.0%
Somewhat
satisfied
Disatisfied Very Disatisfied Satisfied Very Satisfied
Satisfaction with the County Governments’ Justifications for Budget Allocation
N=1500
37.1% of the surveyed respondents indicated that they
were “somewhat satisfied” with the justifications the
County Governments give for their budget choices.

Using the same scale as Q.7 above, how satisfied are you with the justifications that the
county governments provide when they make budget choices?
Somewhat
satisfiedDissatisfied
Very
dissatisfiedSatisfied Very Satisfied
Male 37.0% 35.8% 13.9% 12.2% 1.1%
Female 37.2% 37.7% 12.0% 11.7% 1.5%
Overall 37.1% 36.7% 13.0% 12.0% 1.3%
0.0%
5.0%
10.0%
15.0%
20.0%
25.0%
30.0%
35.0%
40.0%
Satisfaction with the County Governments’ Justifications for Budget Allocation by
Gender
N=1500

Using the same scale as Q.7 above, how satisfied are you with the justifications that the
county governments provide when they make budget choices?
Somewhat
satisfiedDissatisfied
Very
dissatisfiedSatisfied Very Satisfied
Rural 35.8% 38.2% 14.2% 11.0% .9%
Urban 38.9% 34.5% 11.4% 13.4% 1.8%
Overall 37.1% 36.7% 13.0% 12.0% 1.3%
0.0%
5.0%
10.0%
15.0%
20.0%
25.0%
30.0%
35.0%
40.0%
45.0%
Satisfaction with the County Governments Justifications for Budget Allocation by
Location
N=1500
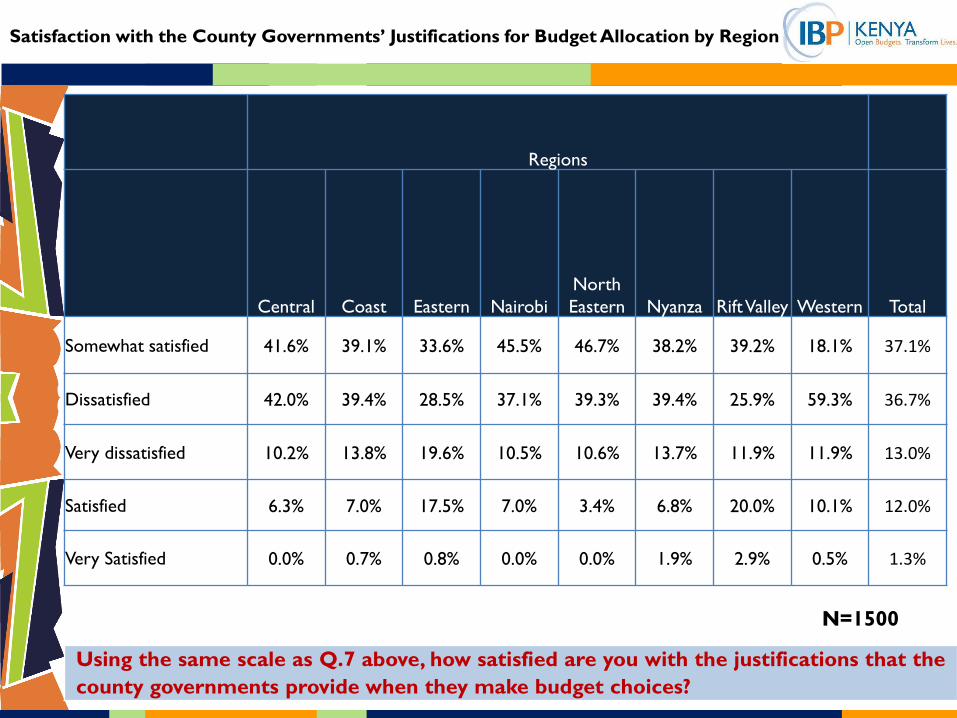
Using the same scale as Q.7 above, how satisfied are you with the justifications that the
county governments provide when they make budget choices?
Satisfaction with the County Governments’ Justifications for Budget Allocation by Region
Regions
Central Coast Eastern Nairobi
North
Eastern Nyanza Rift Valley Western Total
Somewhat satisfied 41.6% 39.1% 33.6% 45.5% 46.7% 38.2% 39.2% 18.1% 37.1%
Dissatisfied 42.0% 39.4% 28.5% 37.1% 39.3% 39.4% 25.9% 59.3% 36.7%
Very dissatisfied 10.2% 13.8% 19.6% 10.5% 10.6% 13.7% 11.9% 11.9% 13.0%
Satisfied 6.3% 7.0% 17.5% 7.0% 3.4% 6.8% 20.0% 10.1% 12.0%
Very Satisfied 0.0% 0.7% 0.8% 0.0% 0.0% 1.9% 2.9% 0.5% 1.3%
N=1500

Satisfaction with the County Governments’ Justifications for Budget Allocation by
Political Party Affiliation
Which Political Party Do You Feel Closest To?
TNA
United
Republi
can
Party
(URP)
Jubilee
Alliance
Party
(JAP) ODM
WIPER
DEMO
CRATI
C
MOVE
MENT
KENYA
(WDM
– K)
FORD-
KENYA
Amani
Nationa
l
Congre
ss
(ANC)
Chama
Cha
Mashina
ni -
Kenya
(CCMK
) KANU
Nationa
l
Rainbo
w
Coalitio
n
(NARC
)
Nationa
l
Rainbo
w
Coalitio
n-Kenya
(NARC
-Kenya) Total
Somewhat
satisfied 38.4% 40.8% 40.3% 35.8% 39.3% 36.0% 11.1% 9.1% 41.5% 40.6% 18.3% 37.1%
Dissatisfied 40.3% 32.0% 32.8% 43.6% 14.3% 30.5% 38.6% 72.4% 13.6% 16.3% 24.2% 36.7%
Very
dissatisfied 9.0% 8.8% 14.1% 9.6% 25.9% 16.3% 28.8% 8.0% 19.3% 26.7% 38.2% 13.0%
Satisfied 12.3% 16.0% 10.9% 10.0% 20.5% 17.2% 21.5% 10.4% 21.8% 16.3% 19.2% 12.0%
Very
Satisfied 0.0% 2.4% 1.9% 1.0% 0.0% 0.0% 0.0% 0.0% 3.8% 0.0% 0.0% 1.3%
Using the same scale as Q.7 above, how satisfied are you with the justifications that the
county governments provide when they make budget choices?
N=1500

Using the same scale as Q.7 above, how satisfied are you with the justifications that the
county governments provide when they make budget choices?
Satisfaction with the County Governments Justifications for Budget Allocation by Level
of Education
Level of Education
Primary Secondary College University Post Graduate Total
Somewhat
satisfied 35.3% 38.0% 37.0% 36.6% 49.0% 37.1%
Dissatisfied 40.1% 35.1% 35.7% 38.2% 28.0% 36.7%
Very dissatisfied 12.5% 14.9% 12.3% 10.4% 11.5% 13.0%
Satisfied 10.8% 10.8% 13.7% 13.7% 11.5% 12.0%
Very Satisfied 1.4% 1.3% 1.3% 1.1% 0.0% 1.3%
N=1500

Satisfaction with the County Governments’ Justifications for Budget Allocation by
Employment Status
Employment Status
Employed Un-employed Self-employed Total
Somewhat satisfied
36.8% 39.3% 34.9% 37.1%
Dissatisfied
35.6% 35.3% 38.8% 36.7%
Very dissatisfied
11.2% 13.2% 14.1% 13.0%
Satisfied
15.1% 11.2% 10.7% 12.0%
Very Satisfied
1.3% 1.0% 1.5% 1.3%
Using the same scale as Q.7 above, how satisfied are you with the justifications that the
county governments provide when they make budget choices?
N=1500

Distribution/Fairness

Scenario Person Mean Median Mode
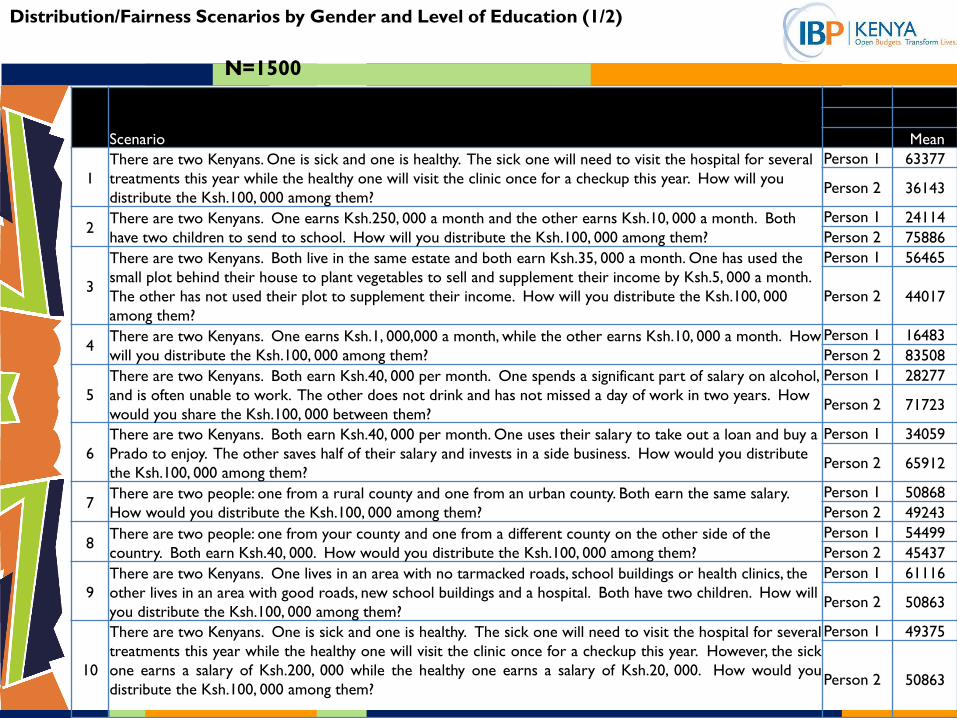
There are two Kenyans. One is sick and one is healthy. The sick one
will need to visit the hospital for several treatments this year while the
healthy one will visit the clinic once for a checkup this year. How will
you distribute the Ksh.100, 000 among them?
Person 1 63377 70000 50000
Person 2 36143 30000 50000
There are two Kenyans. One earns Ksh.250, 000 a month and the
other earns Ksh.10, 000 a month. Both have two children to send to
school. How will you distribute the Ksh.100, 000 among them?
Person 1 24114 20000 0
Person 2 75886 80000 100000
There are two Kenyans. Both live in the same estate and both earn
Ksh.35, 000 a month. One has used the small plot behind their house
to plant vegetables to sell and supplement their income by Ksh.5, 000
a month. The other has not used their plot to supplement their
income. How will you distribute the Ksh.100, 000 among them?
Person 1 56465 50000 50000
Person 2 44017 50000 50000
There are two Kenyans. One earns Ksh.1, 000,000 a month, while the
other earns Ksh.10, 000 a month. How will you distribute the
Ksh.100, 000 among them?
Person 1 16483 10000 0
Person 2 83508 90000 100000
Distribution/Fairness Scenarios (1/3)
N=1500

Scenario Person Mean Median Mode
There are two Kenyans. Both earn Ksh.40, 000 per month. One
spends a significant part of salary on alcohol, and is often unable to
work. The other does not drink and has not missed a day of work in
two years. How would you share the Ksh.100, 000 between them?
Person 1 28277 25000 50000
Person 2 71723 75000 50000
There are two Kenyans. Both earn Ksh.40, 000 per month. One uses
their salary to take out a loan and buy a Prado to enjoy. The other
saves half of their salary and invests in a side business. How would you
distribute the Ksh.100, 000 among them?
Person 1 34059 40000 50000
Person 2 65912 60000 50000
There are two people: one from a rural county and one from an urban
county. Both earn the same salary. How would you distribute the
Ksh.100, 000 among them?
Person 1 50868 50000 50000
Person 2 49243 50000 50000
There are two people: one from your county and one from a different
county on the other side of the country. Both earn Ksh.40, 000. How
would you distribute the Ksh.100, 000 among them?
Person 1 54499 50000 50000
Person 2 45437 50000 50000
Distribution/Fairness Scenarios (2/3)
N=1500
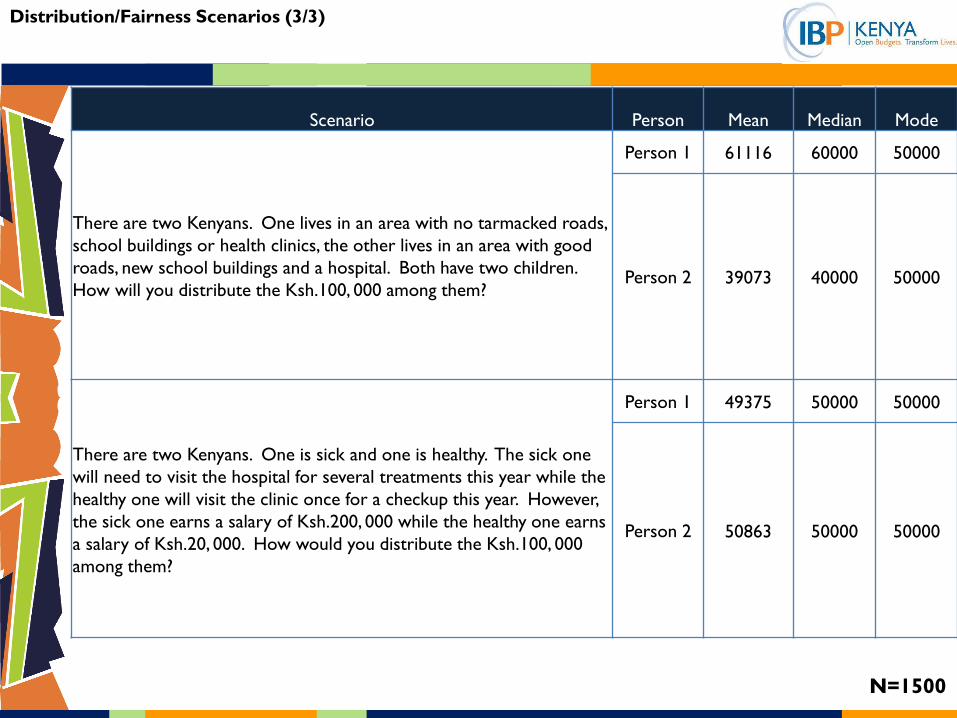
Scenario Person Mean Median Mode
There are two Kenyans. One lives in an area with no tarmacked roads,
school buildings or health clinics, the other lives in an area with good
roads, new school buildings and a hospital. Both have two children.
How will you distribute the Ksh.100, 000 among them?
Person 1 61116 60000 50000
Person 2 39073 40000 50000
There are two Kenyans. One is sick and one is healthy. The sick one
will need to visit the hospital for several treatments this year while the
healthy one will visit the clinic once for a checkup this year. However,
the sick one earns a salary of Ksh.200, 000 while the healthy one earns
a salary of Ksh.20, 000. How would you distribute the Ksh.100, 000
among them?
Person 1 49375 50000 50000
Person 2 50863 50000 50000
Distribution/Fairness Scenarios (3/3)
N=1500
Scenario Mean
1
There are two Kenyans. One is sick and one is healthy. The sick one will need to visit the hospital for several
treatments this year while the healthy one will visit the clinic once for a checkup this year. How will you
distribute the Ksh.100, 000 among them?
Person 1 63377
Person 2 36143
2 There are two Kenyans. One earns Ksh.250, 000 a month and the other earns Ksh.10, 000 a month. Both
have two children to send to school. How will you distribute the Ksh.100, 000 among them?
Person 1 24114
Person 2 75886
3
There are two Kenyans. Both live in the same estate and both earn Ksh.35, 000 a month. One has used the
small plot behind their house to plant vegetables to sell and supplement their income by Ksh.5, 000 a month.
The other has not used their plot to supplement their income. How will you distribute the Ksh.100, 000
among them?
Person 1 56465
Person 2 44017
4 There are two Kenyans. One earns Ksh.1, 000,000 a month, while the other earns Ksh.10, 000 a month. How
will you distribute the Ksh.100, 000 among them?
Person 1 16483
Person 2 83508
5
There are two Kenyans. Both earn Ksh.40, 000 per month. One spends a significant part of salary on alcohol,
and is often unable to work. The other does not drink and has not missed a day of work in two years. How
would you share the Ksh.100, 000 between them?
Person 1 28277
Person 2 71723
6
There are two Kenyans. Both earn Ksh.40, 000 per month. One uses their salary to take out a loan and buy a
Prado to enjoy. The other saves half of their salary and invests in a side business. How would you distribute
the Ksh.100, 000 among them?
Person 1 34059
Person 2 65912
7 There are two people: one from a rural county and one from an urban county. Both earn the same salary.
How would you distribute the Ksh.100, 000 among them?
Person 1 50868
Person 2 49243
8 There are two people: one from your county and one from a different county on the other side of the
country. Both earn Ksh.40, 000. How would you distribute the Ksh.100, 000 among them?
Person 1 54499
Person 2 45437
9
There are two Kenyans. One lives in an area with no tarmacked roads, school buildings or health clinics, the
other lives in an area with good roads, new school buildings and a hospital. Both have two children. How will
you distribute the Ksh.100, 000 among them?
Person 1 61116
Person 2 50863
10
There are two Kenyans. One is sick and one is healthy. The sick one will need to visit the hospital for several
treatments this year while the healthy one will visit the clinic once for a checkup this year. However, the sick
one earns a salary of Ksh.200, 000 while the healthy one earns a salary of Ksh.20, 000. How would you
distribute the Ksh.100, 000 among them?
Person 1 49375
Person 2 50863
Distribution/Fairness Scenarios by Gender and Level of Education (1/2)
N=1500

Scenario
Gender Level of Education
Male Female Primary Secondary College University
Post
Graduate Overall
Mean Mean Mean Mean Mean Mean Mean Mean
1
Person 1 62923 63962 63895 62013 63374 66264 66692 63377
Person 2 36317 35919 35254 37370 36393 33736 33308 36143
2
Person 1 23615 24755 23986 24240 24367 23101 26190 24114
Person 2 76385 75245 76014 75760 75633 76899 73810 75886
3
Person 1 56645 56234 56279 56121 55976 58485 61529 56465
Person 2 44212 43766 43721 43879 45700 41515 38471 44017
4
Person 1 15995 17107 16638 16800 17254 13163 17787 16483
Person 2 84005 82871 83362 83200 82712 86837 82213 83508
5
Person 1 28717 27714 26061 28454 30904 26429 20475 28277
Person 2 71283 72286 73939 71546 69096 73571 79525 71723
6
Person 1 34289 33765 32560 33839 36579 32907 21459 34059
Person 2 65711 66169 67440 66161 63321 67093 78541 65912
7
Person 1 51112 50555 50453 51110 51826 48460 51814 50868
Person 2 48888 49699 49244 48890 48800 51540 48186 49243
8
Person 1 55336 53420 53674 55439 54356 53410 55232 54499
Person 2 44550 46580 46326 44561 45644 46042 44768 45437
9
Person 1 61668 60407 58436 60761 62124 63420 73084 61116
Person 2 50939 50765 49987 52432 51717 45968 47409 50863
10
Person 1 49484 49235 50013 47568 48283 56072 52591 49375
Person 2 50939 50765 49987 52432 51717 45968 47409 50863
Distribution/Fairness Scenarios by Gender and Level of Education (2/2)
N=1500

Scenario
Location
Rural Urban Total
Mean Mean Mean
1
Person 1 63962 62536 63377
Person 2 36570 35531 36143
2
Person 1 24231 23943 24114
Person 2 75769 76057 75886
3
Person 1 55911 57273 56465
Person 2 44030 43998 44017
4
Person 1 15658 17686 16483
Person 2 84325 82314 83508
5
Person 1 29030 27179 28277
Person 2 70970 72821 71723
6
Person 1 35471 32000 34059
Person 2 64529 67929 65912
7
Person 1 51983 49239 50868
Person 2 48204 50761 49243
8
Person 1 54966 53817 54499
Person 2 44926 46183 45437
9
Person 1 61244 60930 61116
Person 2 39076 39070 39073
10
Person 1 50879 47184 49375
Person 2 49522 52816 50863
Distribution/Fairness Scenarios by Location
N=1500

In each of the scenarios you have listened to, the government officer has a choice. You
can simply make your decision and communicate it to the two people involved.
Alternatively, you could explain to each of them the reasoning behind your decision as
well as the final decision itself. What would you do if you were the government officer?
29.4%
67.9%
2.8% 0.0%
10.0%
20.0%
30.0%
40.0%
50.0%
60.0%
70.0%
80.0%
Make your decision and
communicate it to the two
people involved
Explain to each of them the
reasoning behind your
decision as well as the final
decision itself
Don't Know
Decision Making and Communication Choices
N=1500
67.9% of the surveyed
respondents indicated that
they would explain the
reasoning behind their
decisions to the individuals
involved in the
Distribution/Fairness scenarios.

In each of the scenarios you have listened to, the government officer has a choice. You
can simply make your decision and communicate it to the two people involved.
Alternatively, you could explain to each of them the reasoning behind your decision as
well as the final decision itself. What would you do if you were the government officer?
Make your decision and
communicate it to the two people
involved
Explain to each of them the
reasoning behind your decision as
well as the final decision itself
Don't Know
Male 29.9% 67.0% 3.0%
Female 28.7% 68.9% 2.4%
Overall 29.4% 67.9% 2.8%
0.0%
10.0%
20.0%
30.0%
40.0%
50.0%
60.0%
70.0%
80.0%
Decision Making and Communication Choices by Gender
N=1500

In each of the scenarios you have listened to, the government officer has a choice. You
can simply make your decision and communicate it to the two people involved.
Alternatively, you could explain to each of them the reasoning behind your decision as
well as the final decision itself. What would you do if you were the government officer?
Decision Making and Communication Choices by Level Of Education
Level of Education
Primary Secondary College University
Post
Graduate Total
Make your decision and
communicate it to the two
people involved
34.2% 29.2% 29.9% 20.5% 20.9% 29.4%
Explain to each of them the
reasoning behind your
decision as well as the final
decision itself
63.5% 67.8% 67.0% 77.2% 79.1% 67.9%
Don't Know 2.3% 3.1% 3.1% 2.3% 0.0% 2.8%
N=1500

As a citizen, on a scale of 1 - 5 where 1 is “Completely unimportant”, 3 is “neither
important nor unimportant” and 5 is “very important, how important” is it to you that
government explains the reasons behind its decisions?
50.3%
34.1%
11.3%
3.5% 0.9%
0.0%
10.0%
20.0%
30.0%
40.0%
50.0%
60.0%
Very Important Important Neither
Important nor
Unimportant
Unimportant Completely
Unimportant
Importance of the Government Explaining its Reasons Behind its
Decision in Budget Allocation
N=1500 50.3% of the surveyed respondents indicated that it is
“very important” that the Government explains to its
citizens the justifications for its budget choices.

PART 2:
FINDINGS FROM THE
DELIBERATIVE SESSIONS

About the Participants
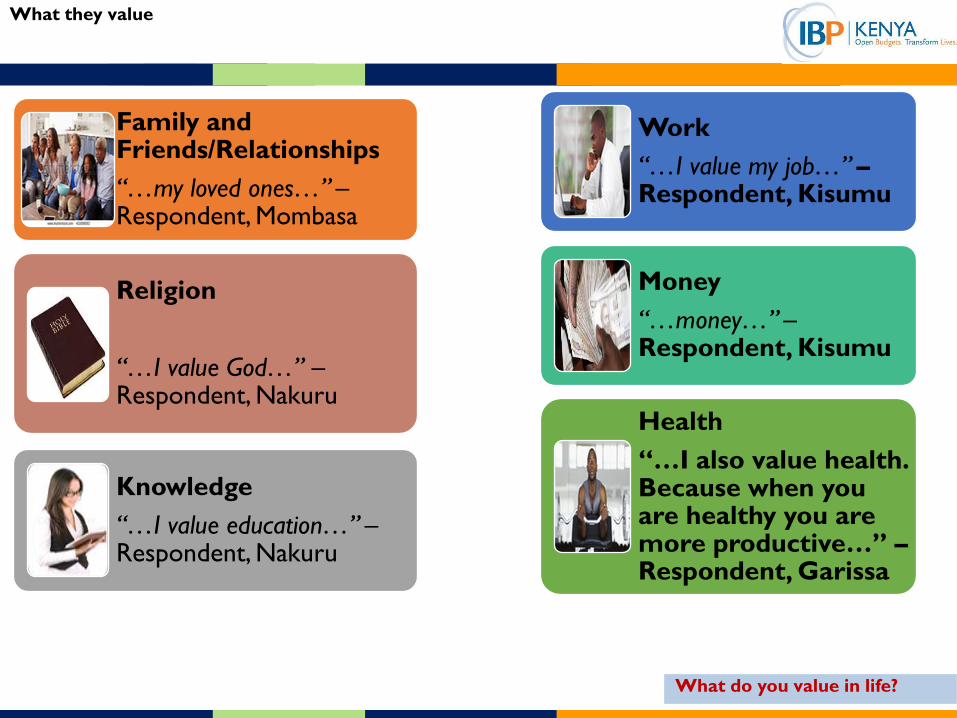
What they value
Family and Friends/Relationships
“…my loved ones…” – Respondent, Mombasa
Religion
“…I value God…” – Respondent, Nakuru
Knowledge
“…I value education…” – Respondent, Nakuru
Work
“…I value my job…” – Respondent, Kisumu
Money
“…money…” – Respondent, Kisumu
Health
“…I also value health. Because when you are healthy you are more productive…” –Respondent, Garissa
What do you value in life?

Goals and Aspirations
The aspirations mentioned were as follows: • Secure gainful employment • Own a business • Complete one’s education • Run for elective office • Have and raise a family • To get rich
“…I will be an employer…” - Respondent, Mombasa
“…I will have my own business…”- Respondent , Mombasa
“…I have political ambitions…” – Respondent, Nairobi
“…I will be a millionaire…” – Respondent, Nakuru
“…I hope to be reputable health worker…” – Respondent, Kisumu
“…I will be having my own family…” – Respondent, Nakuru
What are your aspirations in the next five years?

Sectors of National Government

Sectors of National Government that Participants Allocated the Most…
Se
cto
rs t
hat
Part
icip
an
ts W
ou
ld G
ive t
he
Mo
st…
1. Energy, Infrastructure & ICT
2. Agriculture
3. Health
4. Security
5. Education
“…. agriculture (25%) agriculture is an important aspect for food security…” –
Respondent, Mombasa
“…. health (24%) diseases like cancer and HIV are killing labourers; we need cheap
drugs, more doctors, and we need a health society to be a working nation…” –
Respondent, Mombasa
“…. energy, infrastructure and ICT 25% - a growing economy like Kenya is totally depen
dent on energy…” – Respondent, Nakuru
What they had to say
Majority of the participants indicated that they would
allocate the majority of their budgets to: Energy,
Infrastructure & ICT; Agriculture; Health; Security; and
Education
“…. security (25%) because if I am secure I can do business…– Respondent,
Nairobi
“…. education (25%) illiterate people cannot develop anything…” - Respondent,
Mombasa
Thinking back to the ten sectors of the national government,
try and recall which sectors you gave the most allocations,
the second largest and the least shares to and reasons as to
why?

Sectors of National Government that Participants Allocated the Second Most…
Se
cto
rs t
hat
Part
icip
an
ts W
ou
ld G
ive t
he
Se
co
nd
Mo
st…
1. Public Administration &
International Relations
2. Energy, Infrastructure and
ICT
3. Education
“...energy 15% we must have energy in plenty to develop the rural and urban sectors
because we don’t have good infrastructure like roads...” - Respondent, Nakuru
“...Education 18% when people are educated they will have skills innovation and
creation of opportunities hence the nation would move forward…” – Respondent,
Nakuru
“...public administration 10%. Administration means helping the public; if
chiefs and DOs cannot do their job because of limited resources and
funds there would be conflicts…” – Respondent, Nakuru
What they had to say
Consider the sector you thought was the second most
important now. What percentage did you give? Why?
Public Administration & International Relations, Energy,
Infrastructure & ICT and Education were mentioned most
as sectors that would receive the second largest budget
allocations.

Sectors of National Government that Participants Allocated the Least …
Secto
rs t
hat
Part
icip
an
ts W
ou
ld G
ive t
he L
east
…
1. Social Protection & Cultural Recreation
3. Governance, Justice, Law & Order
“…. should be under national security…I felt law and order is misplaced…” –
Respondent, Nakuru
“... Social protection culture and recreation I gave 2% because you cannot allocate
recreational facilities highest while the most common needs are absent. The demand for
basic needs is wider so there is no way you can allocate recreational facilities high
percentage or a percentage equivalent to basic needs. …” – Respondent, Garissa
What they had to say
Which sector did you allocate the least and why?
Social Protection & Cultural Recreation and Governance,
Justice, Law & Order were mentioned by a majority of
respondents as sectors that would receive the least in terms of
budget allocations.

Participants’ Reactions to Actual Allocations Given by the National Government…
“... I disagree on health, I think environmental protection should be lower than health,
energy, infrastructure and ICT. You cannot build wonderful roads for dead people… ”
– Respondent, Mombasa
“...allocations are good except health and agriculture. Health deserves 15% not
3%..” – Respondent, Nakuru
“…I feel like they are killing the health sector by allocating 3.9%. ...” – Respondent, Nairobi
What they had to say
I am now going to remind you of the shares the national
government has proposed to allocate to each of the ten
sectors. Some of you said you would change your views
after hearing this, and some of you said you would not
change your views after hearing this. Can you explain why
you thought this information was or was not important
and would/would not affect your own views?
The participants noted that the information they received was
important. The largely disagreed with the government’s allocations
to sectors they view to be important such as health, agriculture and
energy. Consequently the largely retained their own views on sector
budget allocation.

Participants’ Reactions as to Whether National Government Listens to Ordinary Citizens When Making Decisions about Sector Allocation …
“...No. I have never heard government representatives calling people to get views on
the budget…”– Respondent, Kisumu
“... because of devolution you can go address issues with the governor...” –
Respondent, Mombasa
“...they should come up with programs where people can share their views on the budget…” – Respondent, Nairobi
What they had to say
Do you think the national government listens to ordinary
people when making decisions about sector allocations?
The participants appeared to be divided as whether the
national government listens to ordinary citizens when it
makes decisions about sector budget allocations.

Participants’ Reactions as to Whether they Have Ever Attended Forums to Give their Views on Sector Allocation of the Budget …
“...it’s never announced… it’s just MCAs and clerks… no one is invited. …” –
Respondent, Nakuru
“...yes... to give views on fund allocations and government output and how they
have delivered...” – Respondent, Nairobi
“... No, I was shocked that such things happen.…” – Respondent, Garissa
What they had to say
Have you attended forums to give your views on sector
allocations of budget?
A majority of the participants indicated that they had never
attended any forums to give their views sector budget
allocations.

Participants’ Reactions as to Why they Have Never Attended Forums to Give their Views on Sector Allocation of the Budget …
“...I have never known…” – Respondent, Kisumu
“...there’s no time because you are busy hustling…” ...” – Respondent,
Nakuru
“...it’s a waste of time since youths won’t be listened to.…” – Respondent, Nakuru
What they had to say
If you haven’t attended the forums, why not?
The participants’ reasons for not attending these forums
varied from not being aware of such forums to not having
the time to attend them to the belief that their views would
not be taken into account even if they attended.

Participants’ Reactions as to How they’d like to Get Information about these Forums …
“... local radio stations, road shows.…” – Respondent, Meru
“...through the MCAs…” – Respondent, Nairobi
“...social media like Facebook, WhatsApp…” – Respondent, Mombasa
What they had to say
How would you wish to get information on such forums? The participants mostly indicated that they would like to
get information about these forums via social media
platforms.

Participants’ Satisfaction with the Justifications Given by the National Government for Its Budget Choices…
“.... We are not aware of what is going on…We are totally discriminated against” –
Respondent, Garissa
“...no, they are building offices worth 300 million and buying expensive cars at the expense of other important sectors like agriculture…” – Respondent,
Nairobi
What they had to say
The survey asked how satisfied you are with the kinds of
justifications that national government provides for the
budget choices. Are their figure proposals adequate, if not
why?
Most of the participants noted that national government’s
proposals for sector budget allocation were not adequate. The
proposed budget allocations for the next financial year were not
received with much enthusiasm with the prevailing sentiment
being that the Government was not responding to the needs of
Kenyans but rather was acting out of self interest in making the
choices it had. While a number of respondents had with the
deductions in the allocations to some sectors per se, their main
concern revolved around the fact that they were uncertain as to
where the resultant budgetary allocation increases had been
made and why. Essentially most respondents expressed their
displeasure with the proposed budget choices and the
justifications given for them.

Participants’ Reactions as to Whether the Justifications Given by the National Government for Its Budget Choices Explain …
“...I feel there’s need for breakdown… not generalization of facts. .. ” –
Respondent, Nakuru
“...they have generalized. Its laziness…”– Respondent, Kisumu
“… They are only trying to tell us what has been done. Not explaining facts…” – Respondent, Mombasa
What they had to say
Are these justifications adequate?
The participants largely indicated that the justifications
given by the government for budget sector allocation
were inadequate and did not further their understanding
of the rationale for them. The respondent indicated that
the justifications given would be more palatable if more
information on what criteria the Government used to
make additions and subtractions to the allocations for
the various sectors rather than the presentation of
information which they opined was not at all detailed
which only served to obfuscate and not enlighten.
However it is worth noting that on the issue of the
adequacy of the explanations given by the Government
on these allocations, most respondents had difficulties in
understanding them, and with very few exceptions were
largely unable to interpret them critically.
Let us look at some justifications the government has
provided for the allocations above. Do these justifications
help you to understand why certain sectors are receiving
more than the others?

Improvements Participants Would Like Made to the National Government’s Justifications for its Budget Choices…
“...simplicity, details. Explain each sector on its own…” – Respondent, Kisumu
“... take the percentage for governance, justice law and order and put it in
agriculture. …” – Respondent, Meru
“…I will start with 17.6% that is public administration and international relations and give it to health. …” – Respondent, Meru
What they had to say
How would you improve on it? The participants indicated that they would improve on the
budget allocations by increasing the percentage for sectors
such as health, agriculture and energy citing their perceived
importance. They also noted the need for simplicity and
clear explanations in the presentation of the allocations.
What else would you like to know?

Participants’ Reactions to the National Government’s Proposed Changes to the Budget…
“...they have added more to public administration, it should be reduced and
taken to health…” – Respondent, Nairobi
“... National security should not be -0.6% …” – Respondent, Nairobi
“...I disagree with the negative deduction in health…” – Respondent, Mombasa
What they had to say
The participants largely disagreed with the new allocations.
I want us to look at the following table and consider the
information you have. The table shows proposed changes in
the budget 2016/2017 and 2017/2018. What do you think of
these proposals; do you agree or disagree with them?
“... 0.1% addition to Environmental protection I agree …” – Respondent,
Nairobi
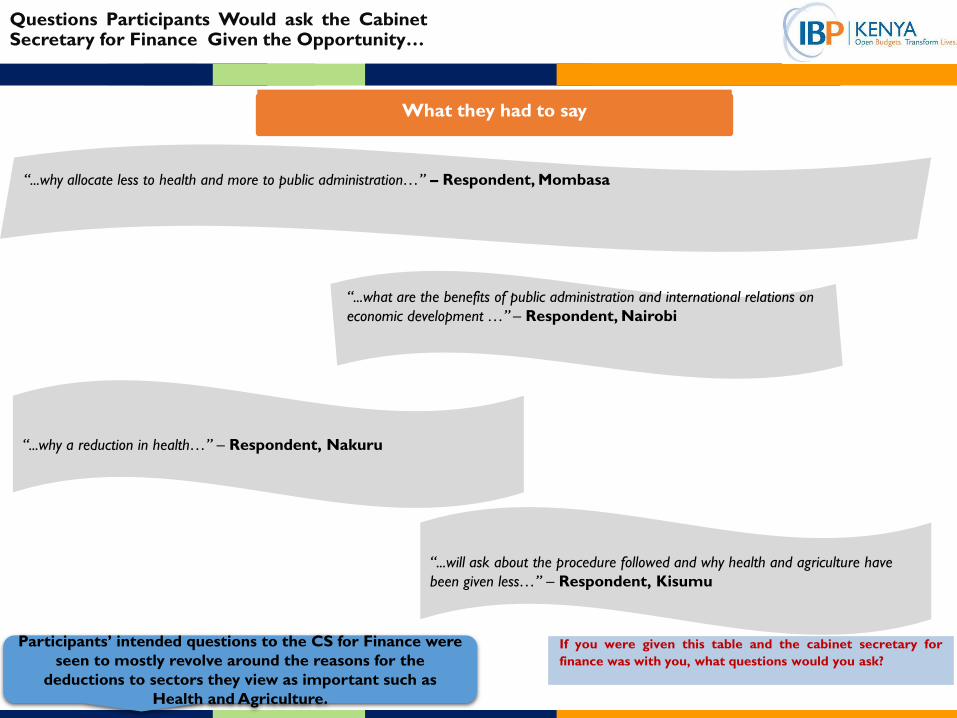
Questions Participants Would ask the Cabinet Secretary for Finance Given the Opportunity…
“...what are the benefits of public administration and international relations on
economic development …” – Respondent, Nairobi
“...why a reduction in health…” – Respondent, Nakuru
“...why allocate less to health and more to public administration…” – Respondent, Mombasa
What they had to say
If you were given this table and the cabinet secretary for
finance was with you, what questions would you ask?
“...will ask about the procedure followed and why health and agriculture have
been given less…” – Respondent, Kisumu
Participants’ intended questions to the CS for Finance were
seen to mostly revolve around the reasons for the
deductions to sectors they view as important such as
Health and Agriculture.

Participants Views on Whether Explanations Given by the National Government on Whether Explanations Given for Budget Allocations to Certain Sectors are Adequate or Not …
What they had to say in brief…
Participants’ views on whether the explanations given for
these allocations were adequate were mixed.
Now consider the following explanations and give your views
whether they are adequate or not?
Environmental Protection
“... It is not adequate. They have not elaborated. What do
they want to develop in particular…” – Respondent,
Mombasa
Energy, Infrastructure & ICT
“...it’s sufficient, I wouldn’t change it…” – Respondent,
Nakuru
Health & Education
“… I feel it’s fair because of devolution…” – Respondent,
Nakuru
Governance
“... We agree because after 2017 elections IEBC will require
less funding…” – Respondent, Mombasa
National Security
“...I agree with this. Security is not about funds, they cannot
be buying machines or vehicles every time; it’s about
sensitization… - Respondent, Mombasa

Participants’ Reactions on the Explanations Given by the National Government on Budget Allocations … (1/3)
Now consider the following explanations and give your views
whether they are adequate or not?
Explanation 1: Although we do not have a lot of extra funding this year, the environment is very important so we are increasing its share of the budget by a small amount.
Reaction: Most participants agreed with this statement noting that the environment is very important and ultimately affects agriculture. The participants also expressed their appreciation for the Government’s concern about the environment.
Explanation 2: Although the Energy, Infrastructure and ICT sector is an important area of investment, we will be reducing the share of the budget going to this area in 2017/18 because we will be completing some major infrastructure investments in 2016/17 so we will need less funding in 2017/18.
Reaction: Most participants appeared satisfied with this explanation citing the Government’s heavy investment in this sector which they largely agreed was quite evident based on the number of visible projects in their localities that were ongoing or close to completion.
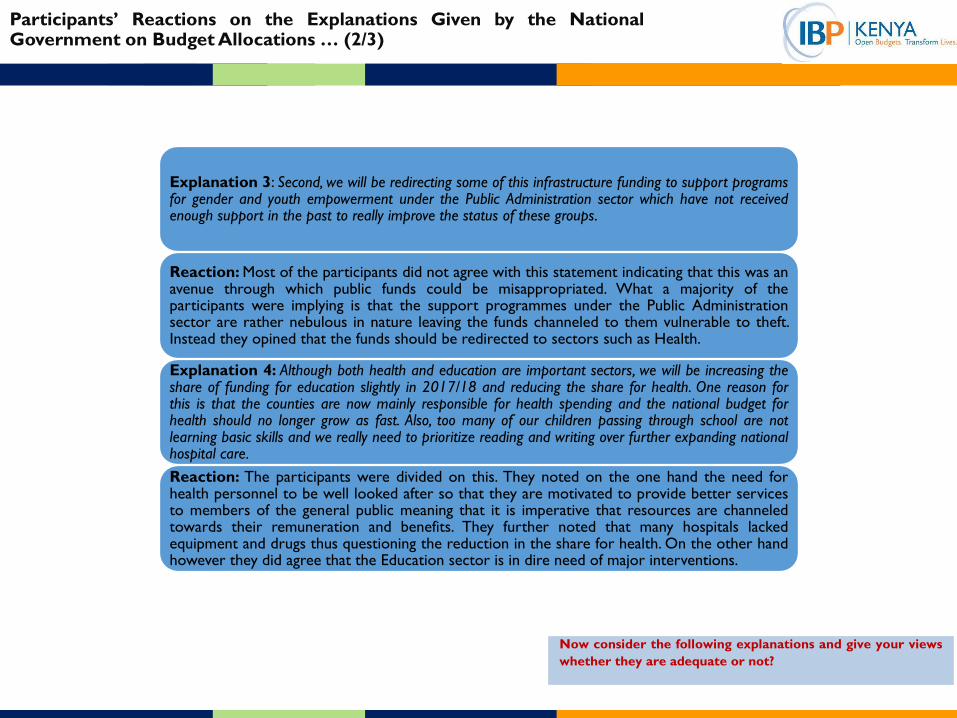
Participants’ Reactions on the Explanations Given by the National Government on Budget Allocations … (2/3)
Now consider the following explanations and give your views
whether they are adequate or not?
Explanation 3: Second, we will be redirecting some of this infrastructure funding to support programs for gender and youth empowerment under the Public Administration sector which have not received enough support in the past to really improve the status of these groups.
Reaction: Most of the participants did not agree with this statement indicating that this was an avenue through which public funds could be misappropriated. What a majority of the participants were implying is that the support programmes under the Public Administration sector are rather nebulous in nature leaving the funds channeled to them vulnerable to theft. Instead they opined that the funds should be redirected to sectors such as Health.
Explanation 4: Although both health and education are important sectors, we will be increasing the share of funding for education slightly in 2017/18 and reducing the share for health. One reason for this is that the counties are now mainly responsible for health spending and the national budget for health should no longer grow as fast. Also, too many of our children passing through school are not learning basic skills and we really need to prioritize reading and writing over further expanding national hospital care.
Reaction: The participants were divided on this. They noted on the one hand the need for health personnel to be well looked after so that they are motivated to provide better services to members of the general public meaning that it is imperative that resources are channeled towards their remuneration and benefits. They further noted that many hospitals lacked equipment and drugs thus questioning the reduction in the share for health. On the other hand however they did agree that the Education sector is in dire need of major interventions.

Participants’ Reactions on the Explanations Given by the National Government on Budget Allocations … (3/3)
Now consider the following explanations and give your views
whether they are adequate or not?
Explanation 5: The governance sector is important, but after the 2017 elections are over, the IEBC will not require as much funding, so we are reducing its share of the total budget.
Reaction: While acknowledging that it was unlikely that the IEBC would have a lot to do after the forthcoming general election, a number of the participants indicated that it was critical that the it has enough money to conduct a presidential run – off should the need arise as well as any number of by – elections that invariably result after any poll in Kenya as a result of electoral disputes.
Explanation 6: The national security sector has received a substantial increase in budget in recent years, but it is now time for the sector to learn to spend its money more efficiently, rather than to continue to grow its budget, so we are reducing its share of the total budget.
Reaction: The participants largely disagreed with this assertion noting the emerging security challenges Kenya is facing especially in light of the continued threat from terrorist elements.
Most respondents largely had difficulties in understanding
the explanations given by the Government for its budget
allocations and therefore did not find them adequate.

Participants’ Reactions as to Whether they would Change their Earlier Sector Proposals…
“...I have realized why they gave health little, so I would reduce mine too…” –
Respondent, Nairobi
“...no, I will stand my ground…” – Respondent, Garissa
“....I will reduce health and add to agriculture and energy…” –
Respondent, Mombasa
What they had to say
Across the six groups participants’
opinions were divided on the need to
change their earlier sector proposals.
Of the participants who indicated that
they would change their earlier sector
proposals, a significant number indicated
that they would do so with an aim to
aligning them with the Government’s
proposals. Another consideration made
by this lot of participants was the need
to increase allocations to sectors they
deemed important such as Agriculture,
Energy and Health. This was especially
true for respondents from Nairobi,
Nakuru, Kisumu and Mombasa. On the
other hand, the participants who
indicated that they would not change
their earlier proposals (mostly from
Meru and Garissa) largely cited the fact
that the Government had made
deductions to critical sectors like Health
which they felt was unconscionable.
Taking everything we have discussed into consideration,
would you change your earlier sector proposals. Why and
why not?
“... it’s so sad because health has been reduced by 0.1%, it’s so sad…” –
Respondent, Meru
Distribution/Fairness Scenarios

Distribution/Fairness Scenario 1…
“...50-50; if we give the healthy guy a lot then its discrimination …” – Respondents, Nakuru
“…financial status of the two, maybe the healthy one is poor and the sick one comes from a well off family; how much each check-up will cost on average
per month…” – Respondents, Nakuru
“...90-10; 90000 to the sick and 10000 to the healthy one. We assume the healthy one will go for check-up once in a year. The sick one will go monthly
…” – Respondents, Mombasa
“...Whether they attend the same hospital, their status; working, single or married; which hospital, frequency of hospital visits, which illness… -
Respondents, Mombasa
What they had to say
What information should be added to influence your
allocations?
There are two Kenyans. One is sick and one is healthy. The
sick one will need to visit the hospital for several
treatments this year while the healthy one will visit the
clinic once for a checkup this year. How will you distribute
the 100,000 Ksh among them?
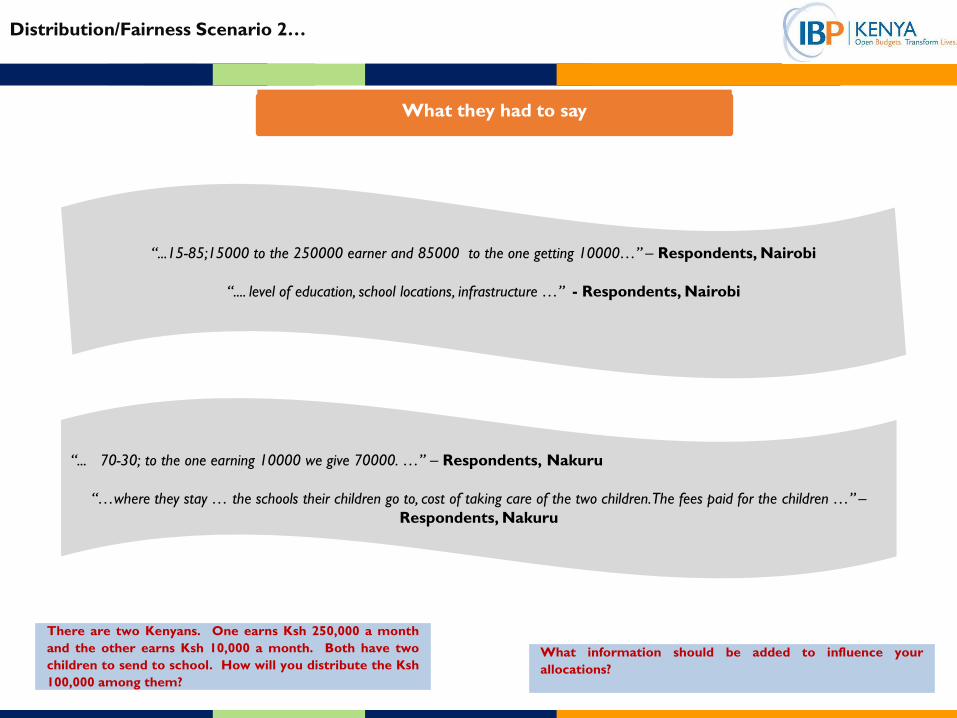
Distribution/Fairness Scenario 2…
“...15-85;15000 to the 250000 earner and 85000 to the one getting 10000…” – Respondents, Nairobi
“.... level of education, school locations, infrastructure …” - Respondents, Nairobi
“... 70-30; to the one earning 10000 we give 70000. …” – Respondents, Nakuru
“…where they stay … the schools their children go to, cost of taking care of the two children. The fees paid for the children …” –
Respondents, Nakuru
What they had to say
There are two Kenyans. One earns Ksh 250,000 a month
and the other earns Ksh 10,000 a month. Both have two
children to send to school. How will you distribute the Ksh
100,000 among them?
What information should be added to influence your
allocations?
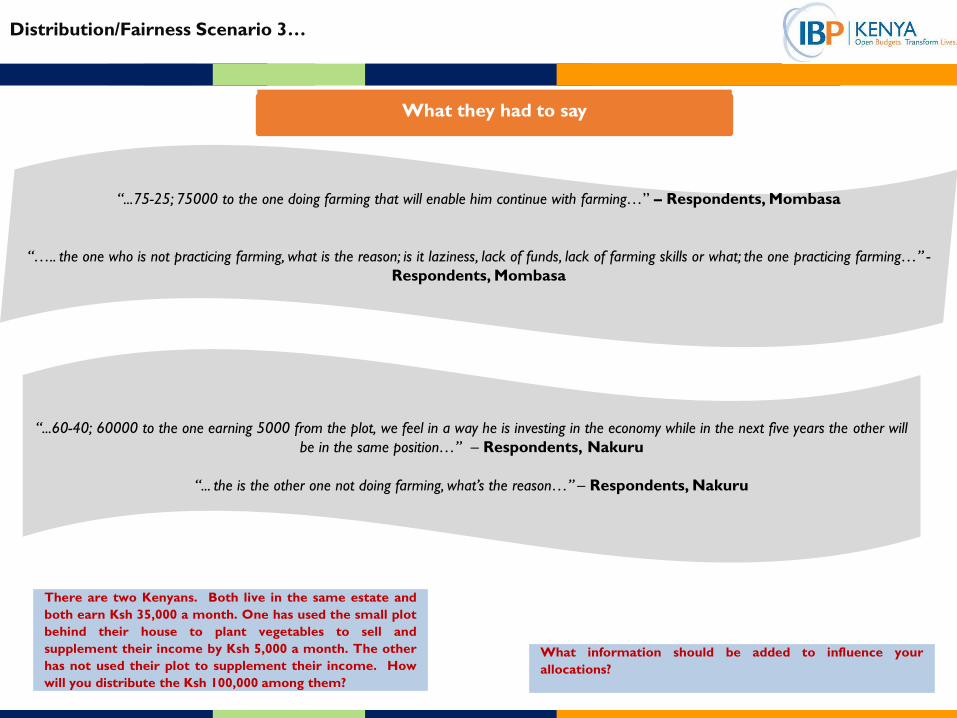
Distribution/Fairness Scenario 3…
“...60-40; 60000 to the one earning 5000 from the plot, we feel in a way he is investing in the economy while in the next five years the other will
be in the same position…” – Respondents, Nakuru
“... the is the other one not doing farming, what’s the reason…” – Respondents, Nakuru
“...75-25; 75000 to the one doing farming that will enable him continue with farming…” – Respondents, Mombasa
“….. the one who is not practicing farming, what is the reason; is it laziness, lack of funds, lack of farming skills or what; the one practicing farming…” -
Respondents, Mombasa
What they had to say
There are two Kenyans. Both live in the same estate and
both earn Ksh 35,000 a month. One has used the small plot
behind their house to plant vegetables to sell and
supplement their income by Ksh 5,000 a month. The other
has not used their plot to supplement their income. How
will you distribute the Ksh 100,000 among them?
What information should be added to influence your
allocations?
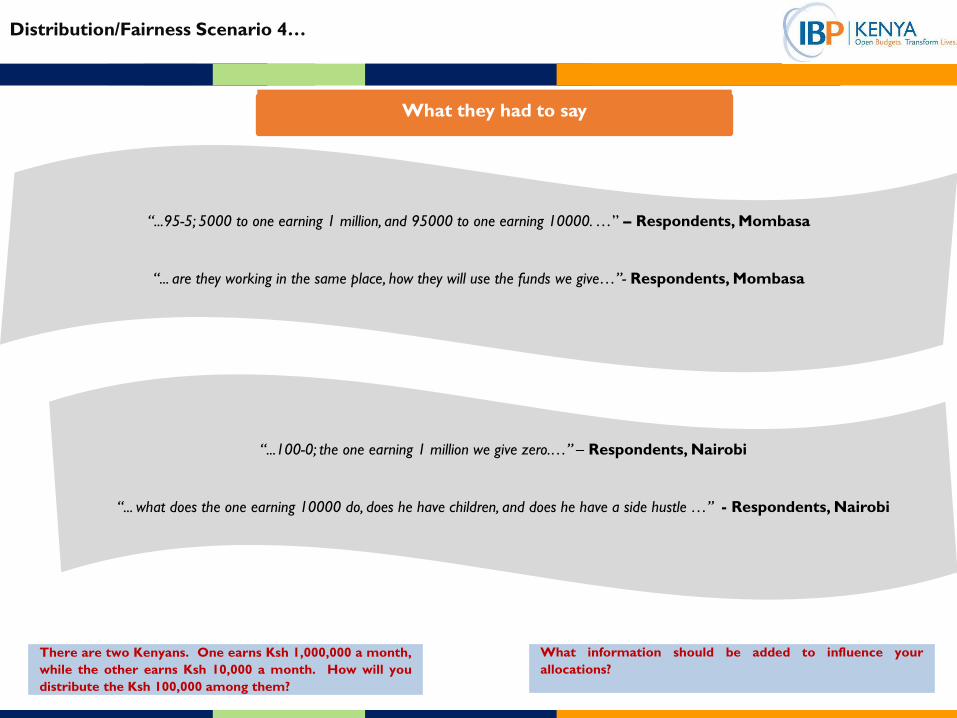
Distribution/Fairness Scenario 4…
“...100-0; the one earning 1 million we give zero.…” – Respondents, Nairobi
“... what does the one earning 10000 do, does he have children, and does he have a side hustle …” - Respondents, Nairobi
“...95-5; 5000 to one earning 1 million, and 95000 to one earning 10000. …” – Respondents, Mombasa
“... are they working in the same place, how they will use the funds we give…”- Respondents, Mombasa
What they had to say
There are two Kenyans. One earns Ksh 1,000,000 a month,
while the other earns Ksh 10,000 a month. How will you
distribute the Ksh 100,000 among them?
What information should be added to influence your
allocations?

Distribution/Fairness Scenario 5…
“...50-50, significant part of salary on alcohol may mean he has other investments to live lavish or he doesn’t have a family, …” –
Respondents, Nakuru
“... What does he need the money for, maybe he is good at investing just like he is good at drinking…” - Respondents, Nakuru
“...10-90, 10000 to the one drinking because there is little need to ad him more, 90000 to the other one to motivate him to work even harder…” – Respondents, Nairobi
“... need to know the jobs they both do, how many times the drunk misses work, is it government job, self-employment, what does the hard worker do. If
the drunk is self-employed we add because he has employed someone…” - Respondents, Nairobi
What they had to say
There are two Kenyans. Both earn Ksh 40,000 per month.
One spends a significant part of salary on alcohol, and is
often unable to work. The other does not drink and has not
missed a day of work in two years. How would you share
the Ksh 100,000 between them?
What information should be added to influence your
allocations?

Distribution/Fairness Scenario 6…
“....60-40; 60000 to the one who has invested…” – Respondents, Nakuru
“.... how does the Prado add value in the economy, is he using it for business as well…” - Respondents, Nakuru
“...20-80; 20000 to the one paying a loan for the Prado…” – Respondents, Nairobi
“…what is the Prado for, does it bring income…”- Respondents, Nairobi
What they had to say
There are two Kenyans. Both earn Ksh 40,000 per month.
One uses their salary to take out a loan and buy a Prado to
enjoy. The other saves half of their salary and invests in a
side business. How would you distribute the Ksh 100,000
among them?
What information should be added to influence your
allocations?

Distribution/Fairness Scenario 7…
“...60-40, 60000 to the one living in urban area because we consider the expenses, things we incur on rent, food …” – Respondents,
Nairobi
“...50-50 they have not said use of the money so we assume same needs, and earning same salary …” – Respondents, Mombasa
What they had to say
There are two people: one from a rural county and one
from an urban county. Both earn the same salary. How
would you distribute the Ksh 100,000 among them?
What information should be added to influence your
allocations?

Distribution/Fairness Scenario 8…
“...50-50; both are Kenyans…” – Respondents, Mombasa
“... Which county…” - Respondents, Mombasa
What they had to say
There are two people: one from your county and one from
a different county on the other side of the country. Both
earn Ksh 40,000. How would you distribute the Ksh
100,000 among them?
What information should be added to influence your
allocations?

Distribution/Fairness Scenario 9…
“...50-50; health centre is not near, no schools, no tarmac roads, he uses a lot of money on transport, and schools are far …” – Respondents,
Nairobi
“...70-30; 70000 to the one living in an area with no tarmac roads. …” – Respondents, Mombasa
What they had to say
There are two Kenyans. One lives in an area with no
tarmacked roads, school buildings or health clinics, the
other lives in an area with good roads, new school buildings
and a hospital. Both have two children. How will you
distribute the Ksh 100,000 among them?
What information should be added to influence your
allocations?

Distribution/Fairness Scenario 10…
“...60-40; 60000 to the sick one …” – Respondents, Nairobi
“... Do they all have a medical cover…” - Respondents, Nairobi
“...40-60 when sick; to the 200000 one we gave 60000 because we don’t know what he is suffering from. 40000 to the one who is healthy…” -
Respondents, Mombasa
“... which hospitals are they attending, how many times they check in; which sickness, what do they do; occupation…” – Respondents, Mombasa
What they had to say
There are two Kenyans. One is sick and one is healthy.
The sick one will need to visit the hospital for several
treatments this year while the healthy one will visit the
clinic once for a checkup this year. However, the sick one
earns a salary of Ksh 200,000 while the healthy one earns a
salary of Ksh 20,000. How would you distribute the Ksh
100,000 among them?
What information should be added to influence your
allocations?

Participants’ Sentiments on the Government’s Communication of its Decisions for Budget Allocations…
What they had to say
As a citizen, how important is it to you that the
government explains the reasons behind its decisions?
What information should be added to influence your
allocations?
“….Since we are taxpayers it’s important we know….” – Respondent, Nairobi
“...For transparency, to reduce corruption
cases…” – Respondent, Kisumu
“….very important because we will be
involved…” – Respondent, Garissa
The participants largely indicated that it was very
important that the government explains the reasons behind
its decisions for sector budget allocations.

Extra Scenario…
What they had to say
You attend a ward forum and suggest an ECD centre over a
water project and health clinic. What reasons would you
accept as adequate for the rejection of your project?
“...if the project costs more than the cash available….” – Respondent, Nakuru
“...I will accept if there’s proper
explanation why the funds are limited
compared to the project I have. Maybe my
project is costly…” – Respondent, Kisumu
“…I think any explanation will be ok as
long the project they have decided to do is
important to all wananchi.…” – Respondent,
Meru

PART 3:
FINDINGS FROM THE PRE –
DELIBERATIVE SESSIONS

Sectors of National Government

The national government is organized into ten sectors for purposes of budgeting. Each sector
contains ministries, agencies, and state corporations. Looking at the ten sectors below, and
assuming that you were in charge of the national budget, determine the share of the total (100%)
that you would give to each sector:
Respondents’ Proposed Allocations to the Share of the Total (100%) per Sector for
Purposes of Budgeting
Mean Median Mode Minimum Maximum S. Dev
Agriculture, Rural and Urban Development: 13.9 10 10 5 50 8.52
Energy, Infrastructure and ICT 10.4 10 10 5 35 5.98
General Economic and Commercial Affairs 7.3 7 10 2 11 2.72
Health 14.6 15 15 4 25 4.43
Education 15.4 15 15 10 30 4.78
Governance, Justice, Law and Order 7.7 8 10 0 16 3.62
Public Administration & International Relations 6.5 5 10 0 10 3.09
National Security 10.9 10 10 5 20 4.28
Social Protection, Culture and Recreation 5.5 5 5 0 10 2.79
Environmental Protection, Water and Natural Resources 8.0 9 10 1 20 3.66
The participants allocated the largest share of the budget to Agriculture at 13.9% and
allocated the least to Social Protection, Culture and Recreation at 5.5%

Mean Median Mode Minimum Maximum S. Dev
Agriculture, Rural and Urban Development: 12.0 10 10 3 35 7.34
Energy, Infrastructure and ICT 14.5 11 5 3 50 9.72
General Economic and Commercial Affairs 7.1 8 10 1 16 3.56
Health 12.5 10 10 4 35 6.53
Education 14.1 15 10 5 27 5.85
Governance, Justice, Law and Order 8.2 10 10 0 20 4.90
Public Administration & International Relations 8.6 10 10 2 20 4.71
National Security 10.4 10 10 3 25 5.33
Social Protection, Culture and Recreation 5.6 5 5 0 15 3.50
Environmental Protection, Water and Natural Resources 7.1 5 5 0 20 4.52
Now that you have told us what you think the distribution of the budget should be, what do
you believe to be the current share of the budget that is allocated to each of these sectors by
the national government?
What Respondents Believe to be the Actual Share of the Total (100%) per Sector for
Purposes of Budgeting
The participants indicated that they believe the share of the budget given to Energy, Infrastructure and ICT is
14.5% , Education is 14.1%. and Social Protection, Culture & Recreation is 5.6%

Some people have proposed that the allocation for next year to the ten sectors be as
follows: Now that you know, would you insert changes in the allocations you have
proposed
Respondents’ Decisions to Change Initial Proposed Budget Allocations Based on
Proposals by “Some People”
36.8%
60.5%
2.6%
Yes No Don't Know
60.5% of the participants indicated that they WOULD NOT change the their proposed
allocations to the budget based on the proposals of other individuals.
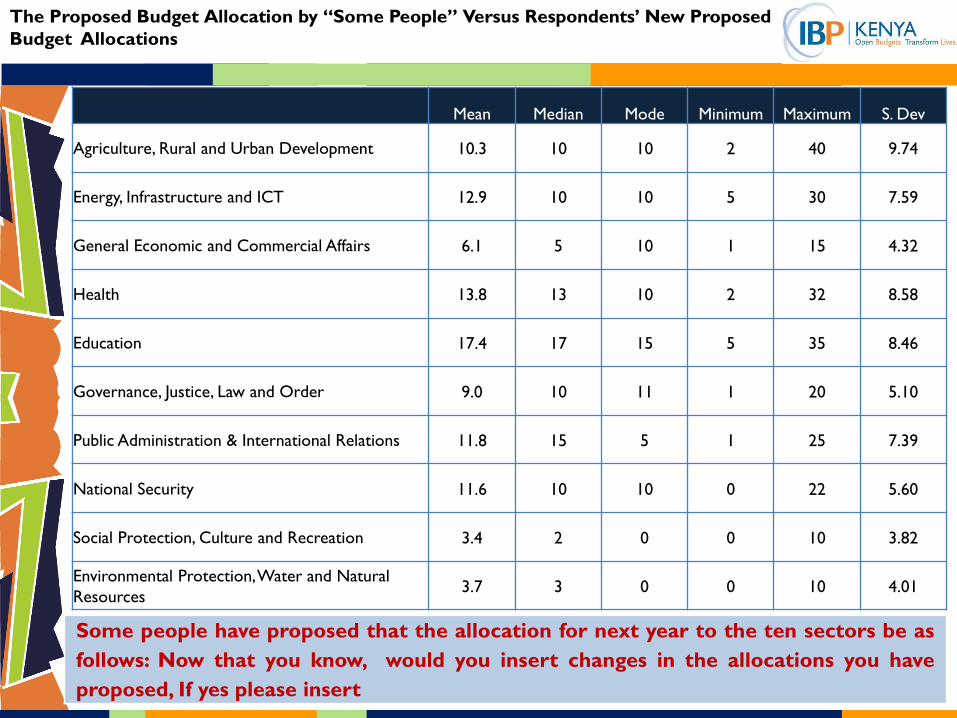
Mean Median Mode Minimum Maximum S. Dev
Agriculture, Rural and Urban Development 10.3 10 10 2 40 9.74
Energy, Infrastructure and ICT 12.9 10 10 5 30 7.59
General Economic and Commercial Affairs 6.1 5 10 1 15 4.32
Health 13.8 13 10 2 32 8.58
Education 17.4 17 15 5 35 8.46
Governance, Justice, Law and Order 9.0 10 11 1 20 5.10
Public Administration & International Relations 11.8 15 5 1 25 7.39
National Security 11.6 10 10 0 22 5.60
Social Protection, Culture and Recreation 3.4 2 0 0 10 3.82
Environmental Protection, Water and Natural
Resources 3.7 3 0 0 10 4.01
Some people have proposed that the allocation for next year to the ten sectors be as
follows: Now that you know, would you insert changes in the allocations you have
proposed, If yes please insert
The Proposed Budget Allocation by “Some People” Versus Respondents’ New Proposed
Budget Allocations

When the national government makes decisions about the sector allocation of the
budget, it listens to wananchi like me:
39.0%
29.3%
22.0%
7.3%
2.4%
A little Not at all Somewhat A lot Don’t know
Respondents’ Perceptions on Whether the National Government Involves Citizens
When it Makes Decisions about the Sector Allocation of The Budget
39.0% of the participants indicated that the National Government does not listen to ordinary citizens at all when it makes decisions about the sector allocation of the budget.

When the county government makes decisions about the sector allocation of the
budget, it listens to wananchi like me:
48.8%
19.5%
14.6% 12.2%
4.9%
Not at all A little Somewhat Don’t know A lot
48.8% of the participants indicated that the County Government do not listen to ordinary citizens at all when they make decisions about the sector allocation of the budget.
Respondents’ Perceptions on Whether County Governments Involve Citizens When it
Makes Decisions about the Sector Allocation of The Budget
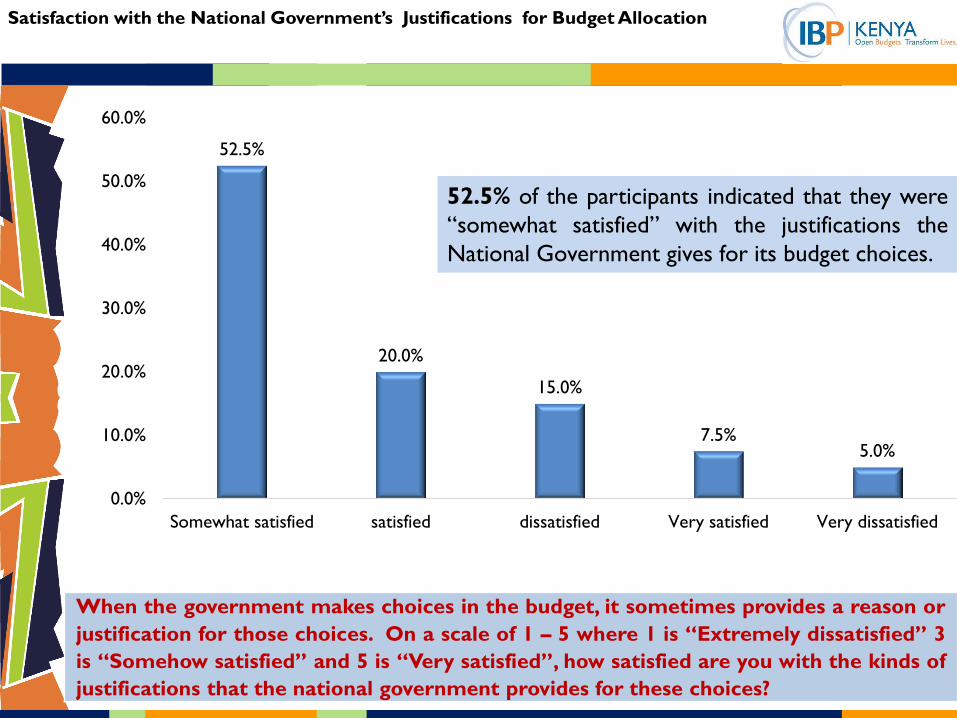
When the government makes choices in the budget, it sometimes provides a reason or
justification for those choices. On a scale of 1 – 5 where 1 is “Extremely dissatisfied” 3
is “Somehow satisfied” and 5 is “Very satisfied”, how satisfied are you with the kinds of
justifications that the national government provides for these choices?
52.5%
20.0%
15.0%
7.5% 5.0%
0.0%
10.0%
20.0%
30.0%
40.0%
50.0%
60.0%
Somewhat satisfied satisfied dissatisfied Very satisfied Very dissatisfied
Satisfaction with the National Government’s Justifications for Budget Allocation
52.5% of the participants indicated that they were
“somewhat satisfied” with the justifications the
National Government gives for its budget choices.

Using the same scale as Q.7 above, how satisfied are you with the justifications that the
county governments provide when they make budget choices?
47.6%
19.0% 16.7%
14.3%
2.4%
0.0%
5.0%
10.0%
15.0%
20.0%
25.0%
30.0%
35.0%
40.0%
45.0%
50.0%
Somewhat satisfied dissatisfied Very satisfied satisfied Very dissatisfied
47.6% of the participants indicated that they were
“somewhat satisfied” with the justifications the
County Governments give for their budget choices.
Satisfaction with the County Governments’ Justifications for Budget Allocation

Distribution/Fairness Scenarios

Scenario Person Mean Median Mode
There are two Kenyans. One is sick and one is healthy. The sick one
will need to visit the hospital for several treatments this year while the
healthy one will visit the clinic once for a checkup this year. How will
you distribute the Ksh.100, 000 among them?
Person 1 62436 65000 60000
Person 2 37564 35000 40000
There are two Kenyans. One earns Ksh.250, 000 a month and the
other earns Ksh.10, 000 a month. Both have two children to send to
school. How will you distribute the Ksh.100, 000 among them?
Person 1 22317 20000 20000
Person 2 77683 80000 80000
There are two Kenyans. Both live in the same estate and both earn
Ksh.35, 000 a month. One has used the small plot behind their house
to plant vegetables to sell and supplement their income by Ksh.5, 000
a month. The other has not used their plot to supplement their
income. How will you distribute the Ksh.100, 000 among them?
Person 1 56585 50000 50000
Person 2 43415 50000 50000
There are two Kenyans. One earns Ksh.1, 000,000 a month, while the
other earns Ksh.10, 000 a month. How will you distribute the
Ksh.100, 000 among them?
Person 1 14900 10000 0
Person 2 85100 90000 100000
Distribution/Fairness Scenarios (1/3)

Scenario Person Mean Median Mode
There are two Kenyans. Both earn Ksh.40, 000 per month. One
spends a significant part of salary on alcohol, and is often unable to
work. The other does not drink and has not missed a day of work in
two years. How would you share the Ksh.100, 000 between them?
Person 1 25800 20000 20000
Person 2 74200 80000 80000
There are two Kenyans. Both earn Ksh.40, 000 per month. One uses
their salary to take out a loan and buy a Prado to enjoy. The other
saves half of their salary and invests in a side business. How would
you distribute the Ksh.100, 000 among them?
Person 1 30675 30000 50000
Person 2 69325 70000 50000
There are two people: one from a rural county and one from an
urban county. Both earn the same salary. How would you distribute
the Ksh.100, 000 among them?
Person 1 50875 50000 50000
Person 2 49125 50000 50000
There are two people: one from your county and one from a different
county on the other side of the country. Both earn Ksh.40, 000.
How would you distribute the Ksh.100, 000 among them?
Person 1 54054 50000 50000
Person 2 45946 50000 50000
Distribution/Fairness Scenarios (2/3)

Scenario Person Mean Median Mode
There are two Kenyans. One lives in an area with no tarmacked
roads, school buildings or health clinics, the other lives in an area with
good roads, new school buildings and a hospital. Both have two
children. How will you distribute the Ksh.100, 000 among them?
Person 1 57975 60000 70000
Person 2 42025 40000 30000
There are two Kenyans. One is sick and one is healthy. The sick one
will need to visit the hospital for several treatments this year while
the healthy one will visit the clinic once for a checkup this year.
However, the sick one earns a salary of Ksh.200, 000 while the healthy
one earns a salary of Ksh.20, 000. How would you distribute the
Ksh.100, 000 among them?
Person 1 51282 50000 50000
Person 2 48718 50000 50000
Distribution/Fairness Scenarios (3/3)

In each of the scenarios you have listened to, the government officer has a choice. You
can simply make your decision and communicate it to the two people involved.
Alternatively, you could explain to each of them the reasoning behind your decision as
well as the final decision itself. What would you do if you were the government officer?
78.8%
12.1% 9.1%
0.0%
10.0%
20.0%
30.0%
40.0%
50.0%
60.0%
70.0%
80.0%
90.0%
Explain to each of them the
reasoning behind your decision
as well as the final decision
itself
Make your decision and
communicate it to the two
people involved
Don't Know
Decision Making and Communication Choices
78.8% of the participants
indicated that they would
explain the reasoning
behind their decisions to
the individuals involved in the
Distribution/Fairness scenarios.

As a citizen, on a scale of 1 - 5 where 1 is “Completely unimportant”, 3 is “neither
important nor unimportant” and 5 is “very important, how important” is it to you that
government explains the reasons behind its decisions?
72.5%
20.0%
5.0% 2.5% 0.0% 0.0%
10.0%
20.0%
30.0%
40.0%
50.0%
60.0%
70.0%
80.0%
Very Important Important Neither
Important nor
Unimportant
Unimportant Completely
Unimportant
Importance of the Government Explaining its Reasons Behind its
Decision in Budget Allocation
72.5% of the participants indicated that it is “very
important” that the Government explains to its citizens
the justifications for its budget choices.

PART 4:
FINDINGS FROM THE POST
– DELIBERATIVE SESSIONS

Sectors of National Government
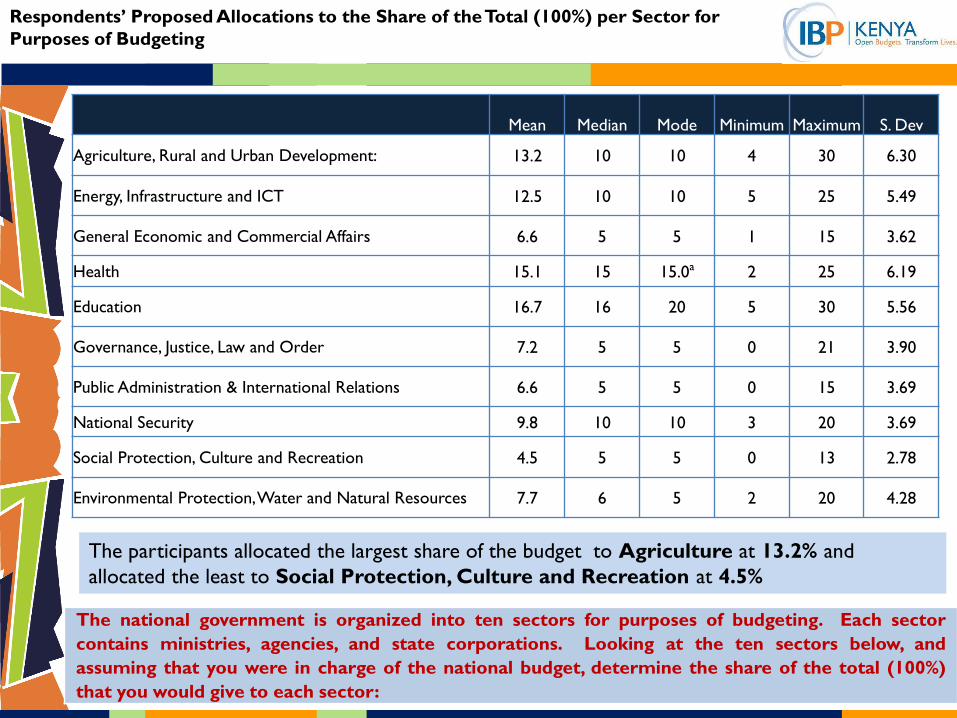
The national government is organized into ten sectors for purposes of budgeting. Each sector
contains ministries, agencies, and state corporations. Looking at the ten sectors below, and
assuming that you were in charge of the national budget, determine the share of the total (100%)
that you would give to each sector:
Respondents’ Proposed Allocations to the Share of the Total (100%) per Sector for
Purposes of Budgeting
Mean Median Mode Minimum Maximum S. Dev
Agriculture, Rural and Urban Development: 13.2 10 10 4 30 6.30
Energy, Infrastructure and ICT 12.5 10 10 5 25 5.49
General Economic and Commercial Affairs 6.6 5 5 1 15 3.62
Health 15.1 15 15.0a 2 25 6.19
Education 16.7 16 20 5 30 5.56
Governance, Justice, Law and Order 7.2 5 5 0 21 3.90
Public Administration & International Relations 6.6 5 5 0 15 3.69
National Security 9.8 10 10 3 20 3.69
Social Protection, Culture and Recreation 4.5 5 5 0 13 2.78
Environmental Protection, Water and Natural Resources 7.7 6 5 2 20 4.28
The participants allocated the largest share of the budget to Agriculture at 13.2% and
allocated the least to Social Protection, Culture and Recreation at 4.5%

Mean Median Mode Minimum Maximum S. Dev
Agriculture, Rural and Urban Development: 9.6 10 10 1 30 6.49
Energy, Infrastructure and ICT 15.2 15 5 5 34 7.91
General Economic and Commercial Affairs 6.4 5 5 0 20 4.50
Health 11.0 10 15 0 24 6.70
Education 18.1 20 20 8 47 7.66
Governance, Justice, Law and Order 7.4 5 5 0 21 4.14
Public Administration & International Relations 9.9 8 5 0 42 7.51
National Security 10.2 10 10 3 30 5.45
Social Protection, Culture and Recreation 5.5 5 5 0 15 3.79
Environmental Protection, Water and Natural Resources 7.0 5 5 0 20 4.59
Now that you have told us what you think the distribution of the budget should be, what do
you believe to be the current share of the budget that is allocated to each of these sectors by
the national government?
What Respondents Believe to be the Actual Share of the Total (100%) per Sector for
Purposes of Budgeting
The participants indicated that they believe the share of the budget given to Education is 18.1% , Energy,
Infrastructure and ICT is 15.2%. and Social Protection, Culture & Recreation is 5.5%

Now that you know this, would you make any changes to the allocations you have
proposed?
Respondents’ Decisions to Change Initial Proposed Budget Allocations Based on
Proposals by “Some People”
24.4%
70.7%
2.4%
Yes No Don't Know
70.7% of the participants indicated that they WOULD NOT change the their proposed
allocations to the budget based on the proposals of other individuals.

Mean Median Mode Minimum Maximum S. Dev
Agriculture, Rural and Urban Development 11.3 10 5a 5 25 6.18
Energy, Infrastructure and ICT 13.9 15 15 5 20 4.38
General Economic and Commercial Affairs 4.6 5 5 1 10 2.79
Health 14.1 14 20 4 25 7.05
Education 20.0 20 25 10 25 5.27
Governance, Justice, Law and Order 9.8 10 10 5 15 2.44
Public Administration & International Relations 7.7 6 5 1 19 5.23
National Security 8.9 10 10 2 18 5.02
Social Protection, Culture and Recreation 5.9 5 5 2 10 2.42
Environmental Protection, Water and Natural
Resources 8.2 5 5 2 20 6.68
Some people have proposed that the allocation for next year to the ten sectors be as
follows: Now that you know, would you insert changes in the allocations you have
proposed, If yes please insert
The Proposed Budget Allocation by “Some People” Versus Respondents’ New Proposed
Budget Allocations
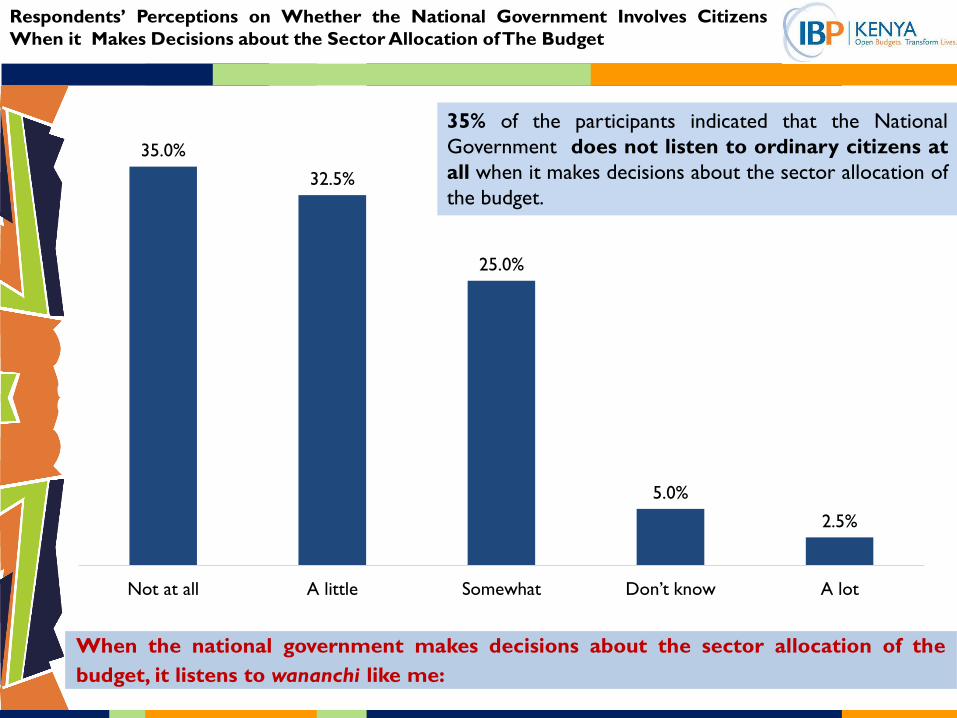
When the national government makes decisions about the sector allocation of the
budget, it listens to wananchi like me:
35.0%
32.5%
25.0%
5.0%
2.5%
Not at all A little Somewhat Don’t know A lot
Respondents’ Perceptions on Whether the National Government Involves Citizens
When it Makes Decisions about the Sector Allocation of The Budget
35% of the participants indicated that the National
Government does not listen to ordinary citizens at
all when it makes decisions about the sector allocation of
the budget.

When the county government makes decisions about the sector allocation of the
budget, it listens to wananchi like me:
35.0% 35.0%
22.5%
5.0%
2.5%
A little Not at all Somewhat A lot Don’t know
Respondents’ Perceptions on Whether County Governments Involve Citizens When it
Makes Decisions about the Sector Allocation of The Budget
35.% of the participants indicated that the County
Government listen to ordinary citizens a little when
they make decisions about the sector allocation of the
budget.

When the government makes choices in the budget, it sometimes provides a reason or
justification for those choices. On a scale of 1 – 5 where 1 is “Extremely dissatisfied” 3
is “Somehow satisfied” and 5 is “Very satisfied”, how satisfied are you with the kinds of
justifications that the national government provides for these choices?
47.5%
27.5%
10.0% 10.0%
5.0%
0.0%
5.0%
10.0%
15.0%
20.0%
25.0%
30.0%
35.0%
40.0%
45.0%
50.0%
Somewhat satisfied satisfied Very dissatisfied dissatisfied Very satisfied
Satisfaction with the National Government’s Justifications for Budget Allocation
47.5% of the participants indicated that they were
“somewhat satisfied” with the justifications the
National Government gives for its budget choices.

Using the same scale as Q.7 above, how satisfied are you with the justifications that the
county governments provide when they make budget choices?
50.0%
27.5%
15.0%
5.0% 2.5%
0.0%
10.0%
20.0%
30.0%
40.0%
50.0%
60.0%
Somewhat satisfied satisfied dissatisfied Very satisfied Very dissatisfied
Satisfaction with the County Governments’ Justifications for Budget Allocation
50% of the participants indicated that they were
“somewhat satisfied” with the justifications the
County Governments give for their budget choices.

Distribution/Fairness Scenarios

Scenario Person Mean Median Mode
There are two Kenyans. One is sick and one is healthy. The sick one
will need to visit the hospital for several treatments this year while the
healthy one will visit the clinic once for a checkup this year. How will
you distribute the Ksh.100, 000 among them?
Person 1 56341 60000 50000
Person 2 43659 40000 50000
There are two Kenyans. One earns Ksh.250, 000 a month and the
other earns Ksh.10, 000 a month. Both have two children to send to
school. How will you distribute the Ksh.100, 000 among them?
Person 1 29878 30000 30000
Person 2 70122 70000 70000
There are two Kenyans. Both live in the same estate and both earn
Ksh.35, 000 a month. One has used the small plot behind their house
to plant vegetables to sell and supplement their income by Ksh.5, 000
a month. The other has not used their plot to supplement their
income. How will you distribute the Ksh.100, 000 among them?
Person 1 54390 50000 50000
Person 2 45610 50000 50000
There are two Kenyans. One earns Ksh.1, 000,000 a month, while the
other earns Ksh.10, 000 a month. How will you distribute the
Ksh.100, 000 among them?
Person 1 24707 20000 0
Person 2 75293 80000 90000
Distribution/Fairness Scenarios (1/3)

Scenario Person Mean Median Mode
There are two Kenyans. Both earn Ksh.40, 000 per month. One
spends a significant part of salary on alcohol, and is often unable to
work. The other does not drink and has not missed a day of work in
two years. How would you share the Ksh.100, 000 between them?
Person 1 32317 30000 50000
Person 2 67683 70000 50000
There are two Kenyans. Both earn Ksh.40, 000 per month. One uses
their salary to take out a loan and buy a Prado to enjoy. The other
saves half of their salary and invests in a side business. How would
you distribute the Ksh.100, 000 among them?
Person 1 31951 30000 30000
Person 2 68049 70000 70000
There are two people: one from a rural county and one from an
urban county. Both earn the same salary. How would you distribute
the Ksh.100, 000 among them?
Person 1 45976 50000 50000
Person 2 54024 50000 50000
There are two people: one from your county and one from a different
county on the other side of the country. Both earn Ksh.40, 000.
How would you distribute the Ksh.100, 000 among them?
Person 1 49512 50000 50000
Person 2 48049 50000 50000
Distribution/Fairness Scenarios (2/3)
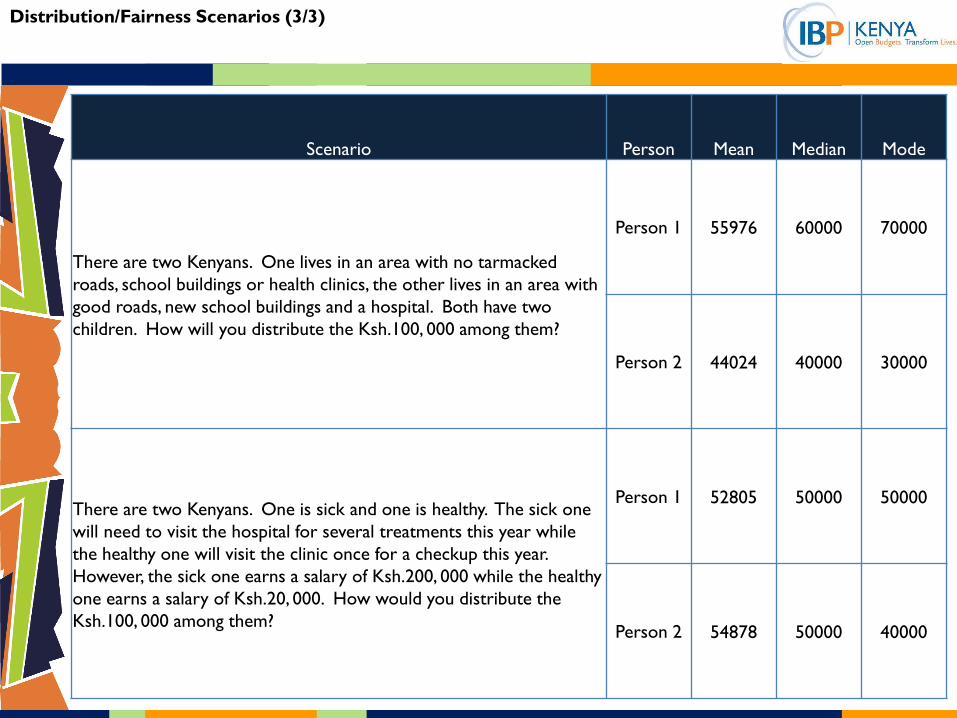
Scenario Person Mean Median Mode
There are two Kenyans. One lives in an area with no tarmacked
roads, school buildings or health clinics, the other lives in an area with
good roads, new school buildings and a hospital. Both have two
children. How will you distribute the Ksh.100, 000 among them?
Person 1 55976 60000 70000
Person 2 44024 40000 30000
There are two Kenyans. One is sick and one is healthy. The sick one
will need to visit the hospital for several treatments this year while
the healthy one will visit the clinic once for a checkup this year.
However, the sick one earns a salary of Ksh.200, 000 while the healthy
one earns a salary of Ksh.20, 000. How would you distribute the
Ksh.100, 000 among them?
Person 1 52805 50000 50000
Person 2 54878 50000 40000
Distribution/Fairness Scenarios (3/3)

n=1500 Pre (n=42) 1-2 Post(n=42) 1-3
Scenario Person Mean 1 Median Mode Mean 2 Median Mode
Mean
diff Mean 3 Median Mode
Mean
diff
1
Person
1 63377 70000 50000 62436 65000 60000 941 56341 60000 50000 7036
Person
2 36143 30000 50000 37564 35000 40000 -1421 43659 40000 50000 -7516
2
Person
1 24114 20000 0 22317 20000 20000 1797 29878 30000 30000 -5764
Person
2 75886 80000 100000 77683 80000 80000 -1797 70122 70000 70000 5764
3
Person
1 56465 50000 50000 56585 50000 50000 -120 54390 50000 50000 2075
Person
2 44017 50000 50000 43415 50000 50000 602 45610 50000 50000 -1593
4
Person
1 16483 10000 0 14900 10000 0 1583 24707 20000 .0 -8224
Person
2 83508 90000 100000 85100 90000 100000 -1592 75293 80000 90000.0 8215
Distribution/Fairness Scenarios Comparison (Post and Pre) (1/3)

Distribution/Fairness Scenarios Comparison (Post and Pre) (2/3)
n=1500 Pre (n=42) 1-2 Post(n=42) 1-3
Scenario Person Mean 1 Median Mode Mean 2 Median Mode
Mean
diff Mean 3 Median Mode
Mean
diff
5
Person
1 28277 25000 50000 25800 20000 20000 2477 32317 30000 50000 -4040
Person
2 71723 75000 50000 74200 80000 80000 -2477 67683 70000 50000 4040
6
Person
1 34059 40000 50000 30675 30000 50000 3384 31951 30000 30000 2108
Person
2 65912 60000 50000 69325 70000 50000 -3413 68049 70000 70000 -2137
7
Person
1 50868 50000 50000 50875 50000 50000 -7 45976 50000 50000 4892
Person
2 49243 50000 50000 49125 50000 50000 118 54024 50000 50000 -4781
8
Person
1 54499 50000 50000 54054 50000 50000 445 49512 50000 50000 4987
Person
2 45437 50000 50000 45946 50000 50000 -509 48049 50000 50000 -2612
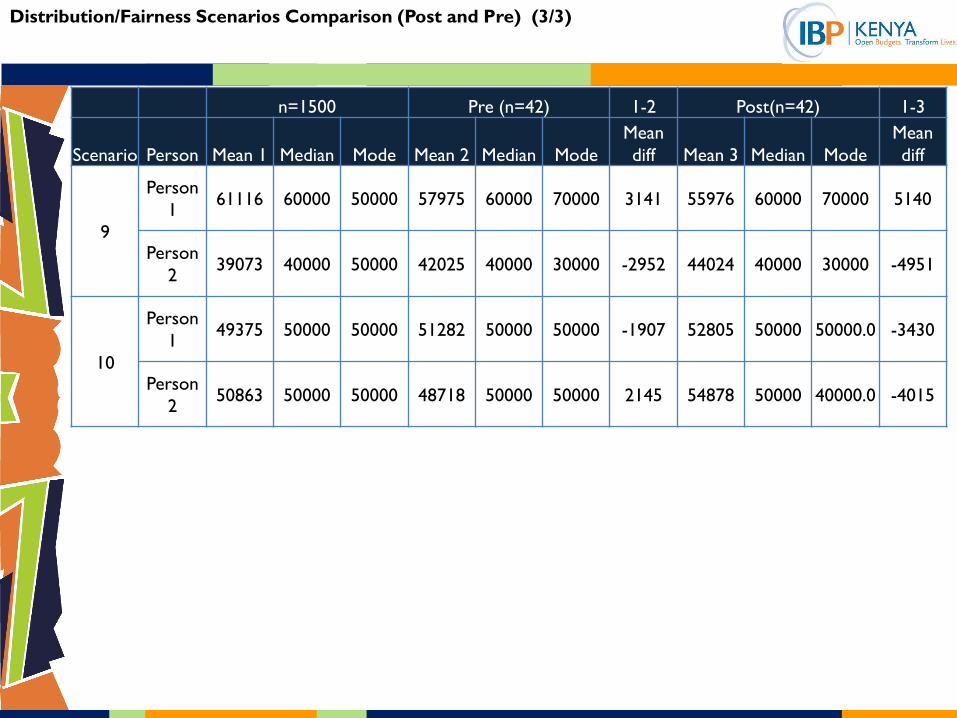
Distribution/Fairness Scenarios Comparison (Post and Pre) (3/3)
n=1500 Pre (n=42) 1-2 Post(n=42) 1-3
Scenario Person Mean 1 Median Mode Mean 2 Median Mode
Mean
diff Mean 3 Median Mode
Mean
diff
9
Person
1 61116 60000 50000 57975 60000 70000 3141 55976 60000 70000 5140
Person
2 39073 40000 50000 42025 40000 30000 -2952 44024 40000 30000 -4951
10
Person
1 49375 50000 50000 51282 50000 50000 -1907 52805 50000 50000.0 -3430
Person
2 50863 50000 50000 48718 50000 50000 2145 54878 50000 40000.0 -4015
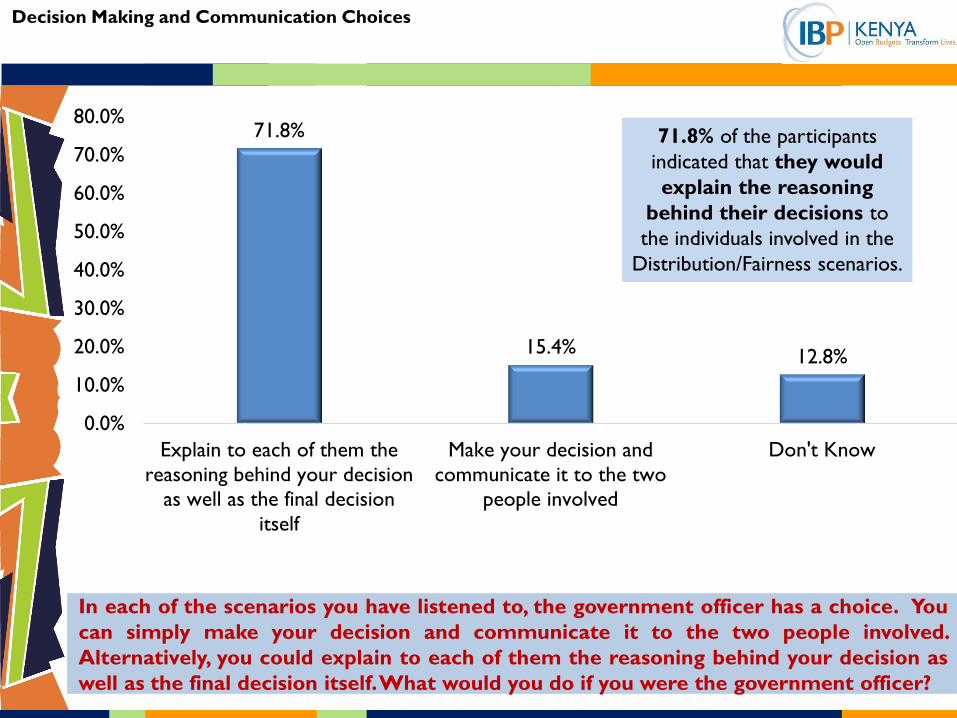
In each of the scenarios you have listened to, the government officer has a choice. You
can simply make your decision and communicate it to the two people involved.
Alternatively, you could explain to each of them the reasoning behind your decision as
well as the final decision itself. What would you do if you were the government officer?
71.8%
15.4% 12.8%
0.0%
10.0%
20.0%
30.0%
40.0%
50.0%
60.0%
70.0%
80.0%
Explain to each of them the
reasoning behind your decision
as well as the final decision
itself
Make your decision and
communicate it to the two
people involved
Don't Know
71.8% of the participants
indicated that they would
explain the reasoning
behind their decisions to
the individuals involved in the
Distribution/Fairness scenarios.
Decision Making and Communication Choices
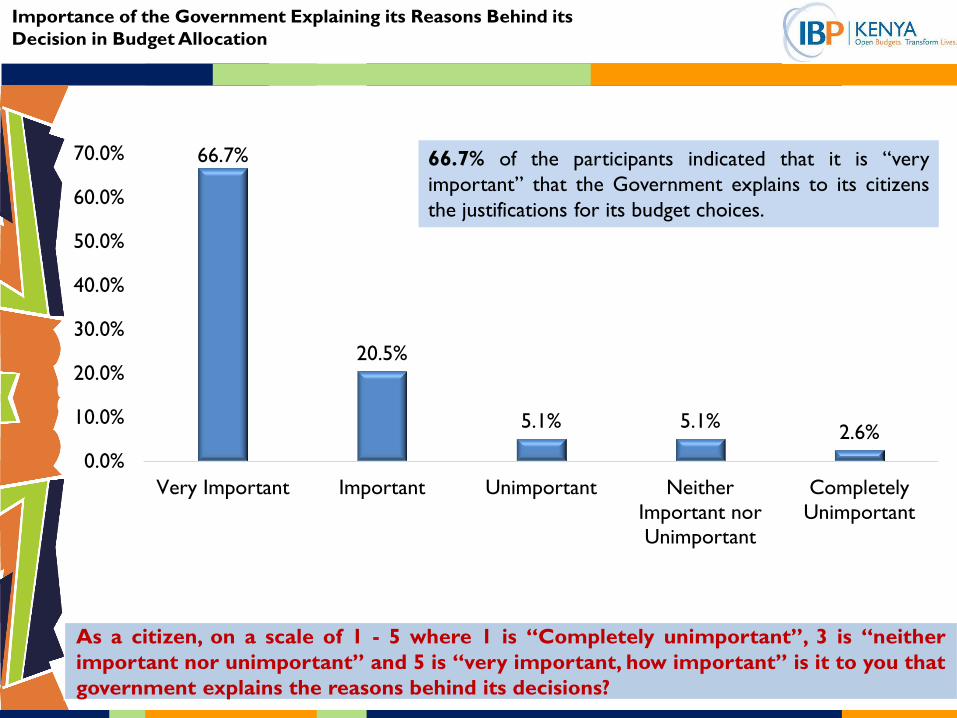
As a citizen, on a scale of 1 - 5 where 1 is “Completely unimportant”, 3 is “neither
important nor unimportant” and 5 is “very important, how important” is it to you that
government explains the reasons behind its decisions?
66.7%
20.5%
5.1% 5.1% 2.6%
0.0%
10.0%
20.0%
30.0%
40.0%
50.0%
60.0%
70.0%
Very Important Important Unimportant Neither
Important nor
Unimportant
Completely
Unimportant
66.7% of the participants indicated that it is “very
important” that the Government explains to its citizens
the justifications for its budget choices.
Importance of the Government Explaining its Reasons Behind its
Decision in Budget Allocation

PART 5:
COMPARATIVE ANALYSIS
OF THE PRE AND POST –
DELIBERATIVE SESSIONS

Sectors of National Government

The national government is organized into ten sectors for purposes of budgeting. Each sector contains ministries,
agencies, and state corporations. Looking at the ten sectors below, and assuming that you were in charge of the
national budget, determine the share of the total (100%) that you would give to each sector:
Respondents’ Proposed Allocations to the Share of the Total (100%) per Sector for
Purposes of Budgeting
PRE DS MEAN POST DS MEAN
POST DS MEAN – PRE
DS MEAN
Agriculture, Rural and Urban
Development: 13.9 13.2 -0.7
Energy, Infrastructure and ICT 10.4 12.5 2.1
General Economic and Commercial
Affairs 7.3 6.6 -0.7
Health 14.6 15.1 0.5
Education 15.4 16.7 1.3
Governance, Justice, Law and Order 7.7 7.2 -0.5
Public Administration & International
Relations 6.5 6.6 0.1
National Security 10.9 9.8 -1.1
Social Protection, Culture and Recreation 5.5 4.5 -1
Environmental Protection, Water and
Natural Resources 8 7.7 -0.3
“…Energy, ICT and infrastructure (35%) a lot of it depends on ICT, second is agriculture (19%) we are an agro based country
so to boost economy much is needed. The least is environmental protection (1%) because there’s already enough information
and research on this area its only implementation…” - Respondent, Mombasa

The national government is organized into ten sectors for purposes of budgeting. Each sector contains ministries,
agencies, and state corporations. Looking at the ten sectors below, and assuming that you were in charge of the
national budget, determine the share of the total (100%) that you would give to each sector:
Respondents’ Proposed Allocations to the Share of the Total (100%) per Sector for
Purposes of Budgeting
ACTUAL
ALLOCATION
PRE DS MEAN
- Yes(n=14)
POST DS
MEAN-Yes(10)
ACTUAL-PRE
DS MEAN
ACTUAL –
POST DS
MEAN
Agriculture, Rural and Urban
Development: 4 11.8 12.7 -7.8 -8.7
Energy, Infrastructure and ICT 24 9.5 11.7 14.5 12.3
General Economic and
Commercial Affairs 1 7.1 7.0 -6.1 -6
Health 4 14.9 14.5 -10.9 -10.5
Education 23 14.4 17.3 8.6 5.7
Governance, Justice, Law and
Order 11 8.4 9.3 2.6 1.7
Public Administration &
International Relations 18 6.9 6.8 11.1 11.2
National Security 8 11.5 8.7 -3.5 -0.7
Social Protection, Culture and
Recreation 2 7.0 5.1 -5 -3.1
Environmental Protection, Water
and Natural Resources 5 8.6 6.9 -3.6 -1.9
ACTUAL ALLOCATION is the allocation as provided by the Government per sector.
PRE DS MEAN-Yes(n=14) ; 14 respondents indicated that they were willing to change their initial proposed allocations before DS
POST DS MEAN-Yes(n=10) ; 10 respondents indicated that they were willing to change their initial proposed allocations after DS.
ACTUAL - PRE: DS MEAN Difference between Actual Allocation by the Government and the Pre-DS respondents’ proposed
allocations
ACTUAL - POST DS MEAN : Difference between Actual Allocation by the Government and Post - DS respondents’ proposed
allocations

PRE DS MEAN POST DS MEAN
POST DS MEAN – PRE
DS MEAN
Agriculture, Rural and Urban Development: 12 9.6 -2.4
Energy, Infrastructure and ICT 14.5 15.2 0.7
General Economic and Commercial Affairs 7.1 6.4 -0.7
Health 12.5 11 -1.5
Education 14.1 18.1 4
Governance, Justice, Law and Order 8.2 7.4 -0.8
Public Administration & International Relations 8.6 9.9 1.3
National Security 10.4 10.2 -0.2
Social Protection, Culture and Recreation 5.6 5.5 -0.1
Environmental Protection, Water and Natural
Resources 7.1 7 -0.1
Now that you have told us what you think the distribution of the budget should be, what do you believe to be the
current share of the budget that is allocated to each of these sectors by the national government?
What Respondents Believe to be the Actual Share of the Total (100%) per Sector for
Purposes of Budgeting
PRE – DS; What respondents Believe to be the Actual Share of the Total (100%) per Sector for Purposes of Budgeting before DS
POST – DS; What respondents Believe to be the Actual Share of the Total (100%) per Sector for Purposes of Budgeting after DS
POST DS MEAN – PRE DS MEAN; Difference between what Respondents Believe to be the Actual Share of the Total (100%)
per Sector for Purposes of Budgeting before DS and after DS.

ACTUAL
ALLOCATION
PRE DS MEAN-
YES(N=14)
POST DS
MEAN-
YES(N=10)
ACTUAL -PRE
DS MEAN
ACTUAL –
POST DS
MEAN
Agriculture, Rural and Urban
Development: 4 12.8 9.3 -8.8 -5.3
Energy, Infrastructure and ICT 24 15.1 15.9 8.9 8.1
General Economic and
Commercial Affairs 1 7.7 6.0 -6.7 -5
Health 4 13.8 9.1 -9.8 -5.1
Education 23 12.1 18.0 10.9 5
Governance, Justice, Law and
Order 11 9.4 9.3 1.6 1.7
Public Administration &
International Relations 18 8.8 10.6 9.2 7.4
National Security 8 9.7 9.4 -1.7 -1.4
Social Protection, Culture and
Recreation 2 6.3 5.6 -4.3 -3.6
Environmental Protection,
Water and Natural Resources 5 4.8 6.8 0.2 -1.8
Now that you have told us what you think the distribution of the budget should be, what do you believe to be the
current share of the budget that is allocated to each of these sectors by the national government?
What Respondents Believe to be the Actual Share of the Total (100%) per Sector for
Purposes of Budgeting
Actual Allocation is the allocation as provided by the Government per sector.
Pre-Yes(n=14) ; 14 respondents indicated that they were willing to change their initial proposed allocations before DS
Post-Yes(n=10) ; 10 respondents indicated that they were willing to change their initial proposed allocations after DS.
Actual - Pre: Difference between Actual Allocation by the Government and the Pre-DS respondents’ proposed allocations
Actual - Post : Difference between Actual Allocation by the Government and Post - DS respondents’ proposed allocations
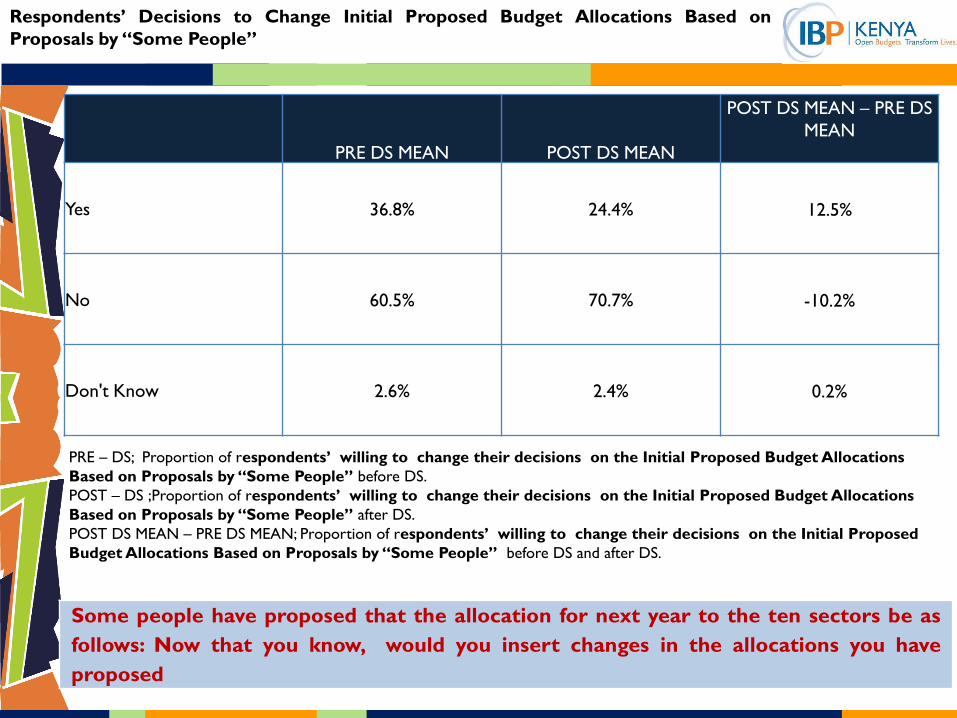
Some people have proposed that the allocation for next year to the ten sectors be as
follows: Now that you know, would you insert changes in the allocations you have
proposed
Respondents’ Decisions to Change Initial Proposed Budget Allocations Based on
Proposals by “Some People”
PRE DS MEAN POST DS MEAN
POST DS MEAN – PRE DS
MEAN
Yes 36.8% 24.4% 12.5%
No 60.5% 70.7% -10.2%
Don't Know 2.6% 2.4% 0.2%
PRE – DS; Proportion of respondents’ willing to change their decisions on the Initial Proposed Budget Allocations
Based on Proposals by “Some People” before DS.
POST – DS ;Proportion of respondents’ willing to change their decisions on the Initial Proposed Budget Allocations
Based on Proposals by “Some People” after DS.
POST DS MEAN – PRE DS MEAN; Proportion of respondents’ willing to change their decisions on the Initial Proposed
Budget Allocations Based on Proposals by “Some People” before DS and after DS.

Some people have proposed that the allocation for next year to the ten sectors be as follows: Now
that you know, would you insert changes in the allocations you have proposed, If yes please insert
The Proposed Budget Allocation by “Some People” Versus Respondents’ New Proposed
Budget Allocations – Pre DS (N = 42)
Actual
Allocation Mean Diff Median Mode Min Max S. Dev
Agriculture, Rural and Urban
Development 4 10.3 -6.3 10 10 2 40 9.74
Energy, Infrastructure and ICT 24 12.9 11.1 10 10 5 30 7.59
General Economic and Commercial
Affairs 1 6.1 -5.1 5 10 1 15 4.32
Health 4 13.8 -9.8 13 10 2 32 8.58
Education 23 17.4 5.6 17 15 5 35 8.46
Governance, Justice, Law and Order 11 9.0 2 10 11 1 20 5.10
Public Administration & International
Relations 18 11.8 6.2 15 5 1 25 7.39
National Security 8 11.6 -3.6 10 10 0 22 5.60
Social Protection, Culture and
Recreation 2 3.4 -1.4 2 0 0 10 3.82
Environmental Protection, Water and
Natural Resources 5 3.7 1.3 3 0 0 10 4.01
“...with 3.9% given on health I would raise the 25% on health I gave to 30% because currently a lot of things are not in
hospitals and the poor somehow cannot afford … - Respondent, Nairobi
Actual Allocation is the allocation as provided by the Government per sector.

The National Government has proposed that the allocation for next year to the ten sectors be as
follows: Now that you know this, would you make any changes to the allocations you have proposed?
The Proposed Budget Allocation by The National Government Versus Respondents’
New Proposed Budget Allocations – Pre DS (N = 42)
Actual
Allocation Mean Diff Median Mode Min Max S. Dev
Agriculture, Rural and Urban
Development 4 11.3 -7.3 10 5 5 25 6.18
Energy, Infrastructure and ICT 24 13.9 10.1 15 15 5 20 4.38
General Economic and Commercial
Affairs 1 4.6 -3.6 5 5 1 10 2.79
Health 4 14.1 -10.1 14 20 4 25 7.05
Education 23 20.0 3 20 25 10 25 5.27
Governance, Justice, Law and Order 11 9.8 1.2 10 10 5 15 2.44
Public Administration & International
Relations 18 7.7 10.3 6 5 1 19 5.23
National Security 8 8.9 -0.9 10 10 2 18 5.02
Social Protection, Culture and
Recreation 2 5.9 -3.9 5 5 2 10 2.42
Environmental Protection, Water and
Natural Resources 5 8.2 -3.2 5 5 2 20 6.68
“...I can change governance, law and justice to 11%, (I gave them less) because through governance we have added more
counties so 1% cannot work… ” – Respondent, Nairobi
Actual Allocation is the allocation as provided by the Government per sector.

When the national government makes decisions about the sector allocation of the
budget, it listens to wananchi like me:
Respondents’ Perceptions on Whether the National Government Involves Citizens
When it Makes Decisions about the Sector Allocation of The Budget
“....little, as much as they listen let them be open. Give follow ups on what’s done and what’s not done because of this. What was the reason for allocations? The forums should also be done country wide and involve the rural people… ” – Respondent, Mombasa
39.0%
29.3%
22.0%
7.3%
2.4%
32.5% 35.0%
25.0%
2.5% 5.0%
0%
5%
10%
15%
20%
25%
30%
35%
40%
45%
50%
A little Not at all Somewhat A lot Don’t know
PRE - DS POST - DS

When the county government makes decisions about the sector allocation of the
budget, it listens to wananchi like me:
Respondents’ Perceptions on Whether County Governments Involve Citizens When it
Makes Decisions about the Sector Allocation of The Budget
“...it’s never announced even when writing bills it’s just MCAs and clerks no one is invited. … ” –
Respondent, Nakuru
48.8%
19.5%
14.6% 12.2%
4.9%
35.0% 35.0%
22.5%
2.5% 5.0%
0%
5%
10%
15%
20%
25%
30%
35%
40%
45%
50%
Not at all A little Somewhat Don’t know A lot
PRE - DS POST - DS

When the government makes choices in the budget, it sometimes provides a reason or
justification for those choices. On a scale of 1 – 5 where 1 is “Extremely dissatisfied” 3
is “Somehow satisfied” and 5 is “Very satisfied”, how satisfied are you with the kinds of
justifications that the national government provides for these choices?
Satisfaction with the National Government’s Justifications for Budget Allocation
“…money was allocated to do specific job like allocation for flooding yet we never saw floods, health is
understandable because of Ebola cases and cholera…” – Respondent, Nakuru
52.5%
20.0%
15.0%
7.5% 5.0%
47.5%
27.5%
10.0%
5.0%
10.0%
0%
10%
20%
30%
40%
50%
60%
Somewhat satisfied Satisfied Dissatisfied Very satisfied Very dissatisfied
PRE - DS POST - DS

Using the same scale as Q.7 above, how satisfied are you with the justifications that the
county governments provide when they make budget choices?
Satisfaction with the County Governments’ Justifications for Budget Allocation
47.6%
19.0% 16.7%
14.3%
2.4%
50.0%
15.0%
5.0%
27.5%
2.5%
0%
10%
20%
30%
40%
50%
60%
Somewhat satisfied Dissatisfied Very satisfied Satisfied Very dissatisfied
PRE - DS POST - DS

Distribution/Fairness Scenarios

Scenario Person PRE DS POST DS DIFF
There are two Kenyans. One is sick and one is healthy. The sick
one will need to visit the hospital for several treatments this year
while the healthy one will visit the clinic once for a checkup this
year. How will you distribute the Ksh.100, 000 among them?
Person 1 62436 56341 6095
Person 2 37564 43659 -6095
There are two Kenyans. One earns Ksh.250, 000 a month and the
other earns Ksh.10, 000 a month. Both have two children to send
to school. How will you distribute the Ksh.100, 000 among them?
Person 1 22317 29878 -7561
Person 2 77683 70122 7561
There are two Kenyans. Both live in the same estate and both earn
Ksh.35, 000 a month. One has used the small plot behind their
house to plant vegetables to sell and supplement their income by
Ksh.5, 000 a month. The other has not used their plot to
supplement their income. How will you distribute the Ksh.100, 000
among them?
Person 1 56585 54390 2195
Person 2 43415 45610 -2195
There are two Kenyans. One earns Ksh.1, 000,000 a month, while
the other earns Ksh.10, 000 a month. How will you distribute the
Ksh.100, 000 among them?
Person 1 14900 24707 -9807
Person 2 85100 75293 9807
Distribution/Fairness Scenarios (1/3)

Scenario Person PRE DS POST DS DIFF
There are two Kenyans. Both earn Ksh.40, 000 per month.
One spends a significant part of salary on alcohol, and is often
unable to work. The other does not drink and has not missed
a day of work in two years. How would you share the Ksh.100,
000 between them?
Person 1 25800 32317 -6517
Person 2 74200 67683 6517
There are two Kenyans. Both earn Ksh.40, 000 per month.
One uses their salary to take out a loan and buy a Prado to
enjoy. The other saves half of their salary and invests in a side
business. How would you distribute the Ksh.100, 000 among
them?
Person 1 30675 31951 -1276
Person 2 69325 68049 1276
There are two people: one from a rural county and one from
an urban county. Both earn the same salary. How would you
distribute the Ksh.100, 000 among them?
Person 1 50875 45976 4899
Person 2 49125 54024 -4899
There are two people: one from your county and one from a
different county on the other side of the country. Both earn
Ksh.40, 000. How would you distribute the Ksh.100, 000
among them?
Person 1 54054 49512 4542
Person 2 45946 48049 -2103
Distribution/Fairness Scenarios (2/3)
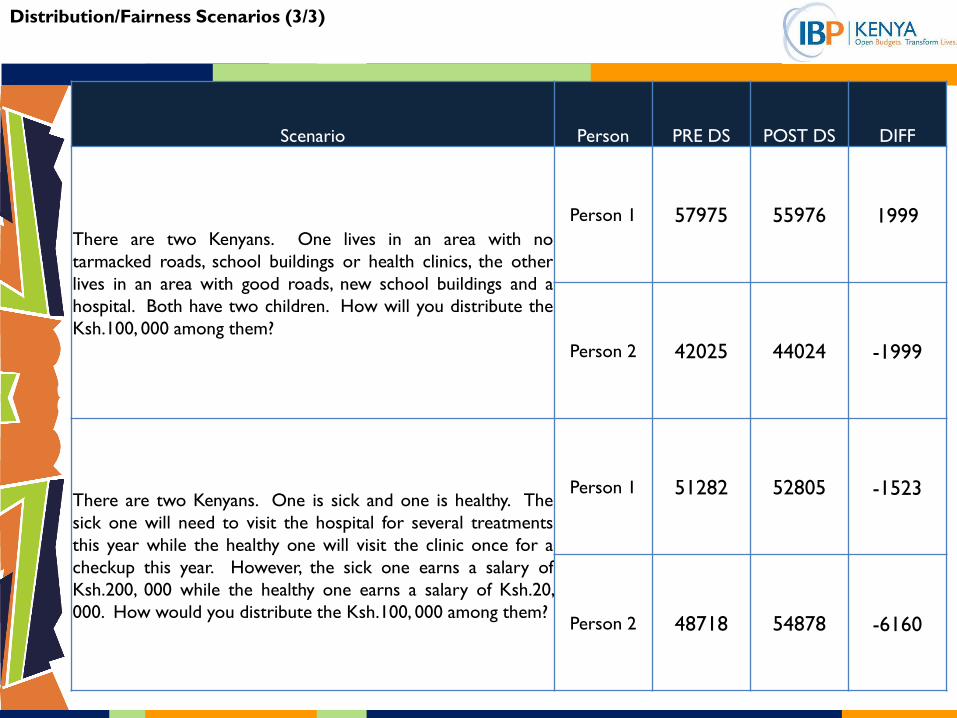
Scenario Person PRE DS POST DS DIFF
There are two Kenyans. One lives in an area with no
tarmacked roads, school buildings or health clinics, the other
lives in an area with good roads, new school buildings and a
hospital. Both have two children. How will you distribute the
Ksh.100, 000 among them?
Person 1 57975 55976 1999
Person 2 42025 44024 -1999
There are two Kenyans. One is sick and one is healthy. The
sick one will need to visit the hospital for several treatments
this year while the healthy one will visit the clinic once for a
checkup this year. However, the sick one earns a salary of
Ksh.200, 000 while the healthy one earns a salary of Ksh.20,
000. How would you distribute the Ksh.100, 000 among them?
Person 1 51282 52805 -1523
Person 2 48718 54878 -6160
Distribution/Fairness Scenarios (3/3)

In each of the scenarios you have listened to, the government officer has a choice. You
can simply make your decision and communicate it to the two people involved.
Alternatively, you could explain to each of them the reasoning behind your decision as
well as the final decision itself. What would you do if you were the government officer?
Decision Making and Communication Choices
PRE DS POST DS DIFF
Explain to each of them the reasoning behind your decision as well
as the final decision itself 78.8% 71.8% 7.0%
Make your decision and communicate it to the two people involved 12.1% 15.4% -3.3%
Don't Know 9.1% 12.8% -3.7%

As a citizen, on a scale of 1 - 5 where 1 is “Completely unimportant”, 3 is “neither
important nor unimportant” and 5 is “very important, how important” is it to you that
government explains the reasons behind its decisions?
Importance of the Government Explaining its Reasons Behind its
Decision in Budget Allocation
N=1500
PRE DS POST DS DIFF
Very Important 72.5% 66.7% 5.8%
Important 20.0% 20.5% -0.5%
Neither Important nor Unimportant 5.0% 5.1% -0.1%
Unimportant 2.5% 5.1% -2.6%
Completely Unimportant 0.0% 2.6% -2.6%

CONCLUSIONS

During this quantitative phase of the national representative survey on the National and County
Budget Making Process the attitudes of Kenyans with regard to distributional questions and
scenarios revealed that there isn’t much difference among the general population even when the
following distinct parameters are taken into account:
o Gender
o Location (Rural and Urban)
o Political Party Affiliation
o Level of Education
o Employment Status
In terms of sector budget allocation, the respondents indicated that their choices for those that
would receive the most would be:
o Education
o Health
o Agriculture
o Energy, Infrastructure & ICT
The respondents choices for those sectors that would receive the least in budget in allocation
were:
o Government, Justice, Law & Order
o Social Protection, Culture & Recreation
o Public Administration & International Relations
Conclusions – Quantitative Phase (1/2)

On respondents’ perceptions regarding the National Government’s involvement of citizens
when it makes decisions about the sector allocation of the Budget, 52.2% of the surveyed
respondents indicated that this is not the case at all.
On respondents’ perceptions on regarding the County Governments’ involvement of citizens
when they makes decisions about the sector allocation of the Budget, 47.8% of the surveyed
respondents similarly indicated that this is not the case at all.
On satisfaction with the National Government’s justifications for budget allocation 39.8%
indicated that they were somewhat satisfied.
On satisfaction with the County Governments’ justifications for budget allocation 37.1%
similarly indicated that they were somewhat satisfied.
In terms of decision making and communication choices with regard to distribution/fairness
scenarios 67.9% of the surveyed respondents indicated that they would explain the
reasoning behind their decisions as well as the final decision itself while 29.4% stated
that that they would simply make the final decision and then communicate it.
Respondents were seen to favour giving more money to those they perceived to be
disadvantaged or vulnerable.
Conclusions – Quantitative Phase (2/2)

Conclusions – Qualitative Phase (1/2)
On, attitudes about sector allocations majority of the participants indicated that the largest share of their allocations would go to the Health, Agriculture and Energy, Infrastructure & ICT while they would allocate the least to Social Protection & Cultural Recreation and Governance, Justice, Law & Order.
With regard to the distribution/fairness scenarios the participants were inclined to allocate more money to those individuals they felt were disadvantaged or vulnerable.
Given information government budget sector allocation, a number of the participants who did change their views about questions of distribution did so with an aim to aligning them with the Government’s proposals. However it is worth noting that on the issue of the adequacy of the explanations given by the Government on these allocations, most respondents had difficulties in understanding them, and with very few exceptions were largely unable to interpret them critically.
Those participants who did chose to make changes to their proposals cited the need to increase allocations to sectors they deemed important such as Agriculture, Energy and Health.
Respondents who indicated that they would not change their earlier proposals largely cited the fact that the Government had made deductions to critical sectors like Health, decisions which they completely disagreed with.

Conclusion – Qualitative Phase (2/2)
For the most part participants across the 6 groups did exhibit rather high levels of satisfaction with the deliberative process insofar as it contributed to their understanding of the budget making process.

ANNEX I – CROSSTABS
FOR SECTOR QUESTIONS

Which political party do you feel closest to?
34.4%
32.3%
11.4%
8.7%
6.2%
2.3%
1.9%
1.5%
0.7%
0.4%
0.3%
0.0% 5.0% 10.0% 15.0% 20.0% 25.0% 30.0% 35.0% 40.0%
ODM
Jubilee Alliance Party (JAP)
TNA
United Republican Party (URP)
WIPER DEMOCRATIC MOVEMENT KENYA …
FORD-KENYA
KANU
Amani National Congress (ANC)
Chama Cha Mashinani - Kenya (CCMK)
National Rainbow Coalition (NARC)
National Rainbow Coalition-Kenya (NARC-Kenya)
Political Party Affiliation
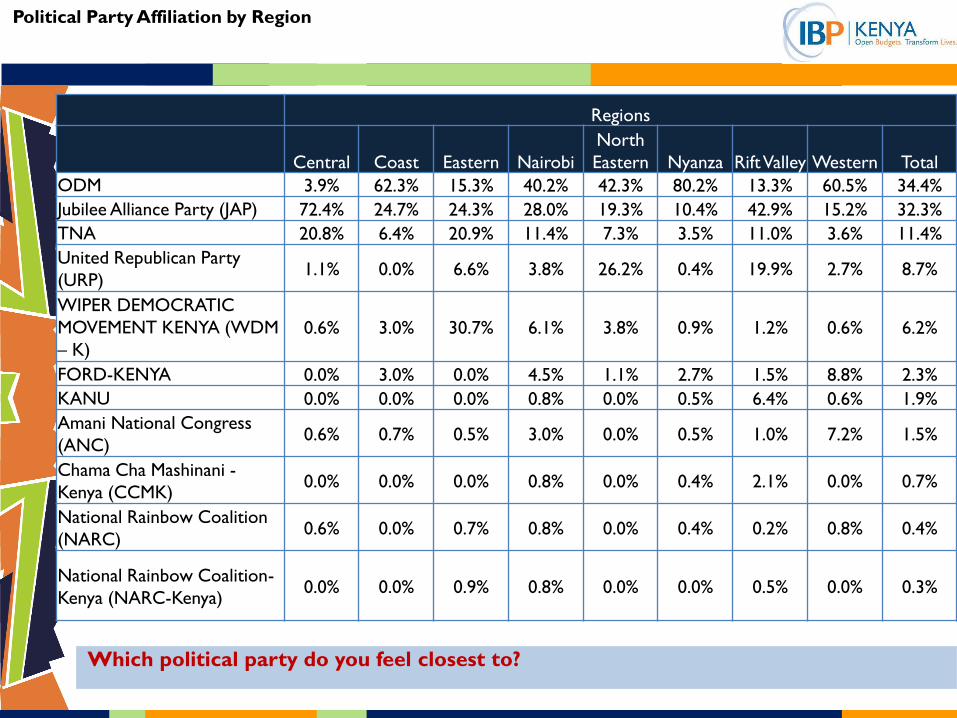
Political Party Affiliation by Region
Regions
Central Coast Eastern Nairobi
North
Eastern Nyanza Rift Valley Western Total
ODM 3.9% 62.3% 15.3% 40.2% 42.3% 80.2% 13.3% 60.5% 34.4%
Jubilee Alliance Party (JAP) 72.4% 24.7% 24.3% 28.0% 19.3% 10.4% 42.9% 15.2% 32.3%
TNA 20.8% 6.4% 20.9% 11.4% 7.3% 3.5% 11.0% 3.6% 11.4%
United Republican Party
(URP) 1.1% 0.0% 6.6% 3.8% 26.2% 0.4% 19.9% 2.7% 8.7%
WIPER DEMOCRATIC
MOVEMENT KENYA (WDM
– K)
0.6% 3.0% 30.7% 6.1% 3.8% 0.9% 1.2% 0.6% 6.2%
FORD-KENYA 0.0% 3.0% 0.0% 4.5% 1.1% 2.7% 1.5% 8.8% 2.3%
KANU 0.0% 0.0% 0.0% 0.8% 0.0% 0.5% 6.4% 0.6% 1.9%
Amani National Congress
(ANC) 0.6% 0.7% 0.5% 3.0% 0.0% 0.5% 1.0% 7.2% 1.5%
Chama Cha Mashinani -
Kenya (CCMK) 0.0% 0.0% 0.0% 0.8% 0.0% 0.4% 2.1% 0.0% 0.7%
National Rainbow Coalition
(NARC) 0.6% 0.0% 0.7% 0.8% 0.0% 0.4% 0.2% 0.8% 0.4%
National Rainbow Coalition-
Kenya (NARC-Kenya) 0.0% 0.0% 0.9% 0.8% 0.0% 0.0% 0.5% 0.0% 0.3%
Which political party do you feel closest to?
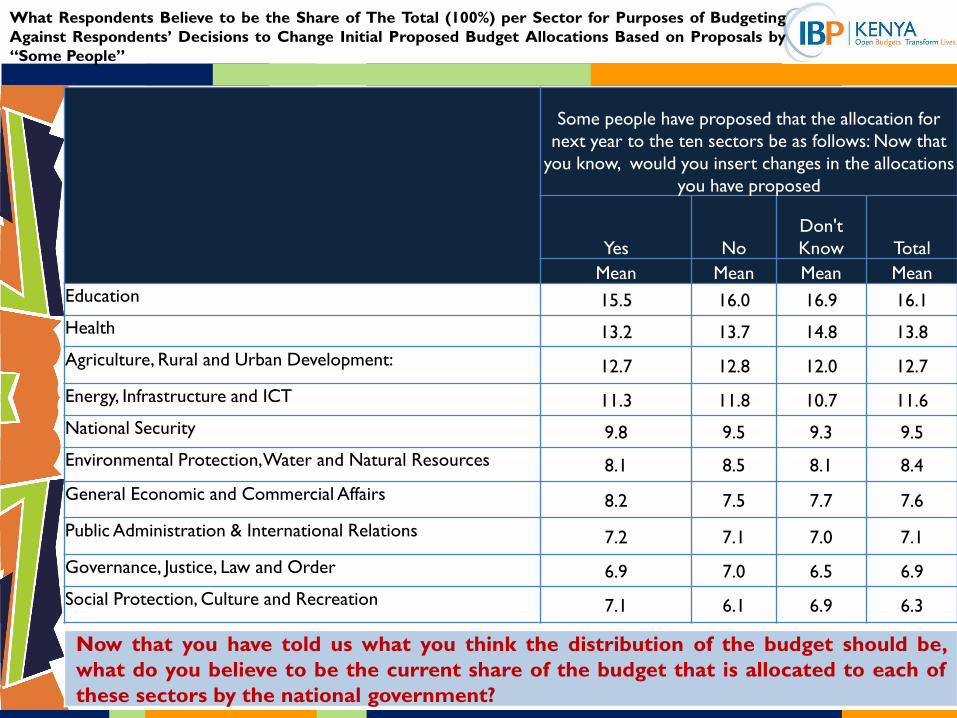
Now that you have told us what you think the distribution of the budget should be,
what do you believe to be the current share of the budget that is allocated to each of
these sectors by the national government?
Some people have proposed that the allocation for
next year to the ten sectors be as follows: Now that
you know, would you insert changes in the allocations
you have proposed
Yes No
Don't
Know Total
Mean Mean Mean Mean
Education 15.5 16.0 16.9 16.1
Health 13.2 13.7 14.8 13.8
Agriculture, Rural and Urban Development: 12.7 12.8 12.0 12.7
Energy, Infrastructure and ICT 11.3 11.8 10.7 11.6
National Security 9.8 9.5 9.3 9.5
Environmental Protection, Water and Natural Resources 8.1 8.5 8.1 8.4
General Economic and Commercial Affairs 8.2 7.5 7.7 7.6
Public Administration & International Relations 7.2 7.1 7.0 7.1
Governance, Justice, Law and Order 6.9 7.0 6.5 6.9
Social Protection, Culture and Recreation 7.1 6.1 6.9 6.3
What Respondents Believe to be the Share of The Total (100%) per Sector for Purposes of Budgeting
Against Respondents’ Decisions to Change Initial Proposed Budget Allocations Based on Proposals by
“Some People”
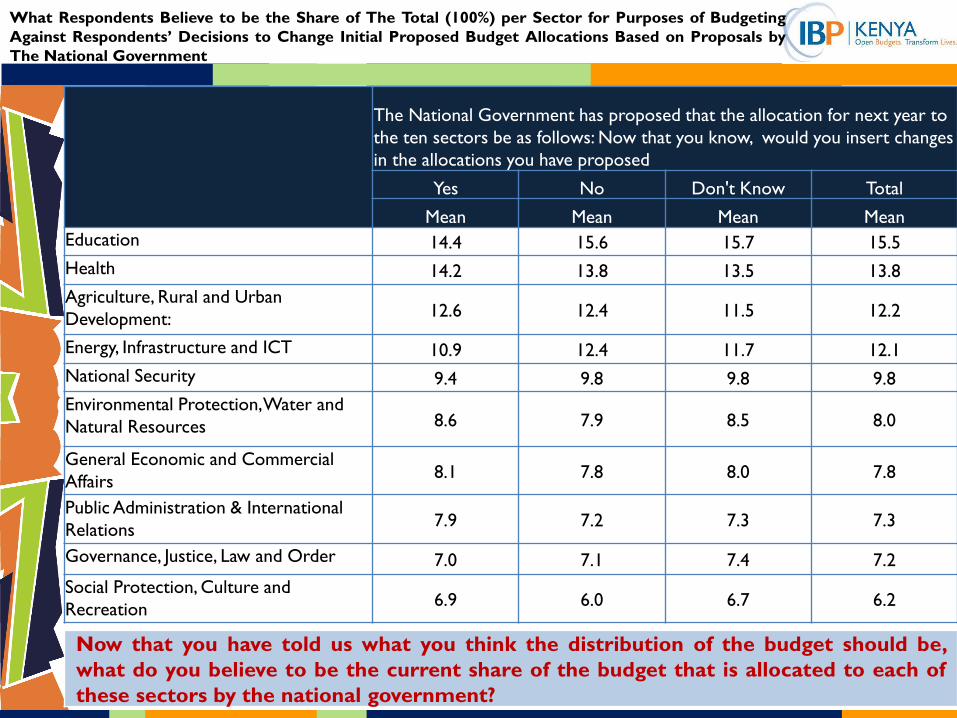
Now that you have told us what you think the distribution of the budget should be,
what do you believe to be the current share of the budget that is allocated to each of
these sectors by the national government?
What Respondents Believe to be the Share of The Total (100%) per Sector for Purposes of Budgeting
Against Respondents’ Decisions to Change Initial Proposed Budget Allocations Based on Proposals by
The National Government
The National Government has proposed that the allocation for next year to
the ten sectors be as follows: Now that you know, would you insert changes
in the allocations you have proposed
Yes No Don't Know Total
Mean Mean Mean Mean
Education 14.4 15.6 15.7 15.5
Health 14.2 13.8 13.5 13.8
Agriculture, Rural and Urban
Development: 12.6 12.4 11.5 12.2
Energy, Infrastructure and ICT 10.9 12.4 11.7 12.1
National Security 9.4 9.8 9.8 9.8
Environmental Protection, Water and
Natural Resources 8.6 7.9 8.5 8.0
General Economic and Commercial
Affairs 8.1 7.8 8.0 7.8
Public Administration & International
Relations 7.9 7.2 7.3 7.3
Governance, Justice, Law and Order 7.0 7.1 7.4 7.2
Social Protection, Culture and
Recreation 6.9 6.0 6.7 6.2

Now that you have told us what you think the distribution of the budget should be,
what do you believe to be the current share of the budget that is allocated to each of
these sectors by the national government?
What Respondents Believe to be the Share of The Total (100%) per Sector for Purposes of Budgeting
Respondents’ Against Perceptions on Whether the National Government Involves Citizens When it
Makes Decisions about Sector Allocation of The Budget
When the national government makes decisions about the
sector allocation of the budget, it listens to wananchi like
me:
Total
A lot Somewhat A little Not at all Don’t know
Mean Mean Mean Mean Mean
Education 14.6 15.3 15.6 16.2 16.1 15.9
Health 13.8 13.5 14.2 13.6 13.5 13.7
Agriculture, Rural and Urban Development: 13.4 13.4 11.8 12.5 11.9 12.5
Energy, Infrastructure and ICT 17.3 11.9 11.7 11.7 11.8 11.8
National Security 8.5 9.3 9.7 9.6 10.3 9.6
Environmental Protection, Water and Natural
Resources 7.4 9.0 8.6 7.8 6.9 8.1
General Economic and Commercial Affairs 6.8 7.5 7.3 7.6 8.4 7.6
Public Administration & International
Relations 5.4 7.2 7.0 7.1 7.5 7.1
Governance, Justice, Law and Order 6.7 6.7 7.1 7.0 7.4 7.0
Social Protection, Culture and Recreation 6.2 6.3 6.1 6.1 5.8 6.1
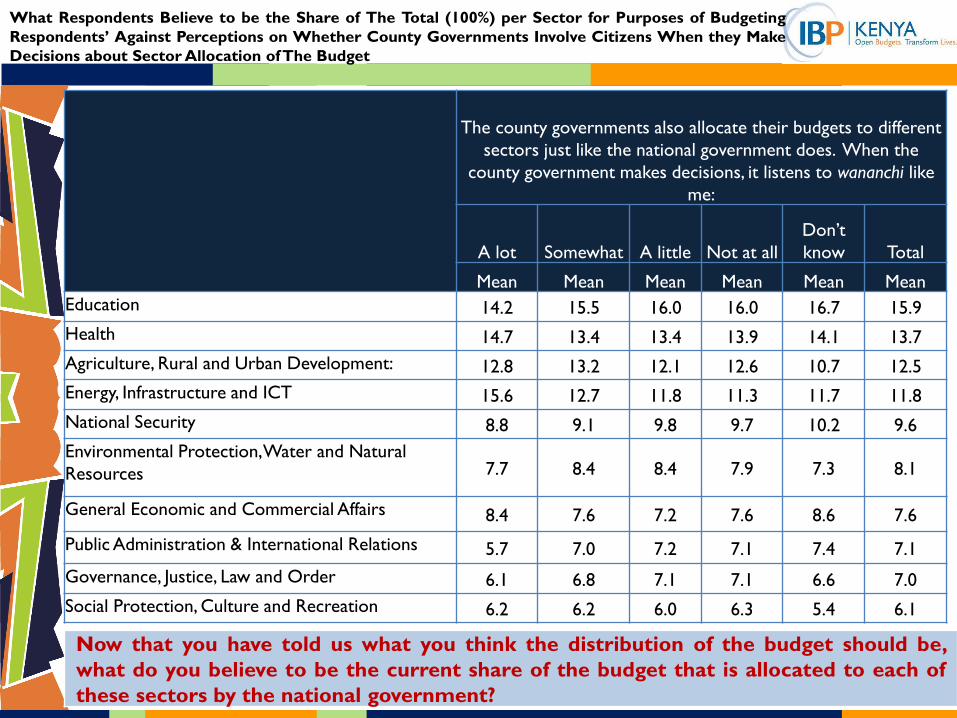
Now that you have told us what you think the distribution of the budget should be,
what do you believe to be the current share of the budget that is allocated to each of
these sectors by the national government?
The county governments also allocate their budgets to different
sectors just like the national government does. When the
county government makes decisions, it listens to wananchi like
me:
A lot Somewhat A little Not at all
Don’t
know Total
Mean Mean Mean Mean Mean Mean
Education 14.2 15.5 16.0 16.0 16.7 15.9
Health 14.7 13.4 13.4 13.9 14.1 13.7
Agriculture, Rural and Urban Development: 12.8 13.2 12.1 12.6 10.7 12.5
Energy, Infrastructure and ICT 15.6 12.7 11.8 11.3 11.7 11.8
National Security 8.8 9.1 9.8 9.7 10.2 9.6
Environmental Protection, Water and Natural
Resources 7.7 8.4 8.4 7.9 7.3 8.1
General Economic and Commercial Affairs 8.4 7.6 7.2 7.6 8.6 7.6
Public Administration & International Relations 5.7 7.0 7.2 7.1 7.4 7.1
Governance, Justice, Law and Order 6.1 6.8 7.1 7.1 6.6 7.0
Social Protection, Culture and Recreation 6.2 6.2 6.0 6.3 5.4 6.1
What Respondents Believe to be the Share of The Total (100%) per Sector for Purposes of Budgeting
Respondents’ Against Perceptions on Whether County Governments Involve Citizens When they Make
Decisions about Sector Allocation of The Budget

Now that you have told us what you think the distribution of the budget should be,
what do you believe to be the current share of the budget that is allocated to each of
these sectors by the national government?
What Respondents Believe to be the Share of The Total (100%) per Sector for Purposes of Budgeting
Against Satisfaction with the National Government’s Justification for Budget Allocation Choices
When the government makes choices in the budget, it
sometimes provides a reason or justification for those
choices. On a scale of 1 – 5 where 5 is “Extremely
dissatisfied” 3 is “Somehow satisfied” and 1 is “Very
satisfied”, how satisfied are you with the
Total
Very
Satisfied Satisfied
Somewhat
satisfied Dissatisfied
Very
dissatisfied
Mean Mean Mean Mean Mean
Education 15.7 14.2 15.9 16.4 16.3 15.9
Health 14.3 13.6 13.6 13.8 13.8 13.7
Agriculture, Rural and Urban
Development: 14.3 13.4 11.6 12.5 13.9 12.5
Energy, Infrastructure and ICT 13.7 12.5 11.8 11.6 11.6 11.8
National Security 7.9 10.5 9.6 9.4 9.6 9.6
Environmental Protection, Water and
Natural Resources 8.0 7.5 8.8 7.7 7.5 8.1
General Economic and Commercial Affairs 7.9 8.1 7.6 7.5 6.7 7.6
Public Administration & International
Relations 5.5 7.0 7.1 7.3 6.5 7.1
Governance, Justice, Law and Order 6.9 7.1 7.0 7.2 6.4 7.0
Social Protection, Culture and Recreation 6.2 6.2 6.0 6.4 5.4 6.1

Now that you have told us what you think the distribution of the budget should be,
what do you believe to be the current share of the budget that is allocated to each of
these sectors by the national government?
On a scale of 1 – 5 where 5 is “Extremely dissatisfied” 3 is
“Somehow satisfied” and 1 is “Very satisfied”, how satisfied are you
with the justifications that the county governments provide when
they make budget choices?
Very
Satisfied Satisfied
Somewhat
satisfied
Dissatisfi
ed
Very
dissatisfied Total
Mean Mean Mean Mean Mean Mean
Education 13.8 15.1 15.8 16.2 16.2 15.9
Health 16.0 13.2 13.5 14.1 13.6 13.7
Agriculture, Rural and Urban Development 12.5 13.3 12.3 12.2 12.8 12.5
Energy, Infrastructure and ICT 14.7 12.9 12.1 11.2 11.4 11.8
National Security 8.1 9.7 9.7 9.4 9.9 9.6
Environmental Protection, Water and Natural
Resources 7.7 7.9 8.6 7.8 7.7 8.1
General Economic and Commercial Affairs 8.3 7.7 7.7 7.5 7.1 7.6
Public Administration & International Relations 6.3 7.0 7.0 7.4 6.7 7.1
Governance, Justice, Law and Order 6.5 6.7 7.0 7.2 6.7 7.0
Social Protection, Culture and Recreation 6.1 6.0 6.1 6.3 6.0 6.1
What Respondents Believe to be the Share of The Total (100%) per Sector for Purposes of Budgeting
Against Satisfaction with County Governments’ Justifications for Budget Allocation Choices

Some People proposed that the allocation for next year to the
ten sectors be as follows: Now that you know, would you
insert changes in the allocations you have proposed
Overall
Yes No Don't Know
Mean Mean Mean
Education 14.7 16.7 16.7 16.3
Health 15.0 14.8 16.1 14.8
Agriculture, Rural and Urban
Development: 14.1 13.8 13.1 13.8
Energy, Infrastructure and ICT 9.7 11.2 10.1 11.2
National Security 10.0 9.7 9.3 9.7
Environmental Protection, Water
and Natural Resources 8.5 8.5 8.4 8.2
General Economic and
Commercial Affairs 8.3 7.2 7.9 7.4
Public Administration &
International Relations 6.8 6.3 6.2 6.5
Governance, Justice, Law and
Order 6.6 6.1 6.2 6.3
Social Protection, Culture and
Recreation 6.2 5.8 5.9 5.8
Respondents’ Proposed Allocations to the Share of the Total (100%) per Sector for Purposes of
Budgeting Against Respondents’ Decisions to Change Initial Proposed Budget Allocations Based on
Proposals by “Some People”

The National Government has proposed that the allocation for
next year to the ten sectors be as follows: Now that you know,
would you insert changes in the allocations you have proposed
Yes No Don't Know
Total Mean Mean Mean
Education 16.0 16.0 16.1 16.3
Health 14.9 14.9 14.0 14.8
Agriculture, Rural and Urban
Development 14.7 14.0 13.0 13.8
Energy, Infrastructure and ICT 10.3 11.5 10.7 11.2
National Security 9.3 9.7 9.9 9.7
Environmental Protection, Water
and Natural Resources 8.6 7.8 8.6 8.2
General Economic and
Commercial Affairs 7.5 7.4 7.2 7.4
Public Administration &
International Relations 6.7 6.5 7.5 6.5
Governance, Justice, Law and
Order 6.5 6.4 6.3 6.3
Social Protection, Culture and
Recreation 5.6 5.8 6.7 5.8
Respondents’ Proposed Allocations to the Share of the Total (100%) per Sector for Purposes of
Budgeting Against Respondents’ Decisions to Change Initial Proposed Budget Allocations Based on
Proposals by the National Government

Respondents’ Proposed Allocations to the Share of the Total (100%) per Sector for Purposes of Budgeting
Against Respondents’ Satisfaction with the National Government’s Justification for Budget Allocation
Choices
Very Satisfied Satisfied
Somewhat
satisfied Dissatisfied
Very
dissatisfied Total
Mean Mean Mean Mean Mean Mean
Education 13.6 14.8 16.3 16.8 17.1 16.3
Health 17.4 13.8 14.5 15.3 15.2 14.8
Agriculture, Rural and Urban
Development: 13.7 13.9 13.0 14.4 15.0 13.8
Energy, Infrastructure and ICT 13.1 12.1 11.7 10.5 10.3 11.2
National Security 7.5 9.9 10.0 9.3 9.7 9.7
Environmental Protection, Water
and Natural Resources 8.1 7.6 8.7 7.9 7.6 8.2
General Economic and
Commercial Affairs 8.2 7.6 7.2 7.4 7.4 7.4
Public Administration &
International Relations 6.1 7.3 6.5 6.3 6.0 6.5
Governance, Justice, Law and
Order 6.0 6.5 6.4 6.3 6.1 6.3
Social Protection, Culture and
Recreation 6.3 6.3 5.7 5.8 5.6 5.8

On a scale of 1 – 5 where 5 is “Extremely dissatisfied” 3 is “Somehow
satisfied” and 1 is “Very satisfied”, how satisfied are you with the
justifications that the county governments provide when they make
budget choices?
Very
Satisfied Satisfied
Somewhat
satisfied Dissatisfied
Extremely
dissatisfied Total
Mean Mean Mean Mean Mean Mean
Education 14.5 15.5 16.0 16.7 17.1 16.3
Health 17.5 13.6 14.3 15.5 15.5 14.8
Agriculture, Rural and Urban
Development 12.2 14.0 13.6 13.8 14.7 13.8
Energy, Infrastructure and ICT 13.7 12.1 11.5 10.8 10.2 11.2
National Security 7.9 9.9 9.8 9.5 9.7 9.7
Environmental Protection, Water and
Natural Resources 8.6 7.9 8.6 8.0 7.8 8.2
General Economic and Commercial Affairs 7.3 7.6 7.3 7.4 7.3 7.4
Public Administration & International
Relations 6.3 7.0 6.5 6.4 6.0 6.5
Governance, Justice, Law and Order 4.9 6.3 6.5 6.3 5.9 6.3
Social Protection, Culture and Recreation 7.0 6.0 5.8 5.9 5.7 5.8
Respondents’ Proposed Allocations to the Share of the Total (100%) per Sector for Purposes of Budgeting
Against Respondents’ Satisfaction with County Governments’ Justifications for Budget Allocation
Choices

When the national government makes decisions about the
sector allocation of the budget, it listens to wananchi like me:
A lot
Somewh
at A little Not at all
Don’t
know
Mean Mean Mean Mean Mean
Education 15.4 15.6 16.1 16.6 16.5 16.3
Health 14.6 14.1 15.2 14.9 14.4 14.8
Agriculture, Rural and Urban Development: 13.9 13.9 13.4 14.1 13.1 13.8
Energy, Infrastructure and ICT 16.1 11.9 11.0 10.8 12.5 11.2
National Security 9.3 9.3 9.7 9.7 10.3 9.7
Environmental Protection, Water and Natural
Resources 9.0 8.8 8.4 7.9 7.3 8.2
General Economic and Commercial Affairs 6.9 7.3 7.4 7.5 6.8 7.4
Public Administration & International Relations
5.5 6.6 6.5 6.4 7.0 6.5
Governance, Justice, Law and Order 4.3 6.5 6.5 6.2 6.9 6.3
Social Protection, Culture and Recreation 5.1 5.9 5.7 6.0 5.2 5.8
Respondents’ Proposed Allocations to the Share of the Total (100%) per Sector for Purposes of
Budgeting Against Respondents’ Perceptions on Whether The National Government Involves Citizens
When it Makes Decisions about Sector Allocation

The county governments also allocate their budgets to different
sectors just like the national government does. When the county
government makes decisions, it listens to wananchi like me
A lot
Somewh
at A little Not at all
Don’t
know Total
Mean Mean Mean Mean Mean Mean
Education 14.5 15.7 16.1 16.7 17.1 16.3
Health 15.5 13.8 15.1 15.0 14.7 14.8
Agriculture, Rural and Urban Development: 14.8 14.4 13.1 14.3 11.8 13.8
Energy, Infrastructure and ICT 14.4 11.6 11.6 10.5 12.7 11.2
National Security 8.6 9.2 10.0 9.7 10.5 9.7
Environmental Protection, Water and Natural
Resources 8.2 8.4 8.5 7.9 7.8 8.2
General Economic and Commercial Affairs 7.5 7.6 7.2 7.5 6.9 7.4
Public Administration & International Relations 5.3 6.9 6.5 6.3 6.8 6.5
Governance, Justice, Law and Order 5.3 6.4 6.4 6.2 6.5 6.3
Social Protection, Culture and Recreation 5.8 6.0 5.6 6.0 5.3 5.8
Respondents’ Proposed Allocations to the Share of the Total (100%) per Sector for Purposes of
Budgeting Against Respondents’ Perceptions on Whether County Governments Involve Citizens When
they Make Decisions about Sector Allocation

When the national government makes decisions about the sector allocation of the
budget, it listens to wananchi like me:
Some people have proposed that the allocation for next year to
the ten sectors be as follows: Now that you know, would you
insert changes in the allocations you have proposed
Yes No Don't Know Total
Not at all 44.5% 50.4% 51.2% 52.2%
A little 18.9% 25.0% 28.8% 24.2%
Somewhat 27.9% 17.1% 11.7% 15.6%
Don’t know 5.1% 6.1% 7.2% 6.3%
A lot 3.7% 1.4% 1.0% 1.7%
Whether The National Government Involves Citizens When it Makes Decisions about the Sector
Allocation of The Budget Against Respondents’ Decisions to Change Initial Proposed Budget Allocations
Based on Proposals by “Some People”

When the national government makes decisions about the sector allocation of the
budget, it listens to wananchi like me:
The National Government has proposed that the allocation
for next year to the ten sectors be as follows: Now that you
know, would you insert changes in the allocations you have
proposed
Yes No Don't Know Total
Not at all 53.9% 54.8% 58.2% 52.2%
A little 22.7% 22.6% 18.8% 24.2%
Somewhat 16.9% 15.1% 9.9% 15.6%
Don’t know 3.4% 5.9% 11.0% 6.3%
A lot 3.2% 1.7% 2.1% 1.7%
Whether The National Government Involves Citizens When it Makes Decisions about the Sector
Allocation of The Budget Against Respondents’ Decisions to Change Initial Proposed Budget Allocations
Based on Proposals by The National Government

When the county government makes decisions about the sector allocation of the
budget, it listens to wananchi like me:
Some people have proposed that the allocation for next year to the ten sectors be as
follows: Now that you know, would you insert changes in the allocations you have
proposed
Yes No Don't Know Total
Not at all 44.1% 46.3% 45.1% 47.8%
A little 34.5% 31.9% 29.6% 29.8%
Somewhat 16.5% 15.3% 16.1% 15.1%
Don’t know 0.0% 4.8% 8.2% 4.4%
A lot 5.0% 1.8% 1.0% 2.9%
Whether The County Governments Involve Citizens When they Make Decisions about Sector
Allocation of The Budget Against Respondents’ Decisions to Change Initial Proposed Budget Allocations
Based on Proposals by “Some People”

When the county government makes decisions about the sector allocation of the
budget, it listens to wananchi like me:
The National Government has proposed that the allocation for next year to the ten sectors
be as follows: Now that you know, would you insert changes in the allocations you have
proposed
Yes No Don't Know Total
Not at all 54.6% 49.2% 57.5% 47.8%
A little 22.4% 29.2% 18.9% 29.8%
Somewhat 13.4% 14.6% 14.0% 15.1%
Don’t know 3.3% 2.8% 8.4% 4.4%
A lot 6.4% 4.1% 1.1% 2.9%
Whether The County Governments Involve Citizens When they Make Decisions about Sector
Allocation of The Budget Against Respondents’ Decisions to Change Initial Proposed Budget Allocations
Based on Proposals by The National Government

When the government makes choices in the budget, it sometimes provides a reason or
justification for those choices. On a scale of 1 – 5 where 1 is “Extremely dissatisfied” 3
is “Somehow satisfied” and 5 is “Very satisfied”, how satisfied are you with the kinds of
justifications that the national government provides for these choices?
Satisfaction with the National Government’s Justification for Budget Allocation Choices Against
Respondents’ Decisions to Change Initial Proposed Budget Allocations Based on Proposals by “Some
People”
Some People proposed that the allocation for next year to the
ten sectors be as follows: Now that you know, would you
insert changes in the allocations you have proposed
Total Yes No Don't Know
Somewhat satisfied 39.5% 41.4% 36.2% 39.8%
Dissatisfied 34.6% 32.7% 37.8% 34.4%
Satisfied 18.3% 14.1% 11.2% 13.7%
Very dissatisfied 4.7% 10.6% 9.8% 10.5%
Very Satisfied 3.0% 1.2% 5.1% 1.6%

When the government makes choices in the budget, it sometimes provides a reason or
justification for those choices. On a scale of 1 – 5 where 1 is “Extremely dissatisfied” 3
is “Somehow satisfied” and 5 is “Very satisfied”, how satisfied are you with the kinds of
justifications that the national government provides for these choices?
The National Government has proposed that the allocation for
next year to the ten sectors be as follows: Now that you know,
would you insert changes in the allocations you have proposed
Total Yes No Don't Know
Somewhat satisfied 28.2% 38.6% 32.9% 39.8%
Dissatisfied 46.0% 35.2% 37.7% 34.4%
Satisfied 10.0% 15.7% 12.9% 13.7%
Very dissatisfied 9.2% 10.1% 15.5% 10.5%
Very Satisfied 6.6% .4% 1.0% 1.6%
Satisfaction with the National Government’s Justification for Budget Allocation Choices Against
Respondents’ Decisions to Change Initial Proposed Budget Allocations Based on Proposals by The
National Government

Using the same scale as Q.7 above, how satisfied are you with the justifications that the
county governments provide when they make budget choices?
Some People proposed that the allocation for next year to
the ten sectors be as follows: Now that you know, would
you insert changes in the allocations you have proposed
Total Yes No Don't Know
Somewhat satisfied 30.6% 39.7% 39.2% 39.2%
Dissatisfied 43.9% 35.8% 42.8% 42.8%
Very dissatisfied 11.6% 12.5% 13.3% 13.3%
Satisfied 12.5% 11.0% 2.6% 2.6%
Very Satisfied 1.4% 1.0% 2.1% 2.1%
Satisfaction with the County Governments’ Justifications for Budget Allocation Choices Against
Respondents’ Decisions to Change Initial Proposed Budget Allocations Based on Proposals by “Some
People”

Using the same scale as Q.7 above, how satisfied are you with the justifications that the
county governments provide when they make budget choices?
The National Government has proposed that the allocation for
next year to the ten sectors be as follows: Now that you know,
would you insert changes in the allocations you have proposed
Total Yes No Don't Know
Somewhat satisfied 35.7% 39.1% 24.8% 39.2%
Dissatisfied 33.9% 34.7% 42.4% 42.8%
Very dissatisfied 16.2% 11.1% 22.2% 13.3%
Satisfied 12.6% 13.2% 9.6% 2.6%
Very Satisfied 1.7% 1.9% 1.0% 2.1%
Satisfaction with the County Governments’ Justifications for Budget Allocation Choices Against
Respondents’ Decisions to Change Initial Proposed Budget Allocations Based on Proposals by The
National Government

ANNEX II – DIFFERNCES IN
MEANS FOR CHANGED
ANSWERS TO SECTOR
QUESTIONS

Sector
Mean 1: What
Respondents
Believed to be
the Share per
Sector Initially
Mean 2:
Respondents’
Changed
Answers
Mean
Difference(Me
an 1 and 2 )
Actual
Allocations
Variations
from Mean
1Based on
Actual
Allocations
Variations
from Mean 2
Based on
Actual
Allocations
Education 14.7 15 0.3 23 8.3 8
Health 15 15 0 4 -11 -11
Agriculture, Rural and
Urban Development: 14.1 14 -0.1 4 -10.1 -10
Energy, Infrastructure and
ICT 9.7 11 1.3 24 14.3 13
National Security 10 10 0 8 -2 -2
Environmental Protection,
Water and Natural
Resources
8.5 9 0.5 5 -3.5 -4
General Economic and
Commercial Affairs 8.3 7 -1.3 1 -7.3 -6
Public Administration &
International Relations 6.8 7 0.2 18 11.2 11
Governance, Justice, Law
and Order 6.6 7 0.4 11 4.4 4
Social Protection, Culture
and Recreation 6.2 6 -0.2 2 -4.2 -4
What Respondents Believed to be the Share of The Total (100%) per Sector for Purposes of Budgeting
Against Respondents’ Decisions to Change Initial Proposed Budget Allocations Based on Proposals by
“Some People”
N=65 (N) indicates the number of respondents who were willing to make changes
to their initial proposed budget allocations.

Sector
Mean 1: What
Respondents
Believed to be
the Share per
Sector Initially
Mean 2:
Respondents’
Changed
Answers on
Share per
Sector
Mean
Difference(Me
an 1 and 2 )
Actual
Allocations
Variations
from Mean
1Based on
Actual
Allocations
Variations
from Mean 2
Based on
Actual
Allocations
Education 14.4 16 1.6 23 8.6 7
Health 14.2 15 0.8 4 -10.2 -11
Agriculture, Rural and
Urban Development: 12.6 14 1.4 4 -8.6 -10
Energy, Infrastructure
and ICT 10.9 12 1.1 24 13.1 12
National Security 9.4 10 0.6 8 -1.4 -2
Environmental
Protection, Water and
Natural Resources
8.6 8 -0.6 5 -3.6 -3
General Economic and
Commercial Affairs 8.1 7 -1.1 1 -7.1 -6
Public Administration &
International Relations 7.9 7 -0.9 18 10.1 11
Governance, Justice,
Law and Order 7 7 0 11 4 4
Social Protection,
Culture and Recreation 6.9 5 -1.9 2 -4.9 -3
What Respondents Believed to be the Share of The Total (100%) per Sector for Purposes of Budgeting
Against Respondents’ Decisions to Change Initial Proposed Budget Allocations Based on Proposals by
the National Government
N=72 (N) indicates the number of respondents who were willing to make changes
to their initial proposed budget allocations.
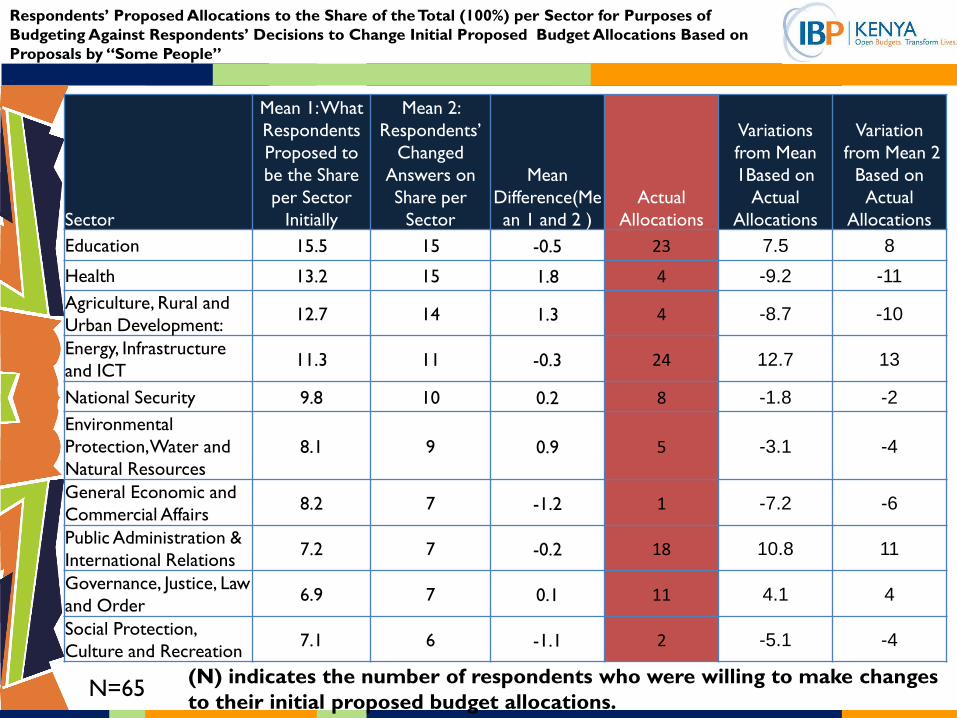
Sector
Mean 1: What
Respondents
Proposed to
be the Share
per Sector
Initially
Mean 2:
Respondents’
Changed
Answers on
Share per
Sector
Mean
Difference(Me
an 1 and 2 )
Actual
Allocations
Variations
from Mean
1Based on
Actual
Allocations
Variation
from Mean 2
Based on
Actual
Allocations
Education 15.5 15 -0.5 23 7.5 8
Health 13.2 15 1.8 4 -9.2 -11
Agriculture, Rural and
Urban Development: 12.7 14 1.3 4 -8.7 -10
Energy, Infrastructure
and ICT 11.3 11 -0.3 24 12.7 13
National Security 9.8 10 0.2 8 -1.8 -2
Environmental
Protection, Water and
Natural Resources
8.1 9 0.9 5 -3.1 -4
General Economic and
Commercial Affairs 8.2 7 -1.2 1 -7.2 -6
Public Administration &
International Relations 7.2 7 -0.2 18 10.8 11
Governance, Justice, Law
and Order 6.9 7 0.1 11 4.1 4
Social Protection,
Culture and Recreation 7.1 6 -1.1 2 -5.1 -4
Respondents’ Proposed Allocations to the Share of the Total (100%) per Sector for Purposes of
Budgeting Against Respondents’ Decisions to Change Initial Proposed Budget Allocations Based on
Proposals by “Some People”
N=65 (N) indicates the number of respondents who were willing to make changes
to their initial proposed budget allocations.

Sector
Mean 1: What
Respondents
Proposed to
be the Share
per Sector
Initially
Mean 2:
Respondents’
Changed
Answers on
Share per
Sector
Mean
Difference(Me
an 1 and 2 )
Actual
Allocations
Variations
from Mean
1Based on
Actual
Allocations
Variations
from Mean 2
Based on
Actual
Allocations
Education 16 16 0 23 7 7
Health 14.9 15 0.1 4 -10.9 -11
Agriculture, Rural and
Urban Development 14.7 14 -0.7 4 -10.7 -10
Energy, Infrastructure
and ICT 10.3 12 1.7 24 13.7 12
National Security 9.3 10 0.7 8 -1.3 -2
Environmental
Protection, Water and
Natural Resources
8.6 8 -0.6 5 -3.6 -3
General Economic and
Commercial Affairs 7.5 7 -0.5 1 -6.5 -6
Public Administration &
International Relations 6.7 7 0.3 18 11.3 11
Governance, Justice, Law
and Order 6.5 7 0.5 11 4.5 4
Social Protection,
Culture and Recreation 5.6 5 -0.6 2 -3.6 -3
Respondents’ Proposed Allocations to the Share of the Total (100%) per Sector for Purposes of
Budgeting Against Respondents’ Decisions to Change Initial Proposed Budget Allocations Based on
Proposals by the National Government
N=72 (N) indicates the number of respondents who were willing to make changes
to their initial proposed budget allocations.
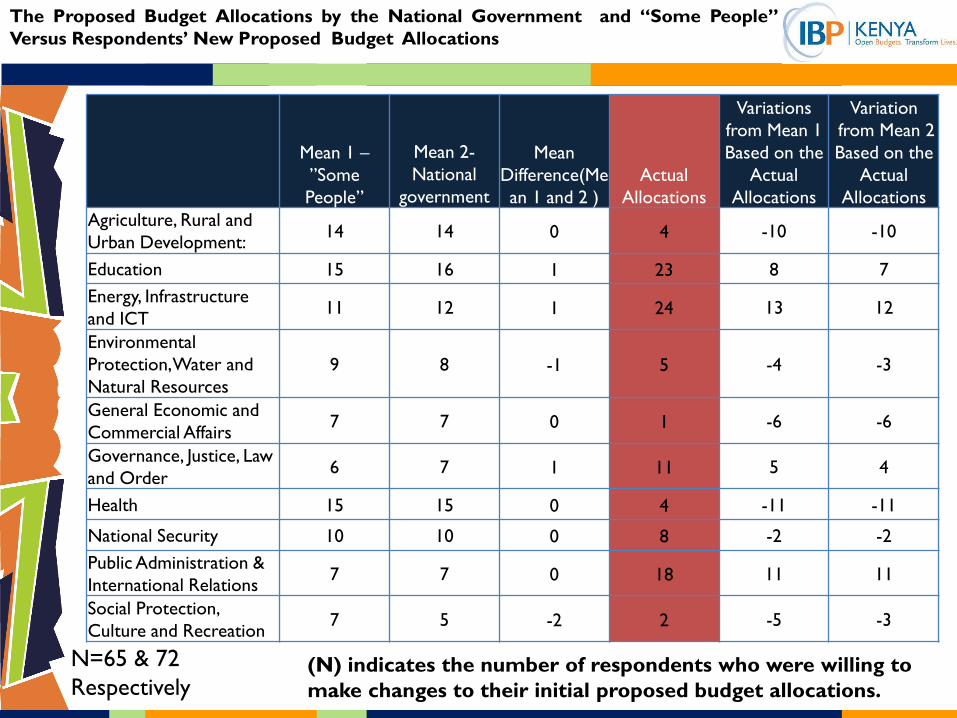
Mean 1 –
”Some
People”
Mean 2-
National
government
Mean
Difference(Me
an 1 and 2 )
Actual
Allocations
Variations
from Mean 1
Based on the
Actual
Allocations
Variation
from Mean 2
Based on the
Actual
Allocations
Agriculture, Rural and
Urban Development: 14 14 0 4 -10 -10
Education 15 16 1 23 8 7
Energy, Infrastructure
and ICT 11 12 1 24 13 12
Environmental
Protection, Water and
Natural Resources
9 8 -1 5 -4 -3
General Economic and
Commercial Affairs 7 7 0 1 -6 -6
Governance, Justice, Law
and Order 6 7 1 11 5 4
Health 15 15 0 4 -11 -11
National Security 10 10 0 8 -2 -2
Public Administration &
International Relations 7 7 0 18 11 11
Social Protection,
Culture and Recreation 7 5 -2 2 -5 -3
The Proposed Budget Allocations by the National Government and “Some People”
Versus Respondents’ New Proposed Budget Allocations
N=65 & 72
Respectively (N) indicates the number of respondents who were willing to
make changes to their initial proposed budget allocations.

The national government is organized into ten sectors for purposes of budgeting. Each sector
contains ministries, agencies, and state corporations. Looking at the ten sectors below, and
assuming that you were in charge of the national budget, determine the share of the total (100%)
that you would give to each sector:
Respondents’ Proposed Allocations to the Share of the Total (100%) per Sector for
Purposes of Budgeting
Actual
Allocation
Mean
1(N=1500)
Mean 2
Pre(N=42)
Mean
Difference(
Mean 2 –
Mean 1)
Mean 3
Post
(N=42)
Mean
difference
(Mean 3 –
mean 1)
Education 23 16.3 15.4 -0.9 16.7 0.4
Health 4 14.8 14.6 -0.2 15.1 0.3
Agriculture, Rural and Urban
Development 4 13.8 13.9 0.1 13.3 -0.5
Energy, Infrastructure and ICT 24 11.2 10.4 -0.8 12.5 1.3
National Security 8 9.7 10.9 1.2 9.8 0.1
Environmental Protection, Water and
Natural Resources 5 8.2 8 -0.2 7.7 -0.5
General Economic and Commercial
Affairs 1 7.4 7.3 -0.1 6.6 -0.8
Public Administration & International
Relations 18 6.5 6.5 0 6.6 0.1
Governance, Justice, Law and Order 11 6.3 7.7 1.4 7.2 0.9
Social Protection, Culture and Recreation 2 5.8 5.5 -0.3 4.5 -1.3
N =1500 which represent s the total number of respondents who participated in the survey.
N = 42 which represent the total number of respondents who participated in the DS.

Now that you have told us what you think the distribution of the budget should be,
what do you believe to be the current share of the budget that is allocated to each of
these sectors by the national government?
What Respondents Believe to be the Actual Share of the Total (100%) per Sector for
Purposes of Budgeting
Actual
Allocation
Mean
1(N=1500)
Mean 2
Pre(N=42)
Mean
Difference(
Mean 2 –
Mean 1)
Mean 3
Post
(N=42)
Mean
difference
(Mean 3 –
mean 1)
Education 23 15.9 14.1 -1.8 18.1 2.2
Health 4 13.7 12.5 -1.2 11 -2.7
Agriculture, Rural and Urban Development 4 12.5 12 -0.5 9.6 -2.9
Energy, Infrastructure and ICT 23 11.8 14.5 2.7 15.2 3.4
National Security 4 9.6 10.4 0.8 10.2 0.6
Environmental Protection, Water and
Natural Resources 4 8.1 7.1 -1 7 -1.1
General Economic and Commercial Affairs 1 7.6 7.1 -0.5 6.4 -1.2
Public Administration & International
Relations 18 7.1 8.6 1.5 9.9 2.8
Governance, Justice, Law and Order 11 7 8.2 1.2 7.4 0.4
Social Protection, Culture and Recreation 2 6.1 5.6 -0.5 5.5 -0.6
N =1500 which represent s the total number of respondents who participated in the survey.
N = 42 which represent the total number of respondents who participated in the DS.

DEMOGRAPHICS

Demographics (1/2)
25.0%
20.2%
18.0%
13.2%
7.7%
5.3%
3.9%
3.4%
3.3%
0% 5% 10% 15% 20% 25% 30%
26-30
31-35
21-25
36-40
41- 45
46-50
18-20
56 +
51-55
AGE
36.2%
28.5%
22.3%
11.6%
1.4%
0% 10% 20% 30% 40%
Secondary
College
Primary
University
Post graduate
EDUCATION LEVEL
60.3%
33.9%
2.9% 2.8%
0%
10%
20%
30%
40%
50%
60%
70%
Married Single Divorced/Separated
Widowed
MARITAL
39.5% 36.6%
23.9%
0%
5%
10%
15%
20%
25%
30%
35%
40%
45%
Un-employed Self-employed Employed
EMPLOYMENT

Demographics (2/2)
Protestant, 61.6%
Catholic, 26.7%
Muslim, 11.6%
Hindu, 0.1%
RELIGION
Protestant
56.4%
43.6%
GENDER
Male Female
58.9%
41.1%
LOCATION
Rural Urban
