attitudes of adults towards people with experience of ... lmlm report mhs... · behaviour scale,...
TRANSCRIPT

Attitudes of adults towards people with experience of
mental distress
Results from the 2015 New Zealand
Mental Health Monitor
June 2017

ISBN: [978-0-478-44907-5]
Prepared for the Health Promotion Agency by:
Zoe Deverick, Dr Lynne Russell (Kāi Tahu, Ngāti Kahungunu, Kāti Māmoe, Rangitāne, Ngāti
Porou), and Sarah Hudson (HPA).
Citation: Citation: Deverick., Z, Russell., L., Hudson., S (2017). Attitudes of adults towards people
with experience of mental distress: Results from the 2015 New Zealand Mental Health Monitor.
Wellington: Health Promotion Agency.
This document is available at: http://www.hpa.org.nz/research-library/research-publications.
Health Promotion Agency
PO Box 2142
Wellington 6140
New Zealand
www.hpa.org.nz
June 2017

717221v6
ACKNOWLEDGEMENTS 4
COPYRIGHT 4
EXECUTIVE SUMMARY 5
Introduction 5
Method 5
Results 5
Conclusion 6
INTRODUCTION 7
Background 7
The current report 8
METHOD 10
Sampling frame and recruitment 10
Data collection 10
Respondents 11
Questionnaire 11
Data analysis 13
RESULTS 16
Mental Health Knowledge Scale 16
Reported and Intended Behaviour 18
Community Attitudes Towards Mental Illness 20
RESULTS SUMMARY 23
DISCUSSION 24
Strengths and limitations 24
Conclusion 26
REFERENCES 27
APPENDIX A: MAKS SCORING 29
APPENDIX B: RIBS SCORING 30
APPENDIX C: CAMI SCORING 31
ACKNOWLEDGEMENTS
The Health Promotion Agency (HPA) would like to acknowledge Hayley Guiney, Judy Li, Marge
Jackson, Jude West, Dr Karen McBride-Henry and Dr Holly Trowland (HPA) for their contribution
to, or peer review of, this report. Thanks also to Dr Sarah Gordon (University of Otago) for her
service user expert review of this report.
This report analyses data from the 2015 New Zealand Mental Health monitor (NZMHM), which is
funded by the Ministry of Health. HPA would like to acknowledge National Research Bureau Ltd for
conducting the fieldwork for the survey, the respondents for their time and information, and the
scholars who provided permission to use the psychometrically validated scales used in this report.
COPYRIGHT
The copyright owner of this publication is HPA. HPA permits the reproduction of material from this
publication without prior notification, provided that fair representation is made of the material and
HPA is acknowledged as the source.

5
EXECUTIVE SUMMARY
INTRODUCTION
This report provides an initial overview of the current self-reported knowledge, attitudes and
intended behaviour of adults in New Zealand towards people with experience of mental distress.
The report uses data from the 2015 New Zealand Mental Health Monitor (NZMHM), a nationally
representative monitor managed by the Health Promotion Agency (HPA). As 2015 was the first
time this monitor was in the field it provides a baseline from which to compare future monitors.
METHOD
Survey design
The 2015 NZMHM collected information from 1,377 adults aged 15 years and older nationwide in
their homes using Computer Assisted Personal Interviewing (CAPI). The response rate was 59%.
Measures
Socio-demographic data were collected, as well as respondents’ answers to questions from three
psychometrically validated scales (Mental Health Knowledge Scale, Reported and Intended
Behaviour Scale, and Community Attitudes Towards the Mentally Ill Scale) designed to measure
self-reported knowledge, attitudes and intended behaviour towards people with experience of
mental distress, were collected.
Data analysis
Analyses assessed responses and overall scores for each of the scales to provide population level
estimates of self-reported knowledge, attitudes and intended behaviour towards people with
experience of mental distress. Responses were then compared by respondents’ socio-
demographic characteristics to test for potential differences between different population groups.
RESULTS
Across scales, most respondents gave answers indicating positive views of people with experience
of mental distress; few gave answers indicating strong negative views.
Examining overall scores on each of the psychometrically validated scales by respondents’ socio-
demographic characteristics, indicated that:
there were no significant differences between age groups other than those aged 65 years
and older expressing more negative views compared with those aged 25-64 years
those identifying as Pacific peoples or Asian expressed more negative views compared
with those identifying as European/Other.
Examining overall scores on each of the psychometrically validated scales by whether or not
respondents knew someone (other than themselves) who had been diagnosed with a mental
illness, indicated that:
6
adults who did not know someone with a mental illness were significantly more likely to
express more negative views of those who experience mental distress than adults who
knew someone with a mental illness.
Overall scores also indicated that there were some effects of socioeconomic deprivation (as
indicated by the New Zealand Deprivation Index):
adults living in areas with high levels of deprivation were significantly more likely to
express negative views towards those who experience mental distress than those adults
living in areas with low and medium levels of deprivation.
All statistically significant differences were numerically small but the patterns were consistent
across each of the three scales.
CONCLUSION
The current findings provide insight into the general population’s self-reported knowledge, attitudes
and intended behaviour towards people with experience of mental distress. They also highlight
specific groups that may express more negative views of those who experience mental distress.
These findings are consistent with findings from reviews of initiatives tracking mental health stigma
and discrimination attitudes both nationally (Fearn & Wyllie, 2005) and internationally (Henderson
et al., 2016; Hansson, Stjernswärd & Svensson, 2016). However, they do not provide insight into
the extent to which those who experience mental distress are discriminated against or experience
discrimination (related to their mental health). They should be considered alongside other findings
from studies of social inclusion and exclusion as they relate to discrimination – especially
investigations undertaken from the subjective and cross-cultural perspectives of people with lived
experience of mental distress (Gordon, Davey, Waa, Tiatia & Waaka, 2016).

7
INTRODUCTION
BACKGROUND
Stigma is said to comprise the domains of knowledge, attitudes and behaviour (Thornicroft, Rose,
Kassam & Sartorius, 2007):
‘Knowledge’ referring to people’s level of general knowledge regarding the prevalence
and experience of mental distress
‘Attitudes’ constituting negative thoughts and emotions towards people with experience of
mental distress, such as fear or mistrust
‘Behaviour’ referring to discriminatory actions people take, such as rejecting or avoiding
interactions with people experiencing mental distress (Evans-Lacko et al, 2011).
Typically, research on stigma has tended to focus on the measurement of knowledge and attitudes
(Henderson et al, 2016). There is a lack of evidence, however, to support the notion that solely
increasing knowledge of mental distress results in decreased stigma or discrimination (Corrigan &
Shapiro, 2010). An alternative conceptualisation to the idea of stigma comprising the domain of
knowledge is that it refers to stereotyping and negative beliefs about the stereotyped group. Mental
health stigma occurs when a person is labelled by their illness and is viewed negatively as part of a
stereotyped group (Government of Western Australia Mental Health Commission, n.d.). These
negative attitudes create prejudice (agreement with the stereotypes) leading to negative actions.
Discrimination is the behavioural response to this prejudice – unfair treatment resulting in social
exclusion (eg, reduced access to housing, healthcare, and employment opportunities) (Corrigan &
Watson, 2002).
The discrimination associated with the experience of mental distress is powerfully detrimental to
those with lived experience. The internalisation of stigmatising beliefs, attitudes and behaviour is
associated with more severe symptoms, lower self-esteem, lower self-efficacy and lower recovery
orientation (Drapalski et al, 2013). The social stigma can also increase socio-economic
disadvantage, lower social support, reduce wellbeing (Stuart, 2006; Thornicroft et al, 2007) and
make it harder to recover (UK Mental Health Foundation, n.d.). It impacts negatively on
employment, income and healthcare costs, leading to adverse economic effects for people with
experience of mental distress (Sharac, McCrone, Clement & Thornicroft, 2010).
Discrimination can lead to disadvantages in all areas of life, particularly in relationships, education,
work, housing and health. Some authors have argued that the effects of stigma, such as
discrimination and social rejection, may cause more harm to people than the experience of mental
distress itself (Thornicroft et al, 2007).
Efforts to counter stigma and discrimination associated with mental distress have seen an increase
in anti-stigma and anti-discrimination initiatives internationally (Gordon et al, 2016). Research has
identified improvements in stigma-related knowledge and mental health literacy in recent years,
suggesting positive effects of these campaigns (Henderson et al, 2016; Hansson et al, 2016). An
increased research focus on social exclusion and its relationship to stigma and discrimination
8
further expands mental health understandings of knowledge, attitudes and intended behaviour of
people towards those with experience of mental distress. Such research variously describe stigma
and discrimination as core domains of exclusion, a driver of exclusion within the domains of
employment and access to services and social networks, and a risk factor for social exclusion in
terms of participation (Gordon et al, 2016).
THE CURRENT REPORT
The Health Promotion Agency (HPA) administers a series of monitors designed to capture, track
and monitor the health and wellbeing of New Zealand adults and their knowledge about, and
attitudes and behaviours towards, key health areas. The New Zealand Mental Health monitor
(NZMHM) is one of these monitors, designed to regularly assess the attitudes towards, and
experiences relating to, mental health issues, to measure the levels of discrimination surrounding
mental distress within our communities.
This report provides an initial overview of the current self-reported views of adults in New Zealand
towards people with experience of mental distress using data from the 2015 NZMHM. Results are
presented from three psychometrically validated scales designed to measure self-reported
knowledge, attitudes and intended behaviour towards those who experience mental distress:
The Mental Health Knowledge Scale (MAKS)
The Reported and Intended Behaviour Scale (RIBS)
A subset of the Community Attitudes towards the Mentally Ill Scale (CAMI).
Terminology
The scales used in the 2015 NZMHM refer to ‘mentally ill’ and ‘people with mental illness/es’.
These are the most frequently used terms used to describe mental health challenges in the
literature. However, this report intentionally uses the terms ‘mental distress’, ‘people with
experience of mental distress’ and ‘those who experience mental distress’ to reflect the preference
of those with lived experience who promote mental distress as a more accurate reflection of that
experience.1
Historically, ‘mental illness’ has been framed within a medical model that has pathologised lived
experience. This has been found, however, to increase the desire for social distance (Corrigan,
Edwards, Green, Diwan & Penn, 2001), effectively exacerbating the stigmatisation of those with
lived experience, and countering the efforts of HPA programmes such as ‘Like Minds, Like Mine.’
A key component of recovery from mental distress involves minimising the impact through the way
it is framed (Slade, 2013). By reframing mental illness from a medical event to a more holistic and
human experience of distress, discrimination is decreased. A primary aim of replacing the term
‘mental illness’ with ‘mental distress’ then, is to be as non-stigmatising as possible by focussing on
the experience of distress rather than the diagnosis of an illness.
1 The exception is when reference is made to a “diagnosis of mental illness”.

9
Although the preferred use of ‘mental distress’ as a descriptor of ‘mental illness’ is not specific to
New Zealand (Evans-Lacko et al, 2011), it has been spoken about and used within the mental
health sector for several years now, with the move to focus on experience being widely accepted
and used for at least a decade. ‘Mental distress’ is accordingly now commonly used by both
government agencies and non-government organisations, such as Police and the Mental Health
Foundation.
There is also increasing opposition from those with experience of mental distress to use of the term
‘stigma’ which is regarded as a mark of shame or disgrace and, therefore, pertaining to the
individual as opposed to society. Preference for the single term ‘discrimination’ to be used to
encompass concepts of both discrimination and stigma is not yet reflected through mental health
promotion campaigns or academic literature, however. The Like Minds, Like Mine National Plan
2014-2019 (Ministry of Health/Manatū Hauora & Health Promotion Agency, 2014), for example,
maintains its original focus on reducing stigma and discrimination for people with experience of
mental illness and continues to articulate the programme in this way. Nevertheless, in recognition
and support of expert advice from those with experience of mental distress, where possible the
term ‘discrimination’ is used in this report to describe the phenomenon.
Report structure
This report includes five sections:
1. Method: Briefly describes the data collection procedures for the 2015 NZMHM, before
detailing the specific data analysis procedures used for this report
2. Results: Presents the overall and socio-demographic group specific results for each of
the psychometrically-validated scales used to measure self-reported knowledge, attitudes
and intended behaviour towards people with experience of mental distress
3. Results Summary: Collates the findings presented in the Results
4. Discussion: Includes a brief analysis of the findings and their potential utility
5. Appendices: Details the specific questions and scoring procedures for each of the scales.
Another report, Indicators of mental health and overall wellbeing of adults in New Zealand:
Findings from the 2015 New Zealand Mental Health Monitor, provides a high-level summary of
mental health indicators and a snapshot of the overall wellbeing of New Zealand adults.

10
METHOD
The NZMHM is a nationally representative face-to-face survey conducted with people aged 15
years and older in homes around New Zealand. Key aspects of the method for the 2015 NZMHM
are summarised below. Additional details can be found in a separate report titled 2015 New
Zealand Mental Health Monitor: Methodology Report2 published on the HPA’s website (National
Research Bureau, 2015). Ethical approval for the NZMHM was obtained from the New Zealand
Ethics Committee.
SAMPLING FRAME AND RECRUITMENT
Respondents were recruited using an area-based frame made up of the 2013 New Zealand
Census meshblocks, the smallest geographical measure used by Statistics New
Zealand/Tatauranga Aotearoa. The selection process was stratified, whereby a sample of
meshblocks was selected first, then a sample of dwellings within each selected meshblock, and
finally one eligible adult (aged 15 years or older) from each selected dwelling. Selected dwellings
or households were visited personally by interviewers to arrange suitable appointment times with
eligible respondents, and respondents could only be interviewed at their own usual residence. That
is, if they were visiting a household that was selected for inclusion in the 2015 NZMHM they could
not be interviewed as part of that household. This process ensured that people did not have a
chance of being counted more than once.
While the sample frame was designed to be nationally representative, oversampling of some
population groups (15 to 24-year-olds, Māori, and Pacific peoples) was used to provide sufficient
sample sizes for analyses with those sub groups. Weighting was later applied to ensure the data
were nationally representative.
DATA COLLECTION
Face-to-face interviews for the 2015 NZMHM were conducted by National Research Bureau
(NRB), between 25 July and 27 September 2015. Data were collected in people’s homes using
Computer Assisted Personal Interviewing (CAPI).
Data were collected from 1,377 adults aged 15 years or older nationwide. The response rate of
59% reflects the proportion of people interviewed from those who were selected into the sample.
Although a higher response rate would suggest the survey results were more representative of the
adult population, the response rate was considered sufficient to draw reliable findings. Response
rates are affected positively and negatively by many factors, including self-selection bias. It is
possible respondents who have more favourable attitudes towards mental distress were more
willing to participate than those who do not, but it is unknown to what extent such biases may have
affected the 2015 NZMHM.
2 http://www.hpa.org.nz/sites/default/files/2015-MHS-Methodology-Report.pdf

11
RESPONDENTS
The raw and weighted sample sizes by socio-demographic characteristics of the 1,377
respondents in the 2015 NZMHM are displayed in Table 1.
Table 1: Sample characteristics (sample size, weighted n) (n = 1,377)
Socio-demographic characteristics Sample size Weighted n
Gender
Male 599 659.4
Female 778 717.6
Age group
15-24 334 236.7
25-44 418 441.8
45-64 384 425.4
65+ 241 273.1
Ethnicity (prioritised)
Māori 270 171.1
Pacific 245 73.5
Asian 79 157.8
European/Other 783 974.7
Deprivation status (NZDep2013)*
Low (least deprived) 430 576.9
Moderate 509 523.8
High (most deprived) 437 276.3
Total respondents 1,377 1,377.0
*Based on the New Zealand Deprivation Index
QUESTIONNAIRE
The NZMHM questionnaire was developed by HPA and refined through consultation with
international researchers expert in this type of survey design. NRB also provided feedback on the
suitability of the questions and survey structure.
Questions were presented in English but translators were available if required.3 To assess the
suitability of the questionnaire including its length, and to ensure that questions were
straightforward and unproblematic for respondents, a pilot survey was first conducted with 60
3 Nine respondents in the 2015 NZMHS completed the survey with the help of a translator.

12
respondents. Results from the pilot survey demonstrated that the questionnaire was performing to
task, and only minor changes in wording were made to the full-scale survey.
The final 2015 NZMHM questionnaire contained both socio-demographic questions, including age,
gender, and ethnic group membership, and a range of other questions designed to assess mental
health-related knowledge, experiences attitudes and behaviours. This report presents results
relating to answers from three psychometrically-validated scales designed to measure self-
reported knowledge, attitudes and intended behaviour towards people with experience of mental
distress:
Mental Health Knowledge Scale (MAKS) (Evans-Lacko et al, 2010).
Reported and Intended Behaviour Scale (RIBS) (Evans-Lacko et al, 2011).
Community Attitudes towards Mental Illness Scale (CAMI) (Taylor & Dear, 1981).
These same scales have previously been used internationally to evaluate the impact of
interventions to reduce stigma related to mental distress among the general population, including
in the United Kingdom and Sweden (Henderson et al., 2016; Evans-Lacko, Henderson &
Thornicroft, 2013; Hansson et al, 2016).
Mental Health Knowledge Scale (MAKS)
The Mental Health Knowledge Scale (MAKS) (Evans-Lacko et al, 2010) is designed to assess
mental health knowledge. The scale is comprised of six questions about stigma-related mental
health knowledge, and six questions about knowledge of mental illness conditions. The analyses in
this report only focuses on the six questions in the first section of the original MAKS, pertinent to
stigma-related mental health knowledge.
The specific wording of each item, response options, and associated scores are presented in
Appendix A. The final MAKS score is found by adding the scores of each of the six questions.
Possible MAKS scores range from 6 to 30, with higher scores indicating greater self-reported
mental health knowledge, cautiously associated with more positive views of people with experience
of mental distress (Evans-Lacko et al, 2010; Corrigan & Shapiro, 2010). International research
reports that “changes in attitudes and behaviour are not dependent upon and may occur prior to
changes in knowledge” (Henderson et al, 2016:29).
Reported and Intended Behaviour Scale (RIBS)
The Reported and Intended Behaviour Scale (RIBS) (Evans-Lacko et al, 2011) is designed to
assess past, current, and intended behaviours as they relate to mental distress and discrimination.
It comprises two subscales:
1. the reported behaviour subscale, which assesses past or present interaction with people
with experience of mental distress
2. the intended behaviour subscale, which assesses intentions to interact with people with
experience of mental distress.
The reported behaviour subscale is designed to assess people’s past and present

13
behaviours and behavioural intentions towards those with experience of mental distress. The
intended behaviour subscale is designed to assess the level of intended future contact with people
with experiences of mental distress. Because individuals may or may not have had the opportunity
to engage in the behaviours of the reported behaviour subscale, these data are used to assess
prevalence only and are not included in the final RIBS score. The final RIBS score is the sum of
the score of each of the four questions in the intended behaviour subscale.
The specific wording of each item, response options, and associated scores are presented in
Appendix B. Possible RIBS scores range from 4 to 20, with higher scores being associated with
greater intention to interact with people with mental distress.
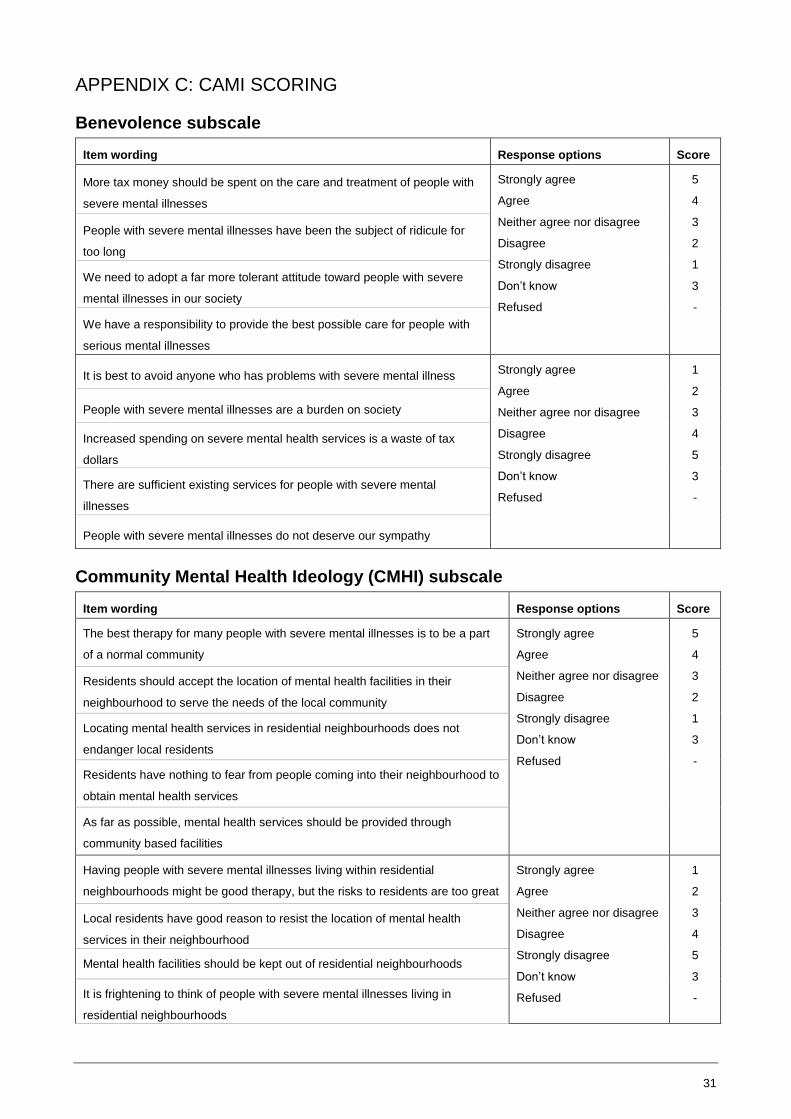
Community Attitudes towards the Mentally Ill Scale (CAMI)
The Community Attitudes towards the Mentally Ill Scale (CAMI) (Taylor & Dear, 1981) is designed
to assess attitudes towards people with mental distress in the community, rather than within mental
health services. The CAMI is made up of four subscales that measure attitudes of authoritarianism,
benevolence, social restrictiveness, and community mental health ideology. The full CAMI is
lengthy, so only two of these subscales were included in the 2015 NZMHM:
1. the benevolence subscale, which assesses attitudes of kindness towards people
experiencing mental distress
2. the community mental health ideology (CMHI) subscale, which assesses attitudes
relating to the inclusion of people experiencing mental distress in the community.
These subscales were chosen because they were deemed the most relevant for contemporary
New Zealand society.
As the language in the mental health sector has changed significantly since the CAMI was
developed, the wording of the questions was adjusted slightly to better reflect current terminology.4
The wording of each item, response options, and associated scores for the benevolence and CMHI
subscales are presented in Appendix C.
The score for each of the two subscales was calculated separately by adding the score from each
question in the subscale. Subscale scores for the benevolence subscale ranged from 9 to 45
(following the exclusion of one item due to validity concerns5), and in the CMHI from 10 to 50.
Higher scores were associated with greater benevolence, and less stigmatising community mental
health ideology, respectively.
DATA ANALYSIS
Weighting
Data were weighted so that oversampled populations (15 to 24 year olds, Māori, and Pacific
peoples) were statistically proportionate to the general population aged 15 years and older.
4 The term “the mentally ill” was replaced by “people with severe mental illness” 5 “Our mental hospitals seem more like prisons than like places where people with severe mental illnesses can be cared for” was removed due to validity concerns, owing to changes in mental health services since the scale’s inception.
14
Analysis approach
The analyses included in this report were designed to give an initial overview of the current
knowledge, attitudes and intended behaviours towards people with experience of mental distress.
They are not intended to provide an exhaustive examination of all issues relevant to mental
distress and discrimination in New Zealand.
Basic response patterns
To understand the basic pattern of responses for each of the items in the MAKS and RIBS,
weighted proportions and 95% confidence intervals (CI) were calculated. For items that used a 5-
point agreement scale:
Strongly agree and agree were combined to indicate total agreement
Strongly disagree and disagree were combined to indicate total disagreement
Neither agree nor disagree and don’t know were combined to indicate neutral responses.
Basic response patterns for the CAMI are not reported as each item on the CAMI is not designed
to be informative on its own. Only the total score on each sub scale is presented.
Overall scores
To understand overall responses relating to a particular scale (as opposed to the responses on a
specific question), scores for each of the scales were calculated using the procedures described in
the Questionnaire section and Appendices A, B and C of this report. Internal reliability coefficients
(Cronbach’s alpha) were used to examine the consistency of item scores on each scale.
To understand the overall distribution of responses for each scale, scores were grouped into four
categories and the percentage of respondents in each category examined. The categories were
based on the average score for each item within a scale. The categories are:
Low: average score of 1 to 2, indicating that the respondent expressed only or mostly
negative views of those who experience mental distress
Medium-low: average score of 2.1 to 3, indicating that the respondent expressed a range
of views that are overall negative.
Medium-high: average score of 3.1 to 3.9, indicating that the respondent expressed a
range of views that overall are positive.
High: average score of 4 to 5, indicating that the respondent expressed only or mostly
positive views.
Sub group differences in scores
Univariate linear regression analyses were conducted to test whether scores on a particular scale
varied by socio-demographic characteristics or by knowing someone with mental illness. The
specific variables examined in each regression were:
age (15-24 years, 25-44 years, 45-64 years, 65 years and older)
gender (female, male)

15
ethnicity (prioritised in the order: Māori, Pacific peoples, Asian, European/Other)
socioeconomic deprivation (as indicated by the New Zealand Deprivation Index where
low refers to levels 1-3, medium to levels 4-7, and high to levels 8-10)
whether or not the person knew someone (other than themselves) who had been
diagnosed with a mental illness.
In this report, only significant differences at the p < .05 level are identified.

16
RESULTS
MENTAL HEALTH KNOWLEDGE SCALE
Basic response patterns
The basic pattern of responses to each of the items on Part A of the MAKS is displayed in Table 2.
Table 2. Percentage of responses on MAKS items relating to knowledge around mental distress in
the areas of help seeking, recognition, support, employment, treatment, and recovery
Agree %
(95% CI)
Neutral %
(95% CI)
Disagree %
(95% CI)
Psychotherapy, like counselling or talking therapy, can be an
effective treatment for people with mental illnesses 84 (78, 89) 15 (9, 20) 1 (1, 2)
If a friend had a mental illness, I know what advice to give them
to get professional help 72 (68, 77) 15 (11, 18) 13 (10, 16)
Most people with mental illnesses want to have paid
employment 67 (62, 72) 25 (21, 29) 8 (6, 10)
Medication can be an effective treatment for people with mental
illnesses 65 (61, 70) 27 (22, 32) 8 (5, 10)
People with severe mental illnesses can fully recover 54 (49, 58) 35 (30, 40) 11 (8, 14)
Most people with mental illnesses go to a healthcare
professional to get help 36 (32, 40) 34 (29, 38) 30 (26, 35)
Note: The shading indicates the response associated with higher mental health knowledge (e.g., agreement
with the statement ‘most people with mental illnesses want to have paid employment’)
CI = Confidence interval
Overall MAKS scores
Out of a possible score of 30, and a minimum of 6 the mean MAKS score was 21.6 (range: 9 to
29). Cronbach’s alpha (α = .43) indicated that MAKS items had a low level of internal consistency.
This fits with the expectations of the developers of the scale, given that respondents who have
good knowledge relating to one area may not necessarily have good knowledge relating to other
areas (Evans-Lacko et al, 2010).
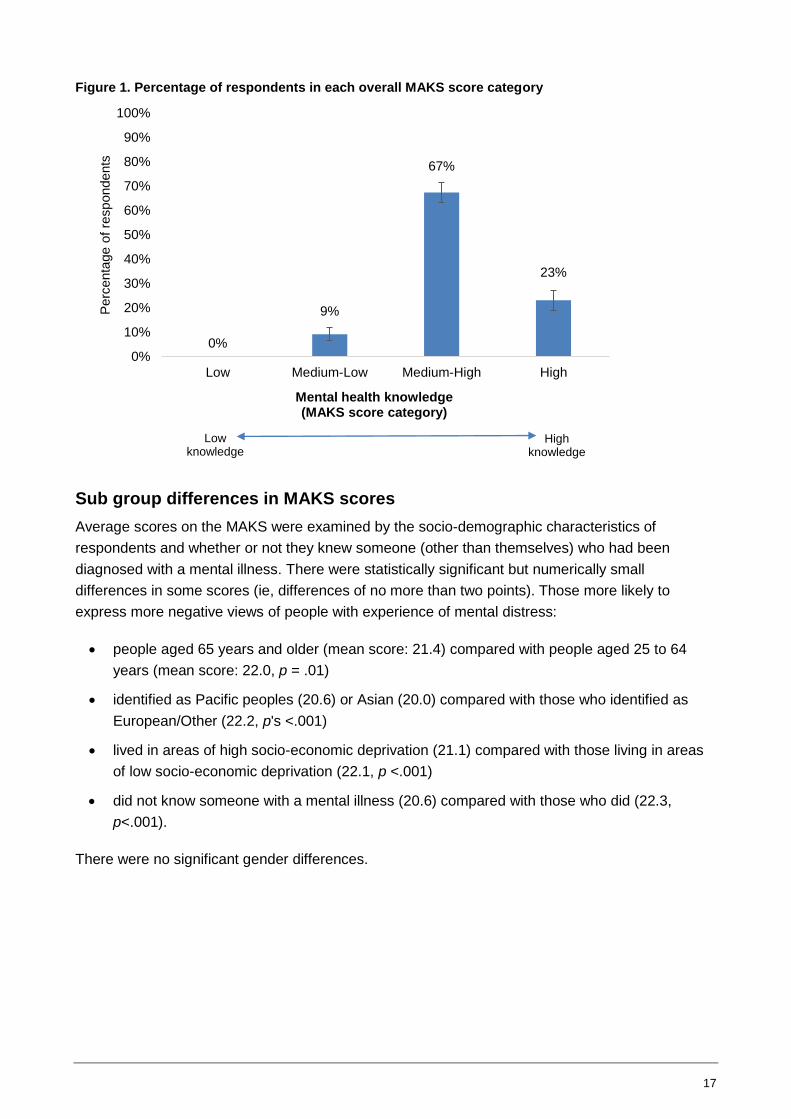
The percentage of adults in each score category is presented in Figure 1. The majority of
respondents (90%) had high (23%) or medium-high (67%) levels of mental health knowledge.
17
Figure 1. Percentage of respondents in each overall MAKS score category
Sub group differences in MAKS scores
Average scores on the MAKS were examined by the socio-demographic characteristics of
respondents and whether or not they knew someone (other than themselves) who had been
diagnosed with a mental illness. There were statistically significant but numerically small
differences in some scores (ie, differences of no more than two points). Those more likely to
express more negative views of people with experience of mental distress:
people aged 65 years and older (mean score: 21.4) compared with people aged 25 to 64
years (mean score: 22.0, p = .01)
identified as Pacific peoples (20.6) or Asian (20.0) compared with those who identified as
European/Other (22.2, p's <.001)
lived in areas of high socio-economic deprivation (21.1) compared with those living in areas
of low socio-economic deprivation (22.1, p <.001)
did not know someone with a mental illness (20.6) compared with those who did (22.3,
p<.001).
There were no significant gender differences.
0%
9%
67%
23%
0%
10%
20%
30%
40%
50%
60%
70%
80%
90%
100%
Low Medium-Low Medium-High High
Perc
enta
ge o
f re
spondents
Mental health knowledge (MAKS score category)
Low knowledge
High knowledge

18
REPORTED AND INTENDED BEHAVIOUR
Basic response patterns
Past and current behaviour
Responses to each of the items from the reported behaviour subscale on past and current
interactions with people with experience of mental distress are presented in Table 3. This subscale
is used to provide context and is not part of the RIBS final score.
Table 3. Percentage of respondents who indicated past or current interaction with people who
experience mental distress (said “yes”)
Yes %
(95% CI)
Currently or ever lived with someone with a mental illness? 37 (33, 42)
Currently or ever worked with someone with a mental health problem? 49 (43, 54)
Currently or ever had a neighbour with a mental health problem? 25 (21, 29)
Currently or ever had a close friend with a mental health problem? 55 (50, 61)
Intended behaviour
Responses to each of the items on the intended behaviour subscale are presented in Table 4.
These indicate that the likelihood of agreeing with a particular item decreased as social distance
decreased. For example, around three-quarters (77%) of adults agreed they would be willing to live
nearby to someone with a mental illness, but only around half (53%) agreed that they would be
willing to live with someone with a mental illness.
Table 4. Intended behaviour of respondents towards people experiencing mental distress
Agree %
(95% CI)
Neutral %
(95% CI)
Disagree %
(95% CI)
Live with someone with a mental illness 53 (48, 59) 27 (22, 32) 19 (16, 22)
Work with someone with a mental illness 71 (67, 75) 18 (15, 22) 10 (7, 13)
Live nearby to someone with a mental illness 77 (73, 81) 16 (12, 19) 7 (5, 9)
Continue a relationship with a friend who developed a
mental illness 90 (88, 93) 7 (4, 10) 3 (1, 4)
Overall RIBS Scores
Higher RIBS scores indicate greater willingness to interact with people with experience of mental
distress, which is associated with lower discrimination. The mean score was 15.5 (range: 4 to 20)
out of a possible range of 4 to 20. Cronbach’s alpha (α = .84) indicated that these RIBS items were
internally consistent.
The percentage of respondents in each RIBS score category is presented in Figure 2. These
indicate that the majority of adults had high (55%) or medium-high (30%) intention to interact with
those who experience mental distress.

19
Figure 2. Percentage of respondents in each overall RIBS score category
Sub-group differences in RIBS scores
Average scores on the RIBS were examined by the socio-demographic characteristics of
respondents and whether or not they knew someone (other than themselves) who had been
diagnosed with a mental illness. There were statistically significant but numerically small
differences in some scores (ie, differences of no more than 2.6 points). Those more likely to
express more negative views of people with experience of mental distress:
were people aged 65 years and older (mean score: 14.7) compared with people aged 25 to
44 years (mean score: 15.9, p = .03).
identified as Pacific peoples (14.2) or Asian (13.3) compared with those who identified as
European/Other (15.9, p's <.001).
did not know someone with a mental illness (14.1) compared with those who did (16.1,
p <.001).
There were no significant differences in regards to gender or socio-economic deprivation.
2%
13%
30%
55%
0%
10%
20%
30%
40%
50%
60%
70%
80%
90%
100%
Low Medium-Low Medium-High High
Perc
enta
ge o
f re
spondents
Intention to interact (RIBS score category)
Low willingness to
interact
High willingness to
interact
20
COMMUNITY ATTITUDES TOWARDS MENTAL ILLNESS
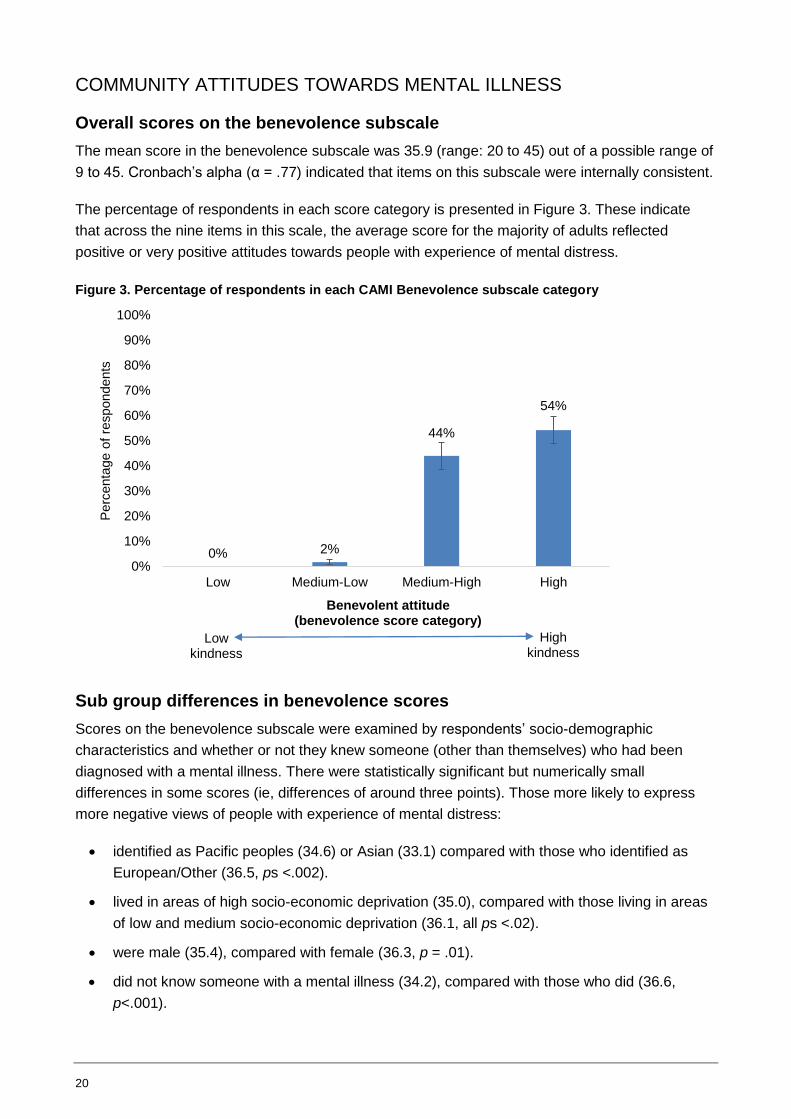
Overall scores on the benevolence subscale
The mean score in the benevolence subscale was 35.9 (range: 20 to 45) out of a possible range of
9 to 45. Cronbach’s alpha (α = .77) indicated that items on this subscale were internally consistent.
The percentage of respondents in each score category is presented in Figure 3. These indicate
that across the nine items in this scale, the average score for the majority of adults reflected
positive or very positive attitudes towards people with experience of mental distress.
Figure 3. Percentage of respondents in each CAMI Benevolence subscale category
Sub group differences in benevolence scores
Scores on the benevolence subscale were examined by respondents’ socio-demographic
characteristics and whether or not they knew someone (other than themselves) who had been
diagnosed with a mental illness. There were statistically significant but numerically small
differences in some scores (ie, differences of around three points). Those more likely to express
more negative views of people with experience of mental distress:
identified as Pacific peoples (34.6) or Asian (33.1) compared with those who identified as
European/Other (36.5, ps <.002).
lived in areas of high socio-economic deprivation (35.0), compared with those living in areas
of low and medium socio-economic deprivation (36.1, all ps <.02).
were male (35.4), compared with female (36.3, p = .01).
did not know someone with a mental illness (34.2), compared with those who did (36.6,
p<.001).
0% 2%
44%
54%
0%
10%
20%
30%
40%
50%
60%
70%
80%
90%
100%
Low Medium-Low Medium-High High
Perc
enta
ge o
f re
spondents
Benevolent attitude(benevolence score category)
Low kindness
High kindness

21
There were no significant age differences.
Community Mental Health Ideology (CMHI) Subscale
In the CMHI subscale, the mean score was 37.6 (range: 12 to 50) out of a possible range of 10 to
50. Cronbach’s alpha (α = .87) indicated that CMHI items were internally consistent.
The percentage of respondents in each score category is presented in Figure 4. These indicate
that across the 10 items in this scale, the average score for the majority of adults reflected positive
or very positive attitudes towards the inclusion of people with experience of mental distress in the
community. This subscale had the highest level of medium-low or low (23%) of all the scales
(MAKS, RIBS, and CAMI benevolence sub scale).
Figure 4. Percentage of respondents in each CAMI CMHI score category
Sub-group differences in CMHI scores
Scores on the CMHI subscale were examined by respondents’ socio-demographic characteristics
and whether or not they knew someone (other than themselves) who had been diagnosed with a
mental illness. There were statistically significant but numerically small differences in some scores
(ie, differences of around three points). Those more likely to express more negative views of
people with experience of mental distress:
were people aged over 65 years (34.5), compared with those aged 15-24 years (37.6,
p <.001)
identified as Asian (32.8), compared with those who identified as European/Other (35.5,
p=.01)
did not know someone with a mental illness (34.2), compared with those who did (36.6,
p<.001).
1%
22%
49%
27%
0%
10%
20%
30%
40%
50%
60%
70%
80%
90%
100%
Low Medium-Low Medium-High High
Perc
enta
ge o
f re
spondents
CMHI score category
Positive attitudes
Negative attitudes
22
There were no significant differences in regards to gender or socio-economic deprivation.

23
RESULTS SUMMARY
Summary statistics for each scale
Mean scores, the actual range of scores in the 2015 NZMHM, and the range of possible scores for
each measure are displayed with internal consistency coefficients in Table 5.
Table 5. Mean scores, ranges, possible ranges, and reliability coefficients for each measure
Mean score
(measure of range) Possible range
Reliability coefficient
(Cronbach’s α)
MAKS 21.6 (9, 29) 6, 30 .43
RIBS 15.5 (4, 20) 4, 20 .84
CAMI: Benevolence 35.9 (20, 45) 9, 45 .77
CAMI: CMHI 37.6 (12, 50) 10, 50 .87
Score distributions
On each measure, the majority of adults scored in either the medium-high or high score categories
and none or very few scored in the low score category. The percentage of respondents who fell
into each score category on each measure is presented in Figure 5.
Figure 5. Percentage of respondents in each score category on each measure
Note: Low scores indicate more negative views or attitudes in relation to people with experience of mental
distress; high scores indicate more positive views or attitudes
9% 13%
22%
67%
30%
44%
49%
23%
55% 54%
27%
0%
10%
20%
30%
40%
50%
60%
70%
80%
90%
100%
MAKS RIBS CAMI: Benevolence CAMI: CMHI
Perc
enta
ge o
f re
spondents
Scales
Low
Medium-Low
Medium-High
High

24
DISCUSSION
The main purpose of this report was to use data from the 2015 NZMHM to provide an initial
overview of the current knowledge, attitudes and intended behaviour of New Zealand adults
towards people with experience of mental distress. The secondary purpose was to provide a
baseline from which to compare future changes in those views.
Across measures, most adults gave answers indicating relatively positive views of people with
experience of mental distress; few expressed strong negative views. Over half of the respondents
to the 2015 NZMHM (54%) agreed with the statement that “people with severe mental illnesses
can fully recover”. Only around one in ten adults (11%) did not think this was possible. A recovery
approach to mental distress has underpinned mental health policy in New Zealand for almost two
decades (O’Hagan, 2004), so this finding is encouraging.
When overall scores on each of the psychometrically validated scales were examined by
respondents’ socio-demographic characteristics, there were statistically significant, but numerically
small, differences. Across all three scales, adults who expressed more negative views of those
who experience mental distress:
were older, compared with younger
were Asian or Pacific ethnicity, compared with New Zealand European/Other or Māori
ethnicity
did not know someone who had experience of mental distress, compared with those that
did.
There were also effects of socioeconomic deprivation on the MAKS and CAMI benevolence
subscale, whereby adults living in high deprivation areas expressed more negative views of people
with experience of mental distress.
Although the majority of adults expressed largely positive views towards people with experience of
mental distress, there was evidence that willingness to interact with those experiencing mental
distress decreased as the level of social distance decreased. Adults reported they would be more
willing to work with someone with mental illness, than live with someone with mental illness; they
would be more willing to live nearby someone with a mental illness than work with someone with
mental illness; and they would be more willing to continue a relationship with a friend who
developed mental illness than live nearby to someone with mental illness. Whilst international
evidence from reviews of anti-stigma and anti-discrimination initiatives suggest improvements in
desire for social distance in recent years (Henderson et al, 2016), future NZMHM data is needed to
compare this baseline information within New Zealand.
STRENGTHS AND LIMITATIONS
A key strength of this study is that the data are derived from a nationally-representative sample of
adults in New Zealand and, therefore, provide a useful initial overview of the general population’s
self-reported knowledge, attitudes and intended behaviour towards people with experience of
mental distress.
25
Second, the study highlights specific groups that express more negative views of those who
experience mental distress.
Third, the design of the NZMHM facilitates useful comparisons with other data sources. For
example, the use of the same self-reported stigma measures as those used to evaluate
international mental distress stigma-reduction programmes allows for international comparisons.
Further, the repeated implementation of the NZMHM means that these data represent a ‘baseline’
from which to compare changes in the attitudes of adults in New Zealand towards people with
experience of mental distress over time.
This study and the report also have limitations. The report is designed to provide an initial overview
of current knowledge, attitudes and intended behaviour of adults in New Zealand towards people
with experience of mental distress, and is not intended to be an exhaustive examination of all
issues concerning discrimination related to mental distress in New Zealand. It does not, therefore,
provide insight into the extent to which those who experience mental distress are discriminated
against (related to their mental health). The current results should then, be interpreted alongside
other measures of discrimination and social inclusion of people who experience mental distress
(for example, employment rates). Such measures may be subjective or objective. Discrimination “is
typically measured from a person’s subjective perspective of whether an individual’s or agency’s
behaviour was fair” or whether that person “felt discriminated against”. Social inclusion “can be
measured from either a subjective or objective perspective, that is, through finding out whether a
person has experienced feeling excluded (subjective) or through measuring actual rates of
participation or access to service (objective)” (Cuthbert, 2009:10).
More in-depth research and analysis of the data alongside specific examination of the experience
of discrimination from the point of view of the person with lived experience of mental distress, is
recommended to provide greater insight into related discrimination. New Zealand’s inaugural
survey examining the experience of discrimination from the perspective of the person with
experience of mental distress was undertaken in 20046 but has not yet been repeated.
Other study limitations relate to the measures used in the 2015 NZMHM. Although they have been
psychometrically validated and used in other stigma-related research overseas (eg, Evans-Lacko
et al, 2013), not all psychometrically validated scales used to measure self-reported knowledge,
attitudes and intended behaviour towards people with experience of mental distress are equally
regarded by mental health researchers. Some challenge the suitability of the MAKS in mental
health discrimination research given the lack of evidence to suggest that solely increasing
knowledge of mental distress results in decreased stigma or discrimination (Corrigan & Shapiro,
2010). Others challenge the use of self-reported social distance scales such as those used in the
RIBS, arguing that despite the range of such scales used as a proxy for discrimination (Livingston,
Cianfrone, Korf-Uzan & Coniglio, 2014; Kvaale, Haslam & Gottdiener, 2013), they may not
accurately reflect people’s actual behaviour and, therefore, their findings cannot be generalised to
real life settings (Lee et al, 2014).
6 https://www.mentalhealth.org.nz/assets/ResourceFinder/respect-costs-nothing.pdf
26
The measures used in the 2015 NZMHM also indicate people’s self-reported knowledge, attitudes
and intended behaviour towards those who experience mental distress, as opposed to people’s
actual behaviour. Self-reported views can be affected by social desirability bias (Nederhof, 1985;
Corrigan & Shapiro, 2010) and a person’s expressed attitudes may not reflect their actual
behaviour (Thornicroft et al, 2007). Social desirability bias, the practice of respondents answering
survey questions in a manner that they think will be viewed favourably by others, or to “say what
they believe conforms to cultural morés, even if it varies from what they might otherwise report to
be their “real belief” (Corrigan & Shapiro, 2010:912), is prevalent in this area (Michaels & Corrigan,
2013). Agreement or acquiescence bias, whereby respondents have a tendency to agree with a
statement when in doubt, or indicate positive connotations, can also affect self-reported survey
responses, particularly when surveys are conducted face to face as was the 2015 NZMHM. For
these types of reasons, RIBS, for example, is recommended to be used as an online assessment
(Evans-Lacko et al, 2011). Using anonymous measures, particularly online, may help reduce the
impact of social desirability bias (Evans-Lacko et al, 2011), as may using error-choice
assessments (Michaels & Corrigan, 2013). All respondents to the 2015 NZMHM were anonymous.
The validity and reliability of using a shortened version of the CAMI has not been verified in New
Zealand. Concepts and terminology used in the CAMI scale may not be applicable to the 2016
New Zealand setting and further work is needed to test its validity.
CONCLUSION
This report of findings from the 2015 NZMHM provides insight into the general population’s self-
reported knowledge, attitudes and intended behaviour towards people with experience of mental
distress. The report also highlights specific groups that tend to express more negative views of
those who experience mental distress, and again these findings are consistent with previous
research indicating less positive attitudes towards people with experience of mental distress by
Pacific peoples (Fearn & Wyllie, 2005) and those aged over 65 years (Henderson et al, 2016).
Reducing discrimination against people who experience mental distress may enhance help-
seeking and recovery, as well as reduce social and material disadvantages (Jorm, 2000). The
findings from this report are, therefore, important as they can be used to help inform interventions
aimed at improving community knowledge, attitudes and actual behaviour towards people with
experience of mental distress. Caution is required, however, in accepting them in isolation from
more recent understandings of the relationship between social exclusion and inclusion with stigma
and discrimination. It would be more prudent to consider them alongside other findings, particularly
those undertaken from the subjective and cross-cultural perspectives of people with lived
experience of stigma, discrimination, and social exclusion related to mental distress (Gordon et al,
2016).

27
REFERENCES
Corrigan, P., Edwards, A., Green, A., Diwan, S. & Penn, D. (2001). Prejudice, social distance, and
familiarity with mental illness. Schizophrenia Bulletin, 27(2): 219-25.
Corrigan, P. & Shapiro, J. (2010). Measuring the impact of programs that challenge the public
stigma of mental illness. Clinical Psychology Review, 30: 907-22.
Corrigan, P. & Watson, A. (2002). Understanding the impact of stigma on people with mental
illness. World Psychiatry, 1(1): 16–20.
Cuthbert, S. (2009). Mental health and social inclusion concepts and measurements. Occasional
paper. Wellington: Mental Health Commission/Te Kaitātaki Oranga. Retrieved from
http://www.hdc.org.nz/media/199083/mental%20health%20and%20social%20inclusion%20c
oncepts%20and%20measurements,%20june%202009.pdf
Drapalski, A., Lucksted, A., Perrin, P., Aakre, J., Brown, C., DeForge, B. & Boyd, J. (2013). A
model of internalized stigma and its effects on people with mental illness. Psychiatric
Services, 64(3): 264-9.
Evans-Lacko, S., Henderson, C. & Thornicroft, G. (2013). Public knowledge, attitudes and
behaviour regarding people with mental illness in England 2009-2012. British Journal of
Psychiatry, 202: 51-7.
Evans-Lacko, S., Little, K., Meltzer, H., Rose, D., Rhydderch, D., Henderson, C. & Thornicroft, G.
(2010). Development and psychometric properties of the Mental Health Knowledge
Schedule. Canadian Journal of Psychiatry, 55(7): 440-8.
Evans-Lacko, S., Rose, D., Little, K., Flach, C., Rhydderch, D., Henderson, C. & Thornicroft, G.
(2011). Development and psychometric properties of the Reported and Intended Behaviour
Scale (RIBS): A stigma-related behaviour measure. Epidemiology and Psychiatric
Sciences, 20(03): 263-71.
Fearn, A. & Wyllie, A. (2005). Public knowledge of and attitudes to mental health and mental
illness: Update of 1997 Benchmark Survey. Research Report for Ministry of Health.
Auckland: Phoenix Research.
Gordon, S., Davey, S., Waa, A., Titia, R. & Waaka, T. (2016). Aotearoa/New Zealand social
inclusion and exclusion, stigma and discrimination, and the experience of mental distress.
Wellington: Health Promotion Agency.
Government of Western Australia Mental Health Commission. (n.d.). What is stigma? Retrieved
from http://www.mentalhealth.wa.gov.au/mental_illness_and_health/mh_stigma.aspx
Hansson, L., Stjernswärd, S. & Svensson, B. (2016). Changes in attitudes, intended behaviour,
and mental health literacy in the Swedish population 2009-2014: An evaluation of a national
antistigma programme. Acta Psychiatrica Scandinavica, 134(S446): 71-9.
Henderson, C., Robinson, E., Evans-Lacko, S., Corker, E., Rebollo-Mesa, I., Rose, D. &
Thornicroft, G. (2016). Public knowledge, attitudes, social distance and reported contact
regarding people with mental illness 2009–2015. Acta Psychiatrica Scandinavica,
134(S446): 23-33.
Jorm, A. (2000). Mental health literacy: Public knowledge and beliefs about. British Journal of
Psychiatry, 177: 396-401.
Kvaale, E., Haslam, N. & Gottdiener, W. (2013). The ‘side effects’ of medicalization: A meta-
analytic review of how biogenetic explanations affect stigma. Clinical Psychology Review,
33(6), 782-94.
28
Lee, A., Laurent, S., Wykes, T., Andren, K., Bourassa, K. & McKibbin, C. (2014). Genetic
attributions and mental illness diagnosis: Effects on perceptions of danger, social distance,
and real helping decisions. Social Psychiatry and Psychiatric Epidemiology, 49: 781-9.
Livingston, J., Cianfrone, M., Korf-Uzan, K. & Coniglio, C. (2014). Another time point, a different
story: One year effects of a social media intervention on the attitudes of young people
towards mental health issues. Social Psychiatry and Psychiatric Epidemiology, 49: 985-90.
Michaels, P. & Corrigan, P. (2013). Measuring mental illness stigma with diminished social
desirability effects. Journal of Mental Health, 22(3): 218-26.
Ministry of Health/Manatū Hauora and Health Promotion Agency. (2014). Like Minds, Like Mine
National Plan 2014–2019: Programme to increase social inclusion and reduce stigma and
discrimination for people with experience of mental illness. Wellington: Ministry of
Health/Manatū Hauora.
National Research Bureau. (2015). New Zealand Mental Health Monitor methodology report.
Wellington: Health Promotion Agency Research and Evaluation Unit.
Nederhof, A.J. (1985). Methods of coping with social desirability bias: A review. European Journal
of Social Psychology, 15(3): 263-80.
O’Hagan, M. (2004). Recovery in New Zealand: Lessons for Australia? Guest Editorial. Australian
e-Journal for the Advancement of Mental Health, 3(1): 1-3.
Sharac, J., McCrone, P., Clement, S. & Thornicroft, G. (2010). The economic impact of mental
health stigma and discrimination: A systematic review. Epidemiologia e Psichiatria Sociale,
19: 223-32.
Slade, M. (2013). 100 ways to support recovery. A guide for mental health professionals. 2nd
edition. London: Rethink Mental Illness.
Stuart, H. (2006). Mental illness and employment discrimination: Current Opinion in Psychiatry,
19(5): 522-6.
Taylor, S. & Dear, M. (1981). Scaling community attitudes toward the mentally ill. Schizophrenia
Bulletin, 7(2): 225.
Thornicroft, G., Rose, D., Kassam, A. & Sartorius, N. (2007). Stigma: ignorance, prejudice or
discrimination? The British Journal of Psychiatry, 190(3): 192-3.
UK Mental Health Foundation. (n.d.). Stigma and discrimination. Retrieved from
https://www.mentalhealth.org.uk/a-to-z/s/stigma-and-discrimination

29
APPENDIX A: MAKS SCORING
Item wording Response options Score
Most people with mental illness want to have paid employment Strongly agree
Agree
Neither agree nor disagree
Disagree
Strongly disagree
Don’t know
Refused
5
4
3
2
1
3
-
If a friend had a mental illness, I know what advice to give them to get
professional help
Medication can be an effective treatment for people with mental
illnesses
Psychotherapy, like counselling or talking therapy, can be an effective
treatment for people with mental illnesses
People with severe mental illnesses can fully recover
Most people with mental illnesses go to a healthcare professional to
get help
Strongly agree
Agree
Neither agree nor disagree
Disagree
Strongly disagree
Don’t know
Refused
1
2
3
4
5
3
-
Notes:
In line with the scoring procedure recommended by the scale developers (Evans-Lacko et al., 2010), “don’t know”
responses were counted as neutral.
1. Respondents who refused to answer an item were not scored and, therefore, were excluded from the total score
analyses.
2. ‘Mental illness’ was defined in the questionnaire as “people who live in the community, whose experience of mental
illness makes it hard for them to function: that is, to join in with some activities that other people might see as part of
ordinary life.”
3. Source: Evans-Lacko, S., Little, K., Meltzer, H., Rose, D., Rhydderch, D., Henderson, C. & Thornicroft, G. (2010).
Development and psychometric properties of the Mental Health Knowledge Schedule. Canadian Journal of
Psychiatry, 55(7), 440-448.

30
APPENDIX B: RIBS SCORING
Item wording Response options Score
Reported behaviour
Do you currently, or have you ever, lived with someone with a mental
illness?
Yes
No
Don’t know
Not
scored
Do you currently, or have you ever, worked with someone with a mental
illness?
Do you currently, or have you ever, had a neighbour with a mental
illness?
Do you currently, or have you ever, had a close friend with a mental
illness?
Intended behaviour
In the future, I would be willing to live with someone with a mental
illness
Strongly agree
Agree
Neither agree nor disagree
Disagree
Strongly disagree
Don’t know
Refused
5
4
3
2
1
3
-
In the future, I would be willing to work with someone with a mental
illness
In the future, I would be willing to live nearby to someone with a mental
illness
In the future, I would be willing to continue a relationship with a friend
who developed a mental illness
Notes:
1. In line with the scoring procedure recommended by the scale developers (Evans-Lacko et al., 2011), “don’t know”
responses were counted as neutral.
2. Respondents who refused to answer an item were not scored and therefore were excluded from the total score
analyses.
3. ‘Mental illness’ was defined in the questionnaire as “people who live in the community, whose experience of mental
illness makes it hard for them to function: that is, to join in with some activities that other people might see as part of
ordinary life.”
4. Source: Evans-Lacko, S., Rose, D., Little, K., Flach, C., Rhydderch, D., Henderson, C., & Thornicroft, G. (2011).
Development and psychometric properties of the Reported and Intended Behaviour Scale (RIBS): a stigma-related
behaviour measure. Epidemiology and Psychiatric Sciences, 20(03), 263–271.
http://doi.org/10.1017/S2045796011000308
31
APPENDIX C: CAMI SCORING
Benevolence subscale
Item wording Response options Score
More tax money should be spent on the care and treatment of people with
severe mental illnesses
Strongly agree
Agree
Neither agree nor disagree
Disagree
Strongly disagree
Don’t know
Refused
5
4
3
2
1
3
-
People with severe mental illnesses have been the subject of ridicule for
too long
We need to adopt a far more tolerant attitude toward people with severe
mental illnesses in our society
We have a responsibility to provide the best possible care for people with
serious mental illnesses
It is best to avoid anyone who has problems with severe mental illness Strongly agree
Agree
Neither agree nor disagree
Disagree
Strongly disagree
Don’t know
Refused
1
2
3
4
5
3
-
People with severe mental illnesses are a burden on society
Increased spending on severe mental health services is a waste of tax
dollars
There are sufficient existing services for people with severe mental
illnesses
People with severe mental illnesses do not deserve our sympathy
Community Mental Health Ideology (CMHI) subscale
Item wording Response options Score
The best therapy for many people with severe mental illnesses is to be a part
of a normal community
Strongly agree
Agree
Neither agree nor disagree
Disagree
Strongly disagree
Don’t know
Refused
5
4
3
2
1
3
-
Residents should accept the location of mental health facilities in their
neighbourhood to serve the needs of the local community
Locating mental health services in residential neighbourhoods does not
endanger local residents
Residents have nothing to fear from people coming into their neighbourhood to
obtain mental health services
As far as possible, mental health services should be provided through
community based facilities
Having people with severe mental illnesses living within residential
neighbourhoods might be good therapy, but the risks to residents are too great
Strongly agree
Agree
Neither agree nor disagree
Disagree
Strongly disagree
Don’t know
Refused
1
2
3
4
5
3
-
Local residents have good reason to resist the location of mental health
services in their neighbourhood
Mental health facilities should be kept out of residential neighbourhoods
It is frightening to think of people with severe mental illnesses living in
residential neighbourhoods

32
Locating mental health facilities in a residential area downgrades the
neighbourhood
Notes:
1. The original scale did not include “don’t know” and “refuse” options, but to ensure consistent scoring across the
scales in this report, “don’t know” responses were counted as neutral and respondents who refused to answer an
item were not scored.
2. ‘Mental illness’ was defined in the questionnaire as “people who live in the community, whose experience of mental
illness makes it hard for them to function: that is, to join in with some activities that other people might see as part of
ordinary life.”
3. Source: Taylor, S. M., & Dear, M. J. (1981). Scaling community attitudes toward the mentally ill. Schizophrenia
Bulletin, 7(2), 225.