attachment l4 inversionparametersrms-errorcurves · casmalia resources superfund site final...
TRANSCRIPT

Casmalia Resources Superfund Site Final Remedial Investigation Report Attachment L-4
CSC L4-1 January 2011
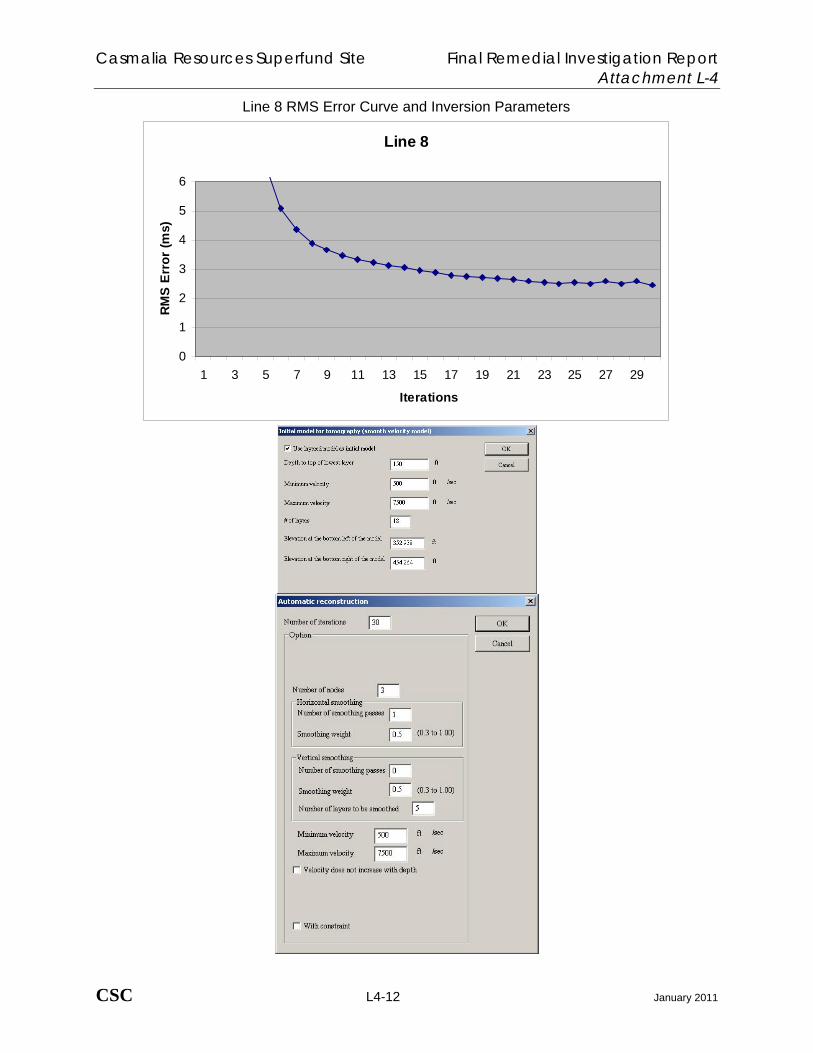
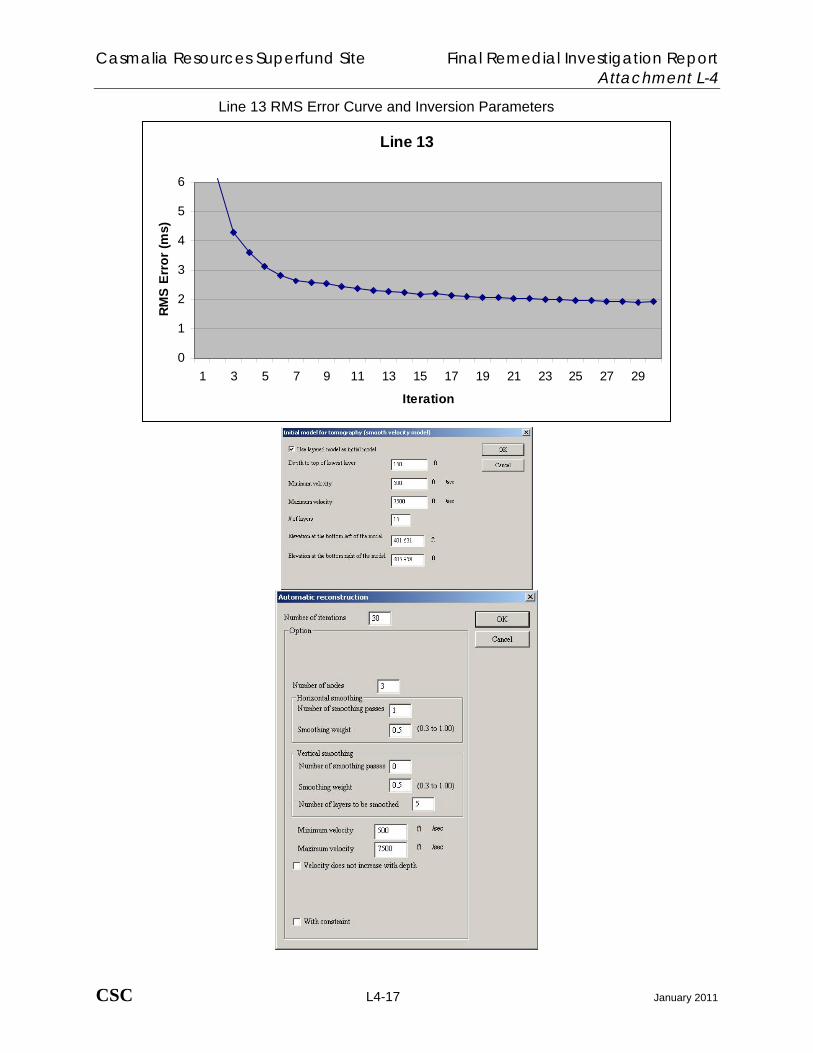
PROCESSING PARAMETERS The CSC first performed a time-term inversion to produce a layered model that was used as the initial model for the tomographic inversion. The processing parameters used to produce the initial tomographic model are shown on Figure 1. Tomographic inversion was then completed to 30 iterations using the parameters shown on Figure 2. Screen shots of RMS error curves for all Phase II lines are presented below MODEL DISPLAY PARAMETERS Tomographic models of the Phase II data are presented on Figures L-26 to L-39. The models in these figures were prepared using the following display parameters: ~Contour map (without lines) ~Manual contours 300-fps interval;range 500 – 7500 fps ~Manual axis configuration (Y-min to nearest 50 feet) Addtionally, graphs showing the RMS error curves for each line are presented below. Overall, the curves show an RMS error leveling off between 2 and 3 milliseconds, with the error decrementing 0.01 to 0.02 milliseconds per iteration for iterations 25 through 30. REASONING USED FOR ARRIVAL TIME PICKING AND EDITING The typical procedure for determining P-wave travel times on a shot-gather is to select the “first-break” on each seismic wave trace. We define the first-break as the point on a wave trace at which the trace changes from a straight line to a sinusoidal wave form. For good quality data with a high signal-to-noise ratio the transition from straight line to sinusoid is sharp and the first-break is easy to discern. However, as the signal-to-noise ratio decreases, the first-break becomes less distinct. Either the transformation from straight line to sinusoid is very gradual in time or it is masked by background noise that is superimposed on the trace. In these cases, we interpret the first break location on the basis of professional judgment that is tempered by many years of experience. Additionally, we can interpolate or extrapolate first-break locations on noisy traces that are near traces with distinct first-breaks. The vast majority of the approximately 26,000 seismic traces obtained or for the Phase II Seismic Refraction Survey exhibited first breaks that were easy to discern and thus required no special picking strategy or editing. Some traces, however, exhibited seismic noise that complicated the picking process. The primary noise sources were pavement, vibrations from machinery, and wind. Additionally, in areas with loosely consolidated surface soil, the air wave
Figure 2 – Inversion Parameters Used for All Lines
Figure 1 – Parameters for Initial Tomographic Model (elevation varies for each line)

Casmalia Resources Superfund Site Final Remedial Investigation Report Attachment L-4
CSC L4-2 January 2011
from the hammer blow produced some noise on traces close to the shotpoint. On traces where noise obscured the first break, we sought the most likely first break position by interpolating between traces with more definitive first breaks. In some cases this was done during the actual first-break picking procedure by using the “click and drag” feature built into the Pickwin95 computer program. In other cases, after reviewing time-distance (TD) graphs prepared using the computer program PlotRefa, the initial first-break picks were adjusted (edited) to fit velocity slopes similar to those observed in non-affected areas. The CSC recognizes that additional refinement of first break picks, especially in noisy areas, may improve the tomographic models and welcomes EPA input on this matter. PROCESS FOR HANDLING SHALLOW, HIGH-VELOCITY FIRST BREAKS In general, shallow, high-velocity first breaks correspond to paved areas, where picking first-breaks is particularly difficult. This is because pavement typically has a higher velocity than the underlying unconsolidated materials. Consequently, P-waves propagating through the pavement can arrive at the geophones before those that propagate through the underlying formation. Because the pavement is relatively thin it can only support high frequencies, which attenuate rapidly with distance away from the shot point. Consequently, the P-wave energy in pavement tends to fade out a few tens of feet from the shot point. However, at geophones close to the shot point, the pavement arrivals can be strong enough to completely mask P-wave arrivals from the underlying target of interest. In these cases we had no choice but to interpolate the position of the formation first-breaks using the strategy described above in Section 6.0. This approach was aided by looking at the velocity and thickness of near surface layers obtained from areas where pavement and/or airwaves were not a problem. rom a straight line to a sinusoidal wave form. For good quality data with a high signal-to-noise ratio the transition from straight line to sinusoid is sharp and the first-break is easy to discern. However, as the signal-to-noise ratio decreases, the first-break becomes less distinct. Either the transformation from straight line to sinusoid is very gradual in time or it is masked by background noise that is superimposed on the trace. In these cases, we interpret the first break location on the basis of professional judgment that is tempered by the many years of experience of our processing specialists. Additionally, we can interpolate or extrapolate first-break locations on noisy traces that are near traces with distinct first-breaks. The CSC’s picking strategy was influenced by the fact the potential location of the subsurface target (a deeply-buried, shallow-relief “low spot”) would be difficult to detect. Accordingly, the processing specialists employed a stringent picking strategy, examining traces under high gain settings to identify the earliest possible first break in an effort to delineate subtle subsurface features. The traces were also examined using lower display gains before the picks were finalized. The majority of the approximately 26,000 seismic traces obtained or for the Phase II Seismic Refraction Survey exhibited first breaks that were easy to discern and thus no editing was required to the initial first break picks. Many traces, however, exhibited seismic noise that complicated the picking process. The primary noise sources were pavement, vibrations from machinery, and wind. Additionally, in areas with loosely consolidated surface soil, the air wave from the hammer blow produced some noise on traces close to the shotpoint. On traces where noise obscured the first break, CSC sought the most likely first break position by interpolating between traces with more definitive first breaks. In some cases this was done during the actual first-break picking procedure by using the “click and drag” feature built into the Pickwin95 computer program. In other cases, after reviewing time-distance (TD) graphs prepared using the computer program PlotRefa, the initial first-break picks were adjusted (edited) to fit velocity slopes similar to those observed in non-affected areas.
Casmalia Resources Superfund Site Final Remedial Investigation Report Attachment L-4
CSC L4-3 January 2011
Although the automatic picking utility in Pickwin95 was used to expedite first break picking, the CSC processing specialists nonetheless examined each of the approximately 26,000 seismic traces individually and used professional judgment to make edits to the “automatic” first break picks. These adjustments were too numerous to list and the edits were not cataloged. In general, edits were made to errant automatic picks, defined as picks that did not fall in line with picks on adjacent traces. In such cases, the picks on the adjacent traces were used to interpolate or extrapolate a line through the errant trace along which the first break was likely to fall. The CSC then examined the errant trace for a specific deflection at or near the interpolated line; that deflection was then picked as the first break. The CSC believes they have made the best choice for first break picks, but we welcome EPA input on this matter.

Casmalia Resources Superfund Site Final Remedial Investigation Report Attachment L-4
CSC L4-4 January 2011
RMS ERROR CURVES AND INVERSION PARAMETERS For
PHASE II REFRACTION SURVEY

Casmalia Resources Superfund Site Final Remedial Investigation Report Attachment L-4
CSC L4-5 January 2011
Line 1 RMS Error Curve and Inversion Parameters
Line 1
0
1
2
3
4
5
6
1 3 5 7 9 11 13 15 17 19 21 23 25 27 29
Iteration
RM
S Er
ror (
ms)

Casmalia Resources Superfund Site Final Remedial Investigation Report Attachment L-4
CSC L4-6 January 2011
Line 2 RMS Error Curve and Inversion Parameters
Line 2
0
1
2
3
4
5
6
1 3 5 7 9 11 13 15 17 19 21 23 25 27 29
Iterations
Err
or (m
s)

Casmalia Resources Superfund Site Final Remedial Investigation Report Attachment L-4
CSC L4-7 January 2011
Line 3 RMS Error Curve and Inversion Parameters
Line 3
0
1
2
3
4
5
6
1 3 5 7 9 11 13 15 17 19 21 23 25 27 29
Iterations
RM
S E
rror
(ms)

Casmalia Resources Superfund Site Final Remedial Investigation Report Attachment L-4
CSC L4-8 January 2011
Line 4 RMS Error Curve and Inversion Parameters
Line 4
0
1
2
3
4
5
6
1 3 5 7 9 11 13 15 17 19 21 23 25 27 29
Iterations
RM
S E
rror
(ms)

Casmalia Resources Superfund Site Final Remedial Investigation Report Attachment L-4
CSC L4-9 January 2011
Line 5 RMS Error Curve and Inversion Parameters
Line 5
0
1
2
3
4
5
6
1 3 5 7 9 11 13 15 17 19 21 23 25 27 29
Iteration
RMS
Erro
r (m
illis
econ
ds)

Casmalia Resources Superfund Site Final Remedial Investigation Report Attachment L-4
CSC L4-10 January 2011
Line 6 RMS Error Curve and Inversion Parameters
Line 6
0
1
2
3
4
5
6
1 3 5 7 9 11 13 15 17 19 21 23 25 27 29
Iterations
RM
S Er
ror (
ms)

Casmalia Resources Superfund Site Final Remedial Investigation Report Attachment L-4
CSC L4-11 January 2011
Line 7 RMS Error Curve and Inversion Parameters
Line 7
0
1
2
3
4
5
6
1 3 5 7 9 11 13 15 17 19 21 23 25 27 29
Iterations
RMS
Err
or (m
s)
Casmalia Resources Superfund Site Final Remedial Investigation Report Attachment L-4
CSC L4-12 January 2011
Line 8 RMS Error Curve and Inversion Parameters
Line 8
0
1
2
3
4
5
6
1 3 5 7 9 11 13 15 17 19 21 23 25 27 29
Iterations
RM
S E
rror
(ms)

Casmalia Resources Superfund Site Final Remedial Investigation Report Attachment L-4
CSC L4-13 January 2011
Line 9 RMS Error Curve and Inversion Parameters
Line 9
0
1
2
3
4
5
6
1 3 5 7 9 11 13 15 17 19 21 23 25 27
Iterations
RM
S E
rror
(ms)

Casmalia Resources Superfund Site Final Remedial Investigation Report Attachment L-4
CSC L4-14 January 2011
Line 10 RMS Error Curve and Inversion Parameters
Line 10
0
1
2
3
4
5
6
1 3 5 7 9 11 13 15 17 19 21 23 25 27 29
Iteration
RM
S E
rror
(ms)

Casmalia Resources Superfund Site Final Remedial Investigation Report Attachment L-4
CSC L4-15 January 2011
Line 11 RMS Error Curve and Inversion Parameters
Line 11
0
1
2
3
4
5
6
1 3 5 7 9 11 13 15 17 19 21 23 25 27 29
Iterations
RMS
Err
or (m
s)

Casmalia Resources Superfund Site Final Remedial Investigation Report Attachment L-4
CSC L4-16 January 2011
Line12 RMS Error Curve and Inversion Parameters
Line 12
0
1
2
3
4
5
6
1 3 5 7 9 11 13 15 17 19 21 23 25 27 29
Iterations
RM
S E
rror
(ms)
Casmalia Resources Superfund Site Final Remedial Investigation Report Attachment L-4
CSC L4-17 January 2011
Line 13 RMS Error Curve and Inversion Parameters
Line 13
0
1
2
3
4
5
6
1 3 5 7 9 11 13 15 17 19 21 23 25 27 29
Iteration
RMS
Err
or (m
s)

Casmalia Resources Superfund Site Final Remedial Investigation Report Attachment L-4
CSC L4-18 January 2011
Line 14 RMS Error Curve and Inversion Parameters
Line 14
0
1
2
3
4
5
6
1 3 5 7 9 11 13 15 17 19 21 23 25 27 29
Iterations
RMS
Err
or (m
s)