attachment 6 report of waste discharge€¦ · aecom environment beacon solar energy project...
TRANSCRIPT
AECOM Environment
Beacon Solar Energy Project (08-AFC-2) June 2009
Attachment 6 Report of Waste Discharge

Beacon Solar Energy Project i June 2009
TABLE OF CONTENTS
Introduction............................................................................................................................................ 1
4.0 Waste Classification and Management ............................................................................................ 4
4.1 Evaporation Ponds ..................................................................................................................... 4 4.1.1 Lower Bound TDS Design................................................................................................ 4 4.1.2 Upper Bound TDS Design................................................................................................ 7
4.2 Land Treatment Unit and Heat Transfer Fluid-Impacted Soils ....................................................... 8
4.3 Waste Classification.................................................................................................................... 9 4.3.1 Wastewater ..................................................................................................................... 9 4.3.2 Evaporation Pond Residue............................................................................................. 10 4.3.3 Land Treatment Unit ...................................................................................................... 10
4.4 Unit Classification ..................................................................................................................... 11
4.5 Unit Locations........................................................................................................................... 11
5.0 Monitoring and Reporting Requirements....................................................................................... 12
5.1 Evaporation Pond Monitoring .................................................................................................... 12 5.1.1 Evaporation Pond Wastewater ....................................................................................... 12 5.1.2 Evaporation Pond Residue............................................................................................. 12 5.1.3 Detection Monitoring ...................................................................................................... 12
5.2 Evaporation Pond Monitoring .................................................................................................... 12 5.2.1 Land Treatment Unit - Runoff ......................................................................................... 12 5.2.2 Heat Transfer Fluid-Contaminated Soil - Land Treatment Unit ......................................... 12
5.3 Groundwater Monitoring............................................................................................................ 12 5.3.1 Groundwater Monitoring Network Layout of Regional Groundwater.................................. 12 5.3.2 Monitoring Well Sampling............................................................................................... 13 5.3.2.1 Background Groundwater Monitoring........................................................................... 13 5.3.2.2 Routine Quarterly Groundwater Monitoring .................................................................. 13 5.3.2.3 Routine Annual Groundwater Monitoring...................................................................... 13 5.3.2.4 Detection Monitoring Program Sampling ...................................................................... 13 5.3.2.5 Potentiometeric Surface Monitoring ............................................................................. 13
7.0 Design and Construction Standards.............................................................................................. 14
7.1 General Design Description of the Evaporation Pond ................................................................. 14 7.1.1 Overview....................................................................................................................... 14 7.1.2 Description .................................................................................................................... 14 7.1.3 Hard Surface/Protective Layer........................................................................................ 15 7.1.4 Liner System ................................................................................................................. 15 7.1.5 Base Layer .................................................................................................................... 15 7.1.6 Leak Detection, Collection and Removal System............................................................. 15 7.1.7 Berms and Side Slopes.................................................................................................. 16
Beacon Solar Energy Project ii June 2009
7.1.8 Material Compatibility..................................................................................................... 16
7.2 Engineered Alternative.............................................................................................................. 16
7.3 Construction Methods and Sequence of the Evaporation Ponds ................................................. 16 7.3.1 Moisture Detection System............................................................................................. 16 7.3.2 Site Preparation, Excavation and Compaction................................................................. 17 7.3.3 Liner System Installation ................................................................................................ 17 7.3.4 Hard Surface/Protective Layer........................................................................................ 17
7.4 Land Treatment Unit ................................................................................................................. 17 7.4.1 Overview....................................................................................................................... 17 7.4.2 Heat Transfer Fluid Treatment Process........................................................................... 18 7.4.3 LTU Construction Process.............................................................................................. 18 7.4.4 Site Preparation, Excavation and Grading....................................................................... 18
7.5 Grading Plans........................................................................................................................... 18
9.0 Stormwater Management ............................................................................................................... 19 9.1 Offsite Drainage................................................................................................................ 19 9.2 Onsite Drainage................................................................................................................ 19
11.0 Environmental Controls ............................................................................................................... 22
11.1 Nuisance Controls .................................................................................................................. 22
11.2 Fire Control............................................................................................................................. 22
11.3 Leak Detection and Removal System ...................................................................................... 22
11.4 Dust Control ........................................................................................................................... 22
11.5 Vector Control......................................................................................................................... 23
11.6 Drainage and Erosion Control ................................................................................................. 23
11.7 Noise Control.......................................................................................................................... 23
11.8 Traffic Control ......................................................................................................................... 23
12.0 Inspection, Sampling and Maintenance Programs ...................................................................... 24
12.1 Inspection Program................................................................................................................. 24
12.2 Sampling Program.................................................................................................................. 24
12.3 Maintenance Program............................................................................................................. 24 12.3.1 Evaporation Pond ........................................................................................................ 24 12.3.2 Land Treatment Unit .................................................................................................... 25
12.4 Avian Monitoring..................................................................................................................... 25
12.5 Moisture Detection Monitoring ................................................................................................. 25
RoWD Table Revisions ........................................................................................................................ 26
RoWD Figure Revisions....................................................................................................................... 27

Beacon Solar Energy Project iii June 2009
RoWD Appendix Revisions.................................................................................................................. 28
Appendix G - Detection Monitoring Plan ............................................................................................. 29
1.3 Waste Handling Facilities.......................................................................................................... 29 1.3.1 Evaporation Ponds......................................................................................................... 30 3.1.3 Residue Inspections and Removal.................................................................................. 30 3.3.1 Evaporation Pond Cleanout............................................................................................ 30
4.1 Groundwater Monitoring............................................................................................................ 30
Detection Monitoring Plan Table Revisions......................................................................................... 33
Detection Monitoring Plan Figure Revisions....................................................................................... 34
Appendix I - Corrective Action Plan..................................................................................................... 35
1.3 Waste Handling Facilities.......................................................................................................... 35 1.3.1 Evaporation Ponds......................................................................................................... 36
3.2 Groundwater Corrective Actions................................................................................................ 36 3.2.2 Regional Groundwater ................................................................................................... 37
Corrective Action Plan Table Revisions .............................................................................................. 39
Corrective Action Plan Figure Revisions............................................................................................. 40
Appendix J - Action Leakage Rate....................................................................................................... 41
Appendix K - Preliminary Closure Plan for the Evaporation Ponds.................................................... 42
2.1 Evaporation Ponds ................................................................................................................... 42 3.2.2 Wastewater Disposal/Use .............................................................................................. 42
4.3 Cost Analysis............................................................................................................................ 42
Preliminary Closure Plan for the Evaporation Ponds Table Revisions............................................... 43
Preliminary Closure Plan for the Evaporation Ponds Figure Revisions ............................................. 44
Appendix L - Preliminary Closure Plan for the Land Treatment Unit Figure Revisions...................... 45
Appendix M - Preliminary Post-Closure Maintenance Plan for the Evaporation Ponds and Land Treatment Unit...................................................................................................................................... 46
2.0 Site Background ....................................................................................................................... 46 2.1 Waste Handling Facilities.................................................................................................. 46 2.1.1 Evaporation Ponds......................................................................................................... 46

Beacon Solar Energy Project iv June 2009
2.1.2 Land Treatment Unit ...................................................................................................... 47
2.2 Closure Description Summary................................................................................................... 47
3.0 Preliminary Post Closure Maintenance Plan............................................................................... 48 3.1.1 Groundwater Monitoring................................................................................................. 48 3.1.2 Data Evaluation ............................................................................................................. 48
Preliminary Post-Closure Plan for the Evaporation Ponds and Land Treatment Unit Table Revisions.............................................................................................................................................................. 50
Preliminary Post-Closure Plan for the Evaporation Ponds and Land Treatment Unit Figure Revisions.............................................................................................................................................................. 51
LIST OF ATTACHMENTS
Attachment A - Response to RWQCB Comments to the April 17, 2009 RoWD
Attachment A - Response to RWQCB Comments Dated May 14, 2009 to the CEC PSA for the BSEP

Beacon Solar Energy Project v June 2009
LIST OF ACRONYMS
AFY acre feet per year
ALR Action Leakage Rate
BSEP Beacon Solar Energy Project
CCR California Code of Regulations
CEC California Energy Commission
CFR Code of Federal Regulations
DTSC Department of Toxic Substances Control
GCL Geosynthetic Clay Liner
gpm gallons per minute (rate)
HDPE high-density polyethylene
HTF heat transfer fluid
LDRS leak detection and removal system
LTU Land Treatment Unit
mg/kg milligrams per kilogram
mg/L milligrams per liter
MGD million gallons per day
MMF multi-media filter
MSDS Material Safety Data Sheets
ppm parts per million
PSA Preliminary Staff Assessment
RLLR rapid large leakage rate
RoWD Report of Waste Discharge
RWQCB Regional Water Quality Control Board
SPCC Spill Prevention, Control and Countermeasures
SSG solar steam generator
STLC Soluble Threshold Limit Concentrations
TCLP Toxic Characteristic Leaching Procedure
TDS total dissolved solids
TPCA Toxic Pits Cleanup Act
TTLC Total Threshold Limit Concentrations
USEPA U.S. Environmental Protection Agency
WAC weak acid cation
ZLD zero liquid discharge
Beacon Solar Energy Project 1 June 2009
Introduction
This document presents an amendment to the Report of Waste Discharge (RoWD) Application prepared for the Beacon Solar Energy Project (BSEP) and submitted to the California Energy Commission (CEC) and California Regional Water Quality Control Board - Lahontan Region (RWQCB) on March 18, 2009. The RWQCB provided comments to the application on April 17, 2009 and subsequently to the CEC Preliminary Staff Assessment (PSA) on May 14, 2009. A response to comments from the RWQCB for the RoWD and PSA are provided in Attachment A. It is important to note the response from the RWQCB pertain to the prior facility design and wastewater management plan. Some of the questions posed are answered in the submission of this amended RoWD and the project refinement documents.
This amendment was prepared to address changes in the project waste management program. The annual water supply requirement for the project is 1,600 acre-feet per year (AFY) supplied from groundwater below the site. A partial zero liquid discharge (ZLD) system has been added to the original design presented in the March 18, 2009 RoWD documentation. Partial ZLD system will reduce the amount of on site groundwater needed for cooling and will reduce the amount of water discharged to the evaporation ponds therefore reduce the evaporation pond size. It is anticipated that the partial ZLD system will reduce consumption by about 12.5 percent or 200 AFY. Correspondingly, the reduction in the water discharge has reduced the top area size of the evaporation ponds to about 6 to 8 acres, down from the 40 acres as proposed in the March 18, 2009 RoWD.
Alternative sources of water supply are also being explored in response to CEC PSA recommendations. The water supply sources include onsite groundwater (as per original design however with partial ZLD included), tertiary-treated wastewater from the City of Rosamond and offsite groundwater in the area of Koehn Lake. Because of the variable water chemistry from the potential sources, the amendment provides an upper and lower bound design for total dissolved solids (TDS) concentrations. The design elements of water balance, pre- and post-treatment processes, resultant waste constituents from the process and evaporation pond sizing is directly affected by the differential source water quality (refer to amendment Section 4.0 Waste Classification and Management for additional information). The upper bound source of water, the water with the highest TDS concentrations, is assumed to be present in the area of Koehn Lake. The lower bound design was based on groundwater chemistry as described in the March 18, 2009 RoWD with the inclusion of a partial ZLD system.
In addition to the incorporation of the partial ZLD, portions of the RoWD have also been modified to reflect changes to the detection monitoring network should an offsite source of water be used to supply the Project. The proposed source of water for the Project will be through several existing water supply wells onsite. In the initial application, the groundwater monitoring program was designed to reflect this source of water and the associated cone of depression that will develop in the central portion of the site and in the area of the evaporation ponds and land treatment unit (LTU). Should an offsite source be selected, no such cone of depression will develop and groundwater flow and direction will remain unaltered from the regional flow pattern to the east-northeast toward Koehn Lake. Subsequently, the detection monitoring network will be altered to reflect this change from an onsite pumping to a non-pumping condition.
RoWD Amendment
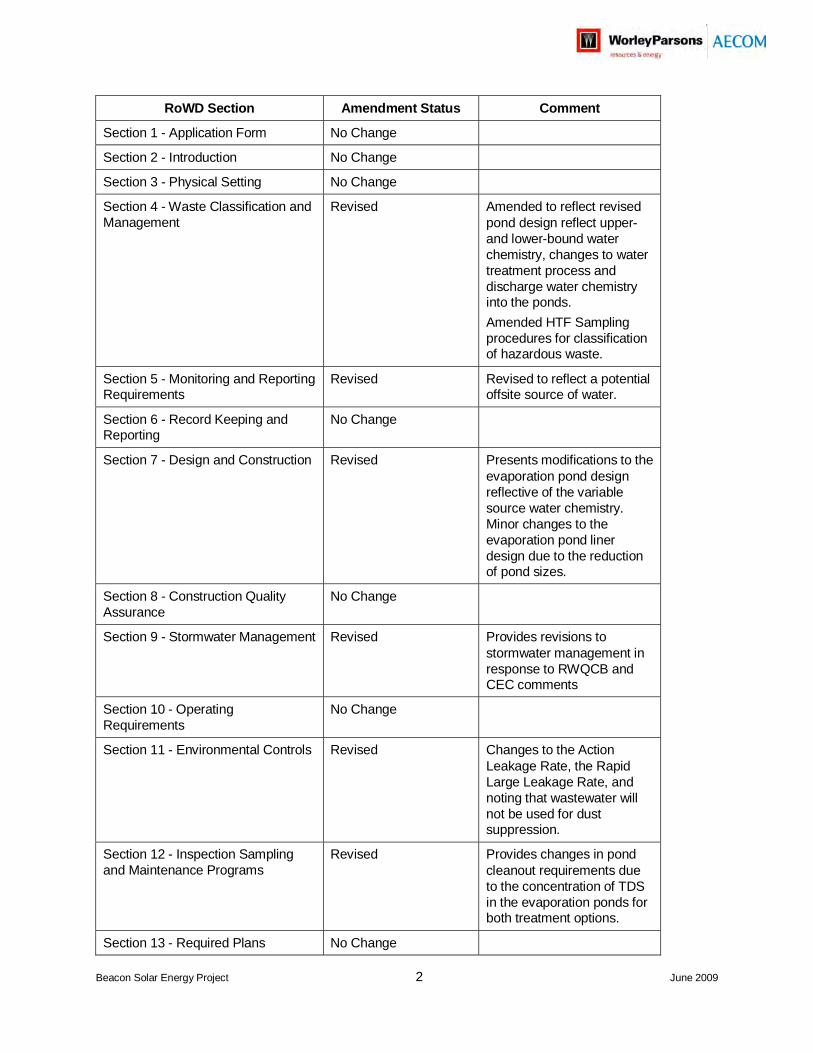
To reflect the design alternatives in response to the CEC, the following sections from the March 18, 2009 RoWD Application have been amended for an upper- and lower-bound water quality estimate. Sections that indicate “no change” have not been revised from what was provided in the March 18, 2009 Application:
Beacon Solar Energy Project 2 June 2009
RoWD Section Amendment Status Comment
Section 1 - Application Form No Change
Section 2 - Introduction No Change
Section 3 - Physical Setting No Change
Section 4 - Waste Classification and Management
Revised Amended to reflect revised pond design reflect upper-and lower-bound water chemistry, changes to water treatment process and discharge water chemistry into the ponds.
Amended HTF Sampling procedures for classification of hazardous waste.
Section 5 - Monitoring and Reporting Requirements
Revised Revised to reflect a potential offsite source of water.
Section 6 - Record Keeping and Reporting
No Change
Section 7 - Design and Construction Revised Presents modifications to the evaporation pond design reflective of the variable source water chemistry. Minor changes to the evaporation pond liner design due to the reduction of pond sizes.
Section 8 - Construction Quality Assurance
No Change
Section 9 - Stormwater Management Revised Provides revisions to stormwater management in response to RWQCB and CEC comments
Section 10 - Operating Requirements
No Change
Section 11 - Environmental Controls Revised Changes to the Action Leakage Rate, the Rapid Large Leakage Rate, and noting that wastewater will not be used for dust suppression.
Section 12 - Inspection Sampling and Maintenance Programs
Revised Provides changes in pond cleanout requirements due to the concentration of TDS in the evaporation ponds for both treatment options.
Section 13 - Required Plans No Change

Beacon Solar Energy Project 3 June 2009
The text, figures and tables in the sections identified above as “revised” are provided in this amendment, along with changes to the Detection Monitoring Program, Corrective Action Plan, Closure and Post-Closure Monitoring Plans for the Evaporation Ponds and Land Treatment Unit (LTU). Table A-1 presents a detailed summary of the amendment and the associated changes to the initial application. The following chapters contain the revised text sections of the RoWD.
Alternative Water Sources
The CEC has concluded from limited historic data that there is a potential source of high TDS groundwater (i.e., TDS concentrations greater than 1,000 parts per million [ppm]) or degraded water north and northwest of Koehn Lake, both north and south of the Garlock Fault. Water supply from this area groundwater the aquifer yield must be able to support seasonal water supply requirements that range up to over 4,000 gallons per minute (gpm) during peak summer demand. The historic data does not clearly indicate that areas with suspected degraded groundwater can yield water at a rate to support the Project. The CEC has therefore proposed to conduct a groundwater sampling program of wells in the area of Koehn Lake to close the data gap. The sampling program has been designed to document existing groundwater quality and provide an understanding of the well production capability. The field program includes obtaining permission from the well owner for access, determining well status and condition, providing a preliminary assessment of well yield, collecting groundwater samples and analyzing them for TDS and other constituents to determine the suitability of water to support the Project. The wells that will be considered are in Sections 7, 8, 17 and 18, and north and south of the Garlock Fault and west of Koehn Lake (see Figure A-1).
The Community of Rosamond currently operates a secondary wastewater treatment facility that generates approximately 1.6 million gallons per day (MGD) of wastewater. A project is currently underway to convert 0.5 MGD of this flow to Title 22 quality tertiary treated reclaimed water by August of this year, and has tentative plans to expand its facility to produce only Title 22 water by the end of 2011. In addition the Rosamond CSD has agreements with the other water districts in the Antelope Valley for purchase and exchange of reclaim water, up to as much as 13 MGD. A total of 3.3 MGD of water is considered by Rosamond to be readily available for commitment in the near term. Total plant water demand, depending on water quality and treatment options, is estimated at 3 MGD during summer peak periods. Initial indications are that the reclaim water quality from Rosamond and their potential secondary suppliers will be of adequate quality for power plant operations, although information on several critical quality parameters is not readily available, but has been requested. In order to use this water, it would be necessary to construct an approximately 40 mile long pipeline.

Table A-1. List of Sections Revised in the March 2009 RoWD ApplicationBeacon Solar Energy Project
Document Section Number Section Title Comments
3.0 Physical Setting No changes4.0 Waste Classification and Management
4.1 Evaporation Ponds Design details were updated. Included discussion on Design Criteria based on total dissolved solids (TDS) concentration.
4.1.1 Recirculation Water Blow Down This section number was changed from 4.1.1 to 4.1.1.1.
4.1.1 Lower-Bound TDS Design New section discussing the addition of the brine concentrator upstream of the waste stream.
4.1.1.1 Recirculation Water Blow Down Section updated to include post-treatment brine concentrator language.
4.1.1.3 Post-Treatment Brine Concentrator New section discussing the Post-Treatment Brine Concentrator and the normal and peak operating conditions.
4.1.2 Ion Exchange Regeneration Stream Section heading changed from 4.1.2 to 4.1.1.2 and posttreatment brine concentrator was added to discussion.
4.1.3 Evaporation Pond Residue Section number changed from 4.1.3 to 4.1.1.4. Updated title and discussion to include waste water.
4.1.1.4 Evaporation Pond Wastewater and Residue Discussion was added to include TDS of wastewater that will be discharged to the evaporation ponds and revised residue quantity and quality.
4.1.4 Land Treatment Unit Run Off Section number changed from 4.1.4 to 4.1.1.5.4.1.5 Miscellaneous Plant Drains Section number changed from 4.1.5 to 4.1.1.6.4.1.2 Upper-Bound TDS Design New section/text added to RoWD.4.1.2.1 Post-Treatment Clarifier New section/text added to RoWD.4.1.2.2 Evaporation Pond Wastewater and Residue New section/text added to RoWD.
4.1.2.3 Land Treatment Unit Run Off and Miscellaneous Plant Drains
New section/text added to RoWD.
4.2 Land Farm Unit and Heat Transfer Fluid-Impacted Soils
Discussion was updated to include information about physical properties of HTF, spill procedures, and waste handling.
4.3.1 Wastewater Section updated with discussions on Lower- and Upper-Bound TDS cases.
4.3.2 Evaporation Pond Residue Section updated with discussions on Lower- and Upper-Bound TDS cases and new table numbers.
4.3.3 Land Treatment Unit Discussion on classification of HTF waste was augmented.
4.4 Unit Classification No changes
4.5 Unit Locations No changes
5.0 Monitoring and Reporting Requirements5.1 Evaporation Pond Monitoring No changes5.1.1 Evaporation Pond Wastewater No changes5.1.2 Evaporation Pond Residue No changes5.1.3 Detection Monitoring No changes5.2 Land Treatment Unit Monitoring No changes5.2.1 Land Treatment Unit - Runoff No changes5.2.2 Heat Transfer Fluid-Contaminated Soil - Land
Treatment UnitNo changes
5.3 Groundwater Monitoring Discussion of water supply for the site was revised to include potential off-site sources.
RoWD APPLICATION
10056-014-155 1 of 7 June 16, 2009

Table A-1. List of Sections Revised in the March 2009 RoWD ApplicationBeacon Solar Energy Project
Document Section Number Section Title Comments
5.3.1 Groundwater Monitoring Network Layout of Regional Groundwater
This section was updated to include details of the revised groundwater monitoring network.
5.3.2 Monitoring Well Sampling No changes5.3.2.1 Background Groundwater Monitoring No changes5.3.2.2 Routine Quarterly Groundwater Monitoring No changes5.3.2.3 Routine Annual Groundwater Monitoring No changes5.3.2.4 Detection Monitoring Program Sampling This section was updated to include details of the
revised detection monitoring program. 5.3.2.5 Potentiometeric Surface Monitoring No changes
6.0 Record Keeping and Reporting Program No changes7.0 Design and Construction Standards
7.1.1 Overview Revised to state anticipated depth of evaporative residue accumulation and to give the surface area of the ponds based on the Upper- and Lower-Bound TDS values.
7.1.2 Description Pond size and depth were revised.
7.1.3 Hard Surface/Protective Layer Minor editorial change.
7.1.4 Liner System No changes
7.1.5 Base Layer No changes
7.1.6 Leak Detection, Collection and Removal System
Design Change - Leak collection trench to collect wastewater and route to the collection sump was removed due to the reduction on pond size from the original application.
7.1.7 Berms and Side Slopes No changes
7.1.8 Material Compatibility No changes
7.2 Engineered Alternative No changes
7.3 Construction Methods and Sequence of the Evaporation Ponds
Removal of reference to leak collection trench .
7.3.1 Moisture Detection System No changes
7.3.2 Site Preparation, Excavation, and Compaction
No changes
7.3.3 Liner System Installation Leak detection system discussion was updated to include a leak detection sump. Discussion on leak collection trench was removed.
7.3.4 Hard Surface/Protective Layer No changes
7.4.1 Overview Discussion on HTF waste classification was added.
7.4.2 Heat Transfer Fluid Treatment Process No changes
7.4.3 LTU Construction Process No changes
7.4.4 Site Preparation, Excavation, and Compaction
No changes
7.5 Grading Plans Revised grading plan provided for the new pond locations.
8.0 No changes9.0 Discussion on the additional stormwater investigations
undertaken was added.
Construction Quality AssuranceStormwater Management
10056-014-155 2 of 7 June 16, 2009
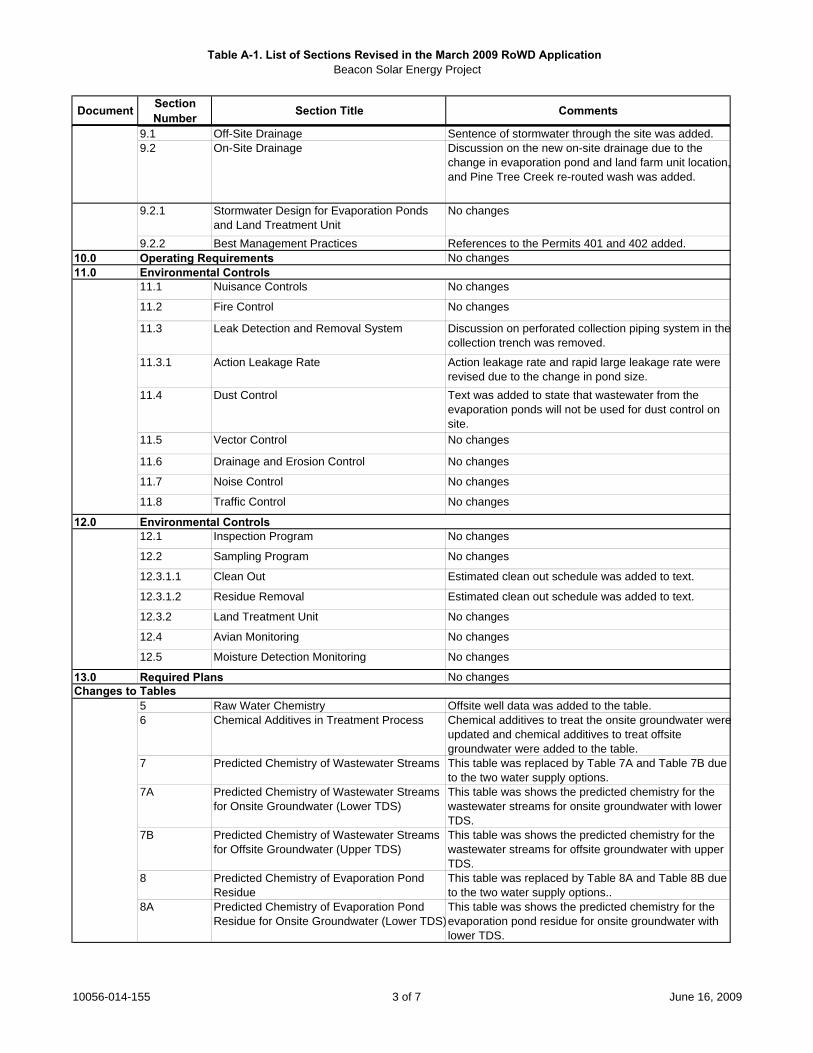
Table A-1. List of Sections Revised in the March 2009 RoWD ApplicationBeacon Solar Energy Project
Document Section Number Section Title Comments
9.1 Off-Site Drainage Sentence of stormwater through the site was added.9.2 On-Site Drainage Discussion on the new on-site drainage due to the
change in evaporation pond and land farm unit location, and Pine Tree Creek re-routed wash was added.
9.2.1 Stormwater Design for Evaporation Ponds and Land Treatment Unit
No changes
9.2.2 Best Management Practices References to the Permits 401 and 402 added.10.0 No changes11.0 Environmental Controls
11.1 Nuisance Controls No changes
11.2 Fire Control No changes
11.3 Leak Detection and Removal System Discussion on perforated collection piping system in the collection trench was removed.
11.3.1 Action Leakage Rate Action leakage rate and rapid large leakage rate were revised due to the change in pond size.
11.4 Dust Control Text was added to state that wastewater from the evaporation ponds will not be used for dust control on site.
11.5 Vector Control No changes
11.6 Drainage and Erosion Control No changes
11.7 Noise Control No changes
11.8 Traffic Control No changes
12.0 Environmental Controls12.1 Inspection Program No changes
12.2 Sampling Program No changes
12.3.1.1 Clean Out Estimated clean out schedule was added to text.
12.3.1.2 Residue Removal Estimated clean out schedule was added to text.
12.3.2 Land Treatment Unit No changes
12.4 Avian Monitoring No changes
12.5 Moisture Detection Monitoring No changes
13.0 No changes
5 Raw Water Chemistry Offsite well data was added to the table.6 Chemical Additives in Treatment Process Chemical additives to treat the onsite groundwater were
updated and chemical additives to treat offsite groundwater were added to the table.
7 Predicted Chemistry of Wastewater Streams This table was replaced by Table 7A and Table 7B due to the two water supply options.
7A Predicted Chemistry of Wastewater Streams for Onsite Groundwater (Lower TDS)
This table was shows the predicted chemistry for the wastewater streams for onsite groundwater with lower TDS.
7B Predicted Chemistry of Wastewater Streams for Offsite Groundwater (Upper TDS)
This table was shows the predicted chemistry for the wastewater streams for offsite groundwater with upper TDS.
8 Predicted Chemistry of Evaporation Pond Residue
This table was replaced by Table 8A and Table 8B due to the two water supply options..
8A Predicted Chemistry of Evaporation Pond Residue for Onsite Groundwater (Lower TDS)
This table was shows the predicted chemistry for the evaporation pond residue for onsite groundwater with lower TDS.
Changes to Tables
Operating Requirements
Required Plans
10056-014-155 3 of 7 June 16, 2009
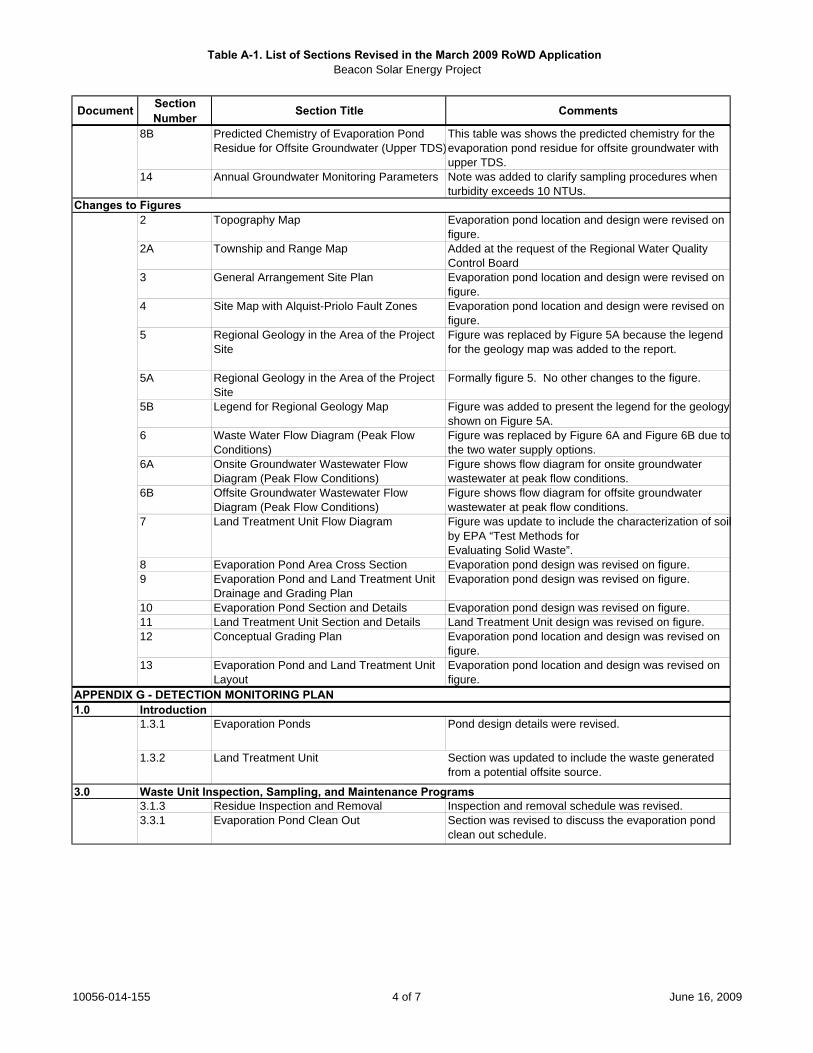
Table A-1. List of Sections Revised in the March 2009 RoWD ApplicationBeacon Solar Energy Project
Document Section Number Section Title Comments
8B Predicted Chemistry of Evaporation Pond Residue for Offsite Groundwater (Upper TDS)
This table was shows the predicted chemistry for the evaporation pond residue for offsite groundwater with upper TDS.
14 Annual Groundwater Monitoring Parameters Note was added to clarify sampling procedures when turbidity exceeds 10 NTUs.
2 Topography Map Evaporation pond location and design were revised on figure.
2A Township and Range Map Added at the request of the Regional Water Quality Control Board
3 General Arrangement Site Plan Evaporation pond location and design were revised on figure.
4 Site Map with Alquist-Priolo Fault Zones Evaporation pond location and design were revised on figure.
5 Regional Geology in the Area of the Project Site
Figure was replaced by Figure 5A because the legend for the geology map was added to the report.
5A Regional Geology in the Area of the Project Site
Formally figure 5. No other changes to the figure.
5B Legend for Regional Geology Map Figure was added to present the legend for the geology shown on Figure 5A.
6 Waste Water Flow Diagram (Peak Flow Conditions)
Figure was replaced by Figure 6A and Figure 6B due to the two water supply options.
6A Onsite Groundwater Wastewater Flow Diagram (Peak Flow Conditions)
Figure shows flow diagram for onsite groundwater wastewater at peak flow conditions.
6B Offsite Groundwater Wastewater Flow Diagram (Peak Flow Conditions)
Figure shows flow diagram for offsite groundwater wastewater at peak flow conditions.
7 Land Treatment Unit Flow Diagram Figure was update to include the characterization of soil by EPA “Test Methods forEvaluating Solid Waste”.
8 Evaporation Pond Area Cross Section Evaporation pond design was revised on figure.9 Evaporation Pond and Land Treatment Unit
Drainage and Grading PlanEvaporation pond design was revised on figure.
10 Evaporation Pond Section and Details Evaporation pond design was revised on figure.11 Land Treatment Unit Section and Details Land Treatment Unit design was revised on figure.12 Conceptual Grading Plan Evaporation pond location and design was revised on
figure.13 Evaporation Pond and Land Treatment Unit
LayoutEvaporation pond location and design was revised on figure.
1.0 Introduction1.3.1 Evaporation Ponds Pond design details were revised.
1.3.2 Land Treatment Unit Section was updated to include the waste generated from a potential offsite source.
3.0 Waste Unit Inspection, Sampling, and Maintenance Programs3.1.3 Residue Inspection and Removal Inspection and removal schedule was revised.3.3.1 Evaporation Pond Clean Out Section was revised to discuss the evaporation pond
clean out schedule.
Changes to Figures
APPENDIX G - DETECTION MONITORING PLAN
10056-014-155 4 of 7 June 16, 2009

Table A-1. List of Sections Revised in the March 2009 RoWD ApplicationBeacon Solar Energy Project
Document Section Number Section Title Comments
4.0 Groundwater Monitoring Discussion on water supply was updated to include an offsite source of groundwater.
4.1.1.1 Groundwater Monitoring Network Layout for Regional Groundwater
Section was updated to include a discussion of the groundwater monitoring network if an offsite source of groundwater is used.
4.1.1.3 GMN Well Rehabilitation and Installation Activities
Section was revised to discuss pumping of offsite wells.
3-1 Anticipated Chemistry of Wastewater Streams
This table was replaced by Table 3-1A and Table 3-1B due to the two water supply options.
3-1A Predicted Chemistry of Wastewater Streams for Onsite Groundwater (Lower TDS)
This table was shows the predicted chemistry for the wastewater streams for onsite groundwater with lower TDS.
3-1B Predicted Chemistry of Wastewater Streams for Offsite Groundwater (Upper TDS)
This table was shows the predicted chemistry for the wastewater streams for offsite groundwater with upper TDS.
3-4 Predicted Chemistry of Evaporation Residue This table was replaced by Table 3-4A and Table 3-4B due to the two water supply options..
3-4A Predicted Chemistry of Evaporation Pond Residue for Onsite Groundwater (Lower TDS)
This table was shows the predicted chemistry for the evaporation pond residue for onsite groundwater with lower TDS.
3-4B Predicted Chemistry of Evaporation Pond Residue for Offsite Groundwater (Upper TDS)
This table was shows the predicted chemistry for the evaporation pond residue for offsite groundwater with upper TDS.
4-2 Summary of 2007 Groundwater Analytical Results - Wells 43, 48, and 63
This table was renumbered as Table 4-2A. No other changes were made.
4-2A Summary of 2007 Groundwater Analytical Results - Wells 43, 48, and 63
Formerly Table 4-2.
4-2B Raw Water Chemistry Table shows onsite and offsite well data.4-3 Chemical Additives in Treatment Process Chemical additives to treat the onsite groundwater were
updated and chemical additives to treat offsite groundwater were added to the table.
1-2 General Arrangement Site Plan Evaporation pond location and design were revised on figure.
1-7 Site Map with Alquist-Priolo Fault Zones Evaporation pond location and design were revised on figure.
1-8 Evaporation Pond and Land Treatment Unit Layout
Evaporation pond location and design were revised on figure.
1-9 Topography Map Evaporation pond location and design were revised on figure.
1-10 Evaporation Pond Section and Details Evaporation pond design was revised on figure.4-1 Groundwater Monitoring Network Figure number was changed to Figure 4-1A.4-1A Groundwater Monitoring Network Formerly Figure 4-1. Pond Locations and GMN were
revised.4-1B Groundwater Monitoring Network Figure shows the revised GMN and groundwater
gradient if offsite wells are used as the water supply.
APPENDIX I - CORRECTIVE ACTION PLAN 1.0
1.3 Waste Handling Facilities The figure reference in this section was changed from Figure 1-9 to Figure 1-8.
1.3.1 Evaporation Ponds Design details were updated.1.3.2 Land Treatment Unit Section was updated to include the waste generated
from a potential offsite source.
Changes to Figures
Changes to Tables
Introduction
10056-014-155 5 of 7 June 16, 2009

Table A-1. List of Sections Revised in the March 2009 RoWD ApplicationBeacon Solar Energy Project
Document Section Number Section Title Comments
3.0 Corrective Action Plan3.2 Groundwater Corrective Actions Section was updated to include a discussion of potentia
offsite groundwater source.3.2.2 Regional Groundwater Revised with details of the groundwater monitoring
network based on the new pond locations.
1-2 Anticipated Chemistry of Wastewater Streams
This table was replaced by Table 1-2A and Table 1-2B.
1-2A Predicted Chemistry of Wastewater Streams for Onsite Groundwater (Lower TDS)
This table was shows the predicted chemistry for the wastewater streams for onsite groundwater with lower TDS.
1-2B Predicted Chemistry of Wastewater Streams for Offsite Groundwater (Upper TDS)
This table was shows the predicted chemistry for the wastewater streams for offsite groundwater with upper TDS.
1-2 General Arrangement Site Plan Evaporation pond location and design were revised on figure.
1-7 Site Map with Alquist-Priolo Fault Zones Evaporation pond location and design were revised on figure.
1-8 Evaporation Pond and Land Treatment Unit Drainage and Grading Plan
Evaporation pond design was revised on figure.
1-9 Topography Map Evaporation pond location and design were revised on figure.
1-10 Evaporation Pond Section and Details Evaporation pond design was revised on figure.1-11 Groundwater Monitoring Network Figure number was changed to Figure 1-11A.1-11A Groundwater Monitoring Network Formerly Figure 1-11. Pond Locations and GMN were
revised.1-11B Groundwater Monitoring Network Figure shows the revised GMN and groundwater
gradient if offsite wells are used as the water supply.
APPENDIX J - ACTION LEAKAGE RATEALR Calculation 2 Calculation was revised pond depth has increased to 8
feet.
2.0 Site Background2.1 Evaporation Ponds Design details were updated.
3.0 Closure Strategy3.2.2 Wastewater Disposal/Use Section revised to state that wastewater will not be
used for dust control.4.0 Additional Information
4.3 Cost Analysis The cost for the closure of the evaporation ponds was revised to account for the new design.
APPENDIX K - PRELIMINARY CLOSURE PLAN FOR EVAPORATION PONDS
Changes to Tables
Changes to Figures
10056-014-155 6 of 7 June 16, 2009

Table A-1. List of Sections Revised in the March 2009 RoWD ApplicationBeacon Solar Energy Project
Document Section Number Section Title Comments
No changes
2-1 General Arrangement Site Plan Evaporation pond location and design were revised on figure.
2-2 Topography Map Evaporation pond location and design were revised on figure.
2-3 Evaporation Pond Cross Section Evaporation pond design was revised on figure.2-4 Evaporation Pond Section and Details Evaporation pond design was revised on figure.
Changes to Appendix ACost estimate was updated based on the revised pond design.
APPENDIX L - PRELIMINARY CLOSURE PLAN FOR LAND TREATMENT UNIT
2-1 General Arrangement Site Plan Evaporation pond location and design were revised on figure.
2-2 Topography Map Evaporation pond location and design were revised on figure.
2.0 Site Background2.1.1 Evaporation Ponds Design details were updated.
3.0 Closure Strategy3.1.1 Groundwater Monitoring Revised to include discussion of offsite wells.
2-1 Anticipated Chemistry of Wastewater Streams
This table was replaced by Table 2-1A and Table 2-1B.
2-1A Predicted Chemistry of Wastewater Streams for Onsite Groundwater (Lower TDS)
This table was shows the predicted chemistry for the wastewater streams for onsite groundwater with lower TDS.
2-1B Predicted Chemistry of Wastewater Streams for Offsite Groundwater (Upper TDS)
This table was shows the predicted chemistry for the wastewater streams for offsite groundwater with upper TDS.
3-1 Groundwater Sample Analytical Parameters - Semi-Annual Monitoring
Note was added to clarify sampling procedures when turbidity exceeds 10 NTUs.
3-2 Groundwater Sample Analytical Parameters - Annual Monitoring
Note was added to clarify sampling procedures when turbidity exceeds 10 NTUs.
2-1 Evaporation Pond and Land Treatment Unit Layout
Evaporation pond and LTU locations and design was revised on figure.
2-2 Topography Map Evaporation pond and LTU locations and design was revised on figure.
2-3 Conceptual Site Grading Plan Evaporation pond and LTU locations and design was revised on figure.
2-4 Evaporation Pond and Land Treatment Unit Drainage and Grading Plan
Evaporation pond and LTU locations and design was revised on figure.
2-5 Evaporation Pond Section and Details Evaporation pond location and design were revised on figure.
3-1 Groundwater Monitoring Network Figure number was changed to Figure 3-1A.3-1A Groundwater Monitoring Network Formerly Figure 3-1. Pond Locations and GMN were
revised.3-21B Groundwater Monitoring Network Figure shows the revised GMN and groundwater
gradient if offsite wells are used as the water supply.
Changes to Tables
APPENDIX M - PRELIMINARY POST-CLOSURE PLAN FOR EVAPORATION PONDS AND LAND TREATMENT UNIT
Changes to Figures
Changes to Figures
Changes to Tables
Changes to Figures
10056-014-155 7 of 7 June 16, 2009
Beacon Solar Energy Project 4 June 2009
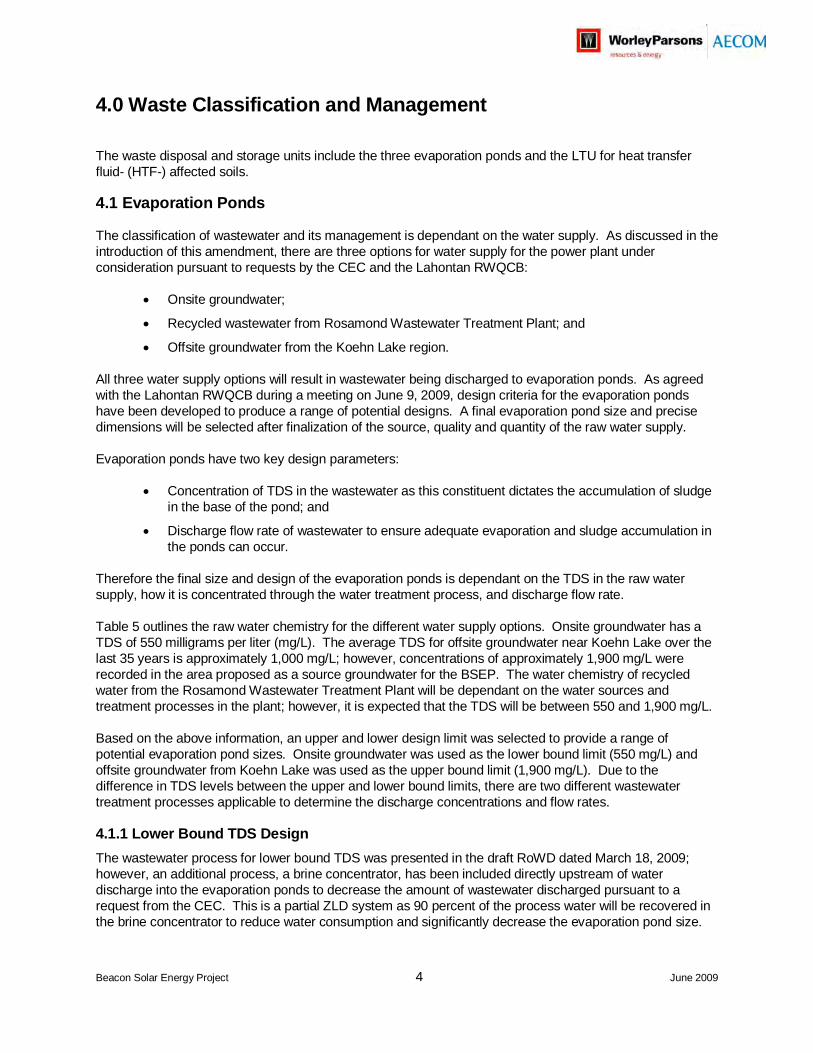
4.0 Waste Classification and Management
The waste disposal and storage units include the three evaporation ponds and the LTU for heat transfer fluid- (HTF-) affected soils.
4.1 Evaporation Ponds
The classification of wastewater and its management is dependant on the water supply. As discussed in the introduction of this amendment, there are three options for water supply for the power plant under consideration pursuant to requests by the CEC and the Lahontan RWQCB:
Onsite groundwater;
Recycled wastewater from Rosamond Wastewater Treatment Plant; and
Offsite groundwater from the Koehn Lake region.
All three water supply options will result in wastewater being discharged to evaporation ponds. As agreed with the Lahontan RWQCB during a meeting on June 9, 2009, design criteria for the evaporation ponds have been developed to produce a range of potential designs. A final evaporation pond size and precise dimensions will be selected after finalization of the source, quality and quantity of the raw water supply.
Evaporation ponds have two key design parameters:
Concentration of TDS in the wastewater as this constituent dictates the accumulation of sludge in the base of the pond; and
Discharge flow rate of wastewater to ensure adequate evaporation and sludge accumulation in the ponds can occur.
Therefore the final size and design of the evaporation ponds is dependant on the TDS in the raw water supply, how it is concentrated through the water treatment process, and discharge flow rate.
Table 5 outlines the raw water chemistry for the different water supply options. Onsite groundwater has a TDS of 550 milligrams per liter (mg/L). The average TDS for offsite groundwater near Koehn Lake over the last 35 years is approximately 1,000 mg/L; however, concentrations of approximately 1,900 mg/L were recorded in the area proposed as a source groundwater for the BSEP. The water chemistry of recycled water from the Rosamond Wastewater Treatment Plant will be dependant on the water sources and treatment processes in the plant; however, it is expected that the TDS will be between 550 and 1,900 mg/L.
Based on the above information, an upper and lower design limit was selected to provide a range of potential evaporation pond sizes. Onsite groundwater was used as the lower bound limit (550 mg/L) and offsite groundwater from Koehn Lake was used as the upper bound limit (1,900 mg/L). Due to the difference in TDS levels between the upper and lower bound limits, there are two different wastewater treatment processes applicable to determine the discharge concentrations and flow rates.
4.1.1 Lower Bound TDS Design
The wastewater process for lower bound TDS was presented in the draft RoWD dated March 18, 2009; however, an additional process, a brine concentrator, has been included directly upstream of water discharge into the evaporation ponds to decrease the amount of wastewater discharged pursuant to a request from the CEC. This is a partial ZLD system as 90 percent of the process water will be recovered in the brine concentrator to reduce water consumption and significantly decrease the evaporation pond size.

Beacon Solar Energy Project 5 June 2009
The sources, processes and flow rates for generating the wastewater streams are discussed in this section. Discharge to the post-treatment brine concentrator and the evaporation ponds is derived from two primary sources and one occasional source, listed as follows:
Blow down of circulating water from the cooling tower;
Wastewater flow from the ion exchange regeneration stream; and
Occasional stormwater accumulated in the proposed LTU that will be used to treat soil affected by spills of HTF.
The discharge flow rates for the wastewater sources are provided on revised Figure 6A, Onsite Groundwater Wastewater Flow Diagram (Peak Flow Conditions). The sources, and processes generating the wastewater stream disposed in the ponds and their relative contributions are outlined in the following sections and shown on revised Figure 6A.
The highest discharge flow rate into the evaporation ponds (52 gallons per minute [gpm]) occurs in the summer months, between May and August when solar energy production is at a peak. Year-round, discharge flow rates average 44 gpm. Revised Table 7A shows the anticipated chemistry for the wastewater streams.
4.1.1.1 Recirculating Water Blow Down
Blow down of circulating water from the Project’s cooling system makes up approximately 45 percent (240 gpm under summer peak operating conditions and 197 gpm under normal [average] operating conditions) of the wastewater routed to the post-treatment brine concentrator. The circulating water in the cooling tower will be sourced from a combination of raw water makeup (10 percent), pre-treated water (89 percent), and small amount (1 percent) of blow down from the solar steam generator (SSG). In addition, process water from project drains will occasionally be routed to the cooling tower.
The composition of the makeup water allows the water to be cycled up to approximately 15 cycles of concentration before the concentration of chemical constituents rises to levels where it becomes unusable and it is blown down into the post-treatment brine concentrator.
The circulating water will be chemically treated to minimize the growth of bacteria, the formation of scale, and the corrosion of the cooling tower fill and condenser tubes. Revised Table 6, Chemical Additives in Treatment Process, provides a summary of the chemical additives proposed for water treatment use. These chemical additives include a biocide (sodium hypochlorite is the most common chemical to control biological growth), a pH control solution (i.e., hydrochloric acid or sulfuric acid), a scale inhibitor (i.e., organic phosphates) and a corrosion inhibitor (i.e., phosphate and zinc).
As noted above, blow down from the SSG will be added to the circulating water system and accounts for approximately 1 percent of the makeup water. This water will have been chemically treated for pH control (generally with amine or ammonia), oxygen scavenging (hydrazine or carbohydrazine), and pH buffering (phosphate-treatment) (refer to Revised Table 6). The chemical treatment is intended to reduce corrosion rates and corrosion product transport to protect the critical components, including the boiler(s) and the turbine(s), in the steam cycle. No significant wastewater is expected from the Mixed Bed Demineralizer system because the media are regenerated off site except for a small volume of infrequently generated flow during the media rinse prior to startup.
4.1.1.2 Ion Exchange Regeneration Stream
Wastewater from regeneration of ion exchange resins associated with the Project’s water pre-treatment system makes up approximately 55 percent (279 gpm under summer peak operating conditions and 239 gpm under normal operating conditions) of the wastewater routed to the post-treatment brine concentrator.

Beacon Solar Energy Project 6 June 2009
The demineralizer units are used to purify the incoming well water via ion exchange with cation exchange resins that remove positively-charged ions including calcium, magnesium, iron, and manganese. Anion exchange resins remove negatively-charged ions including chloride, sulfate, nitrate and silica. The system is divided into three main components: the cation exchange vessels, a degasifier, and the anion exchange vessels, with regenerant waste coming from the ion exchange vessel regeneration steps. The following information explains these three components in more detail:
Cation Exchange Vessel: The initial flow from the raw and fire water storage tanks is directed to the cation exchange vessel, which contains strong acid cation resins in the hydrogen (H+) form. Positively charged species, including hardness elements calcium and magnesium, and metals, such as iron, nickel, and chromium, are removed by the cation exchange resin, and exchanged with hydrogen ions, which create an acidic effluent from this vessel.
Degasifier: The degasifier takes the acidic cation exchange vessel effluent and, via countercurrent flow with air, strips carbon dioxide gas from the liquid, thus removing alkalinity from the water and reducing the potential of scale formation when the treated water is cycled up in other project components.
Anion Exchange Vessel: The flow from the degasifier is directed to the anion exchange vessel, containing strong base anion resins in the hydroxide (OH-) form. Negatively charged species including chloride, sulfate, silica, and nitrate are removed by the anion exchange resin, and exchanged with hydroxide ions, which neutralize the excess hydrogen ions from the cation exchange vessel and create treated water.
The pH within the neutralization tank may be too low during the cation ion exchange, which may require small amounts of sodium hydroxide to be added. Alternatively, the pH may be too high during the anion exchange, which may require small amounts of sulfuric acid to be added.
4.1.1.3 Post-Treatment Brine Concentrator
As outlined in the above sections, two wastewater streams, cooling tower blowdown, and the regeneration of the ion exchange resin are routed to a brine concentrator where water is boiled off from the feed stream, and a slurry high in dissolved solids is discharged to the evaporation ponds. The combined feed into the brine concentrator is 518 gpm under summer peak operating conditions and 436 gpm under normal operating conditions.
4.1.1.4 Evaporation Pond Wastewater and Residue
As shown in Revised Table 7A, the wastewater discharging into the evaporation ponds will have a TDS concentration of approximately 70,000 mg/L at a summer peak discharge rate of 52 gpm and annual average discharge rate of 44 gpm. To cater for this volume of water and TDS concentration, 6 acres (top area) of evaporation ponds are required (refer to Section 7 for design parameters). During the 30-year operating life of the Project, it is estimated that up to 20 feet of residue may accumulate in the bottoms of the evaporation ponds that consists of precipitated solids from the evaporated wastewater. For safety and operational purposes, the ponds will be cleaned when there are 3 feet of precipitated solids accumulated in the base of the ponds, which is estimated to be every 4.5 years. Approximately 23,000,000 pounds of evaporative residue would be removed during each cleanout event. The total amount of accumulated residue is estimated to be approximately 150,000,000 pounds over 30 years. The predicted chemical makeup of the residue, based on information about the raw water chemistry and knowledge of the water use and treatment processes at the Project, is summarized in Revised Table 8A, Predicted Chemistry of Evaporation Pond Residue.
4.1.1.5 Land Treatment Unit Run Off
Stormwater may occasionally accumulate in the LTU used to treat HTF-affected soil at the site. This stormwater would be pumped to the evaporation ponds only after visual observation establishes that the

Beacon Solar Energy Project 7 June 2009
water is free from HTF product and sheen. Based on conditions at similar sites, it is anticipated that such discharge, if necessary, would only occur approximately once every three to five years.
4.1.1.6 Miscellaneous Plant Drains
Plant drains will occasionally discharge wastewater to the circulating water system. This discharge will contain water from component wash down and cleaning, potential miscellaneous leaks and draining of project equipment, condensation from project equipment, and other sources. Water from these areas will be collected in a system of floor drains, sumps, and pipes and routed to the wastewater collection system. This water will be routed through an oil-water separator to capture potential oil and prevent it from reaching the circulating water system.
4.1.2 Upper Bound TDS Design
Due to the high concentration of TDS in the makeup water for the upper-bound design case (using groundwater from the Koehn Lake region), the use of ion exchange pre-treatment becomes difficult due to the need for frequent regenerations of the resin material, and the size of the required ion exchange vessels. Therefore, a clarifier is used for pre-treatment instead, which will decrease the silica concentration and reduce the hardness of the water. A clarifier is also used to treat the cooling tower water blowdown to enable 15 cycles of concentration.
The discharge flow rates for the wastewater sources are provided on revised Figure 6B, Offsite Groundwater Wastewater Flow Diagram (Peak Flow Conditions). The sources, and processes generating the wastewater stream disposed in the ponds and their relative contributions are outlined in the following sections and shown on revised Figure 6B. The waste stream routed to the evaporation ponds is from the post-treatment clarifier, which generates approximately 56 gpm during peak operating hours and 46 gpm during normal operating hours. It will be a slurry concentrated to approximately 10 percent solids. Refer to revised Table 6 for the list of chemical compounds added to this treatment process.
4.1.2.1 Post-Treatment Clarifier
The post-treatment clarifier is designed for treatment of the cooling tower blowdown, which has been cycled up approximately 10 cycles of concentration from the Treated Water Storage Tank. A series of tanks will be chemically treated with lime (Ca(OH)2), soda ash (Na2CO3), caustic (NaOH), ferric chloride (FeCl2), and polymer and vigorously mixed to allow precipitates to form, and then allowed to settle in a clarifier. The settled sludge slurry will be discharged to the evaporation ponds, while the remaining product would be pumped to a multi-media filter (MMF) for removal of the outstanding solids. Upon discharge from the MMF, most of the remaining hardness will be removed in a weak acid cation (WAC) ion exchange softener, which will be regenerated with hydrochloric acid, and then with sodium hydroxide to be in the sodium form. The WAC is intended to remove metals and hardness. The remaining product containing silica and TDS will be discharged to a reverse osmosis unit where the remaining species are greatly reduced in the product stream, containing approximately 85 percent of the flow, while the waste stream, containing 25 percent of the flow, will contain the majority of the silica and TDS and will be fed to the evaporation ponds.
4.1.2.2 Evaporation Pond Wastewater and Residue
As shown in Revised Table 7B, the wastewater discharging into the evaporation ponds will have a TDS of approximately 110,951 mg/L TDS at a summer peak discharge rate of 56 gpm and annual average discharge rate of 46 gpm. To cater to this volume, 8 acres (top area) of evaporation ponds are required (refer to Section 7 for design parameters). During the 30-year operating life of the Project, it is estimated that up to 24 feet of residue may accumulate in the bottoms of the evaporation ponds that consist of precipitated solids from the evaporated wastewater. For safety and operational purposes, the ponds will be cleaned when 3 feet of precipitated solids are accumulated in the base of the ponds, which is estimated to be every 3.8 years. Approximately 38,000,000 pounds of evaporative residue would be removed during each cleanout event. The total amount of accumulated residue is estimated to be approximately 300,000,000 pounds over thirty years. The predicted chemical makeup of the residue, based on information
Beacon Solar Energy Project 8 June 2009
about the raw water chemistry and knowledge of the water use and treatment processes at the Project, is summarized in Revised Table 8b, Predicted Chemistry of Evaporation Pond Residue.
4.1.2.3 Land Treatment Unit Run Off and Miscellaneous Plant Drains
Similar to the lower bound TDS design, LTU run off may be pumped into the evaporation ponds and plant drains may occasionally discharge wastewater into the circulating water system (refer Section 4.1.1.5 and 4.1.1.6).
4.2 Land Treatment Unit and Heat Transfer Fluid-Impacted Soils
The LTU will be used to treat HTF-affected soil at various concentrations. HTF (Therminol VP-1 or equivalent) is an oil that consists of a mixture of biphenyl and diphenyl oxide that is solid at temperatures below 54 degrees Fahrenheit, is relatively insoluble in water (solubility of approximately 25 mg/L), combustible, and has relatively low volatility (Solutia 2006). The components of HTF are reported to biodegrade relatively rapidly in the environment, have slight toxicity to tested terrestrial species, higher toxicity to tested aquatic species, and a potential to bio-accumulate (IPCS 1999; JECFA 2003; SOCMA Biphenyl Working Group 2003).
A process flow diagram showing the management and treatment of the HTF-affected soil is presented in Revised Figure 7, Land Treatment Unit Flow Diagram. Spills of HTF will be cleaned up within 48 hours and affected soil will be moved to a staging area in the LTU where it will be covered with plastic sheeting pending receipt of analytical results and characterization of the waste material. Samples of excavated HTF-affected soil will be collected in accordance with the U.S. Environmental Protection Agency’s (USEPA’s) current version of the manual “Test Methods for Evaluating Solid Waste” (SW-846) and the waste material would be characterized in accordance with State and Federal requirements. Samples would be analyzed for HTF using modified USEPA Method 8015. Initially, samples would also be analyzed for ignitability and toxicity using appropriate State and Federal methods to characterize the waste as hazardous or non-hazardous. Once a sufficient data set has been accumulated to allow characterization of the material as hazardous or non-hazardous based on HTF content and generator knowledge, the DTSC will be petitioned for a determination of waste classification for HTF-affected soils generated at the facility. Following this determination, subsequent samples would only be analyzed for HTF to make this determination. At the Kramer Junction SEGS facility, DTSC issued a letter dated April 4, 1995 stating that soil contaminated with HTF “poses an insignificant hazard” and classifies the waste as non-hazardous for soils with a concentration of less than 10,000 mg/kg HTF pursuant to CCR Title 22, Section 66260.200(f). While this information from Kramer Junction alone may not be sufficient to characterize the waste material generated at the BSEP, Beacon anticipates that future waste characterization at BSEP will yield a similar result.
If the soil is characterized as a hazardous waste (refer to Section 4.3.3), the impacted soils will be transported from the site by a licensed hazardous waste hauler for disposal at a licensed hazardous waste landfill. No HTF-impacted soils characterized as hazardous waste will be disposed or treated on site. Based on past experience, it is anticipated that soil containing 10,000 milligrams per kilogram (mg/kg) HTF or more will be managed as hazardous waste, and that soil containing less than 10,000 mg/kg HTF will be non-hazardous waste and can be managed at the site. If the soil is characterized as a non-hazardous waste, it will be spread in the LTU for bioremediation treatment. In general, more highly contaminated soil will be covered with plastic sheeting to prevent contact with stormwater and to control potential odors and emissions, as well as for moisture and temperature retention. Once the soil has been treated to a concentration of less than 100 mg/kg HTF, it will be moved from the LTU to another portion of the site until it is reused at the facility as fill material.
Based on available operation data from other sites, it is anticipated that approximately 750 cubic yards (on average) of HTF-affected soil may be treated per year. Larger or smaller quantities could be generated during some years, depending on the frequency and size of leaks and spills.

Beacon Solar Energy Project 9 June 2009
A spill prevention, control, and countermeasure (SPCC) plan will be undertaken for the Project (refer to Section 13.4 for details). Periodically, equipment failures in and around mirror fields are expected at the Project resulting in spills of HTF onto soil. Spills greater than 25 gallons are required to be reported to the Lahontan RWQCB.
4.3 Waste Classification
4.3.1 Wastewater
Lower Bound TDS Case: The concentrations of chemical constituents in the wastewater discharge to the evaporation ponds using the onsite groundwater (lower bound TDS) is provided in revised Table 7A. The wastewater concentrations have been compared to the Soluble Threshold Limit Concentrations (STLCs) as reported in the California Code of Regulations (CCR) Title 22, Chapter 11, Division 4.5, Article 3, Section 66261.24 “Characteristics of Toxicity”, and compared to Toxicity Characteristic Leaching Procedure (TCLP) values as reported in the Code of Federal Regulations (CFR) Part 261, Section 261.24. The concentration of chemical constituents in wastewater discharging into the evaporation ponds is less than the STLC and TCLP for all reported parameters; therefore, the wastewater is not considered a hazardous waste under State or Federal regulations.
Upper Bound TDS Case: Currently, there is not sufficient data to fully characterize the higher bound TDS water from the Koehn Lake region. A sample from a well collected in 1976 with a TDS of 1,900 mg/L was used to generate the process flow diagram for this option and represent the upper bound design condition. However as shown in revised Table 7B, the wastewater concentration of fluoride derived from this water exceeds the STLC; therefore, this sample would produce hazardous wastewater. Data to determine the concentrations of other hazardous constituents were not available, so it is not known whether other constituents could also be present at concentrations exceeding State or Federal hazardous waste thresholds. The Toxic Pits Cleanup Act (TPCA) prohibits the discharge of liquid hazardous waste into a surface impoundment in California. It should be noted that the fluoride concentration in the 1976 design sample was 9.3 mg/L, yet the average fluoride concentration in all samples from the wells in the area in the last 35 years was 0.89 mg/L and would produce wastewater that contains fluoride at concentrations below the hazardous waste threshold. Therefore, for design purposes, it is assumed that raw water that will not produce hazardous wastewater is available in the Koehn Lake region and will be used for the Project. The characteristics of the produced wastewater would be considered in selecting a final raw water source or sources for the Project, and a raw water source that would result in the generation of hazardous wastewater would not be utilized.
It would be theoretically possible to use high TDS raw water from Koehn Lake that could produce hazardous wastes, but maintain discharge concentrations below hazardous waste thresholds by using fewer cycles of concentration in the recirculating cooling system. However, this option is not acceptable as the hazardous constituents would increase in concentration in the evaporation ponds over time, possibly creating hazardous wastewater in the evaporation pond, which is a violation of the TPCA.
The option of adding a treatment system at the end of the wastewater process to remove hazardous levels of constituents will be energy intensive, not cost effective, and would produce very large quantities of hazardous solid waste that would need to be regularly disposed of off site.
The California Water Code Section 13173 defines a designated waste as:
a) Hazardous waste that has been granted a variance from hazardous waste management requirements pursuant to Section 25143 of the Health and Safety Code; or
b) Nonhazardous waste that consists of, or contains, pollutants that, under ambient environmental conditions at a waste management unit, could be released in concentrations exceeding applicable water quality objectives, or that could reasonably be expected to affect beneficial uses of the waters of the state as contained in the appropriate state water quality control plan.

Beacon Solar Energy Project 10 June 2009
The wastewater discharging into the evaporation ponds will be non hazardous; however, it will contain pollutants which could exceed water quality objectives of the affected Water of the State (groundwater) if released, or that could be expected to affect the beneficial uses of Waters of the State. Therefore, the wastewater will be classified as a “designated waste.” This classification is consistent with CCR Title 27, Chapter 3, Subchapter 2, Article 2, Section 20210.
4.3.2 Evaporation Pond Residue
The total concentrations of chemical constituents expected in the evaporation pond sludge that will accumulate in the ponds during operation using onsite groundwater (lower bound TDS) are provided in revised Table 8A, Predicted Chemistry of Evaporation Pond Residue.
The concentrations in the evaporation pond residue have been compared to the STLCs and the Total Threshold Limit Concentrations (TTLCs) as reported in the CCR, Title 22, Chapter 11, Division 4.5, Article 3, Section 66261.24 “Characteristics of Toxicity”. Table 7 also includes the TCLP as reported under CFR Part 261 Section 261.24.
The total concentrations of chemical constituents in the evaporation pond residue are less than the TTLC for all reported parameters. The total concentrations of chemical constituents in the evaporation pond residue in the ponds is less than 10 times the STLC for reported parameters; therefore, further analysis of the residue using the Waste Extraction Test is not be required and the waste may be classified as nonhazardous under CCR Title 22, Division 4.5. In addition, the total concentrations of chemical constituents in the evaporation pond residue in the ponds is less than the TCLP for all reported parameters; therefore, further analysis of the residue using the TCLP method would not be required and the waste may be considered a non-hazardous waste under Federal regulations. Testing of this material will be conducted as part of the facility monitoring program (Section 5.1.2) to verify this characterization. The evaporation pond residue accumulated in the ponds is non hazardous; however, it does contain pollutants which could exceed water quality objectives if released, or that could be expected to affect the beneficial uses of Waters of the State. Therefore, the evaporation pond residue is classified as a “designated waste.” This classification is consistent with CCR Title 27, Chapter 3, Subchapter 2, Article 2, Section 20210.
The mass of chemical constituents expected in the evaporation sludge that will accumulate in the ponds during operation using offsite groundwater (upper bound TDS) is provided in Table 8B. The concentration of additional chemical constituents in the residue can not be calculated until there are sufficient data to characterize the raw water. The characteristics of the generated solids will be considered in final selection of a raw water source for the project, and water sources that would result in the generation of hazardous waste residue will not be considered.
4.3.3 Land Treatment Unit
The HTF-impacted soils must be characterized as hazardous or non hazardous waste prior to determination of whether the material can be treated at the site or must be removed for offsite disposal. Therefore HTF-impacted soils will be relocated to the staging area (refer Section 4.2) and characterized in accordance with California and Federal law. Samples of excavated HTF-affected soil will be collected in accordance with the USEPA’s current version of the manual “Test Methods for Evaluating Solid Waste” (SW-846) and the waste material would be characterized in accordance with State and Federal requirements. Samples would be analyzed for HTF using modified USEPA Method 8015. Initially, samples would also be analyzed for ignitability and toxicity using appropriate State and Federal methods to verify generator knowledge and characterize the waste as hazardous or non-hazardous. Once a sufficient data set has been accumulated to allow characterization of the material as hazardous or non-hazardous based on HTF content and generator knowledge, the DTSC will be petitioned for a determination of waste classification for HTF-affected soils generated at the facility. Following this determination, subsequent samples would only be analyzed for HTF to make this determination. If the soil is characterized as a hazardous waste, the impacted soils will be transported from the site by a licensed hazardous waste hauler for disposal at a
Beacon Solar Energy Project 11 June 2009
licensed hazardous waste landfill. No HTF-impacts soils characterized as hazardous waste will be disposed or treated on site.
Based on past experience with a similar waste stream at a similar facility in the same county, it is anticipated that soil containing 10,000 mg/kg HTF or more will be managed as hazardous waste, and that soil containing less than 10,000 mg/kg HTF will be non-hazardous waste and can be managed at the site. At the Kramer Junction SEGS facility, the Department of Toxic Substances Control (DTSC) issued a letter dated April 4, 1995, stating that soil contaminated with HTF “poses an insignificant hazard” and classifies the waste as non-hazardous for soils with a concentration of less than 10,000 ppm HTF pursuant to CCR Title 22, Section 66260.200(f). Given the formulation of HTF has not changed significantly, it is anticipated that future waste characterization at BSEP will yield a similar result.
All HTF-affected soil classified as a hazardous waste will be removed for the site for proper offsite disposal; therefore the material in the LTU will be managed as a non-hazardous “designated waste” as defined in CCR Title 23, Chapter 15, Section 2522. Appendix E, DTSC Classification of Contaminated Soil, provides the documentation from the DTSC. Material Safety Data Sheets (MSDS) for HTF are provided in Appendix F, MSDS for HTF.
Based on waste discharge requirements for similar sites, soil containing HTF in concentrations less than 100 mg/kg will not be regulated as a waste when reused as fill at the Facility.
4.4 Unit Classification
No Changes to RoWD documentation from March 18, 2009.
4.5 Unit Locations
No Changes to RoWD documentation from March 18, 2009.
Beacon Solar Energy Project 12 June 2009
5.0 Monitoring and Reporting Requirements
5.1 Evaporation Pond Monitoring
No Changes to RoWD documentation from March 18, 2009.
5.1.1 Evaporation Pond Wastewater
No Changes to RoWD documentation from March 18, 2009.
5.1.2 Evaporation Pond Residue
No Changes to RoWD documentation from March 18, 2009.
5.1.3 Detection Monitoring
No Changes to RoWD documentation from March 18, 2009.
5.2 Evaporation Pond Monitoring
No Changes to RoWD documentation from March 18, 2009.
5.2.1 Land Treatment Unit - Runoff
No Changes to RoWD documentation from March 18, 2009.
5.2.2 Heat Transfer Fluid-Contaminated Soil - Land Treatment Unit
No Changes to RoWD documentation from March 18, 2009.
5.3 Groundwater Monitoring
In accordance with CCR Title 27, Chapter 3, Subchapter 3, Article 1, Section 20380, a groundwater monitoring network (GMN) will be established at the site to monitor groundwater for impacts from potential releases from the three proposed evaporation ponds and the proposed LTU. The proposed GMN will consist of a combination of existing onsite and offsite wells and three new proposed onsite monitoring wells. The GMN and the sampling schedule is discussed in the Detection Monitoring Plan (Appendix G) (AECOM 2009).
To provide water to the proposed facility, Beacon Solar proposes to use onsite water supply by alternately pumping wells 49 and 63 as the primary water supply wells. Wells 41 and 42 will be used as backup water sources, should either of the two primary wells require shutdown for maintenance or be damaged/destroyed. As noted above, BSEP is exploring alternative offsite water supply sources, which include recycled wastewater from Rosamond Wastewater Treatment Plant or groundwater from the Koehn Lake region in response to CEC PSA comments. A list of chemical additives that are anticipated to be added to the process water on a regular basis is presented on Table 6.
5.3.1 Groundwater Monitoring Network Layout of Regional Groundwater
The proposed GMN layout includes three categories of monitoring wells: 1) background wells which are located upgradient of the evaporation ponds and LTU; 2) detection wells, which are located adjacent to the evaporation ponds and LTU; and 3) compliance wells, which are located near the property boundaries. For both onsite and offsite water supply scenarios, the detection wells are comprised of three proposed wells (MW-1 through MW-3) located immediately adjacent to the evaporation ponds and LTU.
Beacon Solar Energy Project 13 June 2009
The GMN layouts for the two water supply scenarios are:
Onsite Water Supply (Figure 4-1A):
Background Wells – 47, Domestic Well, 50 and USGS. As shown in Figure 4-1A, a cone of depression will develop under the evaporation ponds and LTU due to the location of primary pumping Wells 49 and 63 and backup wells 41 and 42. Under pumping conditions, groundwater is predicted to move toward the primary pumping well(s) from all points of the compass. Thus all wells become background wells
Detection Well – MW-1, MW-2 and MW-3
Compliance Wells – The compliance well will be the well that is active, either 49, 63, 41 or 42.
Offsite Water Supply (Figure 4-1B):
Background Wells – 47, Domestic Well and 41
Detection Wells – MW-1, MW-2 and MW-3
Compliance Wells – 50, 51 and USGS
5.3.2 Monitoring Well Sampling
No Changes to RoWD documentation from March 18, 2009.
5.3.2.1 Background Groundwater Monitoring
No Changes to RoWD documentation from March 18, 2009.
5.3.2.2 Routine Quarterly Groundwater Monitoring
No Changes to RoWD documentation from March 18, 2009.
5.3.2.3 Routine Annual Groundwater Monitoring
No Changes to RoWD documentation from March 18, 2009.
5.3.2.4 Detection Monitoring Program Sampling
Each groundwater monitoring well in the GMN will be analyzed for the analytes listed in Tables 14 and 15, on an annual and quarterly basis, respectively. In the onsite water supply scenario, the operating water supply well will also be sampled.
5.3.2.5 Potentiometeric Surface Monitoring
No Changes to RoWD documentation from March 18, 2009.

Beacon Solar Energy Project 14 June 2009
7.0 Design and Construction Standards
7.1 General Design Description of the Evaporation Pond
7.1.1 Overview
The containment strategy for the evaporation ponds is summarized as follows:
Size the ponds to achieve sufficient evaporative capacity under annual average and peak discharge conditions, to allow for 3 feet of evaporative residue accumulation, to maintain a minimum of 2 feet freeboard at all times, and to allow one pond to be taken out of service for one year for maintenance without impacting the operation of the Project;
Meet or exceed regulatory requirements for containment of liquid designated wastes;
Select materials that are compatible with the physical, chemical and thermal characteristics of the wastewater and evaporation pond residue being contained;
Protect against physical damage to the containment layers by including protective layers in the design of each containment facility and to allow evaporative residue removal;
Allow for occasional removal, if needed, of contained media without otherwise damaging the integrity of the containment systems; and
Include the ability to monitor the integrity of the containment system, to collect and recover leakage through the primary liner, and to transfer fluids from one evaporation pond to another.
As outlined in Section 4.1, the size of the evaporation ponds is related to the TDS concentration and flow rate. The optimal size of the evaporation ponds are:
Using the lower bound TDS (550 mg/L), the required top surface area of the ponds is 6 acres; or
Using the upper bound TDS (1,900 mg/L), the required top surface area of the ponds is 8 acres.
The proposed design for the evaporation ponds has been selected to optimize performance based on these operating criteria. The top surface area of the evaporation ponds is based on a corrected evaporation rate of 53 inches per year due to a lake factor of 0.7 and a salinity factor of 0.7, which is representative of a brine concentration. The location and general arrangement of the 8 acre ponds is shown on revised Figure 3. If the lower TDS value was used, each pond would be reduced by 0.7 acres to achieve a top pond area of 6 acres. The proposed design for evaporation ponds and site details are provided in the following revised figures:
Figure 8: Evaporation Pond Cross Section;
Figure 9: Evaporation Pond and Land Treatment Unit Drainage and Grading Plan; and
Figure 10: Evaporation Pond Section and Details.
7.1.2 Description
The three 2.7-acre evaporation ponds have a proposed average design depth of 8 feet across each pond, which incorporates:
3 feet of residue build up;
3 feet of operational depth; and
Beacon Solar Energy Project 15 June 2009
2 feet of freeboard.
The containment design for the evaporation ponds, from the surface of the evaporation ponds downwards, consists of the following:
A hard surface/protective layer with granular fill/free draining sub-base over geotextile;
A primary 60 mil high-density polyethylene (HDPE) liner;
An interstitial leak detection and removal system (LDRS) comprising a geomembrane geonet and collection piping;
A secondary 40 mil HDPE liner; and
A base layer consisting of either a geosynthetic clay liner (GCL) or 2 feet of onsite material with a hydraulic conductivity of less than 1 x 10⁻⁶ centimeter per second of which 30 percent, by weight, shall pass through a No. 200 standard sieve.
7.1.3 Hard Surface/Protective Layer
The hard surface/protective layer provides protection against accidental damage to the HDPE liners which could be caused by burrowing animals, falling objects, varying climatic conditions and worker activities during maintenance. Secondly, the hard surface/protective layer will allow for removal of the precipitated solids within the evaporation ponds. The proposed design consists of roller-compacted concrete to serve as the hard surface/protective layer for the ponds. Alternate hard surface media such as reinforced concrete, revetments, gunite, or combinations of these media may be submitted for approval as an alternate to the roller-compacted concrete.
A granular fill/free draining native soil sub-base is placed under the hard surface and is intended to serve two purposes:
As the supporting base for the hard surfacing; and
As a drainage layer between the hard surfacing and underlying primary liner.
Prior to the placement of the sub-base, pre-construction percolation tests shall be conducted within the footprint of the evaporation ponds.
7.1.4 Liner System
No Changes to RoWD documentation from March 18, 2009.
7.1.5 Base Layer
No Changes to RoWD documentation from March 18, 2009.
7.1.6 Leak Detection, Collection and Removal System
An HDPE geonet drainage layer, with an option for non-woven geotextile heat bonded to one or both sides, will be used in the leak detection and collection layer between the primary and secondary liners. HDPE geonet used in combination with geotextile materials has been selected because polyethylene is not reactive with the fluids and provides a highly conductive layer, it is readily available, and is easily installed with minimal potential for damage to the liner system during installation.
The base of the evaporation pond leak detection and collection layer will slope at a minimum inclination of 1 percent towards a leak detection and collection sump, located at the lowest point in the pond. The water in the collection sump will drain by gravity to a monitoring well that is constructed for each evaporation pond (one well per pond). Automated pneumatic pumping systems in the monitoring wells will automatically
Beacon Solar Energy Project 16 June 2009
return water collected in the sump to that evaporation pond, which in turn minimizes the hydraulic pressures across the secondary liners and, therefore, minimizes the risk of leakage through the secondary liner. Leakage rates will be measured using a flow totalizer.
The collection sump, pipe, and monitoring well, will include prefabricated and field-fabricated HDPE components with water tight, extrusion welded and wedge-welded seams and penetrations. The liner system will be installed in accordance with current practices. Destructive and non-destructive testing procedures will be used to verify sump and penetration tightness and continuity.
This design is consistent with CCR Title 27, Section 20340, which requires an LDRS between the liners for the evaporation ponds.
7.1.7 Berms and Side Slopes
No Changes to RoWD documentation from March 18, 2009.
7.1.8 Material Compatibility
No Changes to RoWD documentation from March 18, 2009.
7.2 Engineered Alternative
No Changes to RoWD documentation from March 18, 2009.
7.3 Construction Methods and Sequence of the Evaporation Ponds
The containment construction process will follow these general steps:
a) Stripping, grubbing and clearing of organic materials and topsoil from the construction area;
b) Excavation and rough grading of the pond area, construction of berms, stockpiling of excess soil for later reuse;
c) Installation of the carrier pipe for the moisture detection (neutron probe) system beneath the base of the ponds;
d) Construction of finish grading to sub grade, as needed, and excavation of the leak detection/collection sumps;
e) Scarification, moisture conditioning, compaction, proof rolling and testing of sub-grade materials;
f) Supplemental moisture conditioning of sub grade and placement of the GCL or equivalent layer material;
g) Installation of secondary HDPE liner;
h) Installation of leak detection layer, sump, and leak detection monitoring wells/extraction risers;
i) Installation of primary HDPE liner;
j) Installation of the non-woven geomembrane liner;
k) Installation of granular fill/sub base; and
l) Installation of hard surface.
7.3.1 Moisture Detection System
No Change to RoWD documentation from March 18, 2009.

Beacon Solar Energy Project 17 June 2009
7.3.2 Site Preparation, Excavation and Compaction
No Change to RoWD documentation from March 18, 2009.
7.3.3 Liner System Installation
SUBGRADE
No Change to RoWD documentation from March 18, 2009.
GCL
No Change to RoWD documentation from March 18, 2009.
SECONDARY LINER
No Change to RoWD documentation from March 18, 2009.
LEAK DETECTION SYSTEMS
The leak detection system between the upper and lower liners consists of a geonet drainage media, leak detection sump piping and sand bedding/granular fill to support the pipe. The sand bedding/granular in the trench will have to be carefully placed on top of the underlying 40 mil HDPE liner. The geonet shall be placed across the top of the leak detection sump to avoid strain on the material. The construction sequence will have to be developed with the emphasis of material placement, spreading, and consolidation techniques that will ensure that damage to the liner does not occur.
PRIMARY LINER
No Change to RoWD documentation from March 18, 2009.
7.3.4 Hard Surface/Protective Layer
No Change to RoWD documentation from March 18, 2009.
7.4 Land Treatment Unit
7.4.1 Overview
The proposed design for the LTU has been selected to optimize performance based on the operating requirements specified in Section 4.2. The location of the LTUs is shown on revised Figure 3. Cross section detail of the LTU is shown on revised Figure 11, Land Treatment Unit Section and Details.
The LTU will not incorporate a liner containment system or LDRS, but will be constructed with a prepared base consisting of 2 feet of compacted, low permeability, lime-treated material. This base will serve as a competent platform for land treatment activities, and will serve to slow the rate of surface water infiltration in the treatment area. The compacted and native soil beneath the LTU is designated as a “treatment zone” to a depth of 5 feet. Although the LTU will be taking vehicle traffic, no hard surface will be required, as there is no liner system to protect. A staging area is allocated in the LTU for storage of HTF-impacted soils while they are being characterized. Soil characterized as hazardous will be removed from the site; therefore, no additional liner system is required in the LTU to cater for the hazardous waste.
The LTU will be surrounded on all sides by a 2-foot high compacted earthen berm with side slopes of approximately 3:1 (horizontal: vertical). These berms will control and prevent potential inflow (run on) of surface stormwater into the LTU or runoff of stormwater from the unit (refer to Section 7.6 for further stormwater information).

Beacon Solar Energy Project 18 June 2009
7.4.2 Heat Transfer Fluid Treatment Process
No Change to RoWD documentation from March 18, 2009.
7.4.3 LTU Construction Process
No Change to RoWD documentation from March 18, 2009.
7.4.4 Site Preparation, Excavation and Grading
No Change to RoWD documentation from March 18, 2009.
7.5 Grading Plans
As outlined above, earthwork will be required for the construction of the evaporation pond and LTU. The existing contours and finished grades are shown on revised Figure 9 and revised Figure 12, Conceptual Grading Plan. The evaporation ponds are designed in tiers to facilitate cut and fill balance and minimize the earthwork requirements. The finished elevations of each pond, including the berm and top of the base, are shown in revised Figure 8. There will be additional grading required below the base to accommodate the sub-base, liners and LCRS.

Beacon Solar Energy Project 19 June 2009
9.0 Stormwater Management
A conceptual drainage study for this project was undertaken by Carlton Engineering in February 2008. Further investigations were undertaken by AECOM and WorleyParsons in June 2009 which included redesign of the Pine Creek Wash based on flood mapping, hydrology, hydraulic studies and retention basins. Excerpts from the conceptual drainage study and additional studies are provided in Attachment B. The objective of the drainage studies was to investigate the hydraulic and hydrologic conditions associated with the development of approximately 2,012 acres of desert shrub and provide mitigation requirements for the anticipated increase in stormwater runoff due to development.
9.1 Offsite Drainage
The entire watershed covers 83.2 square miles (refer to Appendix D, Drawing DS1). A majority of the stormwater runoff from the offsite watershed enters the site from the south, along the Pine Tree Creek dry wash (refer to Section 3.2). However 937 acres of the offsite watershed enters the site from the west, near the proposed location of the evaporation ponds and LTU. The offsite flows from the west are directed underneath State Route 14 and the Southern Pacific Railroad before they enter the Project site. All stormwater from offsite sources will be diverted through the site in channels.
9.2 Onsite Drainage
All rain that falls on the site will be captured and diverted through retention basins which outfall into the rerouted Pine Tree Creek Wash. As shown on revised Figure 9 and revised Figure 12, the evaporation ponds and LTU east of the entrance gate, near a drainage path for the offsite flows that enter the site under the Southern Pacific Railroad right of way. For the purposes of the RoWD, the drainage “area” will be bounded by the following:
Solar fields and drainage channel to the south;
Solar fields and access road to the east;
Access road and transmission line to the north; and
Administration building and transmission line to the west.
The rate of flow within the drainage reach at the Southern Pacific Railroad crossing was evaluated as part of the drainage study (Carlton, 2008). Runoff rates for this drainage channel at the culvert beneath the railroad right of way are shown below
Runoff in a 10-year, 24-hour storm event = 13.95 cubic feet per second
Runoff in a 100-year, 24-hour storm event = 73.11 cubic feet per second
The runoff under pre-development and post-development conditions is the same as there is no development planned upstream of the railroad culvert. The drainage channel has been designed with a 15 foot wide base with gravel base, 1 foot deep with side slopes of 5:1 (horizontal: vertical) (refer to Appendix D). The 100-year, 24-hour storm event stormwater runoff will be contained either within the aforementioned drainage channel or pipe system, which will commence at the culverts under the Southern Pacific Railroad on the west boundary of the Project site and outfall into the rerouted dry wash on the east boundary of the Project site. Grading of the channel may serve a dual purpose as an access road, as the gravel bottom channel with 5:1 sides can serve as a path of travel when not passing storm flows, and will be designed so that drainage from the solar collector area is separated from this offsite stormwater source.
As there is not change between pre-development and post-development flows in the vicinity of the evaporation ponds and LTU, a detention basin is not required in this area of the Project site.
Beacon Solar Energy Project 20 June 2009
Pine Tree Creek will be re routed around the solar collector field to the south and east, and therefore will have no interaction with the evaporation ponds and land farm unit location. The storm flows from the solar collector arrays will be treated through the use of multiple retention ponds. These retention ponds will be linked via shallow, gradually sloped ditches that will enhance the treatment of the storm flows.
9.2.1 Stormwater Design for Evaporation Ponds and Land Treatment Unit
Both the evaporation ponds and LTU are surrounded by berms which will control and prevent potential inflow (run on) of surface stormwater into the evaporation ponds and LTU or runoff of stormwater from the ponds and LTU. The berms will protect stormwater entering the evaporation ponds and LTU in the 100-year, 24-hour storm event.
Precipitation that falls on the berms between the evaporation ponds located next to each other will enter into the evaporation ponds. A drainage swale between the ponds was investigated; however, due to the length of the evaporation ponds and required slope of the swale, the downstream drainage channel would need to be deepened to ensure the swale had an adequate outfall. Due to the minimal runoff expected from these small areas between the ponds, the drainage swales were not incorporated in the design. The area and extent of the impermeable surface contributing runoff from the evaporation ponds and LTU are shown on Figure 13, Evaporation Pond and Land Treatment Unit Layout.
As outlined in Section 4.1.1.4, precipitation that accumulates in the LTU will be pumped to the evaporation ponds only after visual observation to establish the water is free from HTF product, sheen or other evidence of contamination. If contamination is observed, the stormwater will be pumped into a holding tank prior to offsite disposal. Because significant precipitation events are relatively isolated, transfer of accumulated rainwater collected in the LTU is expected to be needed only every approximately three to five years.
9.2.2 Best Management Practices
Stormwater Best Management Practices (BMPs) will be provided on site and will be included in the Stormwater Pollution Prevention Plans (SWPPP) in compliance with the National Pollutant Discharge Elimination System General Permit for Storm Water Discharges Associated with Construction Activity and Operation of the site. BSEP will not undertake a Notice of Intent for the SWPPPS, as they are not legally required by the SWRCB as a 401 and 404 Permit is not required.
During construction, BMPs will include:
Temporary Erosion Control Measures: Construction of berms and ditches re-vegetation, slope stabilizers (interior slopes of the berms in the evaporation ponds are to be stabilized before the liner systems are placed), dust suppression and sediment barriers;
Sediment Control: Silt fences, gravel bags, fiber rolls, check dams and street sweeping;
Tracking Controls: Stabilizing entrance and exit;
Wind Erosion Controls: Applying potable groundwater to disturbed areas and covering exposed stockpiles;
Non-Stormwater Control: Inspecting vehicles for leaks and dispose of cement appropriately; and
Waste Management and Materials Pollution Control: Using watertight containers, prevent runoff (with berm, trench etc), into the storage areas and clean up spills immediately after discovery.
Permanent BMPs shall also be provided to protect the evaporation ponds and LTU during operation of the Project. These BMPs will include the following erosion and sediment control measures:
Berms around the evaporation ponds and LTU;

Beacon Solar Energy Project 21 June 2009
Exterior slopes of the berms stabilized to prevent wind and water erosion after completion of the liner system placement (e.g., placement of stripped organics removed from the pond area during grading, track walking transverse to slopes);
Monitoring of berm integrity monthly and after any runoff-producing storm event for erosion;
Repair of the berms as needed (regrading and track walking for minor erosion (less than 6 inches depth), regrading and placement of coarse aggregate for deeper erosion;
Grading of drainage channel north of the evaporation ponds and LTU to direct flow away from the pond and unit area; and
Maintenance of the drainage channel as needed to restore flow lines and bank integrity.

Beacon Solar Energy Project 22 June 2009
11.0 Environmental Controls
11.1 Nuisance Controls
No Change to RoWD documentation from March 18, 2009.
11.2 Fire Control
No Change to RoWD documentation from March 18, 2009.
11.3 Leak Detection and Removal System
In accordance with CCR Title 27, Section 21600(b)(8)(C), there is an LDRS located beneath the primary liner in the evaporation pond. As outlined in Section 7.1.1, the LDRS will be located between the primary and secondary liners underlying the each evaporation pond (refer to revised Figure 10, Evaporation Pond Section and Details). The LDRS will comprise of a layer of geonet sloped to a leak detection sump in each pond. The leak detection sump will include a 16-inch diameter leak detection and removal well fitted with an electronic leak sensor and a submersible pump to allow removal of leakage. The pump will discharge back into the evaporation pond. The discharge pipe may be equipped with a recording flow totalizer to allow monitoring of the amount of fluid removed over time and calculation of leakage rates.
The inspection and maintenance requirements for the LDRS are outlined in Section 12.
11.3.1 Action Leakage Rate
The Action Leakage Rate (ALR) is the allowable leakage from the primary liner system above which SPCC Plan actions are triggered. According to CFR Title 40, Section 264.222 the ALR is defined as “…the maximum design flow rate that the leak detection system can remove without the fluid head on the bottom liner exceeding 1 foot”. The ALR must also include an adequate safety margin to allow for variability in the containment system design (e.g. liner and collection pipe slope, interstitial fill hydraulic conductivity, thickness of drainage material, etc.).
The estimated ALR for the evaporation ponds is 2,750 gallons per acre per day. The references and assumptions used to establish the ALR is presented in revised Appendix J, Action Leakage Rates. This is based on one standard hole per acre, a drainage layer geonet with hydraulic conductivity of 0.06 meters per second and a 50 percent safety factor. The assumption underlying this ALR calculation will be verified in the actual constructed ponds. Based on a 2.7-acre pond, each evaporation pond would have an ALR of 7,425 gallons per day. However the ALR will need to have field verification as this rate will vary depending on actual drainage material used and its hydraulic conductivity. A final ALR will be submitted to the RWQCB within six months of the effective date of the permit based on field analysis.
A large hole in the geomembrane may cause a rapid large leakage rate (RLLR) of approximately 9,500 gallons per acre per day (refer Appendix J, Action Leakage Rates). This would equate to a RLLR of 25,650 gallons per day per pond. The RLLR is provided herein for informational purposes only.
The recording flow totalizer at each sump will be monitored at least weekly to determine the leakage rate through the primary liner. If the leakage rate exceeds the ALR, then the appropriate actions in the SPCC Plan will be implemented.
11.4 Dust Control
An Operations Dust Control Plan will be prepared for the Project as specified in the Application for Certification to manage fugitive dust emissions and comply with the requirements of CCR Title 27, Section
Beacon Solar Energy Project 23 June 2009
21600(b)(8)(D). Best Management Practices for dust control in the vicinity of the evaporation ponds will be implemented as necessary and will include the following:
Maintaining at least 2 feet of freeboard during operation of the ponds to reduce potential for dust entrainment;
Moisture conditioning of ponds to allow them to evaporate to dryness;
Using moisture conditioning during removal and loading of accumulated residue;
Adhering to speed limits during travel on dirt roads for monitoring and maintenance of the ponds; and
Tarping of any truck loads of residue removed from the site for offsite disposal
Wastewater from the evaporation ponds will not be used for dust control on site.
11.5 Vector Control
No Change to RoWD documentation from March 18, 2009.
11.6 Drainage and Erosion Control
No Change to RoWD documentation from March 18, 2009.
11.7 Noise Control
No Change to RoWD documentation from March 18, 2009.
11.8 Traffic Control
No Change to RoWD documentation from March 18, 2009.
Beacon Solar Energy Project 24 June 2009
12.0 Inspection, Sampling and Maintenance Programs
12.1 Inspection Program
No Change to RoWD documentation from March 18, 2009.
12.2 Sampling Program
No Change to RoWD documentation from March 18, 2009.
12.3 Maintenance Program
12.3.1 Evaporation Pond
12.3.1.1 Clean Out
The ponds will require clean out when 3 feet of residue/precipitated solids have accumulated in the base of the evaporation ponds (estimated to be every 3.8 to 4.5 years depending on the TDS concentration and discharge flow rate of the wastewater). The general requirements for undertaking clean out works for evaporation ponds are outlined below
Before water can be pumped out of the pond for maintenance, the capacity of the other evaporation ponds must be assessed to verify that sufficient capacity exists to contain wastewater from continued operation for a sufficient amount of time to allow planned maintenance activities. Preliminary design estimates indicate that if one pond is undergoing clean out activities, the additional two ponds can operate effectively for up to one year.
A manually placed pumping system should be used to transfer the water into an adjacent evaporation pond. As the pond liners are covered with a hard protective layer, it will be possible to place and activate these pumping systems without otherwise damaging the pond liners or transfer piping. During pond drainage, the flow rates from the pumps should be monitored to ensure that the outflow is not negatively impacting on the receiving evaporation pond. Details of this pumping system must be provided by the manufacturer.
The appropriate time of year and ideal weather conditions to undertake the clean out activities should be investigated. Dust generated during the activities will need to be controlled in accordance with the Facilities Operations Dust Control Plan. Health and safety issues for the clean out activity include potentially slipping or falling into the pond. As part of the Facilities Operations Safety Training Program and Personal Protective Equipment Plan, employees will be trained on how to undertake the clean out activities in a safe manner, which may include having ropes and ladders accessible at the evaporation ponds.
12.3.1.2 Residue Removal
The general requirements for undertaking residue and sediment removal for evaporation ponds are outlined below.
The removal activities should only be conducted on an as-needed basis depending upon the inspection of the system. The inspections should include estimating the depth of residue and assessing if the residue or sediment is impeding flows into the pond and impacting the evaporation rate or capacity of the system. The evaporation ponds are design to hold 3 feet of residue, which is estimated to accumulate every 3.8 to 4.5 years.
The residue shall be removed by a pumping or vacuum system if in a fluid state, or should be dried and removed using conventional excavation and loading equipment light enough to reduce the potential for damage to the liner system. If necessary, the residue should be sampled and analyzed to meet the

Beacon Solar Energy Project 25 June 2009
characterization requirements of the receiving disposal facility. The characteristics of the residue will determine the transportation and disposal methodology.
12.3.2 Land Treatment Unit
No Change to RoWD documentation from March 18, 2009.
12.4 Avian Monitoring
No Change to RoWD documentation from March 18, 2009.
12.5 Moisture Detection Monitoring
No Change to RoWD documentation from March 18, 2009.

Beacon Solar Energy Project 26 June 2009
RoWD Table Revisions

Table 5: Raw Water Chemistry
2007 Well 63 2007 Well 48 2007 Well 43
(ppm) (ppm) (ppm)Calcium 50 46 45 47 116 69
Magnesium 10 12 11 11 31.4 9.9Sodium 76 84 74 78 572 510
Potassium 4.2 4.3 3.7 4.1 8.5 6.3Iron 0.067 0.015 0.06 0.047 0.25 < 0.010
Ammonia 0 0.031 0.084 0.038 * *Aluminum 0 0.033 0.036 0.023 * *
Zinc 0.011 0.013 0.011 0.012 * *Boron 0.14 0.16 0.24 0.18 4.32 30
Chloride 14.6 14 18 15.5 746 250Sulfate 124 110 120 118 476 690
Alkalinity 160 290 170 207 * 210HCO3 (bicarbonate alkalinity) 200 360 210 257 250 319
CO3 (carbonate alkalinity) ND * ND * 3 0Cyanide (amenable/total) 0 0.02 0 0.007 * *
Silica 35.9 34 30 33.3 33.1 33Silicon 16 16 15 15.7 * *
Phosphate 0.047 0 0.011 0.019 * *Polyphosphate ND ND ND * * *
Fluoride 0.378 0.4 0.6 0.459 0.89 9.3Nitrate 1.05 1.5 1 1.183 3.71 *
Suspended Solids ND ND ND * * *Total Dissolved Solids 470 470 550 550 1012 1900
Hardness 170 160 160 * 379 210SDI 0.2 0.6 1.17 * * *
Manganese 0.048 0.015 0.057 * 0.68 9.9Barium 0.037 0.045 0.027 * * *
Strontium 0.84 0.75 0.76 0.78 * *Selenium 0.00031 0.00048 0.00038 0.00039 * *Copper 0.0037 * 0.0018 * * *Arsenic 0.0034 0.003 0.0041 0.0035 0.22 *
Chromium 0.00011 0.0028 0.0007 * * *Cobalt 0.00005 * * * * *Lead 0.00056 0.0003 0.00041 * * *
Nitrate 1.05 1.48 1.5 * * *Vanadium 0.0047 0.0058 0.0074 * * *
Nickel 0.00021 0.00013 0.00009 * * *Molybdenum 0.016 * * * * *
Antimony 0.00028 0.0003 0.0013 * * *Thallium 0.0003 * * * * *
Hexavalent Chromium * 0.0027 0.0003 * * *
Notes:* Not sampled/anaylsed
KOEHN LAKE OFF-SITE WELLS
Concentration Used in Water Balance (Well
30S37E13CO1M)Constituent
Concentration in Mean Well Water
ON-SITE WELLS
Concentration in Mean Well Water

Table 6: Chemical Additives in Treatment Processes
Process Aim Type of Additive Example of Additive
Limit growth of bacteria Oxidizing Biocide Sodium Hypochlorite
pH Control Sulfuric Acid, Hydrochloric Acid (included in Tables 5 and 7)
Antiscalants Organic Phosphates (used in small amounts)
Minimize corrosion Corrosion Inhibitors Zinc, Phosphate (used in small amounts)
Control pH pH ControlAmines (i.e. Cyclohexamine, Monoethanolamine, Methoxypropylamine) (used in small amounts)
Remove remaining dissolved oxygen Oxygen Scavenger Hydrazine, Carbohydrazide (used in small amounts)
Minimize corrosion from pH pH Control Phosphates (used in small amounts)
Removal of hardnesss Calcium compound Lime (Calcium Hydroxide)
Control pH pH Control Soda Ash (Sodium Carbonate)
Control pH pH Control Caustic (Sodium Hydroxide)
Flocculant Polymer Long-chain polymer for settling of wastewater solids
Removal of silica Magnesium compound Magnesium Chloride
Coagulant Iron compound Ferric Chloride
Removal of hardness elements Regenernt Sodium Hydroxide
Removal of hardness elements Regenerant Hydrochloric Acid
Weak Acid Cation Exchange Softener
ONSITE GROUNDWATER - LOWER LIMIT TDS PROCESS
Circulating Water Limit formation of scale
Steam Cycle
OFFSITE GROUNDWATER - UPPER LIMIT TDS PROCESS
Pre- and Post- Treatment Clarifier

Table 7A: Predicted Chemistry of Wastewater Streams for Onsite Groundwater (Lower TDS)
Constituent UnitsConcentration in
Mean Well Water
Concentration in Cooling Tower
Blow Down
Concentration in Ion Exchange Regeneration Wastewater
Concentration into Brine
Concentrator
Concentration in Evaporation Pond
Discharge
STLC (mg/L)
TCLP (mg/L)
Aluminum (total) (mg/L Al) 0.023 0.04 0.25 0.15 1.54 * *Ammonia (as N) 0.038 0.06 0.41 0.26 2.55 * *
Arsenic (total) (mg/L As) 0.0035 0.01 0.04 0.02 0.23 5.0 5.0Boron (total) (mg/L B) 0.18 0.30 1.96 1.21 12.08 * *
Calcium (total) (mg/L Ca) 47 77.40 511.83 315.43 3151.11 * *Chloride (mg/L Cl) 15.5 25.50 168.80 104.01 1039.08 * *
Cyanide (total) (mg/L as HCN) 0.007 0.01 0.08 0.05 0.47 * *Fluoride (mg/L as F) 0.459 0.75 5.00 3.08 30.75 180 *
HCO3 (bicarbonate alkalinity) (mg/L HCO3) 257 16.40 48.68 34.09 340.53 * *Iron (total) (mg/L Fe) 0.047 0.08 0.51 0.32 3.15 * *
Magnesium (total) (mg/L Mg) 11 18.15 119.79 73.84 737.65 * *M-Alkalinity (mg/L as CaCO3) 207 14.10 2254.23 1241.48 12402.37 * *
Nitrate (mg/L as NO3) 1.183 1.95 12.88 7.94 79.32 * *
Phosphate (total) (mg/L as PO4) 0.019 0.03 0.21 0.13 1.27 * *Potassium (total) (mg/L K) 4.1 6.76 44.65 27.52 274.92 * *Selenium (total) (mg/L Se) 0.00039 0.00 0.00 0.00 0.03 1.0 1.0
Silica (mg/L as SiO2) 33.3 54.90 362.64 223.51 2232.87 * *Silicon (mg/L as Si) 15.7 24.35 170.97 104.69 1045.80 * *
Sodium (total) (mg/L Na) 78 141.90 3739.92 2113.27 21111.58 * *Strontium (total) (mg/L Sr) 0.78 1.21 8.49 5.20 51.96 * *
Sulfate (mg/L SO4) 118 477.56 6952.81 4025.38 40213.55 * *Zinc (total) (mg/L Zn) 0.012 0.02 0.13 0.08 0.80 250 *
pH pH 8.00 7.00Total Dissolved Solids (ppm) 550 857.28 12150.05 7044.64 70331.24 * *
Notes:Regulatory Standards/Reportable Quantities are for elements mentioned only* Not listed/no standards---- UnknownSTLC = Soluble Threshold Limit Concentration, Regulated by CCR Title 22, Division 4.5, Article 3, Section 66261.24 TCLP = Toxicity Characteristics Leaching Procedure; Regulated under 40 CFR Section 261.24

Table 7B - Predicted Chemistry of Wastewater Streams for Offsite Groundwater (Upper TDS)
Constituent UnitsConcentration in Mean Well Water
(mg/L)
Concentration in Evaporation Pond Discharge (mg/L)
STLC (mg/L)
TCLP (mg/L)
Calcium (total) (mg/L Ca) 69 934 * *Chloride (mg/L Cl) 250 20,098 * *Fluoride (mg/L as F) 9.3 620 180 *
HCO3 (bicarbonate (mg/L HCO3) 319 271 * *Iron (total) (mg/L Fe) < 0.010 - * *
Magnesium (total) (mg/L Mg) 9.9 324 * *M-Alkalinity (mg/L as CaCO3) 210 223 * *
Nitrate (mg/L as NO3) 0 2 * *Nitrate and Nitrite (mg/L as N) 0.03 - * *Potassium (total) (mg/L K) 6.3 420 * *
Silica (mg/L as SiO2) 33 667 * *Sodium (total) (mg/L Na) 510 36,446 * *
Sulfate (mg/L SO4) 690 51,171 * *pH pH 7.8 - * *
Total Dissolved Solids (ppm) 1900 110,951 * *
Notes:Regulatory Standards/Reportable Quantities are for elements mentioned only* Not listed/no standards---- UnknownSTLC = Soluble Threshold Limit Concentration, Regulated by CCR Title 22, Division 4.5, Article 3, Section 66261.24 TCLP = Toxicity Characteristics Leaching Procedure; Regulated under 40 CFR Section 261.24The list of constituents only includes parameters that there were mean well water data for. A completed waste stream
stream evaluation should be undertaken when additional raw water constituents are known

Table 8A: Predicted Chemistry of Evaporation Pond Residue for Onsite Groundwater (Lower TDS)
Concentration in Mean Well
Water
Total Residue Mass After 30
Years
Concentration in Residue
STLC TTLC Wet-
Weight TCLP
(ppm) (lbs) (% or ppm) (mg/L) (mg/kg) (mg/L)CATIONS
Ammonia 0.038 5,000 97 ppm * * *Calcium 47 6,130,900 11.93% * * *
Magnesium 11 1,434,891 2.79% * * *Potassium 4.1 530,475 1.03% * * *
Sodium 78 10,174,684 19.80% * * *ANIONS
Alkalinity 30 3,909,869 7.61% * * *HCO3 (bicarbonate alkalinity) 37 4,855,806 9.45% * * *
CO3 (carbonate alkalinity) 0 0 0 ppm * * *Boron 0.18 23,480 457 ppm * * *
Chloride 15.5 2,026,241 3.94% * * *Fluoride 0.459 59,918 1166 ppm 180 18,000 *Nitrate 1.183 154,360 0.30% * * *
Phosphate 0.019 2,522 49 ppm * * *Polyphosphate 0 0 0.00% * * *
Silica 33.3 4,343,808 8.45% * * *Silicon 15.7 2,043,633 3.98% * * *Sulfate 118 15,392,471 29.95% * * *
METALSAluminum 0.023 3,000 58 ppm * * *
Arsenic 0.0035 457 9 ppm 5.0 500 5.0Antimony 0.0006 82 2 ppm 15 500 *Barium 0.036 4,739 92 ppm * * 100.0
Chromium 0.0012 157 3 ppm * * 5.0Cobalt 0.00005 7 0 ppm 5 2,500 *Copper 0.002 239 5 ppm * * *
Cyanide (amenable/total) 0.007 870 17 ppm * * *Hexavalent Chromium 0.0015 196 4 ppm 5 500 5.0
Notes:Regulatory Standards/Reportable Quantities are for elements mentioned only* Not listed/no standardsThe only source for these species is from ground water makeup. Site will makeup 1600 acre-feet per year for 30 years. All waste is non-volatile and will be collected in the evaporation ponds.All species removed by ion exchange are returned to the evap ponds during regen
Constituent

Table 8B: Predicated Chemistry of Evaporation Pond Residue for Offsite Groundwater (Upper TDS)
Total Residue Mass After 30 Years
(lbs)CATIONS
Calcium 69 9,000,682Magnesium 9.9 1,291,402
Sodium 510 66,526,783Potassium 6.3 821,801
ANIONSBoron 30 3,913,340
Chloride 250 32,611,168Fluoride 9.3 1,213,135
Silica 33 4,304,674METALS
Iron 0.01 1,304
Notes:Regulatory Standards/Reportable Quantities are for elements mentioned only* Not listed/no standards1. A comparison to STLC / TTLC or TCLP is not possible as there is significant data gaps. 2. The list of constituents only includes parameters that there were mean well water data for. A completed waste stream
stream evaluation should be undertaken when additional raw water constituents are known3. The only source for these species is from ground water makeup. 4. Site will makeup 1600 acre-feet per year for 30 years. 5. All waste is non-volatile and will be collected in the evaporation ponds.6. All species removed by ion exchange are returned to the evap ponds during regen
ConstituentConcentration Used in
Water Balance (Well 30S37E13CO1M)

Parameter USEPA or Standard Method
PQL Units
Arsenic 6020 0.5 mg/LBoron 6020 0.5 mg/LCalcium 200.7 0.5 mg/LChloride 300 0.5 mg/LFluoride 300 0.5 mg/LIron 200.7 0.5 mg/LMagnesium 200.7 0.5 mg/LManganese 200.7 0.5 mg/LNitrate as Nitrogen 300 0.5 mg/LNitrite as Nitrogen 300 0.5 mg/LPotassium 200.7 0.5 mg/LPhosphate 365.3 0.03 mg/LSelenium 200.7 0.5 mg/LSodium 200.7 0.5 mg/LSulfate 300 0.5 mg/LTDS SM 2450C 10 mg/LTotal Alkalinity(as CaCO3)
Biphenyl Oxide 8015M 1 mg/LDiphenyl Oxide 8015M 1 mg/L
mg/L – milligrams per literPQL – practical quantitation limit
Note: If turbidity exceeds 10 NTUs, groundwater samples will be field filtered and both the unfiltered and filtred groundwater samples will be submitted to the laboratory for metals and TDS analysis.
Table 14: Annual Groundwater Monitoring Parameters
SM 2350B 1 mg/L
SM – Standard MethodTDS – Total Dissolved Solids
Key:CaCO3 – calcium carbonate

Parameter U.S. EPA or Standard Method
PQL Units
Chloride 300 0.5 mg/LNitrate as Nitrogen 300 0.5 mg/LPhosphate 365.3 0.03 mg/LSulfate 300 0.5 mg/LTDS SM 2450C 10 mg/LBiphenyl Oxide 8015M 1 mg/LDiphenyl Oxide 8015M 1 mg/LStatic Water Depth Field +/- 0.1 feet bgspH reading Field +/- 0.1 pH unitsTemperature Field +/- 0.1 °F or °C
SM – Standard Method
Note: If turbidity exceeds 10 NTUs, groundwater samples will be field filtered and both the unfiltered and filtred groundwater samples will be submitted to the laboratory for metals and TDS analysis.
Table 15 Groundwater Sample Analytical Parameters – Quarterly Monitoring
Key:
mg/L – milligrams per literPQL – practical quantitation limit

Beacon Solar Energy Project 27 June 2009
RoWD Figure Revisions

CA
NV
AZ
OR
UT
ID
Project: 10056-014Date: June 2009
BSEP
Figure 2Topography Map
Map Location
J:\G
IS\P
roje
cts\
10
05
6-B
ea
con
\mxd
\RO
WD
-Oth
ers
\To
po
gra
ph
y m
ap
.mxd
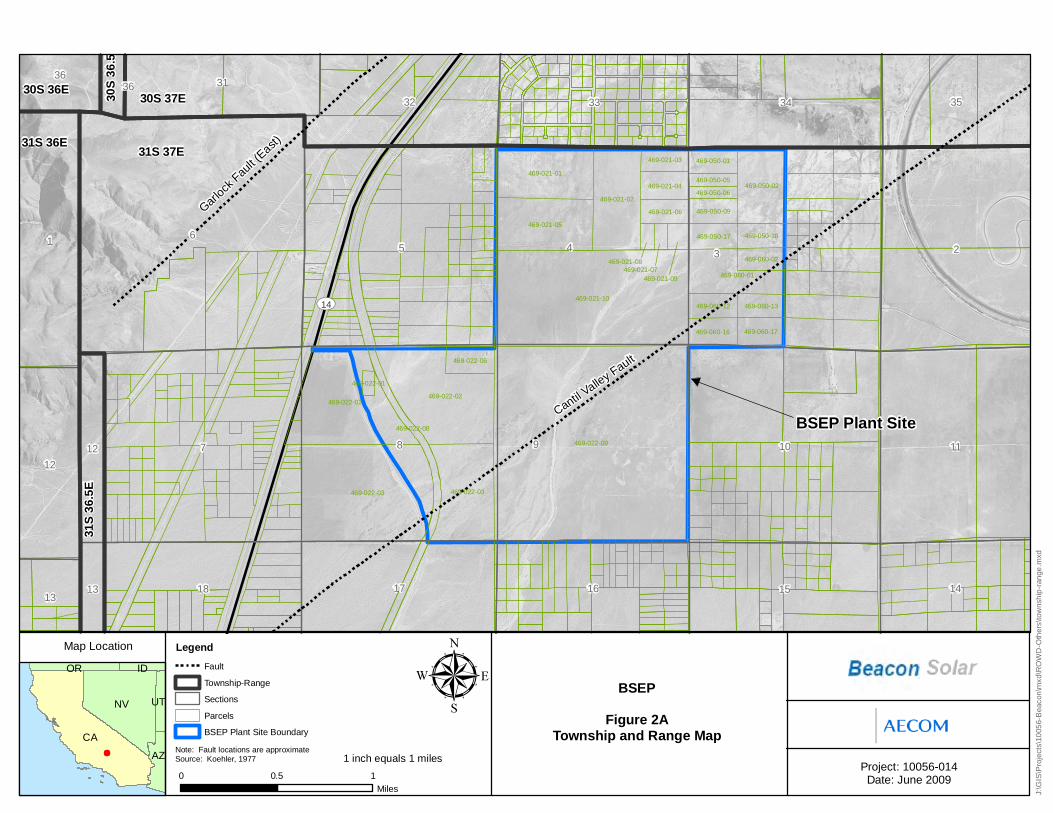
31S 37E
30S 37E
31S 36E
30S 36E31
S 3
6.5
E
30S
36
.5
469-022-09
469-021-10
469-022-03
469-022-02469-022-02
469-022-03
469-021-05
469-021-01
469-021-02
469-050-02
469-060-01
469-021-04
469-060-16
469-022-06
469-060-17
469-050-01
469-050-17
469-050-09
469-050-18
469-060-12
469-021-06
469-021-03
469-060-13
469-060-02
469-050-06
469-050-05
469-022-08
469-021-09
469-021-08469-021-07
469-022-01
65 3
8
4
7 9
2
10 11
1
34
1718
33
16 15
32 35
14
31
12
12
36
1313
36
UV14
CA
NV
AZ
OR
UT
ID
Project: 10056-014Date: June 20090 0.5 1
Miles
µ BSEP
Figure 2ATownship and Range Map
Map Location
J:\G
IS\P
roje
cts\
1005
6-B
eaco
n\m
xd\R
OW
D-O
ther
s\to
wns
hip
-ran
ge.m
xd
Legend
Fault
Township-Range
Sections
Parcels
BSEP Plant Site Boundary
1 inch equals 1 miles
BSEP Plant Site
Note: Fault locations are approximateSource: Koehler, 1977
Garloc
k Fau
lt (East)
Cantil Valle
y Fault
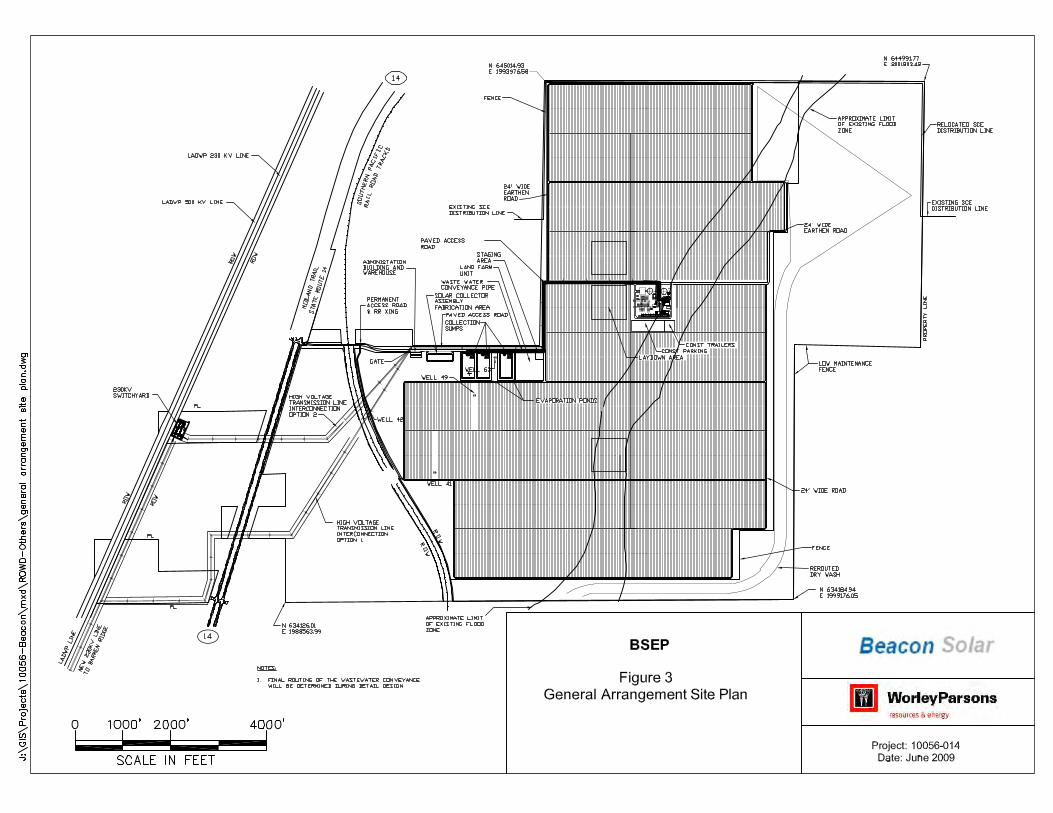

1838
1816
1841
2417
2077
2012
1844
1881
2054
20792100
2066
2064
2058
1847
18461844
1894
1861
1840.3
1825.1
1810.8
1818.4
1818.9
1818.1
1819.6
1835.3
1818.2
1818.6
1818.3
CA
NV
AZ
OR
UT
ID
Project: 10056-014Date: June 2009
BSEP
Figure 4Site Map with Alquist-Priolo
Fault Zones
Map Location
J:\G
IS\P
roje
cts\
10
05
6-B
ea
con
\mxd
\RO
WD
-Oth
ers
\se
ism
ic.m
xd

Me-pg
Qpa-pg
Te-vx
Qpo-pg
Qpa-pg
Qpa-pg
Mp-pg
Qpo-pg
Qpb-ma
Qpa-pg
Te-lg
Me-ma
Me-pg
Qpa-pg
Mp-pg
Me-pg
Qpb-pgTe-vx
Qvp-ua
Me-mu
Qiu-pg
Qpo-pg
Qvf-uq
Qes-uq
Qpo-pg
Qpa-uu
Me-pg
Te-va
Qpb-lg
Qpa-ma
Qoa-pg
Te-lg
Me-pg
Qpa-pg
Te-lg
Mp-pg
Qoa-iuTe-vx
Qvt-uq
Qpa-pg
Qpa-pg
Qpa-pg
Me-ma
Mi-pg
Qpb-pg
Qpa-pgTi-lg
Qpo-pg
Qpb-pd
Ti-vaQvf-uq
Te-vx
Me-mu
Me-pg
Me-ma
Me-pd
Qpf-pg
Qoa-pg
Qpb-pu
Qpf-lg
Qia-ma
Mp-pg
Qvt-uq
Qpb-lg
Qpb-va
Mi-pg
Qpb-pg
Mi-pg
Qoa-pg
Qpo-pg
Te-va
Qoa-ma
Qiu-pg
Me-pd
Qpw-ma
Qpa-iu
Te-lg
Te-lg
Qpa-pg
Te-lg
Qes-uq
Te-vb
Me-pg
Mp-pd
Ti-lg
Mp-pg
Mi-pg
Me-pg
Me-pg
Ti-vb
Ti-lg
Te-vb
Qia-va
Te-va
Qcb-pg
Qpb-mu
Qvf-uq
Qoa-ma
Qpb-pg
Qes-uq
Qiu-iu
Qvf-uq
Qoa-lg
Qpa-pg
Qes-uq
Qes-uq
Qoa-ma
Me-pg
Mi-pg
Qvf-uq
Qoa-ma
Qiu-pg
Qpb-lg
Te-vb Qoa-ma
Qpb-vx
Qcb-pg
Qvf-uq
Qoa-pg
Qvf-uq
Qcb-pg
Qia-lg
Qpb-lg
Qoa-lg
Ti-lg
Qoa-lf
Qpf-pg
Ti-lg
Mi-pd
Te-lg
Qvt-uq
Ti-lg
Qiu-pg
Te-vb
Qia-lg
Ti-vbTi-vb
Mi-pg
Qpo-suTe-vb
Qiu-iu
Me-mu
Qoa-pg
Qoa-ma
Te-vb
Mi-pg
Te-va
Qoa-va
Mp-pg
Me-pd
Mi-pg
Ti-lg
Mi-pg
Qoa-pg
Me-ma
Te-vx
Mp-pg
Mi-pg
Qes-uq
Me-pg
Qvt-uq
Te-vb
Qes-uq
Me-pg
Qvf-uq
Qoa-va
Qiu-lg
Qiu-lg
Qpw-lg
Te-va
Mi-pd
Mi-pg
Qiu-lg
Qpo-su
Qpo-pg
Mp-pg
Qcb-ma
Qoa-pg
Qcb-lg
Ti-lg
Qiu-lg
Qoa-lg
Te-vx
Qes-uq
Qiu-lg
Ti-lg
Ti-lg
Ti-lg
Mi-pg
Ti-vb
Qcb-lg
Me-pg
Te-vx
Mi-pg
Mp-pg
Mi-pg
Ti-lg
Mi-pg
Ti-lg
Qia-pg
Qoa-pg
Qcb-pg
Qoa-vb
Te-vb
Mi-pg
Qpw-va
Qoa-pd
Qpb-vb
Qcb-lg
Qiu-lgQiu-lg
Qpa-pg
Mi-pg
Qpw-lg
Te-vb
Me-pd
Qiu-lg
Ti-va
Qoa-mu
Qiu-pg
Qpb-vb
Mi-pg
Qpo-vb
Mi-pg
Ti-lg
Mi-pg
Qiu-lg
Te-lg
Qvt-uq
Ti-vb
Qoa-pg
Me-pd
Me-mf
Qoa-pd
Te-vb
Ti-vb
Qoa-lg
Qvf-uq
Qoa-va
Qiu-lg
Ti-lg
Qvf-uq
Ti-vr
Me-pgTi-vb
Qiu-pg
Mi-pg
Qoa-pg
Qoa-ma
Mi-pg
Qpw-pg
Qoa-vb
Qcb-lg
Qvp-ua
Qpw-pg
Qpb-vx
Me-pd
Ti-lg
Mi-pg
Qiu-lg
Qia-pg
Qvf-uq
Qpw-va
Qoa-lg
Qvf-uq
Qcb-va
Qcb-lg
Ti-vb
Ti-lg
Qcb-pg
Qoa-ma
Qcb-pg
Te-lg
Mi-pg
Qpo-vb
Qoa-pdQpo-pg
Qoa-pd
Ti-vbMi-pg
Qvf-uq
Mi-pg
Qcb-lg
Qoa-pg
Mi-ma
Te-lg
Mi-pg
Qiu-lg
Qia-pg
Ti-va
Qpw-lg
Mi-ma
Mi-pd
Mi-pgMi-pg
Qoa-ma
Mi-ma
Qpo-pg
Mi-ma
Ti-va
Qia-pg
Qcb-pg
Te-vb
Mi-pgMi-pg
Mi-pg
Mi-pg
Ti-lg
Qoa-lg
Te-vb
Mi-ma
Ti-va
Qvp-ua
Mi-pg
Mi-pg
Ti-lg
Mi-pg
Qpb-vb
Mi-pg
Qcb-ma
Me-pg
Mi-ma
Qcb-vb
Me-mf
£¤395
£¤395
UV14
UV58
UV14
CA
NV
AZ
OR
UT
ID
Project: 10056-014Date: June 20090 2 4 6 8
Miles
µ BSEP
Figure 5ARegional Geology in theArea of the Project Site
Map Location
J:\G
IS\P
roje
cts\
10
05
6-B
ea
con
\mxd
\ge
olo
gy.
mx
d
Legend
Fault
BSEP Plant Site Boundary
1:253,440
Garlock Fault (
East)
Cantil Valley Fault
Randsb
urg-Mojave
Fau
lt
Muroc Fault
Garlock Fault (
West)
BSEP Plant Site
Sierra Nevada
CaliforniaCity
Rand Mountains
El Paso M
ountains
Note:Fault locations are approximateSource: Koehler, 1977
Geology data from Mojave DesertEcosystem Program (www.majavedata.gov)
KoehnLake
See Figure 5B for Geologic Legend
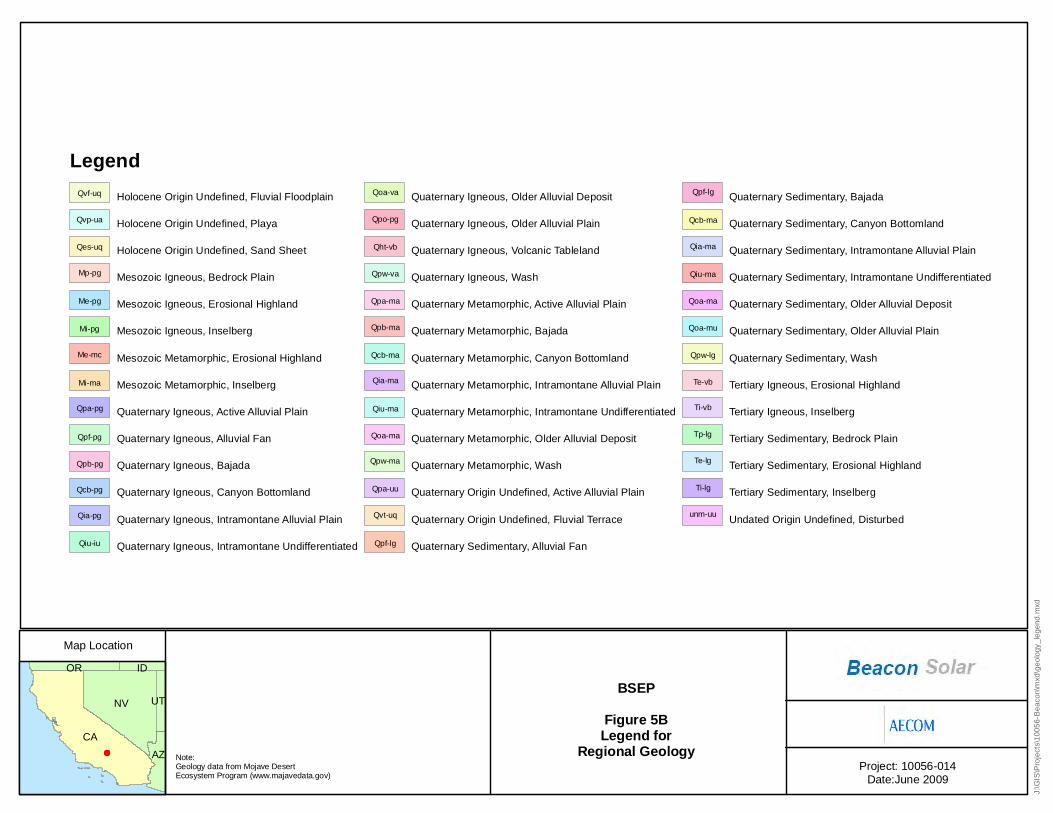
CA
NV
AZ
OR
UT
ID
Project: 10056-014Date:June 2009
BSEP
Figure 5BLegend for
Regional Geology
Map Location
J:\G
IS\P
roje
cts\
10
05
6-B
ea
con
\mxd
\ge
olo
gy
_le
ge
nd
.mxd
Legend
Holocene Origin Undefined, Fluvial Floodplain
Holocene Origin Undefined, Playa
Holocene Origin Undefined, Sand Sheet
Mesozoic Igneous, Bedrock Plain
Mesozoic Igneous, Erosional Highland
Mesozoic Igneous, Inselberg
Mesozoic Metamorphic, Erosional Highland
Mesozoic Metamorphic, Inselberg
Quaternary Igneous, Active Alluvial Plain
Quaternary Igneous, Alluvial Fan
Quaternary Igneous, Bajada
Quaternary Igneous, Canyon Bottomland
Quaternary Igneous, Intramontane Alluvial Plain
Quaternary Igneous, Intramontane Undifferentiated
Quaternary Igneous, Older Alluvial Deposit
Quaternary Igneous, Older Alluvial Plain
Quaternary Igneous, Volcanic Tableland
Quaternary Igneous, Wash
Quaternary Metamorphic, Active Alluvial Plain
Quaternary Metamorphic, Bajada
Quaternary Metamorphic, Canyon Bottomland
Quaternary Metamorphic, Intramontane Alluvial Plain
Quaternary Metamorphic, Intramontane Undifferentiated
Quaternary Metamorphic, Older Alluvial Deposit
Quaternary Metamorphic, Wash
Quaternary Origin Undefined, Active Alluvial Plain
Quaternary Origin Undefined, Fluvial Terrace
Quaternary Sedimentary, Alluvial Fan
Quaternary Sedimentary, Bajada
Quaternary Sedimentary, Canyon Bottomland
Quaternary Sedimentary, Intramontane Alluvial Plain
Quaternary Sedimentary, Intramontane Undifferentiated
Quaternary Sedimentary, Older Alluvial Deposit
Quaternary Sedimentary, Older Alluvial Plain
Quaternary Sedimentary, Wash
Tertiary Igneous, Erosional Highland
Tertiary Igneous, Inselberg
Tertiary Sedimentary, Bedrock Plain
Tertiary Sedimentary, Erosional Highland
Tertiary Sedimentary, Inselberg
Undated Origin Undefined, Disturbed
Qvf-uq
Qvp-ua
Qes-uq
Mp-pg
Me-pg
Mi-pg
Me-mc
Mi-ma
Qpa-pg
Qpf-pg
Qpb-pg
Qcb-pg
Qia-pg
Qiu-iu
Qoa-va
Qpo-pg
Qht-vb
Qpw-va
Qpa-ma
Qpb-ma
Qcb-ma
Qia-ma
Qiu-ma
Qoa-ma
Qpw-ma
Qpa-uu
Qvt-uq
Qpf-lg
Qpf-lg
Qcb-ma
Qia-ma
Qiu-ma
Qoa-ma
Qoa-mu
Qpw-lg
Te-vb
Ti-vb
Tp-lg
Te-lg
Ti-lg
unm-uu
Note:Geology data from Mojave DesertEcosystem Program (www.majavedata.gov)

CA
NV
AZ
OR
UT
ID
Project: 10056-014Date: June 2009
BSEP
Figure 6AOnsite Groundwater
Wastewater Flow Diagram(Peak Flow Conditions)
Map Location
J:\G
IS\P
roje
cts\
10
05
6-B
ea
con
\mxd
\RO
WD
-Oth
ers
\on
site
-wa
ste
wa
ter-
flow
.mxd

CA
NV
AZ
OR
UT
ID
Project: 10056-014Date: June 2009
BSEP
Figure 6BOffsite Groundwater
Wastewater Flow Diagram(Peak Flow Conditions)
Map Location
J:\G
IS\P
roje
cts\
10
05
6-B
ea
con
\mxd
\RO
WD
-Oth
ers
\off
site
-wa
ste
wa
ter-
flow
.mxd

CA
NV
AZ
OR
UT
ID
Project: 10056-014Date: June 2009
BSEP
Figure 7Land Treatment Unit
Flow Diagram
Map Location
J:\G
IS\P
roje
cts\
10
05
6-B
ea
con
\mxd
\RO
WD
-Oth
ers
\lan
dfa
rm f
low
.mx
d

CA
NV
AZ
OR
UT
ID
Project: 10056-014Date: June 2009
BSEP
Figure 8Evaporation Pond Area
Cross Section
Map Location
J:\G
IS\P
roje
cts\
10
05
6-B
ea
con
\mxd
\RO
WD
-Oth
ers
\Eva
po
ratio
n p
on
d c
ross
se
ctio
n.m
xd

CA
NV
AZ
OR
UT
ID
Project: 10056-014Date: June 2009
BSEP
Figure 9Evaporation Pond and
Land Treatment Unit Drainageand Grading Plan
Map Location
J:\G
IS\P
roje
cts\
10
05
6-B
ea
con
\mxd
\RO
WD
-Oth
ers
\ep
lf d
rain
ag
e.m
xd

CA
NV
AZ
OR
UT
ID
Project: 10056-014Date: June 2009
BSEP
Figure 10Evaporation Pond
Section and Details
Map Location
J:\G
IS\P
roje
cts\
10
05
6-B
ea
con
\mxd
\RO
WD
-Oth
ers
\Ev
ap
ora
tion
po
nd
cro
ss s
ect
ion
-de
tails
.mx
d

CA
NV
AZ
OR
UT
ID
Project: 10056-014Date: June 2009
BSEP
Figure 11Land Treatment UnitSection and Details
Map Location
J:\G
IS\P
roje
cts\
10
05
6-B
ea
con
\mxd
\RO
WD
-Oth
ers
\lan
dfa
rm s
ect
ion
.mxd
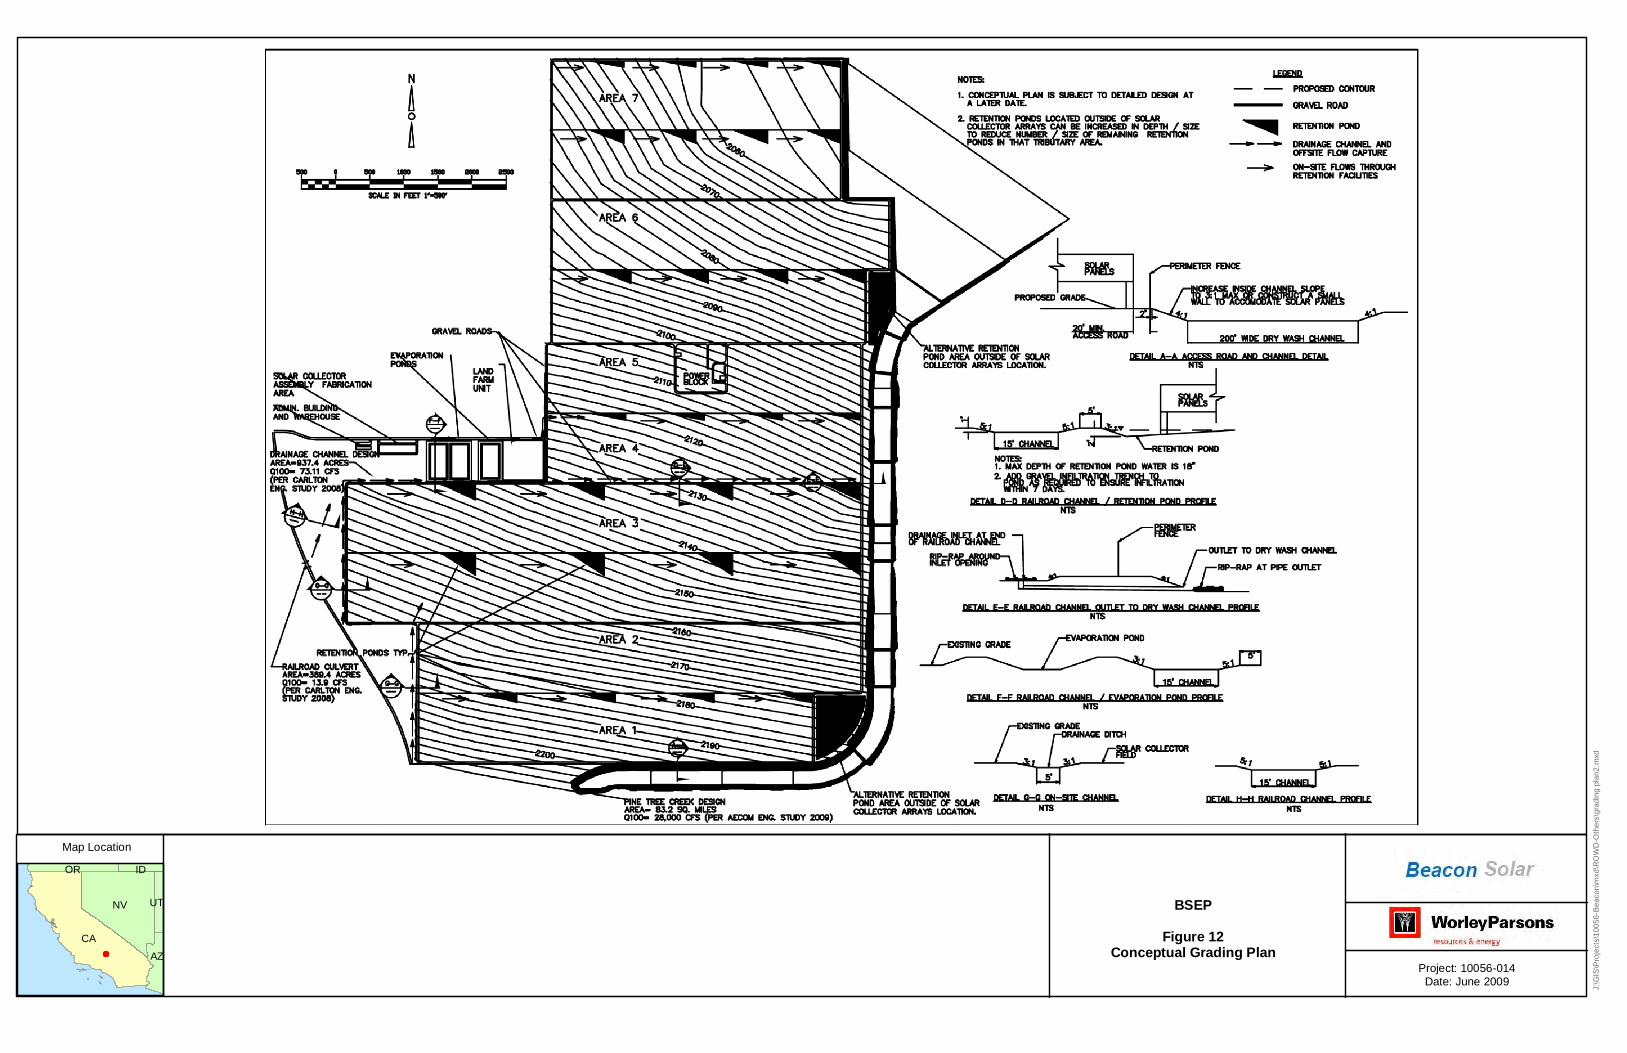
CA
NV
AZ
OR
UT
ID
Project: 10056-014Date: June 2009
BSEP
Figure 12Conceptual Grading Plan
Map Location
J:\G
IS\P
roje
cts\
10
05
6-B
ea
con
\mxd
\RO
WD
-Oth
ers
\gra
din
g p
lan
2.m
xd
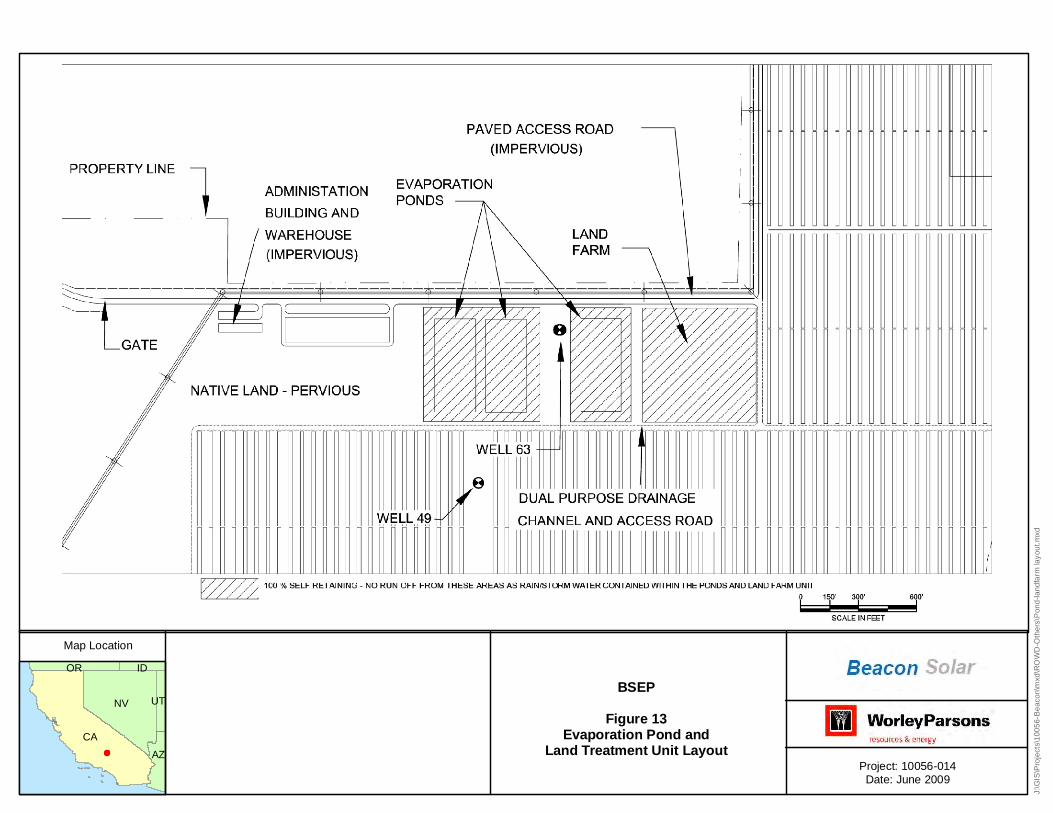
CA
NV
AZ
OR
UT
ID
Project: 10056-014Date: June 2009
BSEP
Figure 13Evaporation Pond and
Land Treatment Unit Layout
Map Location
J:\G
IS\P
roje
cts\
10
05
6-B
ea
con
\mxd
\RO
WD
-Oth
ers
\Po
nd
-la
nd
farm
lay
ou
t.m
xd

Beacon Solar Energy Project 28 June 2009
RoWD Appendix Revisions
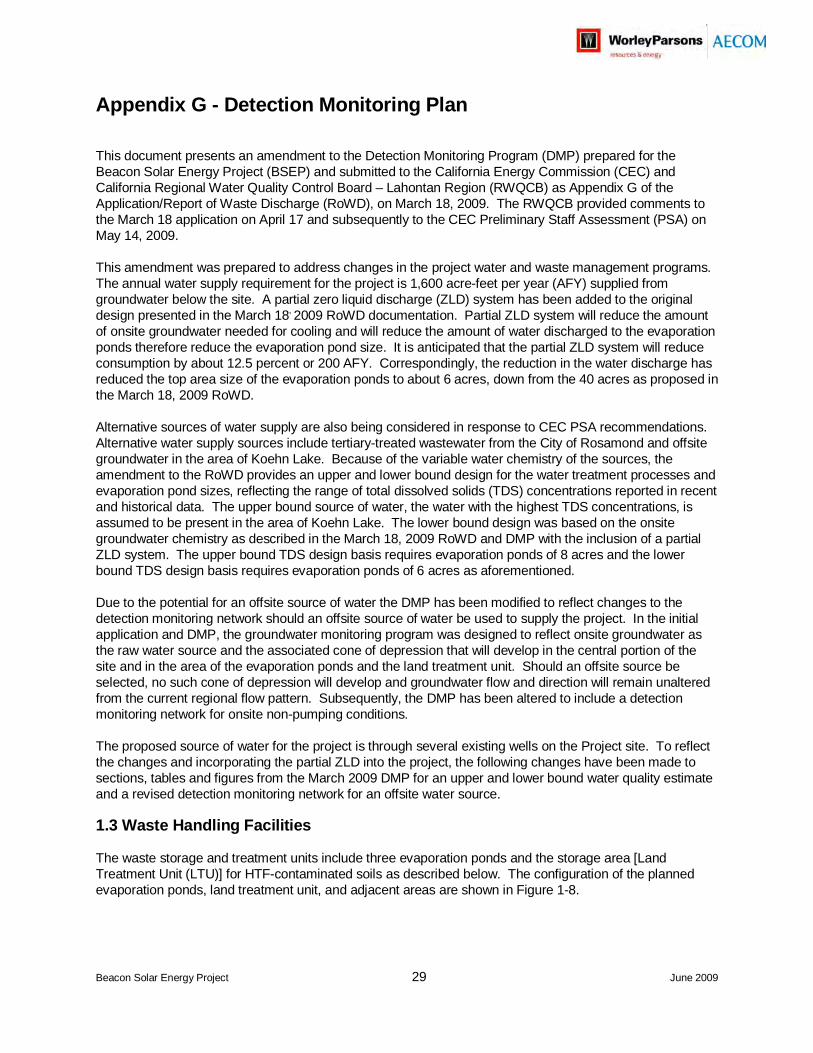
Beacon Solar Energy Project 29 June 2009
Appendix G - Detection Monitoring Plan
This document presents an amendment to the Detection Monitoring Program (DMP) prepared for the Beacon Solar Energy Project (BSEP) and submitted to the California Energy Commission (CEC) and California Regional Water Quality Control Board – Lahontan Region (RWQCB) as Appendix G of the Application/Report of Waste Discharge (RoWD), on March 18, 2009. The RWQCB provided comments to the March 18 application on April 17 and subsequently to the CEC Preliminary Staff Assessment (PSA) on May 14, 2009.
This amendment was prepared to address changes in the project water and waste management programs. The annual water supply requirement for the project is 1,600 acre-feet per year (AFY) supplied from groundwater below the site. A partial zero liquid discharge (ZLD) system has been added to the original design presented in the March 18, 2009 RoWD documentation. Partial ZLD system will reduce the amount of onsite groundwater needed for cooling and will reduce the amount of water discharged to the evaporation ponds therefore reduce the evaporation pond size. It is anticipated that the partial ZLD system will reduce consumption by about 12.5 percent or 200 AFY. Correspondingly, the reduction in the water discharge has reduced the top area size of the evaporation ponds to about 6 acres, down from the 40 acres as proposed in the March 18, 2009 RoWD.
Alternative sources of water supply are also being considered in response to CEC PSA recommendations. Alternative water supply sources include tertiary-treated wastewater from the City of Rosamond and offsite groundwater in the area of Koehn Lake. Because of the variable water chemistry of the sources, the amendment to the RoWD provides an upper and lower bound design for the water treatment processes and evaporation pond sizes, reflecting the range of total dissolved solids (TDS) concentrations reported in recent and historical data. The upper bound source of water, the water with the highest TDS concentrations, is assumed to be present in the area of Koehn Lake. The lower bound design was based on the onsite groundwater chemistry as described in the March 18, 2009 RoWD and DMP with the inclusion of a partial ZLD system. The upper bound TDS design basis requires evaporation ponds of 8 acres and the lower bound TDS design basis requires evaporation ponds of 6 acres as aforementioned.
Due to the potential for an offsite source of water the DMP has been modified to reflect changes to the detection monitoring network should an offsite source of water be used to supply the project. In the initial application and DMP, the groundwater monitoring program was designed to reflect onsite groundwater as the raw water source and the associated cone of depression that will develop in the central portion of the site and in the area of the evaporation ponds and the land treatment unit. Should an offsite source be selected, no such cone of depression will develop and groundwater flow and direction will remain unaltered from the current regional flow pattern. Subsequently, the DMP has been altered to include a detection monitoring network for onsite non-pumping conditions.
The proposed source of water for the project is through several existing wells on the Project site. To reflect the changes and incorporating the partial ZLD into the project, the following changes have been made to sections, tables and figures from the March 2009 DMP for an upper and lower bound water quality estimate and a revised detection monitoring network for an offsite water source.
1.3 Waste Handling Facilities
The waste storage and treatment units include three evaporation ponds and the storage area [Land Treatment Unit (LTU)] for HTF-contaminated soils as described below. The configuration of the planned evaporation ponds, land treatment unit, and adjacent areas are shown in Figure 1-8.

Beacon Solar Energy Project 30 June 2009
1.3.1 Evaporation Ponds
The configuration of the planned evaporation ponds and adjacent areas are shown in the aforementioned Figure 1-8. The evaporation ponds are based on the upper-bound TDS design criteria (total top area of 8 acres). Topography of the BSEP and surrounding areas are shown on Figure 1-9.
The three 2.7-acre evaporation ponds (total combined pond top area of 8.0 acres) have an average proposed design depth of 8 feet, which incorporates the following:
3 feet of residue build up over 3.8 years of operation followed by cleaned out;
3 feet of operational depth; and
2 feet of freeboard.
If the lower bound TDS design was used, each pond would be reduced by 0.7 acres to achieve a top pond area of 6 acres. Then residue built up rate would also be altered to approximately every 4.5 yeas of operation.
The containment design for the evaporation ponds, from the surface of the evaporation ponds downwards, consists of the following:
A hard surface / protective layer with granular fill/free draining sub-base over geotextile;
A primary 60 mil high density polyethylene (HDPE) liner;
An interstitial leak detection and removal system (LDRS) comprising a geomembrane geonet and collection piping;
A secondary 40 mil HDPE liner; and
A base layer consisting of either a geosynthetic clay liner or 2 feet of onsite material with a hydraulic conductivity of less than 1 x 10⁻⁶ centimeter per second of which 30 percent, by weight, shall pass through a No. 200 Standard sieve.
The design details of the Evaporation Ponds are shown in Figure 1-10.
3.1.3 Residue Inspections and Removal
Monthly inspections of the pond inlet, outlet and all associated drainage ditches/pipes/culverts will be conducted for residue including sediment and debris accumulation. If residue appears to be impeding flow into the pond or potential flow from the pond, maintenance actions will be scheduled for cleaning these areas as soon as possible. Residue removal activities will be conducted on an as-needed basis depending upon the inspection results. Residue removal from the ponds is scheduled to occur when 3 feet of residue have built up in each pond, estimated to be every 3.5 to 4.5 years of operation. During these activities, residue associated with pond inlet/outlet would also be removed.
3.3.1 Evaporation Pond Cleanout
The ponds are designed to hold up to 3 feet of accumulated residue/precipitated solids before clean out is required. It is estimated the ponds can operate for approximately 3.8 to 4.5 years before the 3 foot accumulation is reached and cleanout is required.
4.1 Groundwater Monitoring
In accordance with CCR Title 27, Chapter 3, Subchapter 3, Article 1, Section 20380, a groundwater monitoring network (GMN) will be established at the site to monitor groundwater for impacts from potential releases from the three proposed evaporation ponds and the proposed (LTU). The proposed GMN will

Beacon Solar Energy Project 31 June 2009
consist of a combination of four existing onsite and offsite wells and three new proposed onsite monitoring wells.
The depth to groundwater below the site, measured in October 2007, ranged from 210 (west end of site) to 436 feet below ground surface (bgs) (east end of Ste). In the vicinity of the proposed evaporation ponds and LTU, the depth to groundwater ranged from approximately 276 to 284 feet bgs. Groundwater flow is to the east-northeast at a gradient of about 0.012 feet per foot (Figure 4-1).To provide water to the proposed facility, BSEP proposes to:
1) Alternately pump onsite Wells 49 and 63 (see Figure 4-1) as the primary water supply wells. Wells 41 and 42 will be used as backup water sources, should either of the two primary wells require shutdown for maintenance or be damaged/destroyed. Figure 4-1 shows the predicted groundwater drawdown under the site due to active pumping of Wells 49 and 63; or 2) obtain water from an offsite source (recycled wastewater from Rosamond Wastewater Treatment Plant or groundwater from the Koehn Lake region) via pipeline.
The proposed GMN is designed to address the hydrogeologic conditions that will occur during: 1) active onsite pumping from the regional groundwater aquifer that occurs between 210 and 436 feet bgs; or 2) non-pumping (static) conditions at the site. Table 4-1 is a summary of the well details in the vicinity of the site. Table 4-2a is a summary of analytical results of groundwater from Wells 43, 48, and 63 that were sampled in September 2007 and Table 4-2b is a summary of analytical results of offsite groundwater from Well 30S37E13C01M, located near Koehn Lake.
A list of chemical additives that are anticipated to be added to process water on a regular basis is presented on Table 4-3.
4.1.1.1 Groundwater Monitoring Network Layout for Regional Groundwater
The proposed GMN layout includes two categories of monitoring wells: 1) detection wells, which are located adjacent to the evaporation ponds and LTU; and 2) compliance wells, which are located near the property boundaries. For both onsite and offsite water supply scenarios, the detection wells are comprised of three proposed wells (MW-1 through MW-3) located immediately adjacent to the evaporation ponds and LTU. Depending on the water supply scenario, the compliance wells will consist of existing onsite and offsite Well 47, Domestic Well, Well 51 and Well USGS for onsite pumping. For offsite water supply Well 47, Well 41, Domestic Well, Well 51, Well 50 and Well USGS will be used as compliance wells.
As shown in Figure 4-1a, a cone of depression will develop under the evaporation ponds and LTU due to the location of primary pumping Wells 49 and 63. Should either of the back-up wells be needed, the center of the groundwater sink would likely migrate closer to the evaporation ponds and the LTU. Under pumping conditions, groundwater is predicted to move toward the primary pumping well(s) from all points of the compass. Thus, all of the wells will become background compliance wells and the well that is pumping will be considered a detection well.
As shown in Figure 4-1b, the offsite water supply scenario does not alter the existing static conditions at the site. Existing wells 41, 47 and the Domestic Well will be considered background compliance wells. Wells 51, 50 and USGS will be considered downgradient compliance wells.
4.1.1.3 GMN Well Rehabilitation and Installation Activities
The GMN is based on using existing water supply wells that are inactive (no longer used to provide water for agriculture and are currently permitted as “Not in Service” through Kern County) as monitoring wells and the installation of new monitoring wells. The GMN installation will comprise two main activities: 1) rehabilitation and modification of existing wells 47, 51 and USGS, as well as the Domestic Well under the onsite pumping scenario or rehabilitation and modification of existing wells 47, 41, 50, 51, USGS and the Domestic Well

Beacon Solar Energy Project 32 June 2009
under the offsite supply scenario; and 2) installation of three new proposed monitoring wells. The steps associated with each activity are described below.
Rehabilitation and Modification of Existing Wells
All existing wells proposed to be included in the GMN will undergo the following:
1. Measurement of the well total depth (TD) and depth to water;
2. A video log survey to identify the screen interval, condition of the well and screen and occurrence of any debris in the well;
3. Removal of any debris identified in the video log survey;
4. Re-measurement of well TD and rerun of the video log (if not previously to well TD), repeat as necessary;
5. If the regional water level is below the top of the screen interval, the well will be considered viable for monitoring the water table;
6. Conduct a non-pumping spinner log test on the well to determine if there is upward groundwater flow in the well. If no upward flow is detected, the well will be judged to have passed the spinner log test and included in the GMN; and
7. Redevelop well and cut down/modify well head completion as appropriate for location within the solar field.
Should an existing well not meet the requirement of the water table being below the top of the screen interval or not pass the spinner log test, a new monitoring well will be installed in the general vicinity of the existing well. In addition should any of the existing wells become unusable in the future, new monitoring wells will be installed as replacements. The specific location and construction of the replacement wells will be based on the hydrogeologic conditions at the time of the installation.
Field activities including drilling, well installation, well development, groundwater sampling, field analytical procedures, and record keeping will be performed using the standard operating procedures provided in Appendix B. Field activities will be performed under the oversight of a California-registered Professional Geologist.
Beacon Solar Energy Project 33 June 2009
Detection Monitoring Plan Table Revisions

Table 3-1A Anticipated Chemistry of Wastewater Streams For Onsite Groundwater (Lower TDS)
Constituent Units Concentration in Mean Well
Water
Concentration in Cooling
Tower Blow Down
Concentration in Ion
Exchange Regeneration Wastewater
Concentration into Brine
Concentrator
Concentration in Evaporation
Pond Discharge
STLC (mg/L)
TCLP (mg/L)
Aluminum (total) (mg/L Al) 0.023 0.04 0.25 0.15 1.54 * *
Ammonia (as N) 0.038 0.06 0.41 0.26 2.55 * *
Arsenic (total) (mg/L As) 0.0035 0.01 0.04 0.02 0.23 5.0 5.0
Boron (total) (mg/L B) 0.18 0.30 1.96 1.21 12.08 * *
Calcium (total) (mg/L Ca) 47 77.40 511.83 315.43 3151.11 * *
Chloride (mg/L Cl) 15.5 25.50 168.80 104.01 1039.08 * *
Cyanide (total) (mg/L as HCN)
0.007 0.01 0.08 0.05 0.47 * *
Fluoride (mg/L as F) 0.459 0.75 5.00 3.08 30.75 180 *
HCO3 (bicarbonate alkalinity)
(mg/L HCO3) 257 16.40 48.68 34.09 340.53 * *
Iron (total) (mg/L Fe) 0.047 0.08 0.51 0.32 3.15 * *
Magnesium (total) (mg/L Mg) 11 18.15 119.79 73.84 737.65 * *
M-Alkalinity (mg/L as CaCO3)
207 14.10 2254.23 1241.48 12402.37 * *
Nitrate (mg/L as NO3)
1.183 1.95 12.88 7.94 79.32 * *
Phosphate (total) (mg/L as PO4)
0.019 0.03 0.21 0.13 1.27 * *
Potassium (total) (mg/L K) 4.1 6.76 44.65 27.52 274.92 * *
Selenium (total) (mg/L Se) 0.00039 0.00 0.00 0.00 0.03 1.0 1.0
Silica (mg/L as SiO2)
33.3 54.90 362.64 223.51 2232.87 * *
Silicon (mg/L as Si) 15.7 24.35 170.97 104.69 1045.80 * *
Sodium (total) (mg/L Na) 78 141.90 3739.92 2113.27 21111.58 * *
Strontium (total) (mg/L Sr) 0.78 1.21 8.49 5.20 51.96 * *

Table 3-1A Anticipated Chemistry of Wastewater Streams For Onsite Groundwater (Lower TDS)
Constituent Units Concentration in Mean Well
Water
Concentration in Cooling
Tower Blow Down
Concentration in Ion
Exchange Regeneration Wastewater
Concentration into Brine
Concentrator
Concentration in Evaporation
Pond Discharge
STLC (mg/L)
TCLP (mg/L)
Sulfate (mg/L SO4) 118 477.56 6952.81 4025.38 40213.55 * *
Zinc (total) (mg/L Zn) 0.012 0.02 0.13 0.08 0.80 250 *
pH pH 8.00 7.00
Total Dissolved Solids (ppm) 550 857.28 12150.05 7044.64 70331.24 * *
Notes: Regulatory Standards/Reportable Quantities are for elements mentioned only * Not listed/no standards ---- Unknown STLC = Soluble Threshold Limit Concentration, Regulated by CCR Title 22, Division 4.5, Article 3, Section 66261.24 TCLP = Toxicity Characteristics Leaching Procedure; Regulated under 40 CFR Section 261.24
Notes:
Regulatory Standards/Reportable Quantities are for elements mentioned only * Not listed/no standards ---- Unknown STLC = Soluble Threshold Limit Concentration, Regulated by CCR Title 22, Division 4.5, Article 3, Section 66261.24
TCLP = Toxicity Characteristics Leaching Procedure; Regulated under 40 CFR Section 261.24
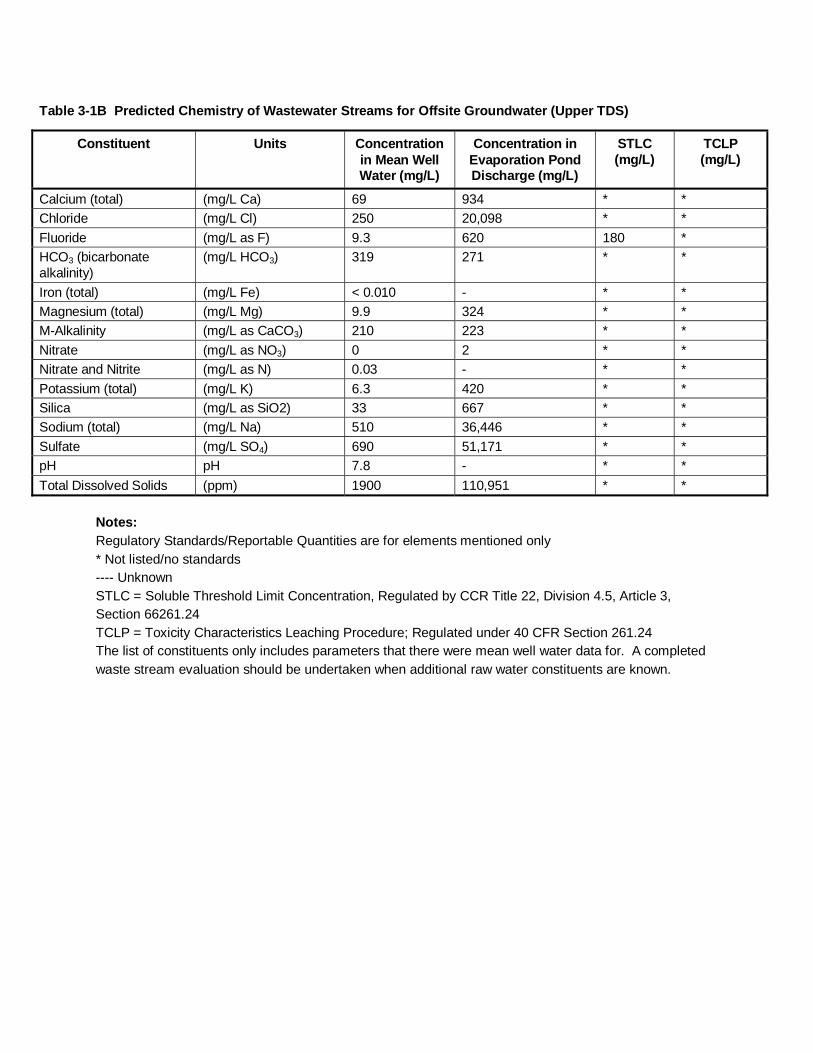
Table 3-1B Predicted Chemistry of Wastewater Streams for Offsite Groundwater (Upper TDS)
Constituent Units Concentration in Mean Well Water (mg/L)
Concentration in Evaporation Pond Discharge (mg/L)
STLC (mg/L)
TCLP (mg/L)
Calcium (total) (mg/L Ca) 69 934 * *
Chloride (mg/L Cl) 250 20,098 * *
Fluoride (mg/L as F) 9.3 620 180 *
HCO3 (bicarbonate alkalinity)
(mg/L HCO3) 319 271 * *
Iron (total) (mg/L Fe) < 0.010 - * *
Magnesium (total) (mg/L Mg) 9.9 324 * *
M-Alkalinity (mg/L as CaCO3) 210 223 * *
Nitrate (mg/L as NO3) 0 2 * *
Nitrate and Nitrite (mg/L as N) 0.03 - * *
Potassium (total) (mg/L K) 6.3 420 * *
Silica (mg/L as SiO2) 33 667 * *
Sodium (total) (mg/L Na) 510 36,446 * *
Sulfate (mg/L SO4) 690 51,171 * *
pH pH 7.8 - * *
Total Dissolved Solids (ppm) 1900 110,951 * * Notes: Regulatory Standards/Reportable Quantities are for elements mentioned only * Not listed/no standards ---- Unknown STLC = Soluble Threshold Limit Concentration, Regulated by CCR Title 22, Division 4.5, Article 3, Section 66261.24 TCLP = Toxicity Characteristics Leaching Procedure; Regulated under 40 CFR Section 261.24 The list of constituents only includes parameters that there were mean well water data for. A completed waste stream evaluation should be undertaken when additional raw water constituents are known.

Table 3-2 Evaporation Pond Wastewater Startup and Annual Sampling Parameters
Parameter U.S. EPA or Standard Method
RL Goal Units
Ammonia (as N) 350.1 100 ug/L
Aluminum 200.7 20 ug/L
Arsenic 6020 2.0 ug/L
Boron 200.7 140 ug/L
Calcium 200.7 40,000 ug/L
Chloride 300.0 14,000 ug/L
Cyanide (total) SM 4500 10 ug/L
Fluoride 300.0 500 ug/L
Iron 200.7 20 ug/L
Magnesium 200.7 10,000 ug/L
Manganese 200.7 15 ug/L
Molybdenum 6020 10.00 ug/L
Nitrate as Nitrogen 300.0 1,000 ug/L
Nitrite as Nitrogen SM 4500 4 ug/L
Potassium 200.7 3,000 ug/L
Phosphate (total) 365.3 100 ug/L
Selenium 6020 0.5 ug/L
Silica (as SiO2) 200.7 1,000 ug/L
Silicon (as Si) 200.7 1,000 ug/L
Sodium 200.7 10,000 ug/L
Strontium 200.7 500 ug/L
Sulfate 300.0 100,000 ug/L
TDS SM 2540C 10,000 ug/L
Total Alkalinity (as CaCO3)
SM 2320B 100,000 ug/L
Zinc 6020 10 ug/L
Biphenyl Oxide 8015M 500 ug/L
Diphenyl Oxide 8015M 500 ug/L
Cyclohexamine (20-40%)
8015M 500 ug/L
Morpholine (1-10%)
8015M 500 ug/L
pH reading Field +/- 0.1 pH units
Temperature Field +/- 0.1 °F or °C
Table 3-2 Evaporation Pond Wastewater Startup and Annual Sampling Parameters
Parameter U.S. EPA or Standard Method
RL Goal Units
Nalco 3D Trasar 177
Hand-Held Fluorometer
na na
Nalco 3D Trasar 190
Hand-Held Fluorometer
na na
Key: CaCO3 - calcium carbonate SM – Standard Method ug/L – micrograms per liter na – not applicable RL – reporting limit

Table 3-4A Predicted Chemistry of Evaporation Pond Residue
Constituent Concentration in Mean Well
Water
Total Residue Mass After 30
Years
Concentration in Residue
STLC TTLC Wet-
Weight
TCLP
(ppm) (lbs) (% or ppm) (mg/L) (mg/kg) (mg/L)
CATIONS
Ammonia 0.038 5,000 97 ppm * * *
Calcium 47 6,130,900 11.93% * * *
Magnesium 11 1,434,891 2.79% * * *
Potassium 4.1 530,475 1.03% * * *
Sodium 78 10,174,684 19.80% * * *
ANIONS
Alkalinity 30 3,909,869 7.61% * * *
HCO3 (bicarbonate alkalinity)
37 4,855,806 9.45% * * *
CO3 (carbonate alkalinity) 0 0 0 ppm * * *
Boron 0.18 23,480 457 ppm * * *
Chloride 15.5 2,026,241 3.94% * * *
Fluoride 0.459 59,918 1166 ppm 180 18,000 *
Nitrate 1.183 154,360 0.30% * * *
Phosphate 0.019 2,522 49 ppm * * *
Polyphosphate 0 0 0.00% * * *
Silica 33.3 4,343,808 8.45% * * *
Silicon 15.7 2,043,633 3.98% * * *
Sulfate 118 15,392,471 29.95% * * *
METALS
Aluminum 0.023 3,000 58 ppm * * *
Arsenic 0.0035 457 9 ppm 5.0 500 5.0
Antimony 0.0006 82 2 ppm 15 500 *
Barium 0.036 4,739 92 ppm * * 100.0
Chromium 0.0012 157 3 ppm * * 5.0
Cobalt 0.00005 7 0 ppm 5 2,500 *
Copper 0.002 239 5 ppm * * *
Cyanide (amenable/total) 0.007 870 17 ppm * * *
Hexavalent Chromium 0.0015 196 4 ppm 5 500 5.0
Notes:
Regulatory Standards/Reportable Quantities are for elements mentioned only * Not listed/no standards The only source for these species is from ground water makeup. Site will makeup 1600 acre-feet per year for 30 years. All waste is non-volatile and will be collected in the evaporation ponds. All species removed by ion exchange are returned to the evap ponds during regen

TABLE 3-4B: PREDICTED CHEMISTRY OF EVAPORATION POND RESIDUE FOR OFFSITE GROUNDWATER (UPPER TDS)
Constituent Concentration Used in Water Balance (Well
30S37E13CO1M)
Total Residue Mass After 30 Years
(lbs)
CATIONS
Calcium 69 9,000,682
Magnesium 9.9 1,291,402
Sodium 510 66,526,783
Potassium 6.3 821,801
ANIONS
Boron 30 3,913,340
Chloride 250 32,611,168
Fluoride 9.3 1,213,135
Silica 33 4,304,674
METALS
Iron 0.01 1,304 Notes: Regulatory Standards/Reportable Quantities are for elements mentioned only * Not listed/no standards 1. A comparison to STLC / TTLC or TCLP is not possible as there is significant data gaps. 2. The list of constituents only includes parameters that there were mean well water data for. A completed waste stream stream evaluation should be undertaken when additional raw water constituents are known 3. The only source for these species is from ground water makeup. 4. Site will makeup 1600 acre-feet per year for 30 years. 5. All waste is non-volatile and will be collected in the evaporation ponds. 6. All species removed by ion exchange are returned to the evap ponds during regen
Table 4-2A Summary of 2007 Groundwater Analytical Results – Wells 43, 48, and 63
WELL2 STATISTICS3 WATER QUALITY SUMMARY4
No. 43 No. 48 No. 63
Sample Date
State
of California
Federal Federal5 CHEMICAL GROUP ANALYTE1 ANALYTICAL METHOD
UNITS
9/28/2007 9/20/2007 9/11/2007
Mean Maximum Minimum
MCL MCL PRG
Volatile Organic Compounds (VOCs) No analytes reported above practical quantitation limits (PQLs)
Semivolatile Organic Compounds (SVOCs)
No analytes reported above practical quantitation limits (PQLs)
Petroleum Hydrocarbons Gasoline Range Organics (GRO)
USEPA 8015B
ug/l ND<25 ND<50 ND<50 -- -- -- -- -- --
Diesel Range Organics (DRO)
USEPA 8015B
ug/l ND<50 ND<50 ND<50 -- -- -- -- -- --
Oil Range Organics (ORO) USEPA 8015B
ug/l ND<500 ND<500 ND<500 -- -- -- -- -- --
Organochlorine Pesticides No analytes reported above practical quantitation limits (PQLs) -- -- --
Organophosphorous Pesticides Dimethoate USEPA 8141A
ug/l ND<0.5 ND<0.5 0.18J -- -- -- -- -- 7.3
Fensulfothion USEPA 8141A
ug/l 0.26J ND<2.5 0.31J -- -- -- -- -- --
Chlorinated Herbicides No analytes reported above practical quantitation limits (PQLs)
Polychlorinated Biphenyls No analytes reported above practical quantitation limits (PQLs)

Table 4-2A Summary of 2007 Groundwater Analytical Results – Wells 43, 48, and 63
WELL2 STATISTICS3 WATER QUALITY SUMMARY4
No. 43 No. 48 No. 63
Sample Date
State
of California
Federal Federal5 CHEMICAL GROUP ANALYTE1 ANALYTICAL METHOD
UNITS
9/28/2007 9/20/2007 9/11/2007
Mean Maximum Minimum
MCL MCL PRG
Aluminum, Dissolved USEPA 200.7
ug/l 7.9J ND<20 ND<20 -- -- -- 200 or
1,0006
50 or
2006
36,000
Aluminum, Total USEPA 200.7
ug/l 36 33 ND<20 -- -- --
Antimony, Dissolved USEPA 6020 ug/l 1.3 0.30J 0.28J -- -- -- 6 6 14.6
Antimony, Total USEPA 6020 ug/l ND<5 ND<0.1 ND<5 -- -- --
Arsenic, Dissolved USEPA 6020 ug/l 4.0 2.8 3.4 3.4 4.0 2.8 50 10 0.0071
Arsenic, Total USEPA 6020 ug/l 4.1 3.0 3.4 3.5 4.1 3
Barium, Dissolved USEPA 6020 ug/l 26 45 37 36 45 26 1,000 2,000 2,600
Barium, Total USEPA 6020 ug/l 27 41 36 35 41 27
Beryllium, Dissolved USEPA 6020 ug/l ND<0.3 ND<0.3 ND<0.3 -- -- -- 4 4 73
METALS
Beryllium, Total USEPA 6020 ug/l ND<0.3 ND<0.3 ND<0.3 -- -- --
Boron, Dissolved USEPA 200.7
ug/l 240 160 140 180 240 140 -- -- 7,300
Boron, Total USEPA 200.7
ug/l 240 160 140 180 240 140
Cadmium, Dissolved USEPA 200.7
ug/l ND<0.5 ND<0.5 ND<0.5 -- -- -- 5 5 18
Cadmium, Total USEPA 200.7
ug/l ND<0.5 ND<0.5 ND<0.5 -- -- --
Chromium, Dissolved USEPA 6020 ug/l 0.45J 2.8 0.070J -- -- -- 50 100 55,000
Chromium, Total USEPA 6020 ug/l 0.70J 3.5 0.11J -- -- --
Chromium, Hexavalent7 USEPA 218.6
ug/l 0.3 2.7 ND<0.1 -- -- -- 50 -- 110
Cobalt, Dissolved USEPA 6020 ug/l ND<0.2 ND<0.2 0.05J -- -- -- -- -- 730
Cobalt, Total USEPA 6020 ug/l ND<0.2 ND<0.2 0.05J -- -- --

Table 4-2A Summary of 2007 Groundwater Analytical Results – Wells 43, 48, and 63
WELL2 STATISTICS3 WATER QUALITY SUMMARY4
No. 43 No. 48 No. 63
Sample Date
State
of California
Federal Federal5 CHEMICAL GROUP ANALYTE1 ANALYTICAL METHOD
UNITS
9/28/2007 9/20/2007 9/11/2007
Mean Maximum Minimum
MCL MCL PRG
Copper, Dissolved USEPA 6020 ug/l 1.8J 2 3.4 -- -- -- 1,300 1,300 1,500
Copper, Total USEPA 6020 ug/l 4.1 5.7 3.7 4.5 5.7 3.7
Iron, Dissolved USEPA 200.7
ug/l 18J 15J 25 -- -- -- 300 300 11,000
Iron, Total USEPA 200.7
ug/l 60 14J 67 -- -- --
Lead, Dissolved USEPA 6020 ug/l 0.060J 0.30J 0.56J -- -- -- 15 15 --
Lead, Total USEPA 6020 ug/l 0.41J 0.96J 0.56J -- -- --
Manganese, Dissolved USEPA 200.7
ug/l 29 15 48 31 48 15 50 50 880
Manganese, Total USEPA 200.7
ug/l 57 15 47 40 57 15
Mercury, Dissolved USEPA 7470A
ug/l ND<0.1 ND<0.1 ND<0.1 -- -- -- 2 2 11
Mercury, Total USEPA 7470A
ug/l ND<0.1 ND<0.1 ND<0.1 -- -- --
Molybdenum, Dissolved USEPA 6020 ug/l 23 12 16 17 23 12 -- -- 180
Molybdenum, Total USEPA 6020 ug/l 23 11 16 17 23 11
Nickel, Dissolved USEPA 6020 ug/l 0.07J 0.13J 0.18J -- -- -- 100 100 730
Nickel, Total USEPA 6020 ug/l 0.09J 0.46J 0.21J -- -- --
Selenium, Dissolved USEPA 6020 ug/l 0.375 0.5J 0.28J -- -- -- 50 50 180
Selenium, Total USEPA 6020 ug/l 0.38J 0.48J 0.31J -- -- --
Silicon, Total USEPA 200.7
ug/l 15,000 16,000 16,000 15,667 16,000 15,000 -- -- --
Silver, Dissolved USEPA 6020 ug/l ND<0.5 ND<0.5 ND<0.5 -- -- -- 100 100 180
Silver, Total USEPA 6020 ug/l ND<0.5 ND<0.5 ND<0.5 -- -- --

Table 4-2A Summary of 2007 Groundwater Analytical Results – Wells 43, 48, and 63
WELL2 STATISTICS3 WATER QUALITY SUMMARY4
No. 43 No. 48 No. 63
Sample Date
State
of California
Federal Federal5 CHEMICAL GROUP ANALYTE1 ANALYTICAL METHOD
UNITS
9/28/2007 9/20/2007 9/11/2007
Mean Maximum Minimum
MCL MCL PRG
Strontium, Dissolved USEPA 200.7
ug/l 730 740 840 770 840 730 -- -- 22,000
Strontium, Total USEPA 200.7
ug/l 760 750 820 777 820 750
Thallium, Dissolved USEPA 6020 ug/l ND<0.5 ND<0.5 0.13J -- -- -- 2 2 2.4
Thallium, Total USEPA 6020 ug/l ND<0.5 ND<0.5 0.3J -- -- --
Vanadium, Dissolved USEPA 6020 ug/l 7.4 5.8 4.7J -- -- -- -- -- 36
Vanadium, Total USEPA 6020 ug/l 7.8 6.2 4.7J -- -- --
Zinc, Dissolved USEPA 6020 ug/l 10 13 11 11 13 10 5,000 5,000 11,000
Zinc, Total USEPA 6020 ug/l 11 13 10 11 13 10
Chloride USEPA 300.0
mg/l
18 14 15 16 18 14 250-500 250 --
Fluoride USEPA 300.0
mg/l
0.6 0.4J 0.4J -- -- -- 2 4 --
Nitrate as Nitrogen USEPA 300.0
mg/l
1.0 1.5 1.1 1.2 1.5 1 10 10 10
Nitrite as Nitrogen SM 4500-NO2-B
mg/l
0.002 ND<0.004
0.012 -- -- -- 1 1 1
Ammonia as N USEPA 350.1
mg/l
0.084J 0.031J ND<0.1 -- -- -- 10 10 10
MAJOR ANIONS
Sulfate USEAP 300.0
mg/l
120 110 120 117 120 110 250-500 250 --
Calcium, Dissolved USEPA 200.7
mg/l
45 46 50 47 50 45 -- -- -- MAJOR CATIONS
Calcium, Total USEPA 200.7
mg/l
45 46 50 47 50 45
Table 4-2A Summary of 2007 Groundwater Analytical Results – Wells 43, 48, and 63
WELL2 STATISTICS3 WATER QUALITY SUMMARY4
No. 43 No. 48 No. 63
Sample Date
State
of California
Federal Federal5 CHEMICAL GROUP ANALYTE1 ANALYTICAL METHOD
UNITS
9/28/2007 9/20/2007 9/11/2007
Mean Maximum Minimum
MCL MCL PRG
Magnesium, Dissolved USEPA 200.7
mg/l
11 12 10 11 12 10 -- -- --
Magnesium, Total USEPA 200.7
mg/l
11 12 10 11 12 10
Potassium, Dissolved USEPA 200.7
mg/l
3.7 4.3 4.2 4.1 4.3 3.7 -- -- --
Potassium, Total USEPA 200.7
mg/l
3.6 4.3 4.1 4 4.3 3.6
Sodium, Dissolved USEPA 200.7
mg/l
74 82 75 77 82 74 -- -- --
Sodium, Total USEPA 200.7
mg/l
74 84 76 78 84 74
Alkalinity as CaCO3 SM 2320B mg/l
170 290 160 207 290 160 -- -- --
Biochemical Oxygen Demand
SM 5310 B mg/l
ND<10 ND<10 ND<10 -- -- -- -- -- --
Bicarbonate Alkalinity as HCO3
SM 2320B mg/l
210 360 200 257 360 200 -- -- --
Carbonate Alkalinity as CaCO3
SM 2320B mg/l
ND<2 120 ND<2 -- -- -- -- -- --
Hardness, Total as CaCO3 USEPA 200.7
mg/l
160 160 170 163 170 160 -- -- --
Hydroxide Alkalinity as Ca CO3
SM 2320B mg/l
ND<2 NR ND<2 -- -- -- -- -- --
Orthophosphate as Phosphate
USEPA 300.0
mg/l
ND<0.5 ND<0.5 ND<0.5 -- -- -- -- -- --
GENERAL WATER CHEMISTRY
Phosphate, Total as PO4 USEPA 365.3
mg/l
0.11J 0.064 0.047J -- -- -- -- -- --

Table 4-2A Summary of 2007 Groundwater Analytical Results – Wells 43, 48, and 63
WELL2 STATISTICS3 WATER QUALITY SUMMARY4
No. 43 No. 48 No. 63
Sample Date
State
of California
Federal Federal5 CHEMICAL GROUP ANALYTE1 ANALYTICAL METHOD
UNITS
9/28/2007 9/20/2007 9/11/2007
Mean Maximum Minimum
MCL MCL PRG
Sulfide, Soluble SM 4500 S2-D
mg/l
ND<0.1 ND<0.1 ND<0.1 -- -- -- -- -- --
Sulfide, Total SM 4500 S2-D
mg/l
ND<0.1 ND<0.1 ND<0.1 -- -- -- -- -- --
Total Dissolved Solids (TDS) SM 2540C mg/l
550 470 470 497 550 470 500-1,000
500 --
Total Organic Carbon (TOC) SM 5310C mg/l
0.16J 0.15J 0.23J -- -- -- -- -- --
Total Settleable Solids SM 2540F ml/l ND<0.1 ND<0.1 ND<0.1 -- -- -- -- -- --
Cyanide (total) SM 4500-CN-E
mg/l
ND<0.01 0.020 ND<0.01 -- -- -- 0.1 0.2 0.73
Cyanide Free (amenable) SM 4500-CN-G
mg/l
ND<0.01 0.020 ND<0.01 -- -- --
Gross Alpha Particle Activity8 USEPA 900.0
pCi/L
9.1 (11.3) pCi/L
9.3 (11.8) pCi/L
ND <3 pCi/L
-- -- -- 15 pCi/L 15 pCi/L --
Total Toxic Organic Halogens (TOX)
SM 5320B mg/l
ND<0.02 ND<0.02
ND<0.02 -- -- -- -- -- --
OTHER ANALYTES
Reactive Silica as SiO2 SM 4500-SiO2-C
mg/l
30 34 33 32 34 30 -- -- --
Silica USEPA/ML 200.7
mg/l
-- -- 35.9 -- -- -- -- -- --
Silt Density Index ASTM D4189 -- 1.17 0.6 0.2 0.7 1.2 0.2 -- -- --
NOTES
1 Only the analytes reported above the practical quantitation limit were reported. Refer to Appendix __ for the certified analytical laboratory reports and chain-of-custody documentation.
2 Analyte concentrations reported in BOLD are above any one of the numerical water quality criteria.

Table 4-2A Summary of 2007 Groundwater Analytical Results – Wells 43, 48, and 63
WELL2 STATISTICS3 WATER QUALITY SUMMARY4
No. 43 No. 48 No. 63
Sample Date
State
of California
Federal Federal5 CHEMICAL GROUP ANALYTE1 ANALYTICAL METHOD
UNITS
9/28/2007 9/20/2007 9/11/2007
Mean Maximum Minimum
MCL MCL PRG
3 Elementary statistics provided. Only complete data sets with values not estimated ("J") or without any values that were not reported ("ND") were calculated.
4 Water quality data provided assuming a drinking water resources (i.e., State of California and Federal MCL values) or a USEPA Region IW Preliminary Remediation Goal for tap water.
5 USEPA Region IX (San Francisco) Preliminary Remediation Goal for tap water.
6 Secondary MCL for a drinking water (i.e., "Consumer Acceptance Levels"). Secondary MCLs shall be monitored in water supplied to the public
in addition to bicarbonate, carbonate and hydroxide alkalinity, calcium, magnesium sodium, pH and total hardness.
7 A separate California MCL for hexavalent chromium has not been established (OHHEA is currently working on a PHG for hexavalent chromium).
8 Value in parentheses includes the primary value plus the error (2 sigma error)
ACRONYMS and DEFINITIONS
ASTM American Standards Testing and Materials
Dissolved Sample filtered (0.45 micron) prior to analysis.
J Estimated value. Concentration detected between the practical quantitation limit and method detection limit.
MCL Maximum contaminant level for a drinking water resource
State of California, Title 22 CCR, Article 5.5, Section 64444 (Table 64444-A) - Maximum Contaminant Levels - Organic Compounds for Public Water Systems
State of California, Title 22 CCR, Article 4, Section 64431 (Table 64431-A) - Maximum Contaminant Levels - Inorganic Chemicals for Public Water Systems
State of California, Title 22 CCR, Article 16, Section 64449 (Table 64449 A/B) - Secondary Maximum Contaminant Levels - Consumer Acceptance Contaminant Level Ranges
40CFR, Part 141 - National Primary Drinking Water Standards, Section 141.11 - Maximum Contaminant Levels for Inorganic Chemicals
40CFR, Part 141 - National Primary Drinking Water Standards, Section 141.61 - Maximum Contaminant Levels for Organic Chemicals

Table 4-2A Summary of 2007 Groundwater Analytical Results – Wells 43, 48, and 63
WELL2 STATISTICS3 WATER QUALITY SUMMARY4
No. 43 No. 48 No. 63
Sample Date
State
of California
Federal Federal5 CHEMICAL GROUP ANALYTE1 ANALYTICAL METHOD
UNITS
9/28/2007 9/20/2007 9/11/2007
Mean Maximum Minimum
MCL MCL PRG
40CFR, Part 141 - National Primary Drinking Water Standards, Section 14.3 - Secondary Maximum Contaminant Levels
mg/l milligrams per liter
ml/l milliliters per liter
ND <50 Not Detected at the practical quantitation limit shown
NR Not reported by the Laboratory (at present, inquiry has been made of the lab to resolve as this analyze was reported in the other samples)
PQL Practical quantitation limit
SM Standard Methods
SVOC Semivolatile organic compounds
Total Un-filtered sample analyzed
TDS Total Dissolved Solids
TOC Total Organic Carbon
TOX Total Organic Halogens
TSS Totals Suspended Solids
VOC Volatile organic compounds
USEPA United States Environmental Protect Agency
ug/l micrograms per liter
-- Not reported or no standard reported. In the case of silica, laboratory should not have initially reported this analyte by the method employed (Well No. 63 sample).

Table 4-2B Raw Water Chemistry
ON-SITE WELLS KOEHN LAKE OFF-SITE WELLS
Constituent 2007 Well 63 2007 Well 48 2007 Well 43 Concentration in Mean Well
Water
Concentration in Mean Well Water
Concentration Used in Water Balance
(Well 30S37E13CO1M)
(ppm) (ppm) (ppm)
Calcium 50 46 45 47 116 69
Magnesium 10 12 11 11 31.4 9.9
Sodium 76 84 74 78 572 510
Potassium 4.2 4.3 3.7 4.1 8.5 6.3
Iron 0.067 0.015 0.06 0.047 0.25 < 0.010
Ammonia 0 0.031 0.084 0.038 * *
Aluminum 0 0.033 0.036 0.023 * *
Zinc 0.011 0.013 0.011 0.012 * *
Boron 0.14 0.16 0.24 0.18 4.32 30
Chloride 14.6 14 18 15.5 746 250
Sulfate 124 110 120 118 476 690
Alkalinity 160 290 170 207 * 210
HCO3 (bicarbonate alkalinity)
200 360 210 257 250 319
CO3 (carbonate alkalinity) ND * ND * 3 0
Cyanide (amenable/total) 0 0.02 0 0.007 * *
Silica 35.9 34 30 33.3 33.1 33
Silicon 16 16 15 15.7 * *
Phosphate 0.047 0 0.011 0.019 * *
Polyphosphate ND ND ND * * *
Fluoride 0.378 0.4 0.6 0.459 0.89 9.3
Nitrate 1.05 1.5 1 1.183 3.71 *
Suspended Solids ND ND ND * * *

Total Dissolved Solids 470 470 550 550 1012 1900
Hardness 170 160 160 * 379 210
SDI 0.2 0.6 1.17 * * *
Manganese 0.048 0.015 0.057 * 0.68 9.9
Barium 0.037 0.045 0.027 * * *
Strontium 0.84 0.75 0.76 0.78 * *
Selenium 0.00031 0.00048 0.00038 0.00039 * *
Copper 0.0037 * 0.0018 * * *
Arsenic 0.0034 0.003 0.0041 0.0035 0.22 *
Chromium 0.00011 0.0028 0.0007 * * *
Cobalt 0.00005 * * * * *
Lead 0.00056 0.0003 0.00041 * * *
Nitrate 1.05 1.48 1.5 * * *
Vanadium 0.0047 0.0058 0.0074 * * *
Nickel 0.00021 0.00013 0.00009 * * *
Molybdenum 0.016 * * * * *
Antimony 0.00028 0.0003 0.0013 * * *
Thallium 0.0003 * * * * *
Hexavalent Chromium * 0.0027 0.0003 * * *
Notes:
* Not sampled/anaylsed

Table 4-3 Chemical Additives in Treatment Processes
Process Aim Type of Additive Example of Additive
ONSITE GROUNDWATER - LOWER LIMIT TDS PROCESS
Circulating Water Limit growth of bacteria Oxidizing Biocide Sodium Hypochlorite
Limit formation of scale pH Control Sulfuric Acid, Hydrochloric Acid (included in Tables 5 and 7)
Antiscalants Organic Phosphates (used in small amounts)
Minimize corrosion Corrosion Inhibitors Zinc, Phosphate (used in small amounts)
Steam Cycle Control pH pH Control Amines (i.e. Cyclohexamine, Monoethanolamine, Methoxypropylamine) (used in small amounts)
Remove remaining dissolved oxygen Oxygen Scavenger Hydrazine, Carbohydrazide (used in small amounts)
Minimize corrosion from pH pH Control Phosphates (used in small amounts)
OFFSITE GROUNDWATER - UPPER LIMIT TDS PROCESS
Pre- and Post- Treatment Clarifier
Removal of hardnesss Calcium compound Lime (Calcium Hydroxide)
Control pH pH Control Soda Ash (Sodium Carbonate)
Control pH pH Control Caustic (Sodium Hydroxide)
Flocculant Polymer Long-chain polymer for settling of wastewater solids
Removal of silica Magnesium compound Magnesium Chloride
Coagulant Iron compound Ferric Chloride
Weak Acid Cation Exchange Softener
Removal of hardness elements Regenernt Sodium Hydroxide
Removal of hardness elements Regenerant Hydrochloric Acid
Beacon Solar Energy Project 34 June 2009
Detection Monitoring Plan Figure Revisions


1838
1816
1841
2417
2077
2012
1844
1881
2054
20792100
2066
2064
2058
1847
18461844
1894
1861
1840.3
1825.1
1810.8
1818.4
1818.9
1818.1
1819.6
1835.3
1818.2
1818.6
1818.3
CA
NV
AZ
OR
UT
ID
Project: 10056-014Date: June 2009
BSEP
Figure 1-7Site Map with Alquist-Priolo
Fault Zones
Map Location
J:\G
IS\P
roje
cts\
10
05
6-B
ea
con
\mxd
\RO
WD
-Oth
ers
\se
ism
ic.m
xd

CA
NV
AZ
OR
UT
ID
Project: 10056-014Date: June 2009
BSEP
Figure 1-8Evaporation Pond and
Land Treatment Unit Layout
Map Location
J:\G
IS\P
roje
cts\
10
05
6-B
ea
con
\mxd
\RO
WD
-Oth
ers
\Po
nd
-la
nd
farm
lay
ou
t.m
xd

CA
NV
AZ
OR
UT
ID
Project: 10056-014Date: June 2009
BSEP
Figure 1-9Topography Map
Map Location
J:\G
IS\P
roje
cts\
10
05
6-B
ea
con
\mxd
\RO
WD
-Oth
ers
\To
po
gra
ph
y m
ap
.mxd

CA
NV
AZ
OR
UT
ID
Project: 10056-014Date: June 2009
BSEP
Figure 1-10Evaporation Pond
Section and Details
Map Location
J:\G
IS\P
roje
cts\
10
05
6-B
ea
con
\mxd
\RO
WD
-Oth
ers
\Ev
ap
ora
tion
po
nd
cro
ss s
ect
ion
-de
tails
.mx
d

!
!
!!
!
!
##
#
"
"
"
"
"
!
!!
!
!
!
!
MW-3
MW-2
MW-1
WELL 63
WELL 51
WELL 49
WELL 47
WELL 46
WELL 42
WELL USGS
DOMESTIC WELL
WELL 50
WELL 48
WELL 45
WELL 43
WELL 41
WELL 45B
WELL 44B
101520
25
30
31S37E05M01
31S37E06J01
31S37E10A01
CA
NV
AZ
OR
UT
ID
Project: 10056-014Date: June 20090 1,000 2,000 3,000 4,000
Feet
µ BSEP
Figure 4-1AOnsite Groundwater Supply
Monitoring Network
Map Location
J:\G
IS\P
roje
cts\
10
05
6-B
ea
con
\mxd
\RO
WD
-Oth
ers
\mo
nito
rin
g s
yste
m.m
xd
1:24,000
SierraNevada
Los
Ang
eles
Aqu
educ
tProposedEvaporationPonds
Legend
100-Year Flood Zone
AP Fault Zones
BSEP Plant Site Boundary
Primary Supply Well
Backup Supply Well
Compliance Well(Active Supply Well)
# Detection Well
Predicted Drawdown Contour(5-Foot Interval)(AFC March 2008)
ProposedLand TreatmentUnit
" Background Well
Wells Not Includedin the GMN

!
!
!
!!
!
!
!
!#
#
#
!
!
!
!
!
!
"
"
"MW-3
MW-2
MW-1
WELL 63
WELL 51
WELL 49
WELL 47
WELL 46
WELL 42
WELL USGS
DOMESTIC WELL
WELL 50
WELL 48
WELL 45
WELL 43
WELL 41
WELL 45B
WELL 44B
31S37E05M01
31S37E06J01
31S37E10A01
CA
NV
AZ
OR
UT
ID
Project: 10056-014Date: June 20090 1,000 2,000 3,000 4,000
Feet
µ BSEP
Figure 4-1BOffsite Groundwater Supply
Monitoring Network
Map Location
J:\G
IS\P
roje
cts\
10
05
6-B
ea
con
\mxd
\RO
WD
-Oth
ers
\mo
nito
rin
g s
yste
m-o
ffsi
te.m
xd
1:24,000
SierraNevada
Los
Ang
eles
Aqu
educ
tProposedEvaporationPonds
Legend
100-Year Flood Zone
AP Fault Zones
BSEP Plant Site Boundary
Compliance Well
# Detection Well
ProposedLand TreatmentUnit
" Background Well
Wells Not Includedin the GMN

Beacon Solar Energy Project 35 June 2009
Appendix I - Corrective Action Plan
CORRECTIVE ACTION PROGRAM
AMENDMENT REFLECTING INCORPORATION OF PARTIAL ZERO-LIQUID DISCHARGE AND ALTERNATIVE SOURCES OF WATER SUPPLY
This document presents an amendment to the Corrective Action Program (CAP) prepared for the Beacon Solar Energy Project (BSEP) and submitted to the California Energy Commission (CEC) and California Regional Water Quality Control Board – Lahontan Region (RWQCB) as Appendix I of the Application/Report of Waste Discharge (ROWD), on March 18, 2009. The RWQCB provided comments to the March 18 application on April 17 and subsequently to the CEC Preliminary Staff Assessment (PSA) on May 14, 2009.
This amendment was prepared to address changes in the project water and waste management programs wherein a partial zero-liquid discharge (ZLD) system has been added to reduce water consumption for the project. The annual water supply requirement for the project is 1,600 acre-feet per year (AFY) supplied from groundwater below the site. The partial ZLD is anticipated to reduce consumption by about 12.5 % or 200 AFY. Correspondingly, the reduction in the water discharge from partial ZLD will substantially reduce the size of the evaporation ponds to about 10 acres, down from the 40 acres proposed in the March 18, 2009 ROWD.
Alternative sources of water supply are also being considered in response to CEC PSA recommendations. The water supply sources include onsite groundwater, tertiary-treated wastewater from the City of Rosamond and offsite groundwater in the area of Koehn Lake. Because of the variable water chemistry of the sources, the amendment to the ROWD provides an upper and lower bound design for the partial ZLD, reflecting the range of total dissolved solids (TDS) concentrations reported in recent and historical data. The upper bound source of water, the water with the highest TDS concentrations, is assumed to be present in the area of Koehn Lake. The lower bound design was based on the onsite groundwater chemistry as described in the March 18, 2009 ROWD and CAP. Due to the potential for an offsite source of water the CAP has been modified to reflect changes to the detection monitoring network should an offsite source of water be used to supply the project. The proposed source of water for the project is through several existing wells on the Project site.
In the initial application and CAP, the groundwater monitoring program was designed to reflect this source of water and the associated cone of depression that will develop in the central portion of the site and in the area of the evaporation ponds and the land treatment unit. Should an offsite source be selected, no such cone of depression will develop and groundwater flow and direction will remain unaltered from the current regional flow pattern. Subsequently, the CAPP has been altered to include a detection monitoring network for onsite non-pumping conditions.
To reflect the changes and incorporating the partial ZLD into the project, the following changes have been made to sections, tables and figures from the March 2009 DMP for an upper and lower bound water quality estimate and a revised detection monitoring network for an offsite water source.
1.3 Waste Handling Facilities
The waste storage and treatment units include three evaporation ponds and the storage area [Land Treatment Unit (LTU)] for HTF-contaminated soils as described below. The configuration of the planned evaporation ponds, land treatment unit, and adjacent areas are shown in Figure 1-8.

Beacon Solar Energy Project 36 June 2009
1.3.1 Evaporation Ponds
The configuration of the planned evaporation ponds and adjacent areas are shown in the aforementioned Figure 1-8. Topography of the BSEP and surrounding areas are shown on Figure 1-9.
The waste storage units include three evaporation ponds. The evaporation ponds will receive wastewater from: 1) circulating water blow down from the cooling tower; 2) wastewater flow from the ion exchange regeneration stream, generated from pre-treatment of water for use at the plant; and 3) stormwater accumulated in the LTU. Tables 1-2A and 1-2B provide an estimate of the concentrations of various chemicals/metals that will be present in the wastewater stored in the evaporation ponds. The design details of the evaporation ponds are shown on Figure 1-10.
The three 2.7-acre evaporation ponds (total combined pond top area of 8.1 acres) have an average proposed design depth of 8 feet, which incorporates the following:
3 feet of residue build up over 3.5 to 4.5 years of operation followed by cleaned out;
3 feet of operational depth; and
2 feet of freeboard.
The containment design for the evaporation ponds, from the surface of the evaporation ponds downwards, consists of the following:
A hard surface / protective layer with granular fill/free draining sub-base over geotextile;
A primary 60 mil high density polyethylene (HDPE) liner;
An interstitial leak detection and removal system (LDRS) comprising a geomembrane geonet and collection piping;
A secondary 40 mil HDPE liner;
A base layer consisting of either a geosynthetic clay liner or 2 feet of onsite material with a hydraulic conductivity of less than 1 x 10⁻⁶ centimeter per second of which 30 percent, by weight, shall pass through a No. 200 Standard sieve;
A leak detection system consisting of continuous carrier pipes installed at the sides and low point of each pond at a depth of approximately 5 feet below the secondary liner (WP, 2009). A neutron probe will be pulled through the pipes to assess the moisture content of the soil. The background moisture content and subsequent action level that will indicate a leak will be established after the evaporation ponds have been constructed, but prior to any liquids being placed in the ponds; and
A groundwater monitoring network (GMN), consisting of three monitoring wells located immediately adjacent to the evaporation ponds and the LTU, and four additional wells located near the facility boundaries (Figure 1-11) monitors the regional groundwater aquifer, which is the first water encountered under the Project site.
The design detail of the Evaporation Ponds are shown in Figure 1-10.
3.2 Groundwater Corrective Actions
As described in Section 1.3.1, a GMN has been proposed for the evaporation ponds and the LTU. The DMP (AECOM 2009) presents the sampling schedule, analytes and reporting requirements for the site under CCR Title 27, Section 20420.

Beacon Solar Energy Project 37 June 2009
For a CAP under CCR Title 27, Section 20430: 1) a sufficient number of monitoring points need to be installed at appropriate locations and depths to yield groundwater samples from the uppermost aquifer that represent the quality of groundwater passing the point of compliance and at other locations in the uppermost aquifer to provide the data needed to evaluate the effectiveness of the CAP; 2) a sufficient number of monitoring points and background monitoring points need to be installed at appropriate locations and depths to yield ground water samples from portions of the zone of saturation, including other aquifers, not monitored pursuant to CCR Title 27, Section 20420, to provide the data needed to evaluate the effectiveness of the CAP; and 3) a sufficient number of monitoring points and background monitoring points need to be installed at appropriate locations and depths to yield groundwater samples from zones of perched water to provide the data needed to evaluate the effectiveness of the corrective action program.
As discussed in Section 1.1, the March 2009 CAP was developed using site groundwater as the water supply source. At the request of the CEC, BSEP is exploring offsite sources of water supply including wastewater from the Rosamond Wastewater Treatment Plant and offsite groundwater from the Koehn Lake region. The following section presents corrective actions for a scenario where groundwater is pumped from onsite wells for water supply and for a scenario where water from an offsite source, thus no groundwater is pumped from onsite wells
3.2.2 Regional Groundwater
The proposed GMN layout includes three categories of monitoring wells: 1) background wells which are located upgradient of the evaporation ponds and LTU; 2) detection wells, which are located adjacent to the evaporation ponds and LTU; and 3) compliance wells, which are located near the property boundaries. For both onsite and offsite water supply scenarios, the detection wells are comprised of three proposed wells (MW-1 through MW-3) located immediately adjacent to the evaporation ponds and LTU.
The GMN layouts for the two water supply scenarios are:
Onsite Water Supply (Figure 1-11A):
Background Wells – 47, Domestic Well, 50 and USGS. As shown in Figure 4-1A, a cone of depression will develop under the evaporation ponds and LTU due to the location of primary pumping Wells 49 and 63 and backup wells 41 and 42. Under pumping conditions, groundwater is predicted to move toward the primary pumping well(s) from all points of the compass. Thus all wells become background wells
Detection Well – MW-1, MW-2 and MW-3.
Compliance Wells – The compliance well will be the well that is active, either 49, 63, 41 or 42.
Offsite Water Supply (Figure 1-11B):
Background Wells – 47, Domestic Well and 41
Detection Wells – MW-1, MW-2 and MW-3
Compliance Wells – 50, 51 and USGS
Therefore under the onsite pumping scenario, if a release is detected through physical evidence or statistical analyses performed on the data collected under the DMP and soil excavation does not achieve clean closure (i.e. no COCs detected in confirmation soil samples), groundwater monitoring will continue as setforth in the DMP and the extraction well(s) will be sampled on the same schedule set forth for the monitoring wells in the DMP. This sampling will allow for evaluation, compliance, and performance monitoring of the success of the corrective action. This sampling will be considered as the Evaluation Monitoring Program (EMP). No further action would be required as the direction of the groundwater flow would carry any COC detected in the groundwater to the extraction well(s).

Beacon Solar Energy Project 38 June 2009
Under the offsite water supply scenario, if a release is detected through physical evidence or statistical analyses performed on data collected under the DMP and soil excavation does not achieve clean closure (i.e. no COCs detected in confirmation soil samples) groundwater monitoring will continue as setforth in the DMP and will be considered as the Evaluation Monitoring Program (EMP). The need for additional groundwater monitoring wells and/or groundwater extraction wells would be assessed during the EMP and recommendations made to the RWQCB for this additional work.

Beacon Solar Energy Project 39 June 2009
Corrective Action Plan Table Revisions
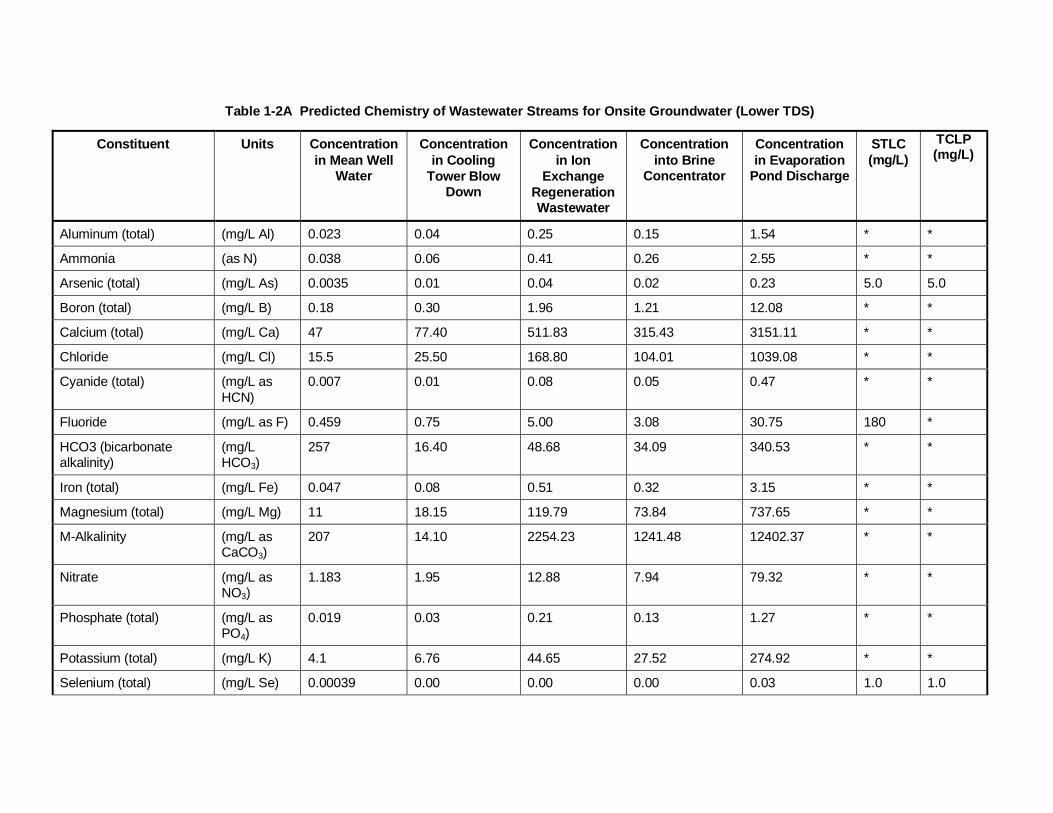
Table 1-2A Predicted Chemistry of Wastewater Streams for Onsite Groundwater (Lower TDS)
Constituent Units Concentration in Mean Well
Water
Concentration in Cooling
Tower Blow Down
Concentration in Ion
Exchange Regeneration Wastewater
Concentration into Brine
Concentrator
Concentration in Evaporation
Pond Discharge
STLC (mg/L)
TCLP (mg/L)
Aluminum (total) (mg/L Al) 0.023 0.04 0.25 0.15 1.54 * *
Ammonia (as N) 0.038 0.06 0.41 0.26 2.55 * *
Arsenic (total) (mg/L As) 0.0035 0.01 0.04 0.02 0.23 5.0 5.0
Boron (total) (mg/L B) 0.18 0.30 1.96 1.21 12.08 * *
Calcium (total) (mg/L Ca) 47 77.40 511.83 315.43 3151.11 * *
Chloride (mg/L Cl) 15.5 25.50 168.80 104.01 1039.08 * *
Cyanide (total) (mg/L as HCN)
0.007 0.01 0.08 0.05 0.47 * *
Fluoride (mg/L as F) 0.459 0.75 5.00 3.08 30.75 180 *
HCO3 (bicarbonate alkalinity)
(mg/L HCO3)
257 16.40 48.68 34.09 340.53 * *
Iron (total) (mg/L Fe) 0.047 0.08 0.51 0.32 3.15 * *
Magnesium (total) (mg/L Mg) 11 18.15 119.79 73.84 737.65 * *
M-Alkalinity (mg/L as CaCO3)
207 14.10 2254.23 1241.48 12402.37 * *
Nitrate (mg/L as NO3)
1.183 1.95 12.88 7.94 79.32 * *
Phosphate (total) (mg/L as PO4)
0.019 0.03 0.21 0.13 1.27 * *
Potassium (total) (mg/L K) 4.1 6.76 44.65 27.52 274.92 * *
Selenium (total) (mg/L Se) 0.00039 0.00 0.00 0.00 0.03 1.0 1.0
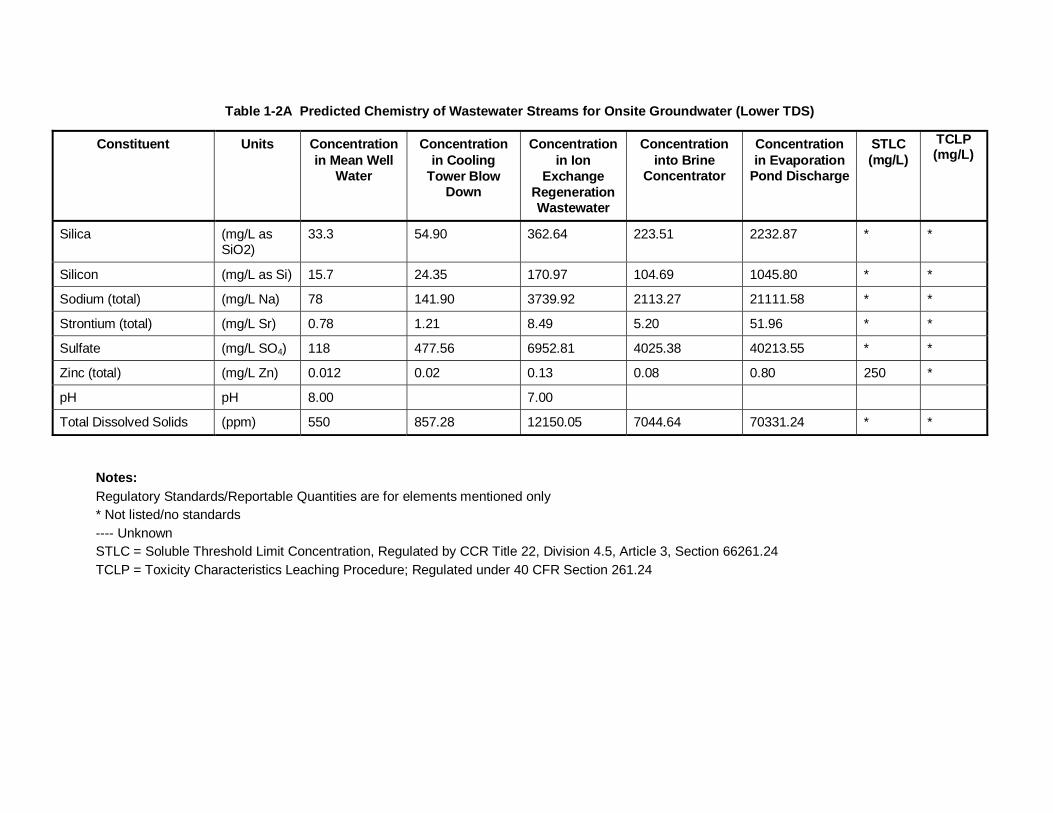
Table 1-2A Predicted Chemistry of Wastewater Streams for Onsite Groundwater (Lower TDS)
Constituent Units Concentration in Mean Well
Water
Concentration in Cooling
Tower Blow Down
Concentration in Ion
Exchange Regeneration Wastewater
Concentration into Brine
Concentrator
Concentration in Evaporation
Pond Discharge
STLC (mg/L)
TCLP (mg/L)
Silica (mg/L as SiO2)
33.3 54.90 362.64 223.51 2232.87 * *
Silicon (mg/L as Si) 15.7 24.35 170.97 104.69 1045.80 * *
Sodium (total) (mg/L Na) 78 141.90 3739.92 2113.27 21111.58 * *
Strontium (total) (mg/L Sr) 0.78 1.21 8.49 5.20 51.96 * *
Sulfate (mg/L SO4) 118 477.56 6952.81 4025.38 40213.55 * *
Zinc (total) (mg/L Zn) 0.012 0.02 0.13 0.08 0.80 250 *
pH pH 8.00 7.00
Total Dissolved Solids (ppm) 550 857.28 12150.05 7044.64 70331.24 * *
Notes:
Regulatory Standards/Reportable Quantities are for elements mentioned only * Not listed/no standards ---- Unknown STLC = Soluble Threshold Limit Concentration, Regulated by CCR Title 22, Division 4.5, Article 3, Section 66261.24 TCLP = Toxicity Characteristics Leaching Procedure; Regulated under 40 CFR Section 261.24

Table 1-2B Predicted Chemistry of Wastewater Streams for Offsite Groundwater (Upper TDS)
Constituent Units Concentration in Mean Well Water (mg/L)
Concentration in Evaporation Pond Discharge (mg/L)
STLC (mg/L)
TCLP (mg/L)
Calcium (total) (mg/L Ca) 69 934 * *
Chloride (mg/L Cl) 250 20,098 * *
Fluoride (mg/L as F) 9.3 620 180 *
HCO3 (bicarbonate alkalinity)
(mg/L HCO3) 319 271 * *
Iron (total) (mg/L Fe) < 0.010 - * *
Magnesium (total) (mg/L Mg) 9.9 324 * *
M-Alkalinity (mg/L as CaCO3) 210 223 * *
Nitrate (mg/L as NO3) 0 2 * *
Nitrate and Nitrite (mg/L as N) 0.03 - * *
Potassium (total) (mg/L K) 6.3 420 * *
Silica (mg/L as SiO2) 33 667 * *
Sodium (total) (mg/L Na) 510 36,446 * *
Sulfate (mg/L SO4) 690 51,171 * *
pH pH 7.8 - * *
Total Dissolved Solids (ppm) 1900 110,951 * *
Notes: Regulatory Standards/Reportable Quantities are for elements mentioned only * Not listed/no standards ---- Unknown STLC = Soluble Threshold Limit Concentration, Regulated by CCR Title 22, Division 4.5, Article 3, Section 66261.24 TCLP = Toxicity Characteristics Leaching Procedure; Regulated under 40 CFR Section 261.24 The list of constituents only includes parameters that there were mean well water data for. A completed waste stream stream evaluation should be undertaken when additional raw water constituents are known

Beacon Solar Energy Project 40 June 2009
Corrective Action Plan Figure Revisions


1838
1816
1841
2417
2077
2012
1844
1881
2054
20792100
2066
2064
2058
1847
18461844
1894
1861
1840.3
1825.1
1810.8
1818.4
1818.9
1818.1
1819.6
1835.3
1818.2
1818.6
1818.3
CA
NV
AZ
OR
UT
ID
Project: 10056-014Date: June 2009
BSEP
Figure 1-7Site Map with Alquist-Priolo
Fault Zones
Map Location
J:\G
IS\P
roje
cts\
10
05
6-B
ea
con
\mxd
\RO
WD
-Oth
ers
\se
ism
ic.m
xd

CA
NV
AZ
OR
UT
ID
Project: 10056-014Date: June 2009
BSEP
Figure 1-8Evaporation Pond and
Land Treatment Unit Layout
Map Location
J:\G
IS\P
roje
cts\
10
05
6-B
ea
con
\mxd
\RO
WD
-Oth
ers
\Po
nd
-la
nd
farm
lay
ou
t.m
xd

CA
NV
AZ
OR
UT
ID
Project: 10056-014Date: June 2009
BSEP
Figure 1-9Topography Map
Map Location
J:\G
IS\P
roje
cts\
10
05
6-B
ea
con
\mxd
\RO
WD
-Oth
ers
\To
po
gra
ph
y m
ap
.mxd

CA
NV
AZ
OR
UT
ID
Project: 10056-014Date: June 2009
BSEP
Figure 1-10Evaporation Pond
Section and Details
Map Location
J:\G
IS\P
roje
cts\
10
05
6-B
ea
con
\mxd
\RO
WD
-Oth
ers
\Ev
ap
ora
tion
po
nd
cro
ss s
ect
ion
-de
tails
.mx
d

!
!
!!
!
!
!
##
#
"
"
"
"
!
!!
!
!
!
!
MW-3
MW-2
MW-1
WELL 63
WELL 51
WELL 49
WELL 47
WELL 46
WELL 42
WELL USGS
DOMESTIC WELL
WELL 50
WELL 48
WELL 45
WELL 43
WELL 41
WELL 45B
WELL 44B
101520
25
30
31S37E05M01
31S37E06J01
31S37E10A01
CA
NV
AZ
OR
UT
ID
Project: 10056-014Date: June 20090 1,000 2,000 3,000 4,000
Feet
µ BSEP
Figure 1-11AOnsite Groundwater Supply
Monitoring Network
Map Location
J:\G
IS\P
roje
cts\
10
05
6-B
ea
con
\mxd
\RO
WD
-Oth
ers
\mo
nito
rin
g s
yste
m.m
xd
1:24,000
SierraNevada
Los
Ang
eles
Aqu
educ
tProposedEvaporationPonds
Legend
100-Year Flood Zone
AP Fault Zones
BSEP Plant Site Boundary
Primary Supply Well
Backup Supply Well
Compliance Well(Active Supply Well)
# Detection Well
Predicted Drawdown Contour(5-Foot Interval)(AFC March 2008)
ProposedLand TreatmentUnit
" Background Well
Wells Not Includedin the GMN

!
!
!
!!
!
!
!
!#
#
#
!
!
!
!
!
!
"
"
"MW-3
MW-2
MW-1
WELL 63
WELL 51
WELL 49
WELL 47
WELL 46
WELL 42
WELL USGS
DOMESTIC WELL
WELL 50
WELL 48
WELL 45
WELL 43
WELL 41
WELL 45B
WELL 44B
31S37E05M01
31S37E06J01
31S37E10A01
CA
NV
AZ
OR
UT
ID
Project: 10056-014Date: June 20090 1,000 2,000 3,000 4,000
Feet
µ BSEP
Figure 1-11BOffsite Groundwater Supply
Monitoring Network
Map Location
J:\G
IS\P
roje
cts\
10
05
6-B
ea
con
\mxd
\RO
WD
-Oth
ers
\mo
nito
rin
g s
yste
m-o
ffsi
te.m
xd
1:24,000
SierraNevada
Los
Ang
eles
Aqu
educ
tProposedEvaporationPonds
Legend
100-Year Flood Zone
AP Fault Zones
BSEP Plant Site Boundary
Compliance Well
# Detection Well
ProposedLand TreatmentUnit
" Background Well
Wells Not Includedin the GMN

Beacon Solar Energy Project 41 June 2009
Appendix J - Action Leakage Rate
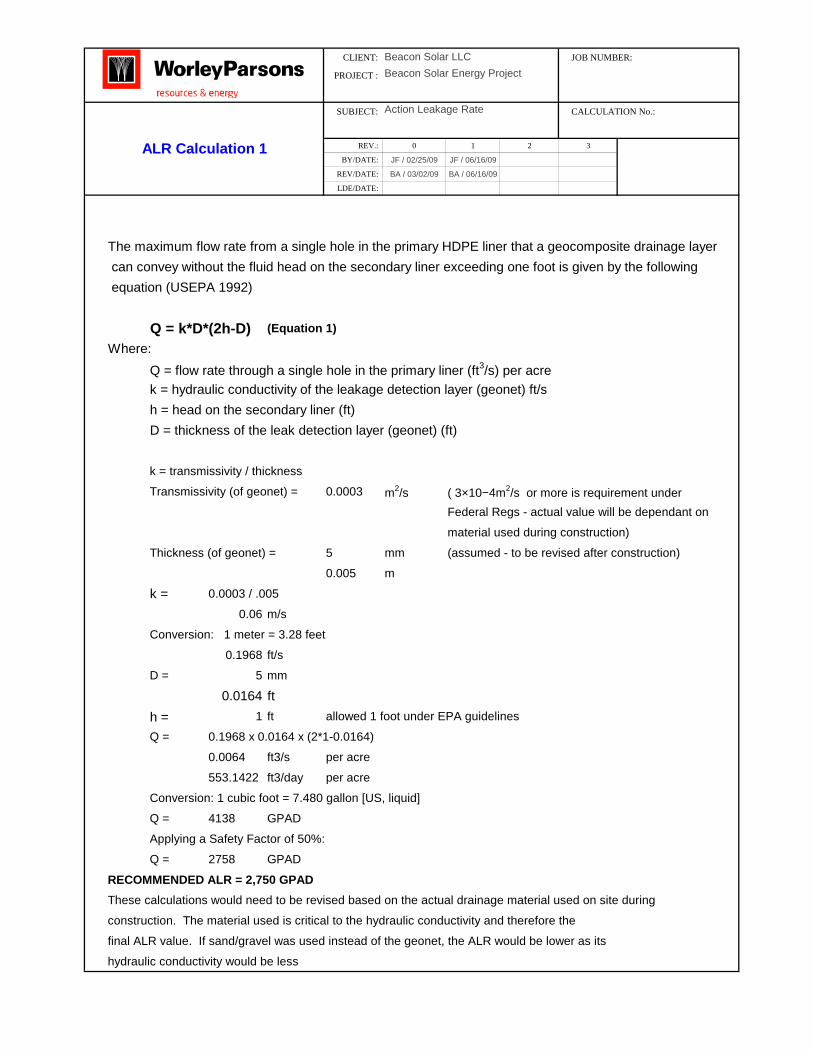
CLIENT: JOB NUMBER:
PROJECT :
SUBJECT: CALCULATION No.:
REV.: 0 1 2 3
BY/DATE: JF / 02/25/09 JF / 06/16/09
REV/DATE: BA / 03/02/09 BA / 06/16/09
LDE/DATE:
The maximum flow rate from a single hole in the primary HDPE liner that a geocomposite drainage layer
can convey without the fluid head on the secondary liner exceeding one foot is given by the following
equation (USEPA 1992)
Q = k*D*(2h-D) (Equation 1)
Where:
Q = flow rate through a single hole in the primary liner (ft3/s) per acre
k = hydraulic conductivity of the leakage detection layer (geonet) ft/s
h = head on the secondary liner (ft)
D = thickness of the leak detection layer (geonet) (ft)
k = transmissivity / thickness
Transmissivity (of geonet) = 0.0003 m2/s ( 3×10⁻⁴m2/s or more is requirement under
Federal Regs - actual value will be dependant on
material used during construction)
Thickness (of geonet) = 5 mm (assumed - to be revised after construction)
0.005 m
k = 0.0003 / .005
0.06 m/s
Conversion: 1 meter = 3.28 feet
0.1968 ft/s
D = 5 mm
0.0164 ft
h = 1 ft allowed 1 foot under EPA guidelines
Q = 0.1968 x 0.0164 x (2*1-0.0164)
0.0064 ft3/s per acre
553.1422 ft3/day per acre
Conversion: 1 cubic foot = 7.480 gallon [US, liquid]
Q = 4138 GPAD
Applying a Safety Factor of 50%:
Q = 2758 GPAD
RECOMMENDED ALR = 2,750 GPAD
These calculations would need to be revised based on the actual drainage material used on site during
construction. The material used is critical to the hydraulic conductivity and therefore the
final ALR value. If sand/gravel was used instead of the geonet, the ALR would be lower as its
hydraulic conductivity would be less
ALR Calculation 1
Beacon Solar LLC
Action Leakage Rate
Beacon Solar Energy Project
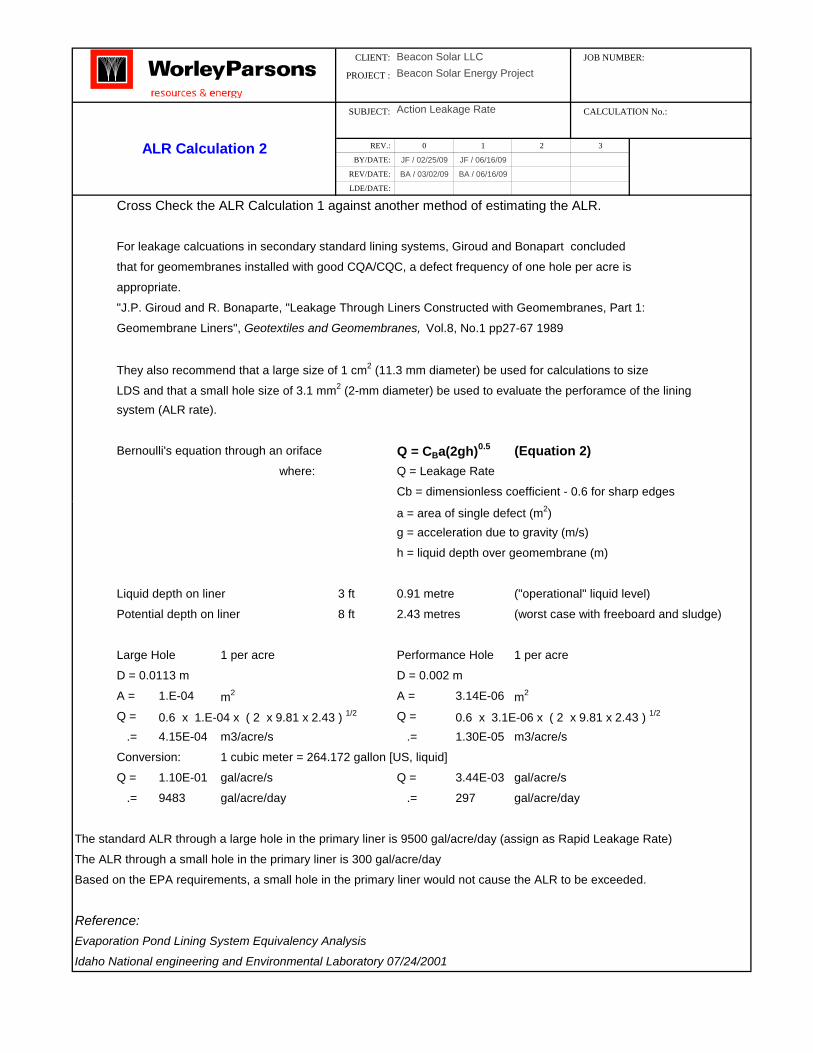
CLIENT: JOB NUMBER:
PROJECT :
SUBJECT: CALCULATION No.:
REV.: 0 1 2 3
BY/DATE: JF / 02/25/09 JF / 06/16/09
REV/DATE: BA / 03/02/09 BA / 06/16/09
LDE/DATE:
Cross Check the ALR Calculation 1 against another method of estimating the ALR.
For leakage calcuations in secondary standard lining systems, Giroud and Bonapart concluded
that for geomembranes installed with good CQA/CQC, a defect frequency of one hole per acre is
appropriate.
"J.P. Giroud and R. Bonaparte, "Leakage Through Liners Constructed with Geomembranes, Part 1:
Geomembrane Liners", Geotextiles and Geomembranes, Vol.8, No.1 pp27-67 1989
They also recommend that a large size of 1 cm2 (11.3 mm diameter) be used for calculations to size
LDS and that a small hole size of 3.1 mm2 (2-mm diameter) be used to evaluate the perforamce of the lining
system (ALR rate).
Bernoulli's equation through an oriface Q = CBa(2gh)0.5 (Equation 2)
where: Q = Leakage Rate
Cb = dimensionless coefficient - 0.6 for sharp edges
a = area of single defect (m2)
g = acceleration due to gravity (m/s)
h = liquid depth over geomembrane (m)
Liquid depth on liner 3 ft 0.91 metre ("operational" liquid level)
Potential depth on liner 8 ft 2.43 metres (worst case with freeboard and sludge)
Large Hole 1 per acre Performance Hole 1 per acre
D = 0.0113 m D = 0.002 m
A = 1.E-04 m2 A = 3.14E-06 m2
Q = 0.6 x 1.E-04 x ( 2 x 9.81 x 2.43 ) 1/2 Q = 0.6 x 3.1E-06 x ( 2 x 9.81 x 2.43 ) 1/2
.= 4.15E-04 m3/acre/s .= 1.30E-05 m3/acre/s
Conversion: 1 cubic meter = 264.172 gallon [US, liquid]
Q = 1.10E-01 gal/acre/s Q = 3.44E-03 gal/acre/s
.= 9483 gal/acre/day .= 297 gal/acre/day
The standard ALR through a large hole in the primary liner is 9500 gal/acre/day (assign as Rapid Leakage Rate)
The ALR through a small hole in the primary liner is 300 gal/acre/day
Based on the EPA requirements, a small hole in the primary liner would not cause the ALR to be exceeded.
Reference:
Evaporation Pond Lining System Equivalency Analysis
Idaho National engineering and Environmental Laboratory 07/24/2001
ALR Calculation 2
Beacon Solar LLC
Action Leakage Rate
Beacon Solar Energy Project

Beacon Solar Energy Project 42 June 2009
Appendix K - Preliminary Closure Plan for the Evaporation Ponds
2.1 Evaporation Ponds
The waste storage units include three evaporation ponds. The configuration of the planned evaporation ponds and adjacent areas are shown in Figure 2-1. Topography of the Project and surrounding areas are shown on Figure 2-2. The final contours of the ponds and the changes in surface drainage patterns, as compared to the preexisting natural drainage patterns are shown on Figure 2-3.
The three 2.7-acre (total combined pond top area of 8 acres) evaporation ponds have an average proposed design depth of seven feet, which incorporates the following:
Three feet of sludge,
Three feet of operational depth, and
Two feet of freeboard.
The containment design for the evaporation ponds, from the surface of the evaporation ponds downwards, consists of the following:
A hard surface/protective layer with granular fill/free draining sub-base over geotextile;
A primary 60 milliliter (mil) high density polyethylene (HDPE) liner;
An interstitial leak detection and removal system comprising a geomembrane geonet and collection piping;
A secondary 40 mil HDPE liner; and
A base layer consisting of either a geosynthetic clay liner (GCL) or 2 feet of onsite material with a hydraulic conductivity of less than 1 x 10⁻⁶ centimeters per second of which 30 percent, by weight, shall pass through a Number 200 standard sieve.
The design details of the evaporation ponds are shown in Figure 2-4.
3.2.2 Wastewater Disposal/Use
Wastewater will be consolidated into one evaporation pond or until that one pond is full (i.e., minimum two feet of freeboard as required). Wastewater remaining in the other evaporation ponds will be allowed to evaporate to atmosphere. As long as liquids remain in the evaporation ponds, the monitoring and reporting requirements included in the licensing requirements will be followed.
Wastewater that is not evaporated will not be used for dust control, and will be characterized and profiled prior to disposal. The characterized wastewater will be loaded in appropriate containers, handled, and transported by a licensed waste hauler to an approved disposal facility following all federal, state, and local requirements.
4.3 Cost Analysis
A detailed cost estimate to close the evaporation ponds is provided in Appendix A. Unit costs are based on RS Means Building Construction Cost Data 2001 Western Version and adjusted by ENR Historical Cost Index to obtain present value unit costs. The total cost estimate is $12,153,000. A letter of credit will be used to demonstrate financial assurance for the closure costs.

Beacon Solar Energy Project 44 June 2009
Preliminary Closure Plan for the Evaporation Ponds Figure Revisions


CA
NV
AZ
OR
UT
ID
Project: 10056-014Date: June 2009
BSEP
Figure 2-2Topography Map
Map Location
J:\G
IS\P
roje
cts\
10
05
6-B
ea
con
\mxd
\RO
WD
-Oth
ers
\To
po
gra
ph
y m
ap
.mxd
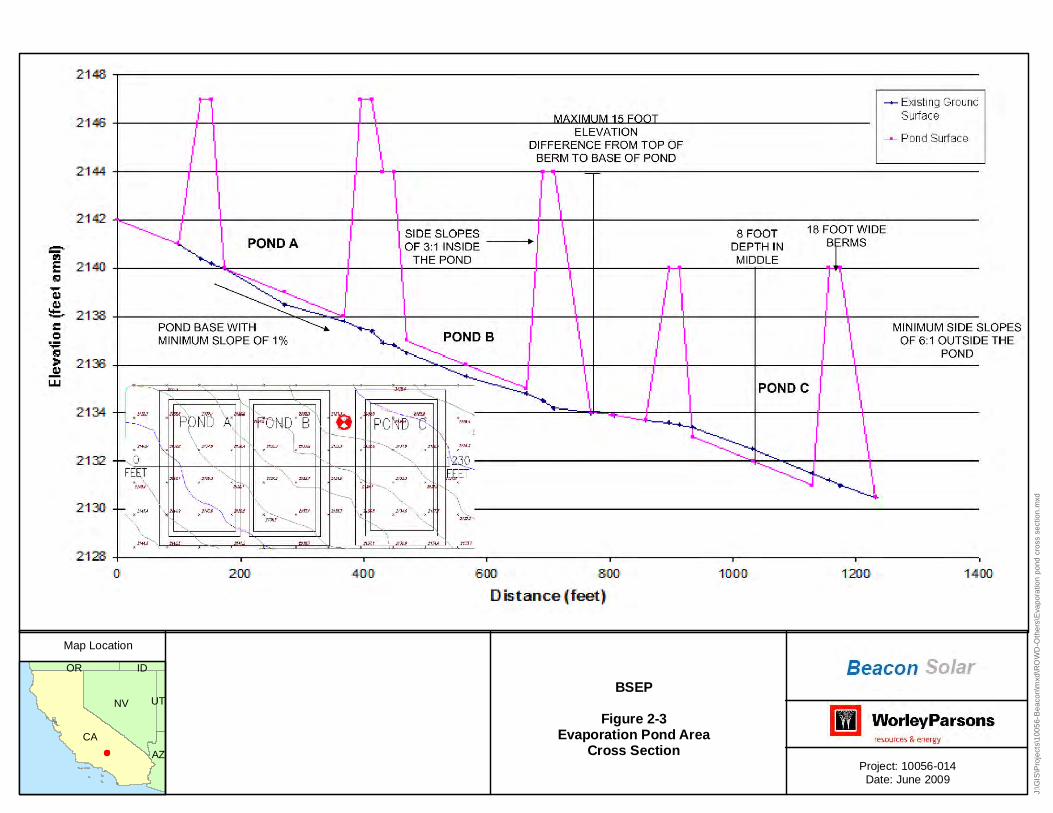
CA
NV
AZ
OR
UT
ID
Project: 10056-014Date: June 2009
BSEP
Figure 2-3Evaporation Pond Area
Cross Section
Map Location
J:\G
IS\P
roje
cts\
10
05
6-B
ea
con
\mxd
\RO
WD
-Oth
ers
\Eva
po
ratio
n p
on
d c
ross
se
ctio
n.m
xd

CA
NV
AZ
OR
UT
ID
Project: 10056-014Date: June 2009
BSEP
Figure 2-4Evaporation Pond
Section and Details
Map Location
J:\G
IS\P
roje
cts\
10
05
6-B
ea
con
\mxd
\RO
WD
-Oth
ers
\Ev
ap
ora
tion
po
nd
cro
ss s
ect
ion
-de
tails
.mx
d

Beacon Solar Energy Project 44 June 2009
Preliminary Closure Plan for the Evaporation Ponds Appendix A Revisions

Order-of-Magnitude Cost Estimate-Closure of Evap Ponds
Sequence of Closure of Evaporation Pond with Trench 1. Remove and Dispose Sludge (solid)2. Remove, Crush , and Recycle Hard Surface (Roller compacted concrete without rebar)3. Remove, Wash, and Reuse on site Granular Fill4. Remove and Dispose of Non-Woven layer , 60 mil Geomembrane, and Geonet 5. Remove Screened Sand /piping trench ; reuse sand on site & dispose of piping 6. Remove and Dispose of 40 mil Geomembrane6A No GCL layer (alternate ) 7. Sample Clay/Silt layer to demonstrate that it is acceptable to leave in place8. Return Granular Fill to interior of pond9. Excavate Berms and return to interior of pond
Unit Unit Unit Number CostCost Quantity Reference
Costs1. Remove and Dispose Sludge (solid)Mobilization LS $25,000 1 1 $25,000 ROM EstimateExcavate (0.75 cyd Front End Loader) CYD $5 9,098 1 $43,696 Means 02315-40-1500&-4100Loading to trucks CYD $0.72 9,098 1 $6,554 Means 02315-400-0020Hauling to Landfill (18 tons/truck&220 mileRT) mile $3.27 220 278 $199,962 Means 02110-300-1260
Disposal ton $45.83 5,000 1 $229,1294-11-08 WM verbal; tipping fee for Class II @ McKittrick Landfill
Sampling and RWQCB Report each $25,000 1 1 $25,000 ROM EstimateTotal $529,341
2. Remove and Dispose/Recycle Hard SurfaceMobilization LS $10,000 1 1 $10,000 ENSR EstimateDemolition of 12" Concrete CYD $113 11,293 1.0 $1,277,287 Means 02220-875-2100Loading to trucks CYD $0.72 11,293 1 $8,136 Means 02315-400-0020Crush concrete on site ton $4 22,869 1.0 $91,375 See CIWMB assumption belowSampling of Crushed concrete demonstrating no imp LS $25,000 1 1 $25,000 ROM EstimateLoading to trucks CYD $0.72 11,293 1 $8,136 Means 02315-400-0020Truck Haul to on site stockpiles and dump CYD $5.73 11,293 1 $64,748 Means 02320-200-0330Spread dumped crushed concrete,no compaction CYD $1.88 11,293 1 $21,208 Means 02320-200-0400
Total $1,505,890
3. Remove, Wash, & Reuse Granular FillMobilization LS $25,000 1 1 $25,000 ROM EstimateExcavate (0.75 cyd Front End Loader) CYD $3 11,293 1 $33,900 Means 02315-40-1500
s:2000/4523/DRAFT Cost Evaluation -Beacon Closure (gcl).xls/Evap Ponds Page 1 of 66/19/2009 2:29 PM

Order-of-Magnitude Cost Estimate-Closure of Evap Ponds
Sequence of Closure of Evaporation Pond with Trench 1. Remove and Dispose Sludge (solid)2. Remove, Crush , and Recycle Hard Surface (Roller compacted concrete without rebar)3. Remove, Wash, and Reuse on site Granular Fill4. Remove and Dispose of Non-Woven layer , 60 mil Geomembrane, and Geonet 5. Remove Screened Sand /piping trench ; reuse sand on site & dispose of piping 6. Remove and Dispose of 40 mil Geomembrane6A No GCL layer (alternate ) 7. Sample Clay/Silt layer to demonstrate that it is acceptable to leave in place8. Return Granular Fill to interior of pond9. Excavate Berms and return to interior of pond
Unit Unit Unit Number CostCost Quantity Reference
Loading to trucks CYD $0.45 11,293 1 $5,085 Means 02315-400-0020Truck Haul to on site stockpile and dump CYD $4.17 11,293 1 $47,075 Means 02320-200-0400Wash to remove salts CYD $5.00 11,293 1 $56,467 ROM EstimateDisposal of Wash Water gal $0.50 225,867 1 $112,933 ROM EstimateLoading to stockpile CYD $0.45 11,293 1 $5,085 Means 02315-400-0020
Total $285,545
4. Remove and Dispose of Non-Woven layer , 60 mil Geomembrane, and Geonet Mobilization LS $5,000 1 1 $5,000 ROM EstimatePick up and cutting of Non-Woven, HDPE SF $0.40 304,920 1 $121,463 Means 02225-380-0400 (roughly ~)Loading to trucks SF $0.06 304,920 1 $18,219 Means 02315-400-0020 (roughly ~)Hauling to Facility (18 tons/truck & 220 mileRT) mile $3.27 220 4 $3,049 Means 02110-300-1260Disposal ton $92.47 76 1 $7,049 Means 02225-740-0100
Total $154,780
5. Remove Screened Sand /piping trench ; SumpExcavate (0.75 cyd Front End Loader) CYD $3 4 1 $12 Means 02315-40-1500Loading to trucks CYD $0.45 4 1 $2 Means 02315-400-0020Truck Haul to on site stockpile and dump CYD $6.69 4 1 $27 Means 02320-200-0400
Total $41
6. Remove and Dispose of 40 mil Geomembrane
Mobilization LS $5,000 1 1 $5,000 ROM Estimate
s:2000/4523/DRAFT Cost Evaluation -Beacon Closure (gcl).xls/Evap Ponds Page 2 of 66/19/2009 2:29 PM

Order-of-Magnitude Cost Estimate-Closure of Evap Ponds
Sequence of Closure of Evaporation Pond with Trench 1. Remove and Dispose Sludge (solid)2. Remove, Crush , and Recycle Hard Surface (Roller compacted concrete without rebar)3. Remove, Wash, and Reuse on site Granular Fill4. Remove and Dispose of Non-Woven layer , 60 mil Geomembrane, and Geonet 5. Remove Screened Sand /piping trench ; reuse sand on site & dispose of piping 6. Remove and Dispose of 40 mil Geomembrane6A No GCL layer (alternate ) 7. Sample Clay/Silt layer to demonstrate that it is acceptable to leave in place8. Return Granular Fill to interior of pond9. Excavate Berms and return to interior of pond
Unit Unit Unit Number CostCost Quantity Reference
Pick up and cutting of HDPE SF $0.20 304,920 1 $60,731 Means 02225-380-0400 (roughly ~1/2Loading to trucks SF $0.03 304,920 1 $9,110 Means 02315-400-0020 (roughly ~)Hauling to Facility (18 tons/truck & 220 mileRT) mile $3.27 220 2 $1,524 Means 02110-300-1260Disposal of 40 mil HDPE ton $92.47 38 1 $3,525 Means 02225-740-0100
Total $79,890
6A Remove GCL layer (alternate ) and dispose as daily cover at landfill Excavate (0.75 cyd Front End Loader) CYD $3 3,761 1 $11,289 Means 02315-40-1500Loading to trucks SF $0.06 304,920 1 $18,219 Means 02315-400-0020 (roughly ~)Hauling to Facility (18 tons/truck & 220 mileRT) mile $3.27 220 272 $195,518 Means 02110-300-1260Disposal of GCL ton $42.68 4,889 1 $208,656 AECOM experience
Total $433,682
7. Sample Clay/Silt layer to demonstrate that it is acceptable to leave in placeSample Collection Day $1,800 2 1 $2,744 ROM EstimateSample Analysis Each $250 30 1 $7,623 TPH by 8015 & Title 22Report of Analytical Each $7,500 1 1 $7,500 ROM Estimate
Total $17,867
8. Return Granular Fill to interior of pondMobilization LS $5,000 1 1 $5,000 ROM EstimateExcavate (0.75 cyd Front End Loader) CYD $3 11,293 1 $33,900 Means 02315-400-1500Loading to trucks CYD $0.45 11,293 1 $5,085 Means 02315-400-0020Truck Haul to on site stockpile and dump CYD $5.73 11,293 1 $64,748 Means 02320-200-0330
s:2000/4523/DRAFT Cost Evaluation -Beacon Closure (gcl).xls/Evap Ponds Page 3 of 66/19/2009 2:29 PM

Order-of-Magnitude Cost Estimate-Closure of Evap Ponds
Sequence of Closure of Evaporation Pond with Trench 1. Remove and Dispose Sludge (solid)2. Remove, Crush , and Recycle Hard Surface (Roller compacted concrete without rebar)3. Remove, Wash, and Reuse on site Granular Fill4. Remove and Dispose of Non-Woven layer , 60 mil Geomembrane, and Geonet 5. Remove Screened Sand /piping trench ; reuse sand on site & dispose of piping 6. Remove and Dispose of 40 mil Geomembrane6A No GCL layer (alternate ) 7. Sample Clay/Silt layer to demonstrate that it is acceptable to leave in place8. Return Granular Fill to interior of pond9. Excavate Berms and return to interior of pond
Unit Unit Unit Number CostCost Quantity Reference
Spread dumped fill,no compaction CYD $1.88 11,293 1 $21,208 Means 02320-200-0400Total $129,941
9. Excavate Berms and return to interior of pondMobilization LS $10,000 1 1 $10,000 ROM EstimateExcavate (Dozer, 300' haul, common earth) CYD $7 86,267 1 $597,684 Means 02315-410-4420
Total $607,684
Subtotal Field Activities Costs $3,744,662
Contingency (0% of All of the Above Costs) $0Total $3,744,662
Total Field Activities Costs $3,750,000
Engineering and Oversite
Engineering (2% of Total Construction Cost) $75,000 Means 01107-300-1200 (min.)Permitting (0.5% of Total Construction Cost) $19,000 Means 01310-150-0010 (min.)Construction Management (5% of Total Construction Cost) $188,000 Means 01107-200-0010 (min.)Closure Report (0.5% of Total Construction Cost) $19,000 Means 01310-150-0010
Total Engineering and Oversite Cost $301,000
T O T A L C O S T $4,051,000
s:2000/4523/DRAFT Cost Evaluation -Beacon Closure (gcl).xls/Evap Ponds Page 4 of 66/19/2009 2:29 PM
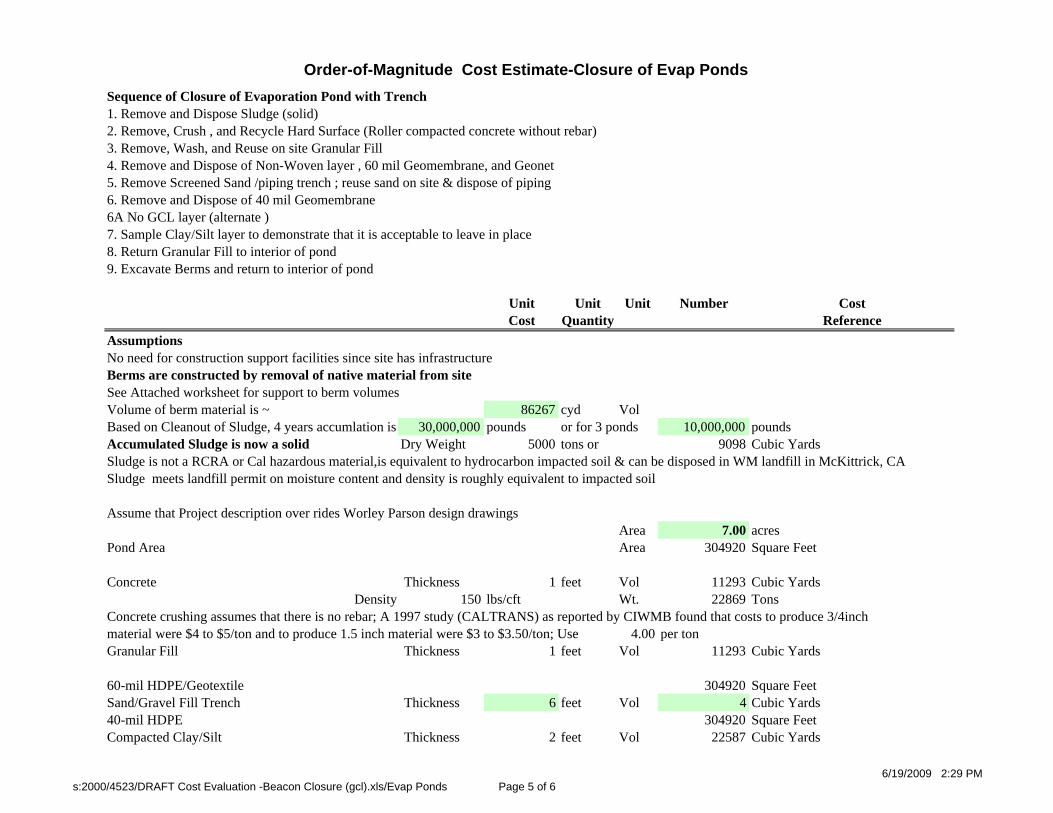
Order-of-Magnitude Cost Estimate-Closure of Evap Ponds
Sequence of Closure of Evaporation Pond with Trench 1. Remove and Dispose Sludge (solid)2. Remove, Crush , and Recycle Hard Surface (Roller compacted concrete without rebar)3. Remove, Wash, and Reuse on site Granular Fill4. Remove and Dispose of Non-Woven layer , 60 mil Geomembrane, and Geonet 5. Remove Screened Sand /piping trench ; reuse sand on site & dispose of piping 6. Remove and Dispose of 40 mil Geomembrane6A No GCL layer (alternate ) 7. Sample Clay/Silt layer to demonstrate that it is acceptable to leave in place8. Return Granular Fill to interior of pond9. Excavate Berms and return to interior of pond
Unit Unit Unit Number CostCost Quantity Reference
AssumptionsNo need for construction support facilities since site has infrastructureBerms are constructed by removal of native material from siteSee Attached worksheet for support to berm volumesVolume of berm material is ~ 86267 cyd VolBased on Cleanout of Sludge, 4 years accumlation is 30,000,000 pounds or for 3 ponds 10,000,000 poundsAccumulated Sludge is now a solid Dry Weight 5000 tons or 9098 Cubic YardsSludge is not a RCRA or Cal hazardous material,is equivalent to hydrocarbon impacted soil & can be disposed in WM landfill in McKittrick, CASludge meets landfill permit on moisture content and density is roughly equivalent to impacted soil
Assume that Project description over rides Worley Parson design drawings Area 7.00 acres
Pond Area Area 304920 Square Feet
Concrete Thickness 1 feet Vol 11293 Cubic YardsDensity 150 lbs/cft Wt. 22869 Tons
Concrete crushing assumes that there is no rebar; A 1997 study (CALTRANS) as reported by CIWMB found that costs to produce 3/4inch material were $4 to $5/ton and to produce 1.5 inch material were $3 to $3.50/ton; Use 4.00 per tonGranular Fill Thickness 1 feet Vol 11293 Cubic Yards
60-mil HDPE/Geotextile 304920 Square FeetSand/Gravel Fill Trench Thickness 6 feet Vol 4 Cubic Yards40-mil HDPE 304920 Square FeetCompacted Clay/Silt Thickness 2 feet Vol 22587 Cubic Yards
s:2000/4523/DRAFT Cost Evaluation -Beacon Closure (gcl).xls/Evap Ponds Page 5 of 66/19/2009 2:29 PM

Order-of-Magnitude Cost Estimate-Closure of Evap Ponds
Sequence of Closure of Evaporation Pond with Trench 1. Remove and Dispose Sludge (solid)2. Remove, Crush , and Recycle Hard Surface (Roller compacted concrete without rebar)3. Remove, Wash, and Reuse on site Granular Fill4. Remove and Dispose of Non-Woven layer , 60 mil Geomembrane, and Geonet 5. Remove Screened Sand /piping trench ; reuse sand on site & dispose of piping 6. Remove and Dispose of 40 mil Geomembrane6A No GCL layer (alternate ) 7. Sample Clay/Silt layer to demonstrate that it is acceptable to leave in place8. Return Granular Fill to interior of pond9. Excavate Berms and return to interior of pond
Unit Unit Unit Number CostCost Quantity Reference
Assume that Compact Clay/Silt can remain as it is not impacted
Notes Unit Costs are from RS Means Building Construction Cost Data 2001 Western VersionUnit Costs are adjusted by the City Cost Index; 1.13 Means page 612 for Installation index for Riverside, CAUnit Costs are adjusted by the ENR Historical Cost Index to estimate 2008 costs Compare Construction Cost Index since closure is mostly labor and not materials purchaseENR Construction Cost Index for Los Angeles in December 1997 6664ENR Construction Cost Index for Los Angeles in December 2000 7068ENR Construction Cost Index for Los Angeles in December 2007 (est) 8875Historical Cost adjustment is 2007 #/ 1997 # 1.33Historical Cost adjustment is 2007 #/ 2000 # 1.26Combine historical (2007 to 2000) & City cost adjustment 1.42
s:2000/4523/DRAFT Cost Evaluation -Beacon Closure (gcl).xls/Evap Ponds Page 6 of 66/19/2009 2:29 PM
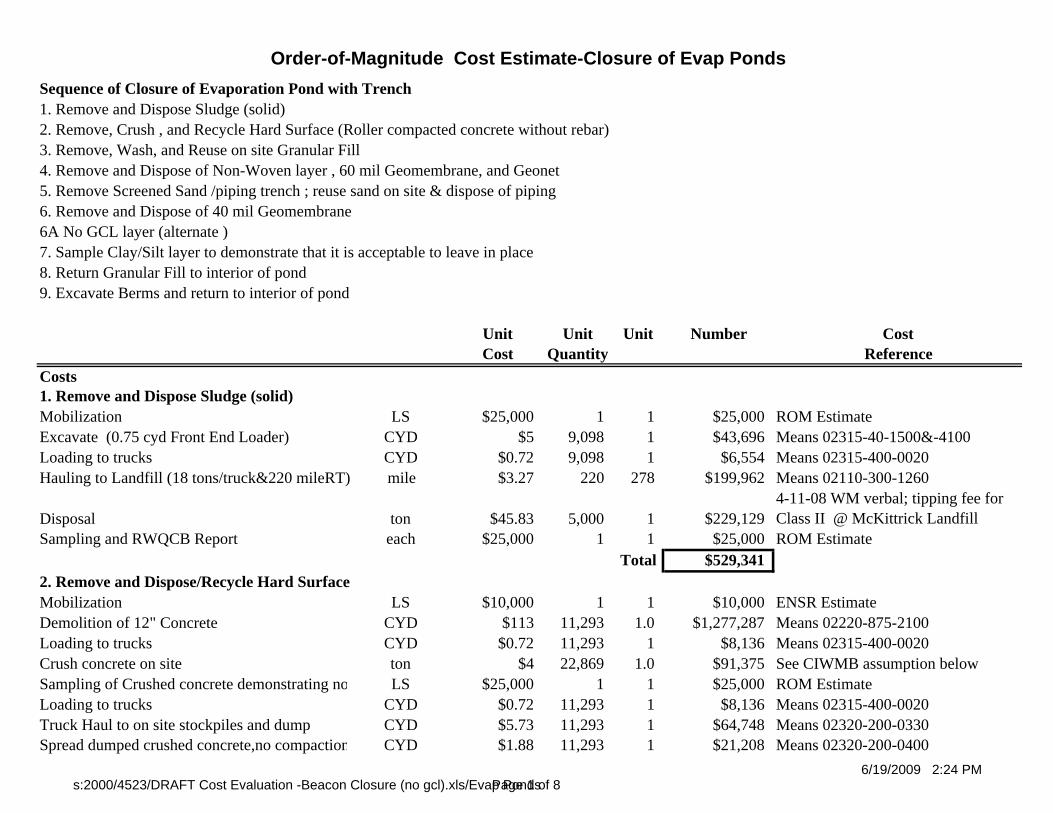
Order-of-Magnitude Cost Estimate-Closure of Evap Ponds
Sequence of Closure of Evaporation Pond with Trench 1. Remove and Dispose Sludge (solid)2. Remove, Crush , and Recycle Hard Surface (Roller compacted concrete without rebar)3. Remove, Wash, and Reuse on site Granular Fill4. Remove and Dispose of Non-Woven layer , 60 mil Geomembrane, and Geonet 5. Remove Screened Sand /piping trench ; reuse sand on site & dispose of piping 6. Remove and Dispose of 40 mil Geomembrane6A No GCL layer (alternate ) 7. Sample Clay/Silt layer to demonstrate that it is acceptable to leave in place8. Return Granular Fill to interior of pond9. Excavate Berms and return to interior of pond
Unit Unit Unit Number CostCost Quantity Reference
Costs1. Remove and Dispose Sludge (solid)Mobilization LS $25,000 1 1 $25,000 ROM EstimateExcavate (0.75 cyd Front End Loader) CYD $5 9,098 1 $43,696 Means 02315-40-1500&-4100Loading to trucks CYD $0.72 9,098 1 $6,554 Means 02315-400-0020Hauling to Landfill (18 tons/truck&220 mileRT) mile $3.27 220 278 $199,962 Means 02110-300-1260
Disposal ton $45.83 5,000 1 $229,1294-11-08 WM verbal; tipping fee for Class II @ McKittrick Landfill
Sampling and RWQCB Report each $25,000 1 1 $25,000 ROM EstimateTotal $529,341
2. Remove and Dispose/Recycle Hard SurfaceMobilization LS $10,000 1 1 $10,000 ENSR EstimateDemolition of 12" Concrete CYD $113 11,293 1.0 $1,277,287 Means 02220-875-2100Loading to trucks CYD $0.72 11,293 1 $8,136 Means 02315-400-0020Crush concrete on site ton $4 22,869 1.0 $91,375 See CIWMB assumption belowSampling of Crushed concrete demonstrating no LS $25,000 1 1 $25,000 ROM EstimateLoading to trucks CYD $0.72 11,293 1 $8,136 Means 02315-400-0020Truck Haul to on site stockpiles and dump CYD $5.73 11,293 1 $64,748 Means 02320-200-0330Spread dumped crushed concrete,no compaction CYD $1.88 11,293 1 $21,208 Means 02320-200-0400
s:2000/4523/DRAFT Cost Evaluation -Beacon Closure (no gcl).xls/Evap Ponds Page 1 of 86/19/2009 2:24 PM

Order-of-Magnitude Cost Estimate-Closure of Evap Ponds
Sequence of Closure of Evaporation Pond with Trench 1. Remove and Dispose Sludge (solid)2. Remove, Crush , and Recycle Hard Surface (Roller compacted concrete without rebar)3. Remove, Wash, and Reuse on site Granular Fill4. Remove and Dispose of Non-Woven layer , 60 mil Geomembrane, and Geonet 5. Remove Screened Sand /piping trench ; reuse sand on site & dispose of piping 6. Remove and Dispose of 40 mil Geomembrane6A No GCL layer (alternate ) 7. Sample Clay/Silt layer to demonstrate that it is acceptable to leave in place8. Return Granular Fill to interior of pond9. Excavate Berms and return to interior of pond
Unit Unit Unit Number CostCost Quantity Reference
Total $1,505,890
3. Remove, Wash, & Reuse Granular FillMobilization LS $25,000 1 1 $25,000 ROM EstimateExcavate (0.75 cyd Front End Loader) CYD $3 11,293 1 $33,900 Means 02315-40-1500Loading to trucks CYD $0.45 11,293 1 $5,085 Means 02315-400-0020Truck Haul to on site stockpile and dump CYD $4.17 11,293 1 $47,075 Means 02320-200-0400Wash to remove salts CYD $5.00 11,293 1 $56,467 ROM EstimateDisposal of Wash Water gal $0.50 225,867 1 $112,933 ROM EstimateLoading to stockpile CYD $0.45 11,293 1 $5,085 Means 02315-400-0020
Total $285,545
4. Remove and Dispose of Non-Woven layer , 60 mil Geomembrane, and Geonet Mobilization LS $5,000 1 1 $5,000 ROM EstimatePick up and cutting of Non-Woven, HDPE SF $0.40 304,920 1 $121,463 Means 02225-380-0400 (roughly ~)Loading to trucks SF $0.06 304,920 1 $18,219 Means 02315-400-0020 (roughly ~)Hauling to Facility (18 tons/truck & 220 mileRT mile $3.27 220 4 $3,049 Means 02110-300-1260Disposal ton $92.47 76 1 $7,049 Means 02225-740-0100
Total $154,780
s:2000/4523/DRAFT Cost Evaluation -Beacon Closure (no gcl).xls/Evap Ponds Page 2 of 86/19/2009 2:24 PM

Order-of-Magnitude Cost Estimate-Closure of Evap Ponds
Sequence of Closure of Evaporation Pond with Trench 1. Remove and Dispose Sludge (solid)2. Remove, Crush , and Recycle Hard Surface (Roller compacted concrete without rebar)3. Remove, Wash, and Reuse on site Granular Fill4. Remove and Dispose of Non-Woven layer , 60 mil Geomembrane, and Geonet 5. Remove Screened Sand /piping trench ; reuse sand on site & dispose of piping 6. Remove and Dispose of 40 mil Geomembrane6A No GCL layer (alternate ) 7. Sample Clay/Silt layer to demonstrate that it is acceptable to leave in place8. Return Granular Fill to interior of pond9. Excavate Berms and return to interior of pond
Unit Unit Unit Number CostCost Quantity Reference
5. Remove Screened Sand /piping trench ; SumpExcavate (0.75 cyd Front End Loader) CYD $3 4 1 $12 Means 02315-40-1500Loading to trucks CYD $0.45 4 1 $2 Means 02315-400-0020Truck Haul to on site stockpile and dump CYD $6.69 4 1 $27 Means 02320-200-0400
Total $41
6. Remove and Dispose of 40 mil Geomembrane
Mobilization LS $5,000 1 1 $5,000 ROM EstimatePick up and cutting of HDPE SF $0.20 304,920 1 $60,731 Means 02225-380-0400 (roughly ~1/2)Loading to trucks SF $0.03 304,920 1 $9,110 Means 02315-400-0020 (roughly ~)Hauling to Facility (18 tons/truck & 220 mileRT mile $3.27 220 2 $1,524 Means 02110-300-1260Disposal of 40 mil HDPE ton $92.47 38 1 $3,525 Means 02225-740-0100
Total $79,890
6A Remove GCL layer (alternate ) and dispose as daily cover at landfill Excavate (0.75 cyd Front End Loader) CYD $3 3,761 $0 Means 02315-40-1500Loading to trucks SF $0.06 304,920 $0 Means 02315-400-0020 (roughly ~)
s:2000/4523/DRAFT Cost Evaluation -Beacon Closure (no gcl).xls/Evap Ponds Page 3 of 86/19/2009 2:24 PM

Order-of-Magnitude Cost Estimate-Closure of Evap Ponds
Sequence of Closure of Evaporation Pond with Trench 1. Remove and Dispose Sludge (solid)2. Remove, Crush , and Recycle Hard Surface (Roller compacted concrete without rebar)3. Remove, Wash, and Reuse on site Granular Fill4. Remove and Dispose of Non-Woven layer , 60 mil Geomembrane, and Geonet 5. Remove Screened Sand /piping trench ; reuse sand on site & dispose of piping 6. Remove and Dispose of 40 mil Geomembrane6A No GCL layer (alternate ) 7. Sample Clay/Silt layer to demonstrate that it is acceptable to leave in place8. Return Granular Fill to interior of pond9. Excavate Berms and return to interior of pond
Unit Unit Unit Number CostCost Quantity Reference
Hauling to Facility (18 tons/truck & 220 mileRT mile $3.27 220 $0 Means 02110-300-1260Disposal of GCL ton $42.68 4,889 $0 AECOM experience
Total $0
7. Sample Clay/Silt layer to demonstrate that it is acceptable to leave in placeSample Collection Day $1,800 2 1 $2,744 ROM EstimateSample Analysis Each $250 30 1 $7,623 TPH by 8015 & Title 22Report of Analytical Each $7,500 1 1 $7,500 ROM Estimate
Total $17,867
8. Return Granular Fill to interior of pondMobilization LS $5,000 1 1 $5,000 ROM EstimateExcavate (0.75 cyd Front End Loader) CYD $3 11,293 1 $33,900 Means 02315-400-1500Loading to trucks CYD $0.45 11,293 1 $5,085 Means 02315-400-0020Truck Haul to on site stockpile and dump CYD $5.73 11,293 1 $64,748 Means 02320-200-0330Spread dumped fill,no compaction CYD $1.88 11,293 1 $21,208 Means 02320-200-0400
Total $129,9419. Excavate Berms and return to interior of pondMobilization LS $10,000 1 1 $10,000 ROM Estimate
s:2000/4523/DRAFT Cost Evaluation -Beacon Closure (no gcl).xls/Evap Ponds Page 4 of 86/19/2009 2:24 PM

Order-of-Magnitude Cost Estimate-Closure of Evap Ponds
Sequence of Closure of Evaporation Pond with Trench 1. Remove and Dispose Sludge (solid)2. Remove, Crush , and Recycle Hard Surface (Roller compacted concrete without rebar)3. Remove, Wash, and Reuse on site Granular Fill4. Remove and Dispose of Non-Woven layer , 60 mil Geomembrane, and Geonet 5. Remove Screened Sand /piping trench ; reuse sand on site & dispose of piping 6. Remove and Dispose of 40 mil Geomembrane6A No GCL layer (alternate ) 7. Sample Clay/Silt layer to demonstrate that it is acceptable to leave in place8. Return Granular Fill to interior of pond9. Excavate Berms and return to interior of pond
Unit Unit Unit Number CostCost Quantity Reference
Excavate (Dozer, 300' haul, common earth) CYD $7 86,267 1 $597,684 Means 02315-410-4420Total $607,684
Subtotal Field Activities Costs $3,310,980
Contingency (0% of All of the Above Costs) $0Total $3,310,980
Total Field Activities Costs $3,320,000
Engineering and Oversite
Engineering (2% of Total Construction Cost) $67,000 Means 01107-300-1200 (min.)Permitting (0.5% of Total Construction Cost) $17,000 Means 01310-150-0010 (min.)Construction Management (5% of Total Construction Cost) $166,000 Means 01107-200-0010 (min.)Closure Report (0.5% of Total Construction Cost) $17,000 Means 01310-150-0010
Total Engineering and Oversite Cost $267,000
s:2000/4523/DRAFT Cost Evaluation -Beacon Closure (no gcl).xls/Evap Ponds Page 5 of 86/19/2009 2:24 PM

Order-of-Magnitude Cost Estimate-Closure of Evap Ponds
Sequence of Closure of Evaporation Pond with Trench 1. Remove and Dispose Sludge (solid)2. Remove, Crush , and Recycle Hard Surface (Roller compacted concrete without rebar)3. Remove, Wash, and Reuse on site Granular Fill4. Remove and Dispose of Non-Woven layer , 60 mil Geomembrane, and Geonet 5. Remove Screened Sand /piping trench ; reuse sand on site & dispose of piping 6. Remove and Dispose of 40 mil Geomembrane6A No GCL layer (alternate ) 7. Sample Clay/Silt layer to demonstrate that it is acceptable to leave in place8. Return Granular Fill to interior of pond9. Excavate Berms and return to interior of pond
Unit Unit Unit Number CostCost Quantity Reference
T O T A L C O S T $3,587,000
s:2000/4523/DRAFT Cost Evaluation -Beacon Closure (no gcl).xls/Evap Ponds Page 6 of 86/19/2009 2:24 PM

Order-of-Magnitude Cost Estimate-Closure of Evap Ponds
Sequence of Closure of Evaporation Pond with Trench 1. Remove and Dispose Sludge (solid)2. Remove, Crush , and Recycle Hard Surface (Roller compacted concrete without rebar)3. Remove, Wash, and Reuse on site Granular Fill4. Remove and Dispose of Non-Woven layer , 60 mil Geomembrane, and Geonet 5. Remove Screened Sand /piping trench ; reuse sand on site & dispose of piping 6. Remove and Dispose of 40 mil Geomembrane6A No GCL layer (alternate ) 7. Sample Clay/Silt layer to demonstrate that it is acceptable to leave in place8. Return Granular Fill to interior of pond9. Excavate Berms and return to interior of pond
Unit Unit Unit Number CostCost Quantity Reference
AssumptionsNo need for construction support facilities since site has infrastructureBerms are constructed by removal of native material from siteSee Attached worksheet for support to berm volumesVolume of berm material is ~ 86267 cyd VolWDR Joint Document states that a total of 30,000,000 pounds or for 3 ponds 10,000,000 poundsAccumulated Sludge is now a solid Dry Weight 5000 tons or 9098 Cubic YardsSludge is not a RCRA or Cal hazardous material,is equivalent to hydrocarbon impacted soil & can be disposed in WM landfill in McKittrick, CASludge meets landfill permit on moisture content and density is roughly equivalent to impacted soil
Assume that Project description over rides Worley Parson design drawings Area 7.00 acres
Pond Area Area 304920 Square Feet
Concrete Thickness 1 feet Vol 11293 Cubic YardsDensity 150 lbs/cft Wt. 22869 Tons
Concrete crushing assumes that there is no rebar; A 1997 study (CALTRANS) as reported by CIWMB found that costs to produce 3/4inch material were $4 to $5/ton and to produce 1.5 inch material were $3 to $3.50/ton; Use 4.00 per tonGranular Fill Thickness 1 feet Vol 11293 Cubic Yards
s:2000/4523/DRAFT Cost Evaluation -Beacon Closure (no gcl).xls/Evap Ponds Page 7 of 86/19/2009 2:24 PM

Order-of-Magnitude Cost Estimate-Closure of Evap Ponds
Sequence of Closure of Evaporation Pond with Trench 1. Remove and Dispose Sludge (solid)2. Remove, Crush , and Recycle Hard Surface (Roller compacted concrete without rebar)3. Remove, Wash, and Reuse on site Granular Fill4. Remove and Dispose of Non-Woven layer , 60 mil Geomembrane, and Geonet 5. Remove Screened Sand /piping trench ; reuse sand on site & dispose of piping 6. Remove and Dispose of 40 mil Geomembrane6A No GCL layer (alternate ) 7. Sample Clay/Silt layer to demonstrate that it is acceptable to leave in place8. Return Granular Fill to interior of pond9. Excavate Berms and return to interior of pond
Unit Unit Unit Number CostCost Quantity Reference
60-mil HDPE/Geotextile 304920 Square FeetSand/Gravel Fill Sump Thickness 6 feet Vol 4 Cubic Yards40-mil HDPE 304920 Square FeetCompacted Clay/Silt Thickness 2 feet Vol 22587 Cubic YardsAssume that Compact Clay/Silt can remain as it is not impacted
Notes Unit Costs are from RS Means Building Construction Cost Data 2001 Western VersionUnit Costs are adjusted by the City Cost Index; 1.13 Means page 612 for Installation index for Riverside, CAUnit Costs are adjusted by the ENR Historical Cost Index to estimate 2008 costs Compare Construction Cost Index since closure is mostly labor and not materials purchaseENR Construction Cost Index for Los Angeles in December 1997 6664ENR Construction Cost Index for Los Angeles in December 2000 7068ENR Construction Cost Index for Los Angeles in December 2007 (est) 8875Historical Cost adjustment is 2007 #/ 1997 # 1.33Historical Cost adjustment is 2007 #/ 2000 # 1.26Combine historical (2007 to 2000) & City cost adjustment 1.42
s:2000/4523/DRAFT Cost Evaluation -Beacon Closure (no gcl).xls/Evap Ponds Page 8 of 86/19/2009 2:24 PM

Beacon Solar Energy Project 45 June 2009
Appendix L - Preliminary Closure Plan for the Land Treatment Unit Figure Revisions


CA
NV
AZ
OR
UT
ID
Project: 10056-014Date: June 2009
BSEP
Figure 2-2Topography Map
Map Location
J:\G
IS\P
roje
cts\
10
05
6-B
ea
con
\mxd
\RO
WD
-Oth
ers
\To
po
gra
ph
y m
ap
.mxd

Beacon Solar Energy Project 46 June 2009
Appendix M - Preliminary Post-Closure Maintenance Plan for the Evaporation Ponds and Land Treatment Unit
2.0 Site Background
The Project is a concentrating solar electric generating facility proposed on an approximately 2,012-acre site in Kern County, California. The Project will use well-established parabolic trough solar thermal technology to produce electrical power using a steam turbine generator (STG) fed from a solar steam generator (SSG). The SSG receives HTF from solar thermal equipment comprised of arrays of parabolic mirrors that collect energy from the sun.
The Project proposes to use a wet cooling tower for power plant cooling. Water for cooling tower makeup, process water makeup, and other industrial uses such as mirror washing will be supplied from on-site groundwater wells, which will also be used to supply water for employee use (e.g., drinking, showers, sinks, and toilets). A package water treatment system will be used to treat the water used by employees to meet potable standards. A sanitary septic system and on-site leach field will be used to dispose of sanitary wastewater.
The Project cooling water blow down will be piped to lined, on-site evaporation ponds. The ponds will be sized to retain all solids generated during the life of the Project. However, if required for maintenance, dewatered residues from the ponds will be sent to an appropriate off-site landfill as non-hazardous waste. The layout of the proposed facility is shown in Figure 2-1. The waste storage and treatment units include three evaporation ponds and the LTU for HTF-contaminated soils as described below.
2.1 Waste Handling Facilities
The configuration of the planned evaporation ponds, LTU, and adjacent areas are shown in Figure 2-1. Topography of the Project and surrounding areas are shown on Figure 2-2. The final grading contours for the entire Site are shown on Figure 2-3 and a close-up grading plan for the evaporation ponds and LTU are shown on Figure 2-4.
2.1.1 Evaporation Ponds
The three 2.7-acre (total combined pond top area of 8.1 acres) evaporation ponds have an average proposed design depth of 8 feet, which incorporates the following:
3 feet of residue build up over 3.5 to 4.5 years followed by cleanout,
3 feet of operational depth, and
2 feet of freeboard.
The containment design for the evaporation ponds, from the surface of the evaporation ponds downwards, consists of the following:
A hard surface/protective layer with granular fill/free draining sub-base over geotextile;
A primary 60 mil high density polyethylene (HDPE) liner;
An interstitial leak detection and removal system comprising a geomembrane geonet and collection piping;
A secondary 40 mil HDPE liner; and

Beacon Solar Energy Project 47 June 2009
A base layer consisting of either a geosynthetic clay liner (GCL) or 2 feet of on-site material with a hydraulic conductivity of less than 1 x 10⁻⁶ centimeters per second of which 30 percent, by weight, shall pass through a Number 200 U.S. standard sieve.
The design details of the evaporation ponds are shown in Figure 2-5.
Wastewater that is discharged to the evaporation ponds consists of boiler feedwater, cooling tower blow down water, and HTF. Table 2-1 is a list of anticipated chemicals that wastewater may contain.
2.1.2 Land Treatment Unit
The LTU will cover an area of approximately 400 feet by 800 feet. The LTU will not incorporate a liner containment system or leak detection and removal system (LDRS), but will be constructed with a prepared base consisting of a minimum of 2 feet of compacted, low permeability, lime-treated native material. This base will serve as a competent platform for land treatment activities, and will serve to slow the rate of surface water infiltration in the treatment area. The compacted and native soil beneath the LTU is designated as a “treatment zone” to a depth of 5 feet. Although the land treatment will be taking vehicle traffic, no hard surface will be required, as there is no liner system to protect.
The LTU will be surrounded on all sides by a two-foot high compacted earthen berm with side slopes of approximately 3:1 (horizontal: vertical). These berms will control and prevent potential inflow (run on) of surface stormwater into the LTU or runoff of stormwater from the unit.
The LTU will be used for soils with concentrations less than 10,000 milligrams per kilogram (mg/kg) of HTF. Based on the experience at the existing solar electric generating system (SEGS) facilities, the California Department of Toxics Substances Control (DTSC) has determined that soil contaminated with HTF in concentrations less than 10,000 mg/kg is classified as a non-hazardous waste. Since this project uses similar technology as the SEGS facilities, it is assumed that for this project, HTF-impacted soil will be handled in a similar fashion to the SEGS facilities. A copy of the DTSC determination letter is included in Appendix A.
Contaminated soil will remain in the LTU until concentrations are reduced to less than an average concentration of 100 mg/kg; the remediated soil is expected to be used as fill material on the site. Soils with initial HTF concentrations less than 100 mg/kg will be used as fill material on the site.
The construction design details of the LTU are shown in Figure 2-6.
2.2 Closure Description Summary
BSEP proposes to clean-close the evaporation ponds and LTU after operational activities of the solar power plant permanently cease. Clean closure activities will consist of the removal of all improvements to within 3 feet of final grade followed by the restoration of lines and grades in the disturbed area of the Project Site to match the natural gradients.
The strategy to close the Project will consist of the following measures:
Conducting pre-closure activities such as final closure and restoration planning that addresses the “as-found” site conditions at the start of the Project;
Demolition of the above-ground structures (dismantling and removal of improvements and materials) in a phased approach while still using some items until close to the end of the Project;
Demolition and removal of below-ground facilities (underground utilities) as needed to meet the closure goals;

Beacon Solar Energy Project 48 June 2009
Soils cleanup, if needed, with special attention applied to evaporation pond and hazardous materials use/storage areas to ensure that clean closure is achieved;
Disposal of materials in appropriate facilities for treatment/disposal or recycling; and
Re-contouring of lines and grades to match the natural gradient and function.
3.0 Preliminary Post Closure Maintenance Plan
Closure of the waste facilities will involve the complete removal of the evaporation ponds and LTU. As such, the Post Closure Maintenance Plan consists of a post closure groundwater monitoring program. The post closure groundwater monitoring program will be a continuation of the detection monitoring program (DMP) and will involve analyzing groundwater samples from the same wells used in the DMP.
3.1.1 Groundwater Monitoring
Post closure groundwater monitoring will involve collecting groundwater samples from the existing wells shown on Figure 3-1. No new wells are proposed to be installed as part of the post closure groundwater monitoring program. Groundwater samples will be collected from wells that are adjacent to the evaporation ponds and LTU, and from wells near the property boundaries.
Depth-to-water will be measured in each well and groundwater samples will be collected on a semi-annual basis (once every six months) using low-flow groundwater sampling techniques (see Appendix B for field procedures). For each calendar year, groundwater samples for the first semiannual monitoring event will be analyzed for the parameters listed on Table 3-1. Later in the year, the second semiannual monitoring event will be referred to as the “Annual” monitoring event and groundwater from this event will be analyzed for the parameters shown on Table 3-2.
Each well will have a dedicated pump in it from which groundwater samples can be obtained. The pumps will be installed as part of the detection monitoring program. During the operational life of the solar plant, process water will be provided to the plant from one of two existing on-site water supply wells: Well 49 or well 62 (see Figure 3-1) or from an offsite source (recycled wastewater from Rosamond Wastewater Treatment Plant or offsite groundwater from the Koehn Lake region). If the onsite wells are used for the water supply, and are shut down following plant decommissioning and closure of the evaporation ponds/LTUs, it is anticipated that water levels within the former cone of depression will rise as much as 30 feet as the water table reverts to a static elevation. In the event of this occurrence, it will be necessary to raise the groundwater sampling pumps in all wells within the former cone of depression so that the pump inlets are approximately 5 to 6 feet below the stabilized water level.
3.1.2 Data Evaluation
Using approved statistical or non-statistical data analysis methods approved in Board Order No. 6-98-74, the Project will, for each monitoring event, compare the concentration of each monitoring parameter with its respective concentration limit to determine if groundwater has been impacted by constituents from the former evaporation ponds and/or LTU. Consistent with CCR Title 22, Section 66264.97(e), the groundwater monitoring report will include a graphical and statistical trend analysis of the groundwater monitoring data.
3.1.2.1 Graphical Analysis
Time series graphs of groundwater chemical data will be presented. Graphs will be at a scale appropriate to show trends or variations in water quality. Wells that have been primarily below detection limits for a given constituent will not be graphed.
Maps illustrating the groundwater flow direction and chemical data (e.g., chloride, nitrate as nitrogen, phosphate, sulfate, total dissolved solids (TDS), biphenyl oxide, and diphenyl oxide will be presented.

Beacon Solar Energy Project 49 June 2009
3.1.2.2 Statistical Trend Analysis
A trend is defined as the general increase or decrease in observed values of some variable over time. Trend analysis can be used to determine the significance of an apparent trend and to estimate the magnitude of that trend. The Mann Kendall trend test and the Sen's slope estimator were chosen to statistically analyze the data because they are the accepted non parametric trend analysis methods for data that are not normally distributed.
Mann Kendall Trend Test. The test will be conducted on the groundwater data to evaluate the existence of significant trends. The Mann Kendall formula is as follows:
n-1 n
S = sgn (xj - xk) k=1 j = k +1
The resulting statistic is the number of positive differences minus the number of negative differences. The statistics can be used to test the null hypothesis for the absence of a trend or the presence of a trend.
Sen's Slope Estimator. This simple procedure developed by Sen is used to estimate the slope or rate of change of the parameters in question. The advantage of this method over simple linear regression is that it is not greatly affected by gross data errors or outliers, and can even be computed when data are missing.
The N' individual slope estimates, Q, are computed for each time period:
Q = Xi'-Xi i' i where Xi' and Xi are data values at time i' and i, respectively N' is the number of data pairs for which i'>i The median of these N' values of Q is Sen's estimator of slope. N' is determined as follows:
N' = n(n-1) 2
If only one datum per time period exists, n is the number of time periods.
A value of one half of the detection limit will be substituted for Xi values below the detection limit.
The median of the N' slope estimates is obtained by ranking the values of Q from smallest to largest and computing as follows:
Sen's estimator= median slope
Q(N'+1)/2 if N' is even
1/2 {Q(N'/2) + Q[(N'+2)/2]} if N' is odd

Beacon Solar Energy Project 50 June 2009
Preliminary Post-Closure Plan for the Evaporation Ponds and Land Treatment Unit Table Revisions

Table 2-1A Predicted Chemistry of Wastewater Streams for Onsite Groundwater (Lower TDS)
Constituent Units Concentration in Mean Well
Water
Concentration in Cooling
Tower Blow Down
Concentration in Ion
Exchange Regeneration Wastewater
Concentration into Brine
Concentrator
Concentration in Evaporation
Pond Discharge
STLC (mg/L)
TCLP (mg/L)
Aluminum (total) (mg/L Al) 0.023 0.04 0.25 0.15 1.54 * *
Ammonia (as N) 0.038 0.06 0.41 0.26 2.55 * *
Arsenic (total) (mg/L As) 0.0035 0.01 0.04 0.02 0.23 5.0 5.0
Boron (total) (mg/L B) 0.18 0.30 1.96 1.21 12.08 * *
Calcium (total) (mg/L Ca) 47 77.40 511.83 315.43 3151.11 * *
Chloride (mg/L Cl) 15.5 25.50 168.80 104.01 1039.08 * *
Cyanide (total) (mg/L as HCN)
0.007 0.01 0.08 0.05 0.47 * *
Fluoride (mg/L as F) 0.459 0.75 5.00 3.08 30.75 180 *
HCO3 (bicarbonate alkalinity)
(mg/L HCO3)
257 16.40 48.68 34.09 340.53 * *
Iron (total) (mg/L Fe) 0.047 0.08 0.51 0.32 3.15 * *
Magnesium (total) (mg/L Mg) 11 18.15 119.79 73.84 737.65 * *
M-Alkalinity (mg/L as CaCO3)
207 14.10 2254.23 1241.48 12402.37 * *
Nitrate (mg/L as NO3)
1.183 1.95 12.88 7.94 79.32 * *
Phosphate (total) (mg/L as PO4)
0.019 0.03 0.21 0.13 1.27 * *
Potassium (total) (mg/L K) 4.1 6.76 44.65 27.52 274.92 * *
Selenium (total) (mg/L Se) 0.00039 0.00 0.00 0.00 0.03 1.0 1.0

Table 2-1A Predicted Chemistry of Wastewater Streams for Onsite Groundwater (Lower TDS)
Constituent Units Concentration in Mean Well
Water
Concentration in Cooling
Tower Blow Down
Concentration in Ion
Exchange Regeneration Wastewater
Concentration into Brine
Concentrator
Concentration in Evaporation
Pond Discharge
STLC (mg/L)
TCLP (mg/L)
Silica (mg/L as SiO2)
33.3 54.90 362.64 223.51 2232.87 * *
Silicon (mg/L as Si) 15.7 24.35 170.97 104.69 1045.80 * *
Sodium (total) (mg/L Na) 78 141.90 3739.92 2113.27 21111.58 * *
Strontium (total) (mg/L Sr) 0.78 1.21 8.49 5.20 51.96 * *
Sulfate (mg/L SO4) 118 477.56 6952.81 4025.38 40213.55 * *
Zinc (total) (mg/L Zn) 0.012 0.02 0.13 0.08 0.80 250 *
pH pH 8.00 7.00
Total Dissolved Solids (ppm) 550 857.28 12150.05 7044.64 70331.24 * *
Notes:
Regulatory Standards/Reportable Quantities are for elements mentioned only * Not listed/no standards ---- Unknown STLC = Soluble Threshold Limit Concentration, Regulated by CCR Title 22, Division 4.5, Article 3, Section 66261.24 TCLP = Toxicity Characteristics Leaching Procedure; Regulated under 40 CFR Section 261.24

Table 2-1B Predicted Chemistry of Wastewater Streams for Offsite Groundwater (Upper TDS)
Constituent Units Concentration in Mean Well Water (mg/L)
Concentration in Evaporation Pond Discharge (mg/L)
STLC (mg/L)
TCLP (mg/L)
Calcium (total) (mg/L Ca) 69 934 * *
Chloride (mg/L Cl) 250 20,098 * *
Fluoride (mg/L as F) 9.3 620 180 *
HCO3 (bicarbonate alkalinity)
(mg/L HCO3) 319 271 * *
Iron (total) (mg/L Fe) < 0.010 - * *
Magnesium (total) (mg/L Mg) 9.9 324 * *
M-Alkalinity (mg/L as CaCO3) 210 223 * *
Nitrate (mg/L as NO3) 0 2 * *
Nitrate and Nitrite (mg/L as N) 0.03 - * *
Potassium (total) (mg/L K) 6.3 420 * *
Silica (mg/L as SiO2) 33 667 * *
Sodium (total) (mg/L Na) 510 36,446 * *
Sulfate (mg/L SO4) 690 51,171 * *
pH pH 7.8 - * *
Total Dissolved Solids (ppm) 1900 110,951 * *
Notes: Regulatory Standards/Reportable Quantities are for elements mentioned only * Not listed/no standards ---- Unknown STLC = Soluble Threshold Limit Concentration, Regulated by CCR Title 22, Division 4.5, Article 3, Section 66261.24 TCLP = Toxicity Characteristics Leaching Procedure; Regulated under 40 CFR Section 261.24 The list of constituents only includes parameters that there were mean well water data for. A completed waste stream stream evaluation should be undertaken when additional raw water constituents are known

Table 3-1 Groundwater Sample Analytical Parameters – Semi-Annual Monitoring
Parameter U.S. EPA or Standard Method
RL Goal Units
Chloride 300.0 14,000 ug/L
Nitrate as Nitrogen 300.0 1,000 ug/L
Phosphate (total) 365.3 100 ug/L
Sulfate 300.0 100,000 ug/L
TDS SM 2450C 10,000 ug/L
Biphenyl Oxide 8015M 1,000 ug/L
Diphenyl Oxide 8015M 1,000 ug/L
Static Water Depth Field +/- 0.1 feet bgs
pH reading Field +/- 0.1 pH units
Temperature Field +/- 0.1 °F or °C
Key:
ug/L – micrograms per liter RL – reporting limit SM – Standard Method
Note: If turbidity exceeds 10 NTU, groundwater samples will be field filtered and both the unfiltered and filtered groundwater samples will be submitted to the laboratory for metals and TDS analysis.

Table 3-2. Groundwater Sample Analytical Parameters – Annual Monitoring
Parameter U.S. EPA or Standard Method
RL Goal Units
Ammonia (as N) 350.1 100 ug/L
Aluminum 200.7 20 ug/L
Arsenic 6020 2.0 ug/L
Boron 200.7 140 ug/L
Calcium 200.7 40,000 ug/L
Chloride 300.0 14,000 ug/L
Cyanide (total) SM 4500 10 ug/L
Fluoride 300.0 500 ug/L
Iron 200.7 20 ug/L
Magnesium 200.7 10,000 ug/L
Manganese 200.7 15 ug/L
Molybdenum 6020 10.00 ug/L
Nitrate as Nitrogen 300.0 1,000 ug/L
Nitrite as Nitrogen SM 4500 4 ug/L
Potassium 200.7 3,000 ug/L
Phosphate (total) 365.3 100 ug/L
Selenium 6020 0.5 ug/L
Silica (as SiO2) 200.7 1,000 ug/L
Silicon (as Si) 200.7 1,000 ug/L
Sodium 200.7 10,000 ug/L
Strontium 200.7 500 ug/L
Sulfate 300.0 100,000 ug/L
TDS SM 2540C 10,000 ug/L
Total Alkalinity (as CaCO3)
SM 2320B 100,000 ug/L
Zinc 6020 10 ug/L
Biphenyl Oxide 8015M 500 ug/L
Diphenyl Oxide 8015M 500 ug/L
Cyclohexamine (20-40%)
8015M 500 ug/L
Morpholine 8015M 500 ug/L

Table 3-2. Groundwater Sample Analytical Parameters – Annual Monitoring
Parameter U.S. EPA or Standard Method
RL Goal Units
(1-10%)
pH reading Field +/- 0.1 pH units
Temperature Field +/- 0.1 °F or °C
Nalco 3D Trasar 177
Hand-Held Fluorometer
na na
Nalco 3D Trasar 190
Hand-Held Fluorometer
na na
Key:
CaCO3 - calcium carbonate SM – Standard Method ug/L – micrograms per liter na – not applicable RL – reporting limit
Note:
If turbidity exceeds 10 NTU, groundwater samples will be field filtered and both the unfiltered and filtered groundwater samples will be submitted to the laboratory for metals and TDS analysis.

Beacon Solar Energy Project 51 June 2009
Preliminary Post-Closure Plan for the Evaporation Ponds and Land Treatment Unit Figure Revisions

CA
NV
AZ
OR
UT
ID
Project: 10056-014Date: June 2009
BSEP
Figure 2-1Evaporation Pond and
Land Treatment Unit Layout
Map Location
J:\G
IS\P
roje
cts\
10
05
6-B
ea
con
\mxd
\RO
WD
-Oth
ers
\Po
nd
-la
nd
farm
lay
ou
t.m
xd
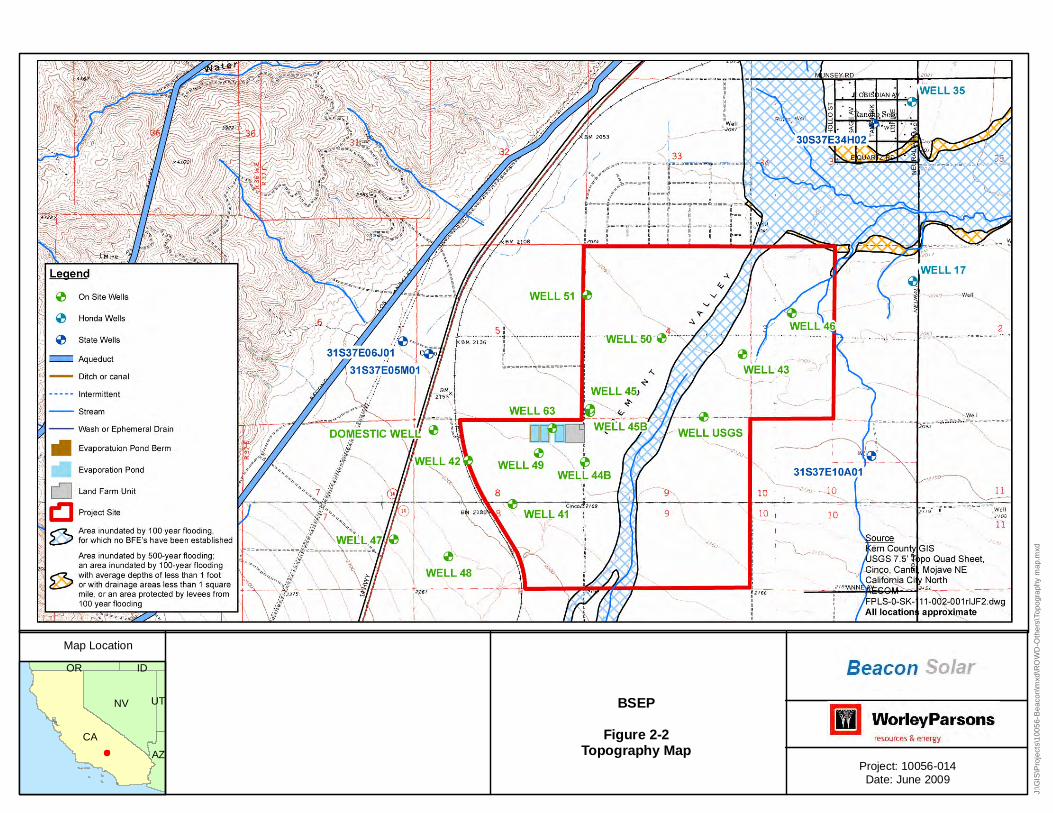
CA
NV
AZ
OR
UT
ID
Project: 10056-014Date: June 2009
BSEP
Figure 2-2Topography Map
Map Location
J:\G
IS\P
roje
cts\
10
05
6-B
ea
con
\mxd
\RO
WD
-Oth
ers
\To
po
gra
ph
y m
ap
.mxd

CA
NV
AZ
OR
UT
ID
Project: 10056-014Date: June 2009
BSEP
Figure 2-3Conceptual Grading Plan
Map Location
J:\G
IS\P
roje
cts\
10
05
6-B
ea
con
\mxd
\RO
WD
-Oth
ers
\gra
din
g p
lan
2.m
xd

CA
NV
AZ
OR
UT
ID
Project: 10056-014Date: June 2009
BSEP
Figure 2-4Evaporation Pond and
Land Treatment Unit Drainageand Grading Plan
Map Location
J:\G
IS\P
roje
cts\
10
05
6-B
ea
con
\mxd
\RO
WD
-Oth
ers
\ep
lf d
rain
ag
e.m
xd
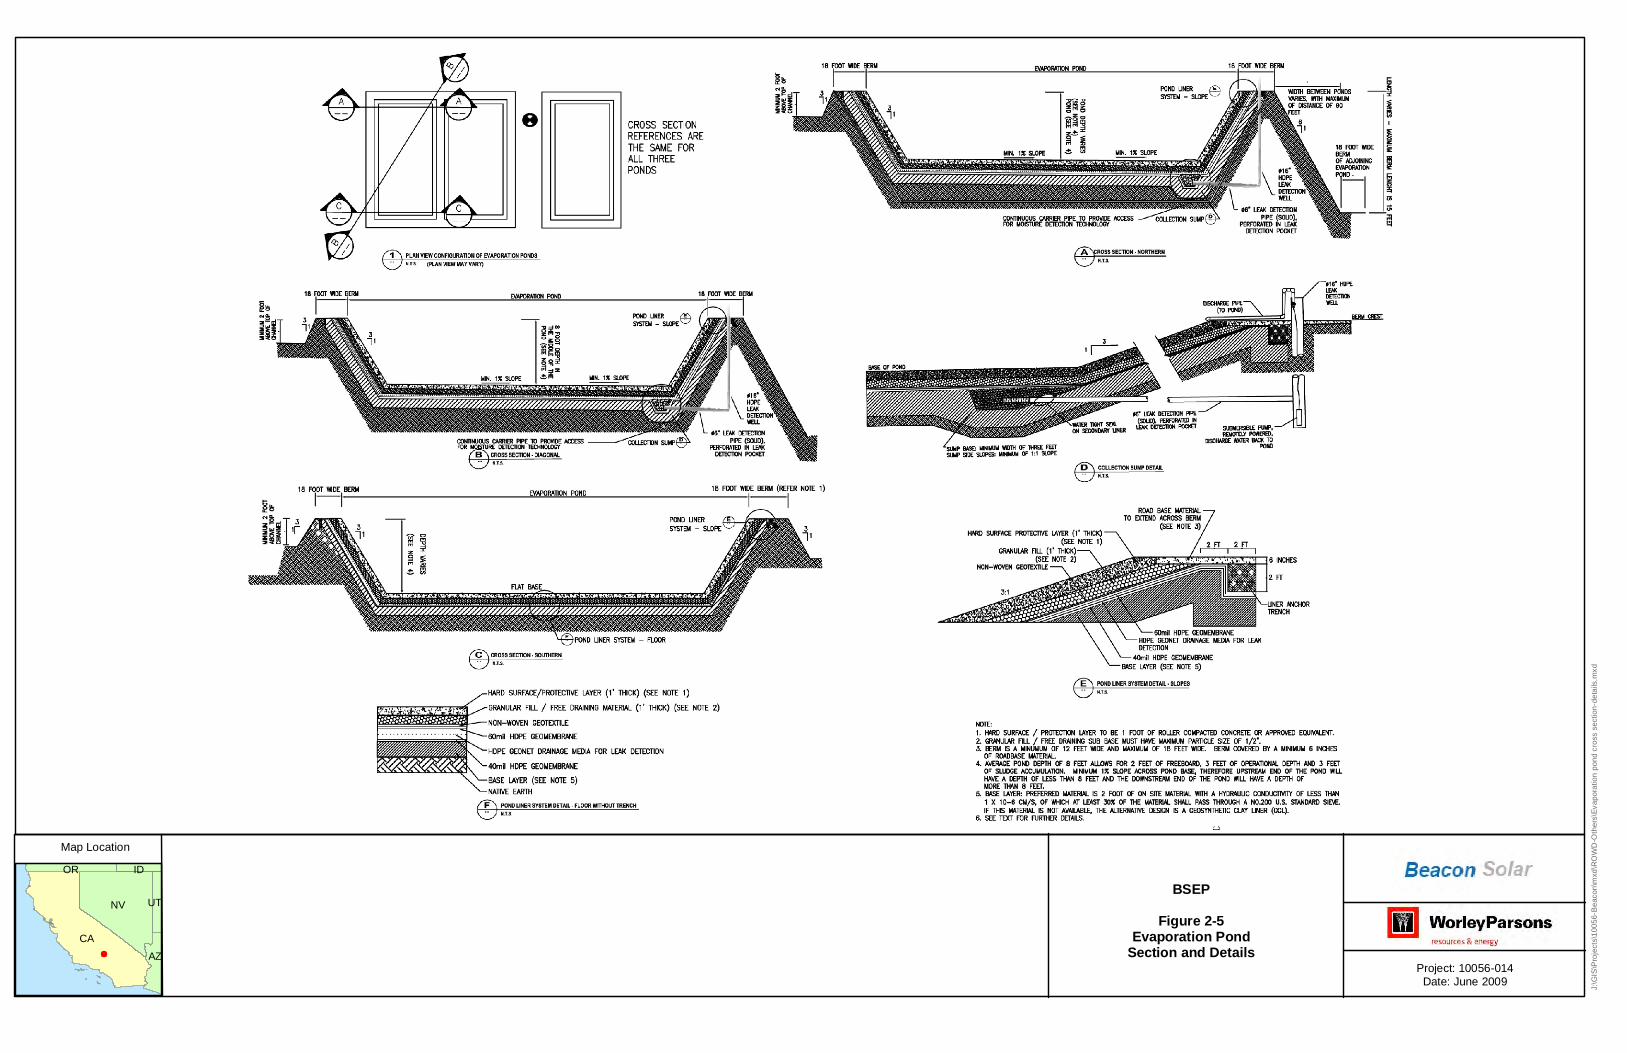
CA
NV
AZ
OR
UT
ID
Project: 10056-014Date: June 2009
BSEP
Figure 2-5Evaporation Pond
Section and Details
Map Location
J:\G
IS\P
roje
cts\
10
05
6-B
ea
con
\mxd
\RO
WD
-Oth
ers
\Ev
ap
ora
tion
po
nd
cro
ss s
ect
ion
-de
tails
.mx
d
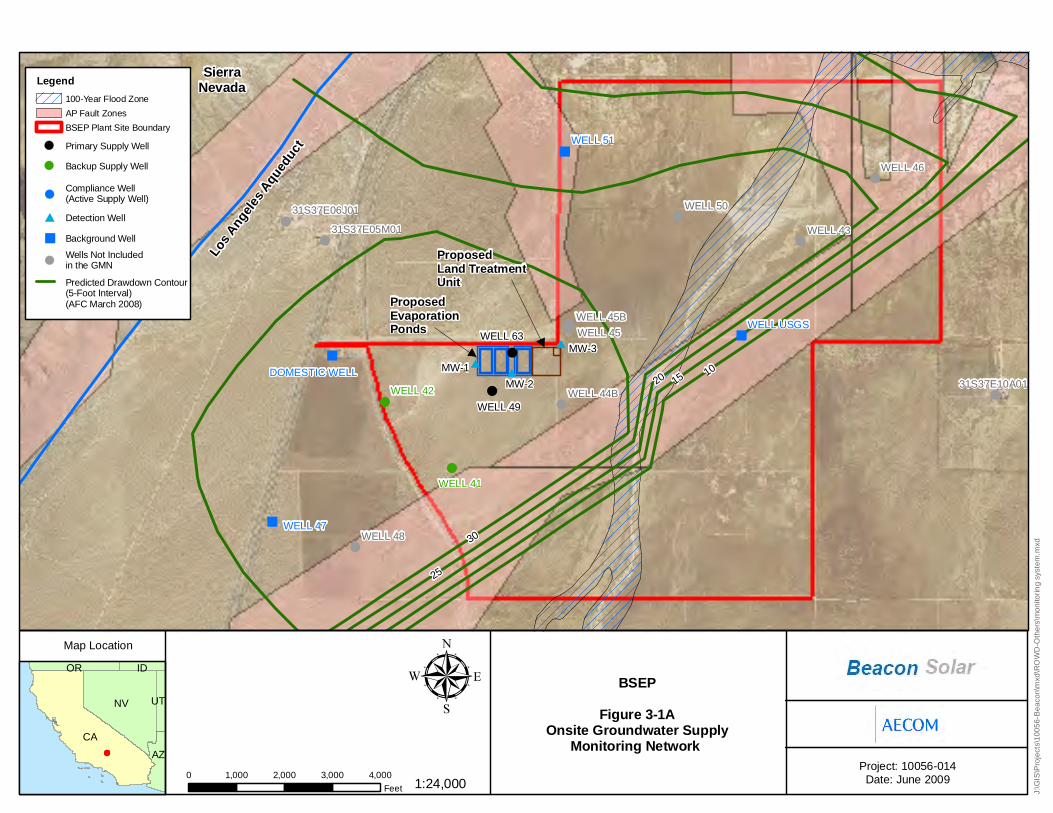
!
!
!!
!
!
!
##
#
"
"
"
"
!
!!
!
!
!
!
MW-3
MW-2
MW-1
WELL 63
WELL 51
WELL 49
WELL 47
WELL 46
WELL 42
WELL USGS
DOMESTIC WELL
WELL 50
WELL 48
WELL 45
WELL 43
WELL 41
WELL 45B
WELL 44B
101520
25
30
31S37E05M01
31S37E06J01
31S37E10A01
CA
NV
AZ
OR
UT
ID
Project: 10056-014Date: June 20090 1,000 2,000 3,000 4,000
Feet
µ BSEP
Figure 3-1AOnsite Groundwater Supply
Monitoring Network
Map Location
J:\G
IS\P
roje
cts\
10
05
6-B
ea
con
\mxd
\RO
WD
-Oth
ers
\mo
nito
rin
g s
yste
m.m
xd
1:24,000
SierraNevada
Los
Ang
eles
Aqu
educ
tProposedEvaporationPonds
Legend
100-Year Flood Zone
AP Fault Zones
BSEP Plant Site Boundary
Primary Supply Well
Backup Supply Well
Compliance Well(Active Supply Well)
# Detection Well
Predicted Drawdown Contour(5-Foot Interval)(AFC March 2008)
ProposedLand TreatmentUnit
" Background Well
Wells Not Includedin the GMN

!
!
!
!!
!
!
!
!#
#
#
!
!
!
!
!
!
"
"
"MW-3
MW-2
MW-1
WELL 63
WELL 51
WELL 49
WELL 47
WELL 46
WELL 42
WELL USGS
DOMESTIC WELL
WELL 50
WELL 48
WELL 45
WELL 43
WELL 41
WELL 45B
WELL 44B
31S37E05M01
31S37E06J01
31S37E10A01
CA
NV
AZ
OR
UT
ID
Project: 10056-014Date: June 20090 1,000 2,000 3,000 4,000
Feet
µ BSEP
Figure 3-1BOffsite Groundwater Supply
Monitoring Network
Map Location
J:\G
IS\P
roje
cts\
10
05
6-B
ea
con
\mxd
\RO
WD
-Oth
ers
\mo
nito
rin
g s
yste
m-o
ffsi
te.m
xd
1:24,000
SierraNevada
Los
Ang
eles
Aqu
educ
tProposedEvaporationPonds
Legend
100-Year Flood Zone
AP Fault Zones
BSEP Plant Site Boundary
Compliance Well
# Detection Well
ProposedLand TreatmentUnit
" Background Well
Wells Not Includedin the GMN
Beacon Solar Energy Project 52 June 2009
ATTACHMENT A RESPONSE TO RWQCB COMMENTS

Beacon Solar Energy Project 53 June 2009
ATTACHMENT A
Response to Comments Regional Water Quality Control Board – Lahontan Region April 17, 2009 Comments to the Draft Report of Waste Discharge Beacon Solar Energy Project
The initial draft report of waste discharge (RoWD) was provided by Beacon to the Lahontan Regional Water Quality Control Board (RWQCB) on May 21, 2008. The RWQCB provided comments to this application on January 12, 2009. Subsequently, a conference call was held with Beacon, its consultants and the RWQCB on January 30, 2009. From this call, the RoWD was revised and resubmitted to the RWQCB on March 18, 2009. Subsequently, the RWQCB provided comments to the revised application on April 17, 2009.
The following responses address comments provided in the April 17, 2009, letter and pertain to the March 18 RoWD and project design at that time.
1. RWQCB Comment – Waste Characteristics
a. The Revised RoWD states that the wastewater would be classified as designated waste under California Water Code Section 13173, because the wastewater contains constituents that could affect the beneficial uses of the waters of the State. The specific constituents must be listed in order to design an appropriate monitoring program.
Response
Revised Table 7A and 7B within the RoWD lists the predicted chemistry of the wastewater streams and Table 5 in the JTD lists the raw water chemistry from the water supply wells. In the unlikely worse case scenario of evaporation pond wastewater leaking into the groundwater (i.e. evaporation pond double liner system and collection sump pump failures simultaneously), there would be some constituents that have the potential to be released into the groundwater that have a higher concentration than the existing raw water concentrations. This is applicable to boron, calcium, fluoride, iron, magnesium, phosphate, potassium, selenium, silica, silicon and total dissolved solids for the lower bound TDS limit (onsite groundwater with partial ZLD). Although the evaporation pond wastewater has “higher” concentrations than the raw water for the aforementioned constituents, the waste water is not hazardous under the California Code of Regulations (CCR) Title 22, Division 4.5, Article 3, Section 66261.24 (as discussed in Section 4.3.1 of the RoWD). All of these constituents are included in Detection Monitoring Program for the site (refer to Appendix G, “Detection Monitoring Plan” Table 4-4).
b. There are discrepancies between Table 8, Predicted Chemistry of Evaporation Pond Residue, and Table 3-4 of Appendix G, Predicted Chemistry of Evaporation Residue. For example, selenium and zinc are listed in Table 8, but not in Table 3-4. Hexavalent chromium and sulfate are listed in Table 3-4, but not in Table 8. Also, there are some differences of the predicted concentrations for the same constituent. For example, the predicted concentration of boron is 247 parts per million (ppm) in Table 8 and 457 ppm in Table 3-4. The predicted concentration of fluoride is 630 ppm in Table 8, but 166 ppm in Table 3-4. These discrepancies must be resolved prior to the adoption of waste discharge requirements for the facility.
Response
Table 3-4 of Appendix G is an older version of Table 8 of the Revised RoWD. The constituents and predicted concentrations for the evaporation pond residue were recalculated to account for changes in

Beacon Solar Energy Project 54 June 2009
the design/system. Table 3-4 of Appendix G has been updated to reflect the constituents and predicted concentrations shown on Table 8, and is attached for reference.
c. The Revised RoWD provides additional information on waste characterization and includes the statement that heat transfer fluids "biodegrade relatively rapidly in the environment, have slight toxicity to tested terrestrial species, higher toxicity to aquatic species, and a potential to bioaccumulate." The Lahontan Water Board requires additional information to evaluate the potential threat from the waste stream. Provide specific information regarding anticipated degradation rates, potential breakdown products, and toxicity, fate and transport information for HTF and its breakdown products.
Response
Heat transfer fluid (HTF) is composed of approximately 76.5% biphenyl and 23.5% diphenyl ether. Specific information requested on HTF or each of these compounds as available is as follows:
Degradation Rates:
- Complete Product: An online MSDS reports aqueous biodegradation (elimination of dissolved organic carbon) of Solutia VP1 in OECD test 302A (inoculated with sewage) in 28 days.
- Biphenyl: Biphenyl has a soil half-life of 32 to 168 hours (1). In a silt loam soil, 86% of originally applied biphenyl mineralized to carbon dioxide in 98 days (2). In another soil, 81% of biphenyl initially applied was mineralized after 24 days (3).
- Diphenyl ether: structurally similar 4,4' diaminodiphenyl ether has a soil biodegradation half life of 672 hours to 6 months (1). Although biodegradation can occur, as discussed below photodegradation is expected to drive the half life of diphenyl ether in soil.
- At the Kramer Junction facility, HTF contaminated soils with concentrations between 1,000 and 10,000 mg/kg have treatment times that vary between one and four months. The variation in treatment times varies with ambient air and soil temperature (personal communication Glen King, Environmental Manager - Kramer Junction SEGS).
Potential Breakdown Products:
A study with a pure culture inoculum showed that the metabolites of biphenyl degradation are 2,3-dihydro-2,3-dihydroxybiphenyl, alpha-hydroxy-beta-phenylmuconic semi-aldehyde, phenyl pyruvate and benzoic acid (4). Each of these compounds is more readily biodegraded than biphenyl and biological transformations are expected to occur intracellularly. Similar information is not available for diphenyl ether.
Toxicity (Complete Product) - Acute animal toxicity data
– Oral: LD50, rat, 2,050 mg/kg, No more than slightly toxic.
– Dermal: LD50, rabbit, > 5,010 mg/kg, practically nontoxic after skin application in animal studies.
– Inhalation: LC50, rat, 2.66 mg/l, 4 h, Toxic based on animal inhalation exposure studies.
– Skin irritation: rabbit, slightly irritating to skin - 24 hours.
– Repeat dose toxicity: (rat) inhalation, 13 weeks, Produced effects on body weight, serum enzymes and/or organ weights in repeat dose studies.

Beacon Solar Energy Project 55 June 2009
– Repeat dose toxicity: (rat) 26 weeks, produced effects on body weight, serum enzymes and/or organ weights in repeat dose studies. Effects only observed at very high dose levels. Target organs affected kidneys, liver, spleen.
– Repeat dose toxicity: (rat) diet, sub-chronic, repeated oral exposure produced liver and kidney changes in animal models. Target organs affected liver, kidneys.
– Developmental toxicity: (rat) No effects on offspring observed in laboratory animals in the presence of maternal toxicity (5).
Fate and Transport Information
- Biphenyl: Based on Koc values as high as 3,300(6), biphenyl is expected to have low to slight mobility in soil and adsorption to soil is expected to attenuate volatilization. Biphenyl is not expected to volatilize from dry soil surfaces (SRC) based upon a vapor pressure of 8.93X10⁻³ mm Hg(7). As previously discussed, biodegradation is the expected fate for biphenyl in soil.
- Diphenyl ether: An experimental Koc value of 1950(8) suggests that diphenyl ether will have low mobility in soil (9). Transport from terrestrial surfaces to air via evaporation (10) is expected to occur, attenuated by sorption to soil. The rate constant for the vapor phase reaction of diphenyl ether with photochemically produced hydroxyl radicals has been estimated to be 1.9X10⁻¹¹ cu cm/molecule-sec at 25 deg C which corresponds to an atmospheric half-life of about 20 hours (11).
References:
(1) "Handbook of Environmental Degradation Rates" Philip Hall Howard, Heather Taub Printup, CRC Press, 1991, ISBN 0873713583, 9780873713580, 725 pages.
(2) Fries GF, Marrow GS; Bull Environ Contam Toxicol 33: 6-12 (1984)
(3) Focht DD, Brunner W; Appl Environ Microbiol 50: 1058-63 (1985)
(4) Tucker ES et al; Bull Environ Contam Toxicol 14: 705-13 (1975)
(5) Solutia Material Safety Data Sheet (MSDS)
(6) Briggs GG; J Agric Food Chem 29: 1050-9 (1981)
(7) Southworth GR, Keller JL; Water Air Soil Pollut 28: 239-48 (1986)
(8) Burkhard LP et al; J Chem Eng Data 29: 248-50 (1984)
(9) Swann RL et al; Res Rev 85: 23 (1983)
(10) Bauer K et al; pp. 195 in Ullmann's Encyclopedia of Industrial Chemistry, NY: VCH Publishers. A11 (1988)
(11) Meylan WM, Howard PH; Chemosphere 26: 2293-9 (1993)
2. RWQCB Comment – Plot Plan
Lahontan Water Board staff apologizes that the January 12, 2009 letter specified that all figures should be 8.5 x 11 inches. Staff realizes that the features of a 2,000-acre site cannot be adequately portrayed at such a scale. Please include all figures at an appropriate scale and size. Also, staff could not locate the Assessor's Parcel Numbers or the parcel boundaries on Figure 2.

Beacon Solar Energy Project 56 June 2009
Response
These maps have been provided as part of the amended RoWD. In addition, a map showing the Assessor’s Parcel Numbers and the parcel boundaries will be provided.
3. Flood Protection
The Lahontan Water Board requested information on facility-wide flood protection. The January 12, 2009 letter stated "Provide a description of the measures that are taken for controlling stormwater runon and runoff at the facility." Much of the required information appears to be contained in the Applicant's Conceptual Drainage Study (Drainage Study), which was submitted to the California Energy Commission's (CEC). The CEC issued a Preliminary Staff Assessment (PSA) in April 2009 that included an evaluation of the Drainage Study. Based on the PSA, offsite stormwater, under current conditions, flows across the site via Pine Tree Creek and small drainage swales. As proposed, the BSEP project would alter historic stormwater flow paths and change runoff patterns from the property. Site development would include an onsite stormwater collection system that would discharge the majority of runoff directly into a rerouted Pine Tree Creek. The PSA concluded that runoff from the site as well as potential nuisance flows or discharges of hazardous substances from plant operation and maintenance would cause significant impacts to the receiving waters. The PSA also raised concern regarding the retention basin design and location.
Lahontan Water Board staff concurs with the CEC's concerns regarding stormwater as expressed in the PSA and concurs with the relevant conditions listed in the Soil and Water Resources section of the PSA Additionally, the PSA discusses the proposed design for rerouting the Pine Tree Creek. The PSA concludes that the design of the rerouted channel is inadequate for flood control and for reproducing the hydrologic and hydromorphic functions of the creek. Based on the Public Meeting held in California City on April 14, 2009, Lahontan Water Board staff understands that the design for the rerouted creek is currently being modified. This information must be submitted with a subsequent revision or amendment to the Revised RoWD.
Response:
In response to CEC, hydrology and hydraulic studies were commissioned to review Pine Tree Creek (upstream of the Project site and its rerouted path through the Project site) and the onsite stormwater requirements which included the removal of the detention basin, and addition of retention basins, in line with the Kern Country requirements. This amendment to the RoWD provides an overview of the stormwater on site and revised Figure 12 presents it schematically. The project refinement document that accompanied the RoWD amendment provides extensive information on the modeling undertaken and the revised stormwater design. The revised 100 year stormwater flows will be confined within the rerouted Pine Tree Creek, and the solar fields have been removed from the flood plain to prevent interaction (refer to revised Figure 3).
In addition, there will be a spill prevention, control and countermeasure (SPCC) plan on site which will address hazardous waste discharge and preventative measures to ensure there is no impact to the downstream waterways (refer to Section 13.4 of the RoWD). Detailed design of the channel and detention basins will address the other Kern County requirements listed in the PSA.
4. Civil Engineering Design Package
The Lahontan Water Board's January 12, 2009 letter instructed the Applicant to include a Plan of Development/Civil Engineering Design Package in the Revised RoWD. The plan/package was to include grading, clearing, excavation, and stormwater management system plans. The intent of this comment was for a facility-wide plan. This information was not provided in the Revised RoWD.

Beacon Solar Energy Project 57 June 2009
Response
A conference call was held on January 30, 2009 to review the comments provided to the draft RoWD (May 19, 2008) received on January 12, 2009. During the call it was noted by the RWQCB (Joe Koutsky) that a full facility-wide set of Development/Civil Engineering Design Package was NOT required for the response to the January 12, 20098 comments. The response to comments and revision to the RoWD followed the agreed upon detail pertinent to the evaporation ponds and LTU. The relevant portion of the meeting minutes is provided below.
C. Timeline required for Civil Engineering Design
Mike Tietze stated that the RoWD incorporated conceptual grading plans and civil design for evaporation ponds and LTUs. BSEP is still undergoing detailed design and if the RWQCB requires detailed design drawings now it would take about 2-3 months and they may need to be revised later upon the request of the CEC. The level of design for the RoWD is the same conceptual level of design as that submitted for the SAA being used as the dredge and fill permit application.
Joe stated that the RWQCB does not expect a detailed grading plan for the entire BSEP site. At a minimum the following would be needed for civil design:
Site surface hydrology and stormwater runoff
Precipitation and climactic data used for stormwater runoff calculations
Site topography
Narrative and graphic information must be adequate to show that the LTU and ponds are protected from inundation. All figures must be 8.5 by 11 inches.
WP response stated that they could provide updated grading and drainage plans for LTU and evaporation ponds per the above requirements. However WP cannot make these revisions by the February 10 deadline. Joe stated that a placeholder can be provided in February 10 response and updated design drawing and grading plan for LTU’s and evaporation ponds can be provided by March 2. March 2 date will allow two weeks during 30 day PSA review for upper level RWQCB review.
Joe stated that if CEC has comments changing pond design, the re-design can be dealt with during the FSA process.
5. Design Report and Operations Plan
a. The Revised RoWD proposed three double-lined evaporation ponds with a nominal surface area of 40 acres. The purpose of multiple ponds was to allow plant operations to continue in the event that one of the ponds would need to be taken out of service. Each pond would be designed to have enough surface area so that the evaporation rate exceeds the process wastewater and cooling tower blowdown rate at peak design conditions and at annual average conditions. However, the PSA concluded that to contain the expected flows, the impoundments would have to have a total area of at least 43.5 acres. Also, according to the PSA, the applicant would construct another pond (in addition to those three proposed to hold wastewater) to be used for dilution of potentially toxic salinity concentrations in the evaporation ponds. With this additional pond, the nominal evaporation pond surface area would be on the order of 58 acres. The fourth pond was not included in the Revised RoWD. The accurate size, number, and uses must be included in the RoWD.

Beacon Solar Energy Project 58 June 2009
Response
As outlined in the amendment to the RoWD, evaporation pond have been reduced in size to 8 acres (based on the upper limit TDS from offsite Koehn Lake groundwater). The project refinement document that accompanied the RoWD amendment provides information on the evaporation pond modeling also. The revised calculation uses a Class ‘A’ pan evaporation rate, which is converted to pond evaporation rate (53 inches per year) by factoring in the precipitation, lake factor (0.7) and salinity factor (0.7). The salinity factor is the industry standard for a saturated brine. The evaporation pond design presented in the March 18 RoWD and the revised amended design proposed to use three ponds during operation, which will allow the flexibility for BSEP to operate all three ponds or fewer as needed. There was no intention to have a fourth pond.
b. The January 12, 2009 letter requested a "description of the manner in which liquid and solid wastes (wastewater and soil) are handled and disposed..." The Revised RoWD implies that that wastewater (classified as a designated waste) used for dust control will be part of the wastewater management. The volumes, sources and application rates of this wastewater intended for dust control was not provided. A Facilities Operation Dust Control Plan (mentioned in Appendix G) must be submitted in the RoWD for the RoWD to be properly evaluated by Water Board staff.
Response
Using wastewater for dust suppression is not proposed as part of the normal operating dust control procedure. It has been included in Section 4.1 of Appendix G (Detection Monitoring Plan) of the RoWD as a contingency plan during emergency pond repair or in the event of an extreme drought to reduce the use of well water, however in both cases, approval is required by the RWQCB before it is undertaken.
As outlined in Section 11.4 of the RoWD, an Operations Dust Control Plan will be prepared to manage fugitive dust emissions in compliance with CCR Title 27, Section 21600(b)(8)(D). This has been included in the PSA as condition AQ-SC7.
Additional Deficiencies
In addition to the comments conveyed previously, Lahontan Water Board staff noted additional deficiencies in the Revised RoWD as described in the following text.
1. Heat Transfer Fluid Spills
The Revised RoWD states that HTF spills will be identified by daily inspections. The Revised RoWD does not describe how HTF spills will be identified, i.e., are these spills apparent based on visual inspection or will the use of a detection instrument be used? The Revised RoWD states that releases of more than 25 gallons of HTF fluid will be reported to the Lahontan Water Board. How will the quantity of the release be estimated? What are the emergency response plans in the event of rupture on the Western Garlock fault strand, which bisects the site? Such an event could result in releases from containment structures and piping.
Response
Spills will be identified by the following methods:
- Visual Inspections: Visual and olfactory senses will be used to detect HTF leaks in the solar array loops. This practice has been in place for many years at similar facilities, including the Kramer Junction SEGS. Operations will involve regular (at least once a day) walk-downs and
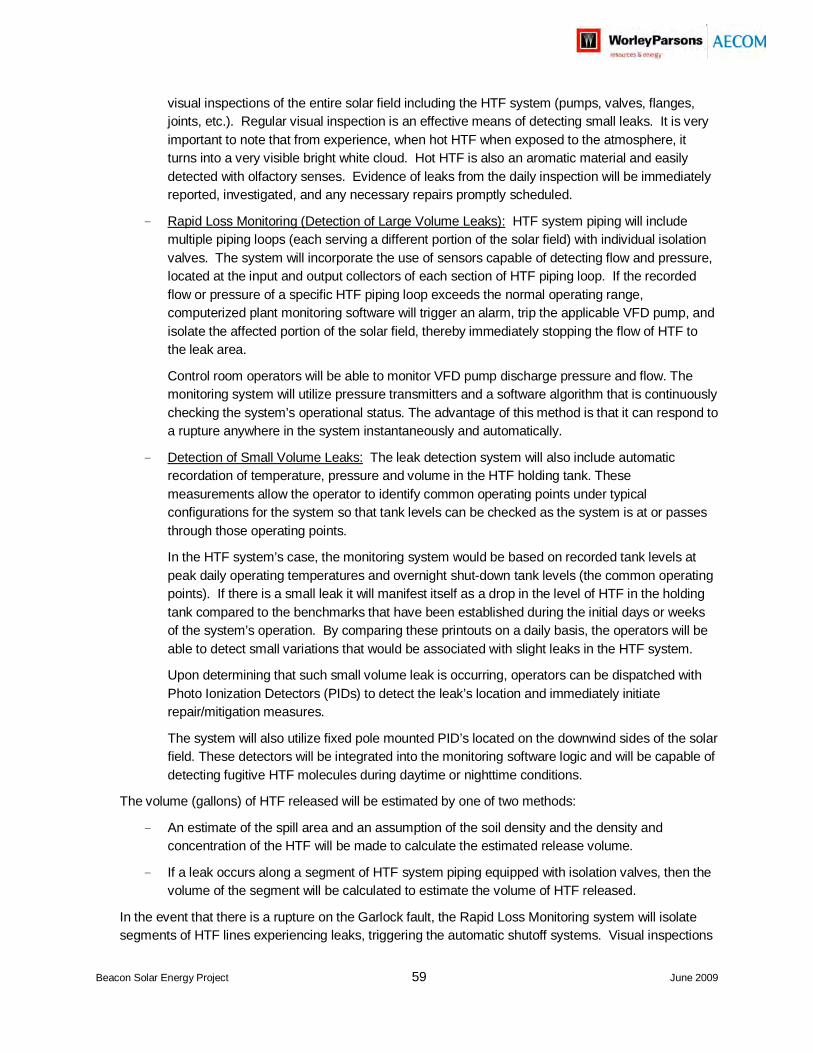
Beacon Solar Energy Project 59 June 2009
visual inspections of the entire solar field including the HTF system (pumps, valves, flanges, joints, etc.). Regular visual inspection is an effective means of detecting small leaks. It is very important to note that from experience, when hot HTF when exposed to the atmosphere, it turns into a very visible bright white cloud. Hot HTF is also an aromatic material and easily detected with olfactory senses. Evidence of leaks from the daily inspection will be immediately reported, investigated, and any necessary repairs promptly scheduled.
- Rapid Loss Monitoring (Detection of Large Volume Leaks): HTF system piping will include multiple piping loops (each serving a different portion of the solar field) with individual isolation valves. The system will incorporate the use of sensors capable of detecting flow and pressure, located at the input and output collectors of each section of HTF piping loop. If the recorded flow or pressure of a specific HTF piping loop exceeds the normal operating range, computerized plant monitoring software will trigger an alarm, trip the applicable VFD pump, and isolate the affected portion of the solar field, thereby immediately stopping the flow of HTF to the leak area.
Control room operators will be able to monitor VFD pump discharge pressure and flow. The monitoring system will utilize pressure transmitters and a software algorithm that is continuously checking the system’s operational status. The advantage of this method is that it can respond to a rupture anywhere in the system instantaneously and automatically.
- Detection of Small Volume Leaks: The leak detection system will also include automatic recordation of temperature, pressure and volume in the HTF holding tank. These measurements allow the operator to identify common operating points under typical configurations for the system so that tank levels can be checked as the system is at or passes through those operating points.
In the HTF system’s case, the monitoring system would be based on recorded tank levels at peak daily operating temperatures and overnight shut-down tank levels (the common operating points). If there is a small leak it will manifest itself as a drop in the level of HTF in the holding tank compared to the benchmarks that have been established during the initial days or weeks of the system’s operation. By comparing these printouts on a daily basis, the operators will be able to detect small variations that would be associated with slight leaks in the HTF system.
Upon determining that such small volume leak is occurring, operators can be dispatched with Photo Ionization Detectors (PIDs) to detect the leak’s location and immediately initiate repair/mitigation measures.
The system will also utilize fixed pole mounted PID’s located on the downwind sides of the solar field. These detectors will be integrated into the monitoring software logic and will be capable of detecting fugitive HTF molecules during daytime or nighttime conditions.
The volume (gallons) of HTF released will be estimated by one of two methods:
- An estimate of the spill area and an assumption of the soil density and the density and concentration of the HTF will be made to calculate the estimated release volume.
- If a leak occurs along a segment of HTF system piping equipped with isolation valves, then the volume of the segment will be calculated to estimate the volume of HTF released.
In the event that there is a rupture on the Garlock fault, the Rapid Loss Monitoring system will isolate segments of HTF lines experiencing leaks, triggering the automatic shutoff systems. Visual inspections

Beacon Solar Energy Project 60 June 2009
would be conducted following the event and procedures outlined in the Spill Prevention, Control and Countermeasure (SPCC) plan would be followed. The SPCC plan will be prepared prior to operation and construction of the facility.
2. HTF Spill Staging Area
Describe the staging area where HTF contaminated soils will be temporarily stored. Specifically, where will the staging area be located, what is its size, what are the design specifications for the underlying liner, will the staging area be bermed, will there be secondary containment, and how will runoff from the staging area be controlled?
Response
The location of the staging area in the land farm unit is shown on Figure 3 (General Arrangement Site Plan) in the RoWD. The staging area is within the land farm unit therefore refer to Figure 11 (Land Treatment Unit) and Section 7.4 in the RoWD for the liner system and berm designs and construction process and Section 8.0 of the RoWD for the construction specifications.
As outlined in Section 4.2 of the RoWD, impacted soils will be placed on plastic sheeting and covered with plastic sheeting pending receipt of analytical results. Covering of the stockpiles serves two main purposes; dust control and preventing contact with rainwater.
As outlined in Section 9.2.1, storm water within the land treatment unit will either evaporate, infiltrate, or pumped to the evaporation ponds if free from HTF project, sheen or other evidence of contamination. However the storm water would not have come into contact with the staging area HTF-impacted soils due to the plastic sheeting.
3. Regional Geology in the Area of the Project Site
The legend for Figure 5 is incomplete. Please include a legend for the geologic units.
Response
As requested, a legend for the geologic units shown in Figure 5, Regional Geology in the Area of the Project site is attached.
4. State Water Resources Control Board (State Water Board) Resolution 75-58
The Applicant is proposing the use of high quality groundwater for power plant construction and power plant cooling. State Water Board Resolution 75-58, Water Quality Control Policy on the Use and Disposal of Inland Waters Used for Power Plant Cooling states that fresh inland waters should only be used for power plant cooling if other sources of water or other methods of cooling would be environmentally undesirable or economically unsound. The Revised RoWD does not demonstrate that accessing and using a source of lower quality water is environmentally undesirable or economically unsound. An evaluation of the use of lower quality must be submitted to the Lahontan Water Board. Response
Response
Evaluations of environmental and economic feasibility of accessing alternative water supplies were provided in the Application for Certification (March 8, 2008), subsequent data response submittals to the California Energy Commission (CEC), and in Beacon’s comments on the Preliminary Staff Assessment (PSA), submitted to the CEC May 1, 2009 (see the “Alternatives” section). In the PSA, Staff identified seven potential alternatives that might reduce the Project’s need for potable groundwater, including dry cooling, photovoltaic solar technology, and use of lower quality water supplies from off-site sources. As noted in Beacon’s comments on the PSA, neither dry cooling nor photovoltaic solar technology are economically
Beacon Solar Energy Project 61 June 2009
viable at this site. With respect to the acquisition of low quality water, two potential supply alternatives are currently being considered, but it has not yet been determined that they are feasible alternatives, within the meaning of that term as defined in the CEC’s 2003 Integrated Energy Policy Report (cross-referencing State Water Board Resolution 75-58). One alternative under consideration is to draw water from the area around Koehn Lake, where limited historical data shows the groundwater may have higher total dissolved solids (TDS) levels than the groundwater found in the wells on the BSEP plant site. However, a sampling of wells and pumping data in the area has yet to be conducted, and other considerations such as subterranean aquifer features and the need for a 7-9 mile pipeline may affect the ultimate feasibility of this option. The other alternative is to obtain tertiary treated reclaimed water from the Rosamond Wastewater Treatment Plant, approximately 40 miles from the BSEP plant site. Preliminary discussions with Rosamond officials have been initiated; however, given the distance of this source from the plant site (necessitating a 40 mile pipeline) and the potential concerns associated with transferring water from a basin that is currently in overdraft (Antelope Valley) to a basin that is in recovery, it remains to be seen whether this will ultimately be environmentally, socially, and economically feasible. Each of these alternatives is presented in the amended RoWD, along with Beacon’s original proposal to utilize onsite groundwater.
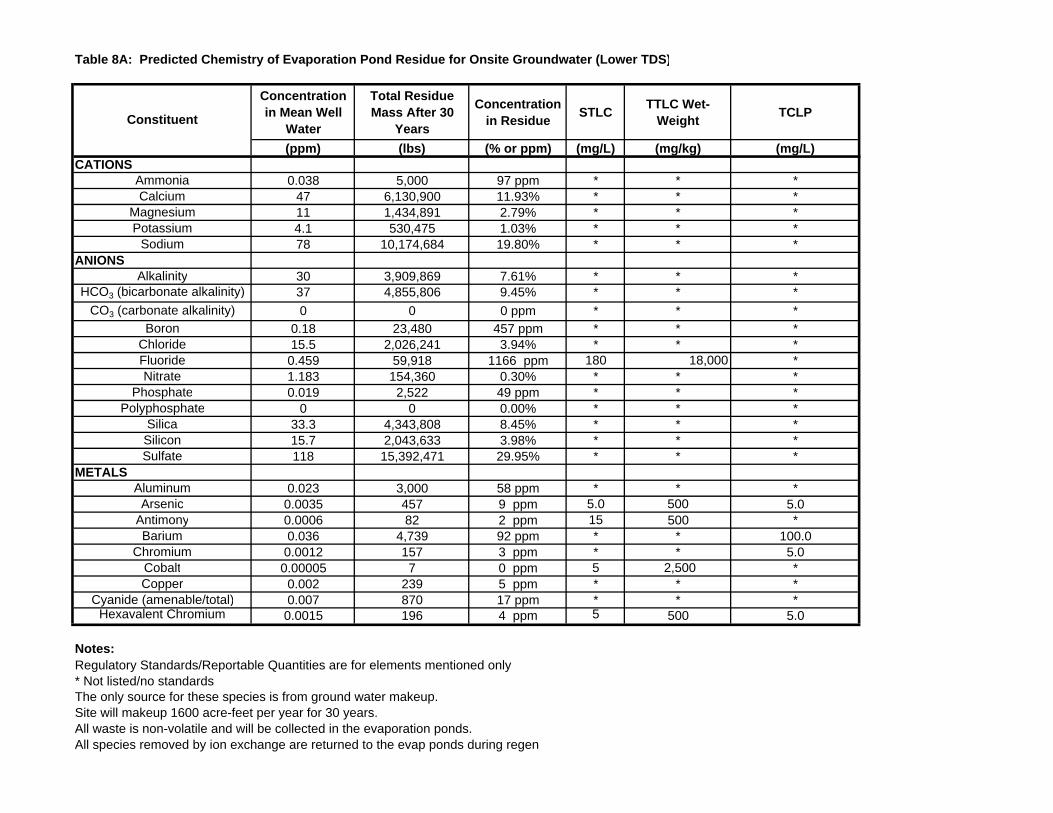
Table 8A: Predicted Chemistry of Evaporation Pond Residue for Onsite Groundwater (Lower TDS)
Concentration in Mean Well
Water
Total Residue Mass After 30
Years
Concentration in Residue
STLC TTLC Wet-
Weight TCLP
(ppm) (lbs) (% or ppm) (mg/L) (mg/kg) (mg/L)CATIONS
Ammonia 0.038 5,000 97 ppm * * *Calcium 47 6,130,900 11.93% * * *
Magnesium 11 1,434,891 2.79% * * *Potassium 4.1 530,475 1.03% * * *
Sodium 78 10,174,684 19.80% * * *ANIONS
Alkalinity 30 3,909,869 7.61% * * *HCO3 (bicarbonate alkalinity) 37 4,855,806 9.45% * * *
CO3 (carbonate alkalinity) 0 0 0 ppm * * *Boron 0.18 23,480 457 ppm * * *
Chloride 15.5 2,026,241 3.94% * * *Fluoride 0.459 59,918 1166 ppm 180 18,000 *Nitrate 1.183 154,360 0.30% * * *
Phosphate 0.019 2,522 49 ppm * * *Polyphosphate 0 0 0.00% * * *
Silica 33.3 4,343,808 8.45% * * *Silicon 15.7 2,043,633 3.98% * * *Sulfate 118 15,392,471 29.95% * * *
METALSAluminum 0.023 3,000 58 ppm * * *
Arsenic 0.0035 457 9 ppm 5.0 500 5.0Antimony 0.0006 82 2 ppm 15 500 *Barium 0.036 4,739 92 ppm * * 100.0
Chromium 0.0012 157 3 ppm * * 5.0Cobalt 0.00005 7 0 ppm 5 2,500 *Copper 0.002 239 5 ppm * * *
Cyanide (amenable/total) 0.007 870 17 ppm * * *Hexavalent Chromium 0.0015 196 4 ppm 5 500 5.0
Notes:Regulatory Standards/Reportable Quantities are for elements mentioned only* Not listed/no standardsThe only source for these species is from ground water makeup. Site will makeup 1600 acre-feet per year for 30 years. All waste is non-volatile and will be collected in the evaporation ponds.All species removed by ion exchange are returned to the evap ponds during regen
Constituent

Table 8B: Predicated Chemistry of Evaporation Pond Residue for Offsite Groundwater (Upper TDS)
Total Residue Mass After 30 Years
(lbs)CATIONS
Calcium 69 9,000,682Magnesium 9.9 1,291,402
Sodium 510 66,526,783Potassium 6.3 821,801
ANIONSBoron 30 3,913,340
Chloride 250 32,611,168Fluoride 9.3 1,213,135
Silica 33 4,304,674METALS
Iron 0.01 1,304
Notes:Regulatory Standards/Reportable Quantities are for elements mentioned only* Not listed/no standards1. A comparison to STLC / TTLC or TCLP is not possible as there is significant data gaps. 2. The list of constituents only includes parameters that there were mean well water data for. A completed waste stream
stream evaluation should be undertaken when additional raw water constituents are known3. The only source for these species is from ground water makeup. 4. Site will makeup 1600 acre-feet per year for 30 years. 5. All waste is non-volatile and will be collected in the evaporation ponds.6. All species removed by ion exchange are returned to the evap ponds during regen
ConstituentConcentration Used in
Water Balance (Well 30S37E13CO1M)
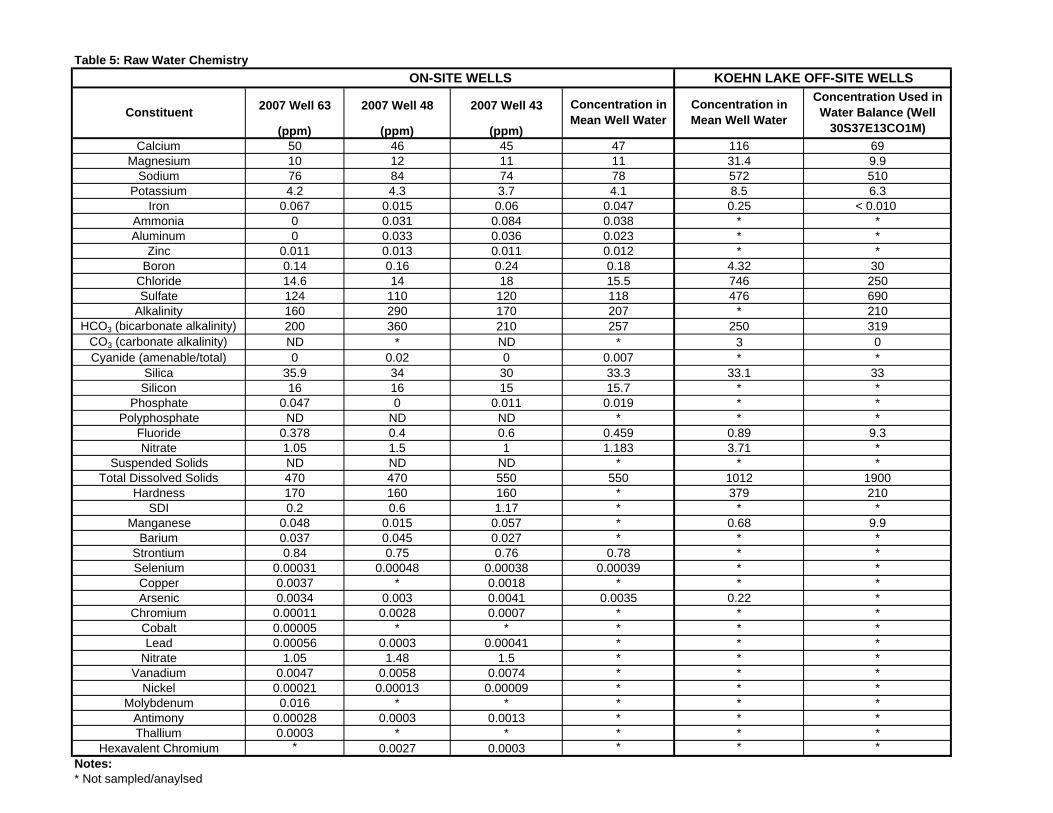
Table 5: Raw Water Chemistry
2007 Well 63 2007 Well 48 2007 Well 43
(ppm) (ppm) (ppm)Calcium 50 46 45 47 116 69
Magnesium 10 12 11 11 31.4 9.9Sodium 76 84 74 78 572 510
Potassium 4.2 4.3 3.7 4.1 8.5 6.3Iron 0.067 0.015 0.06 0.047 0.25 < 0.010
Ammonia 0 0.031 0.084 0.038 * *Aluminum 0 0.033 0.036 0.023 * *
Zinc 0.011 0.013 0.011 0.012 * *Boron 0.14 0.16 0.24 0.18 4.32 30
Chloride 14.6 14 18 15.5 746 250Sulfate 124 110 120 118 476 690
Alkalinity 160 290 170 207 * 210HCO3 (bicarbonate alkalinity) 200 360 210 257 250 319
CO3 (carbonate alkalinity) ND * ND * 3 0Cyanide (amenable/total) 0 0.02 0 0.007 * *
Silica 35.9 34 30 33.3 33.1 33Silicon 16 16 15 15.7 * *
Phosphate 0.047 0 0.011 0.019 * *Polyphosphate ND ND ND * * *
Fluoride 0.378 0.4 0.6 0.459 0.89 9.3Nitrate 1.05 1.5 1 1.183 3.71 *
Suspended Solids ND ND ND * * *Total Dissolved Solids 470 470 550 550 1012 1900
Hardness 170 160 160 * 379 210SDI 0.2 0.6 1.17 * * *
Manganese 0.048 0.015 0.057 * 0.68 9.9Barium 0.037 0.045 0.027 * * *
Strontium 0.84 0.75 0.76 0.78 * *Selenium 0.00031 0.00048 0.00038 0.00039 * *Copper 0.0037 * 0.0018 * * *Arsenic 0.0034 0.003 0.0041 0.0035 0.22 *
Chromium 0.00011 0.0028 0.0007 * * *Cobalt 0.00005 * * * * *Lead 0.00056 0.0003 0.00041 * * *
Nitrate 1.05 1.48 1.5 * * *Vanadium 0.0047 0.0058 0.0074 * * *
Nickel 0.00021 0.00013 0.00009 * * *Molybdenum 0.016 * * * * *
Antimony 0.00028 0.0003 0.0013 * * *Thallium 0.0003 * * * * *
Hexavalent Chromium * 0.0027 0.0003 * * *
Notes:* Not sampled/anaylsed
KOEHN LAKE OFF-SITE WELLS
Concentration Used in Water Balance (Well
30S37E13CO1M)Constituent
Concentration in Mean Well Water
ON-SITE WELLS
Concentration in Mean Well Water

Beacon Solar Energy Project 64 June 2009
ATTACHMENT A
Response to Comments Regional Water Quality Control Board – Lahontan Region
Comments dated May 14, 2009 to the California Energy Commission Preliminary Staff Assessment
for the Beacon Solar Energy Project, Fremont Valley, Kern County, California
The following responses address each of Lahontan Regional Water Quality Control Board (RWQCB) received the California Energy Commission’s Preliminary Staff Assessment (PSA) for Beacon Solar Energy Project (Project). The California Energy Commission (Energy Commission) requested that Lahontan Water Board staff review the portions of the PSA relevant to the Lahontan Water Board’s authority.
Comment 1: General Comment Regarding Waters of the United States and Waters of the State
In a February 5, 2008 letter, the U.S. Army Corps of Engineers (USACE) determined that the ephemeral drainages on the site are not waters of the United States. The USACE stated the basis for this non-federal jurisdiction determination was because the waters did not meet the requirements of Code of Federal Regulations 33 parts 328.3(a)(3)(iii) and 328.2(a)(1).
The PSA contains numerous references to the National Pollutant Discharge Elimination System (NPDES) permits and concludes that storm water will be adequately regulated through the Applicant’s enrollment under the State Water Resources Control Board’s (State Water Board) NPDES general permits No. CAS000002 (Construction General Permit) and No. CAS000001 (Industrial General Permit). The PSA also states that activities in stream beds will be permitted in accordance with Federal Clean Water Act (CWA) sections 404 and 401. Since the USACE has determined there are no waters of the United States on the site, these federal permits do not apply to this Project.
The drainages affected by the Project are waters of the State, as defined by California Water Code (Water Code) section 13050, and are subject to State requirements in accordance with Water Code section 13260. Therefore, the requirements for construction and industrial storm water management will be issued in the form of proposed Waste Discharge Requirements (WDRs) that will be incorporated in the Energy Commission's certification process. The PSA should be revised to reflect the proposed WDRs, which Lahontan Water Board staff is currently drafting for this Project. The PSA should eliminate references to the CWA permitting process for non-federal jurisdiction waters. Soil and Water conditions 2 through 5 must be revised to reflect the WDR requirements under development by Lahontan Water Board staff.
Response
In discussion with the Lahontan RWQCB on June 9th 2009, it is understood that Federal 401, 402, and 404 permits are not required for the proposed project because the project does not discharge to or have onsite waters of the U.S. Although the RWQCB’s have often used 402 NPDES program general permits to manage storm water from construction projects and facilities that do not discharge to Waters of the U.S., these permits are not enforceable for locations that do not discharge to Waters of the U.S. Therefore, the RWQCB must consider the use of Waste Discharge Requirements (WDRs) to implement and enforce storm water management practices for these sites and meet compliance with the Porter Cologne Water Quality Act for discharges to waters of the State. The applicant and CEC understand the regulatory framework, and based on meetings with the RWQCB, understand that for this project, storm water management and compliance with the Porter Cologne Water Quality Act will be accomplished by using the fundamental processes identified under the NPDES program (i.e.,

Beacon Solar Energy Project 65 June 2009
Construction and Industrial SWPPPs) and Porter Cologne Act and that WDRs will be prepared and submitted to the CEC for inclusion in the CEC permit as Conditions of Certification. No separate Report of Waste Discharge or associated permit with WDRs will be issued by the RWQCB that would require separate compliance tracking with the RWQCB for storm water management.
Comment 2: General Comment for Clarity
Several portions of the PSA state that estimates or assumptions used in an evaluation are "conservative." However, it is not always clear what the word "conservative" implies. For clarity, the text should explicitly state why the estimate is conservative, e.g., the estimate reflects assumptions that result in a value that is large relative to the range of possible values.
Response
Searching the soil and water resources section of the PSA, the word conservative is used on page 4.9-15 in discussion of surface soil types and their relationship to construction water demand for dust suppression and on page 4.9-16 in the discussion of seasonal water usage demand.
In the case of the discussion of dust suppression and construction water requirements, staff used a value of 15% for silt content that was double the value used by Beacon (7.5%) in the calculation of water for dust control. The notion of using a value double the value used in the AFC was termed conservative as it was significantly higher than used in AFC calculations.
In the case of seasonal water demand, the word conservative was applied since the estimate demand values did not consider period of shutdown (i.e., water usage was estimate assuming operation without interruption for the entire year). As such, what was used to evaluate water resource requirements is higher than would likely be required and the word conservative was applied.
In future documents, an explanation will be provided to justify the application of the word “conservative” to estimates of project impacts.
Comment 3: Executive Summary, Energy Commission’s “In Lieu” Permitting Process
Please change "Lohantan" to "Lahontan" in the last line of Page 1-1.
Response
All references to “Lohantan” or other variations of spelling, if present, will be changed to correctly reflect “Lahontan”.
Comment 4: Project Location and Project Description
Pages 1-2 and 3-2 of the PSA state that the section of the Garlock fault that bisects the site is expressed as an elevation change of up to 10 feet. The Geologic Hazards and Resources section of the PSA and the Application for Certification (AFC) describe the fault escarpment as between 15 and 25 feet high. The Soil and Water Resources section of the PSA describes the escarpment as 20 feet. The document should be revised for consistency and cite appropriate supporting documentation. See Comment 5, which describes Lahontan Water Board staff's concerns regarding potential water quality impacts related to the Garlock fault.
Response
The preliminary Geotechnical/Geologic Constraints Evaluation by Kleinfelder (September 21, 2007, pg. 15) states, “An approximate 15 to 25 foot northeast trending eroded escarpment trends through the middle of the site. This escarpment coincides with the mapped trace of the Cantil Valley Fault”.
Beacon Solar Energy Project 66 June 2009
In the future, consistency in citing the escarpment height will reflect the observations reported in the Kleinfelder (September 21, 2007) Geotechnical/Geological Constraints Evaluation.
Comment 5: Hazardous Materials Management, Seismic Issues
This section concludes that hazardous material storage tanks would not fail as a result of an earthquake. It is not clear if the seismic evaluation addresses both ground shaking and fault rupture on the Garlock fault, which bisects the site. The text should be revised to specify whether the seismic evaluation included both ground shaking and fault rupture.
Additionally, the discussion of the seismic evaluation does not consider the numerous pipelines containing heat transfer fluid. In accordance with Water Code section 13173, heat transfer fluid would be defined as a designated waste if it were released to the environment. Since leaks are expected under normal (static) conditions, it is likely that even minor ground shaking could result in significant leakage throughout the Project area. If this section of the Garlock fault were subject to even a small displacement, all the pipelines crossing the fault would likely fail and result in a massive release of heat transfer fluid. These possible releases could cause significant impacts to the environment and waters of the State. What preventative measures and/or emergency response actions would be in place to deal with a seismically induced failure of the pipelines?
Response
Ground shaking and ground rupture were considered as part of the Geotechnical/Geologic Constraints evaluation for the project. The power island and related tanks and structures are located beyond the Kern County Seismic Hazard Zone and outside the State Alquist-Priolo Special Studies area that are associated with the Cantil Valley Fault (also known as the west strand of the Garlock Fault). All tanks and related structures will be designed in accordance with the CBC to withstand design level seismic forces.
The solar arrays cross the fault. As described in detail in the response to RWQCB April 17 comments, isolation valves will be designed into the solar array HTF piping system to limit the release of HTF in the event of a catastrophic failure from fault rupture. HTF system piping will include multiple piping loops (each serving a different portion of the solar field) with individual isolation valves. The system will incorporate the use of sensors capable of detecting flow and pressure, located at the input and output collectors of each section of HTF piping loop. If the recorded flow or pressure of a specific HTF piping loop exceeds the normal operating range, computerized plant monitoring software will trigger an alarm, trip the applicable VFD pump, and isolate the affected portion of the solar field, thereby immediately stopping the flow of HTF to the leak area.
Comment 6: Impacts to Groundwater
The groundwater resources of the Antelope Valley are in the process of being adjudicated. The groundwater modeling discussed in this section, assumes a flow rate of 1,000 acre-feet per year from the Antelope Valley groundwater basin to the Fremont Valley groundwater basin. Was this adjudication process considered in the evaluation of groundwater impacts and water balance analysis?
Response
The adjudication process was not considered in the water balance and assumptions of flux from the Antelope Valley to the Fremont Valley. Any adjudication of the Antelope Valley would need to consider flux into the Fremont Valley, and communities within the Fremont Valley Groundwater Basin would have

Beacon Solar Energy Project 67 June 2009
a significant interest in maintaining the flux, as in some instances, water flux from the Antelope Valley is a significant component of recharge to Fremont Valley sub-basins.
The groundwater model was recently revised to respond to PSA comments, one being the amount of groundwater flux from the Antelope Valley from the California City sub-basin to the Koehn Lake sub-basin. The groundwater model originally assumed 1,000 AFY of recharge into the Koehn Lake sub-basin from the California City sub-basin. The PSA indicated that this amount of recharge might be too high suggesting a flux of 200 AFY citing recent groundwater assessments in the Antelope Valley. The numerical groundwater model was revised, and the flux from the California City sub-basin was calibrated to 200 AFY. The numerical modeling predictive results from project pumping did not significantly change from this modification (May 2009).
Comment 7: Construction Wastewater
The discussion of construction waste water streams on page 4.9-29 appears to be incomplete. The only waste water stream discussed is a one-time hydrostatic testing of pipelines and pressure vessels. Please evaluate construction activities to determine if all waste streams have been identified, e.g., vehicle wash down.
Response
Wastewater generated during construction will include hydrostatic testing, vehicle wash down, moisture from steam blow operations, and contact storm water. Each of these wastewater streams will be addressed in the final SWPPP, which will be available for LRWQCB review and comment prior to start of construction. BMPs for operations phase activities that have the potential to impact storm water will be implemented to meet the objectives of the Porter Cologne Water Quality Act and NPDES programs such that water quality is protected to the maximum extent practicable. BMPs are expected to include source control, site design, and treatment control BMPs.
Comment 8: Construction Wastewater
This section states that "discharge of any waste water during construction would be required to comply with applicable Basin-wide waste discharge regulations adopted by the LRWQCB." The reference to "Basin-wide" WDRs is unclear. If there are specific WDRs that are applicable to these discharges, they should be included in the Laws, Ordinances, Regulations, and Standards (LORS) for Soil and Water.
As noted in Comment 1, State Water Board's Construction General Permit does not apply at this site and Lahontan Water Board staff is drafting facility-specific WDRs for the Project. Some State Water Board or Lahontan Water Board general permits may apply to specific Project construction waste water, e.g., State Water Board's Statewide General WDRs for Discharges to Land With A Low Threat to Water Quality (Order No. 2003-0003-DWQ). This general permit includes various low-threat and low-volume discharges, such as discharges from well development and hydrostatic pipe test water. Please note, because the Project includes a very extensive piping system, the discharge volume for hydrostatic pipe testing could be relatively high. In a case of a high volume discharge, this general permit would not apply. Also, see Comments 1, '12, and 13.
Response
See response to Comment No. 1.

Beacon Solar Energy Project 68 June 2009
Comment 9: Operation Wastewater
The Applicant submitted a draft Report of Waste Discharge (RoWD) to the Lahontan Water Board on May 21, 2008. In a January 12, 2009 letter, Lahontan Water Board staff stated the draft RoWD was incomplete and outlined its deficiencies. The Applicant submitted a revised draft RoWD on March 23, 2009 and Lahontan Water Board staff responded in an April 17,2009 letter (Attachment 1) stating that the revised draft RoWD did not supply all previously requested information. To date, the Applicant has not responded to staff's April 17,2009 letter. Therefore, the WDRs for the evaporation ponds and surface treatment units have not been developed.
Please note, that the final WDRs will contain specific requirements regarding measures to protect water quality, including the installation of additional monitoring wells rather than using existing water supply wells for detection monitoring purposes. The existing supply wells are not screened properly to be used as monitoring wells. In addition there must be an adequate number of monitoring wells downgradient of each land disposal unit and adequate background monitoring wells.
Response
Please see the response to April 17, 2009 comments above as regards the initial comment regarding responding to comments to the March 18 RoWD.
Regarding the use of existing water supply wells to monitor groundwater quality within the upper portion of the aquifer, Beacon believes that these wells should be considered and evaluated as to their sufficiency as monitoring wells prior to the installation of a new monitor well. The following provides the rationale and a proposed approach to determine if these wells should be considered.
Project Water Supply and Associated Hydrodynamic Conditions
The Project proposes to use groundwater that will be pumped primarily from wells No. 63 and 49, with backup supply coming from wells No. 41 and 42. Well No. 63 is centrally located within the evaporation ponds and land treatment unit (LTU) (see revised detection monitoring program). The groundwater extraction rates from these wells will vary seasonally from about 100 gallons per minute (gpm) during the winter time to a peak of about 4,000 gpm during the summer months. Numerical groundwater modeling shows that a cone of depression will develop to a depth of about 30 feet from the pumping of well No. 63 (see Section 5.17-3 in the AFC and Appendix J-2). Under this condition, groundwater flow will be greatly influenced in the area of the evaporation ponds and LTU, with strong horizontal and vertical flow vectors toward the pumping well. Given the cone of depression that will develop and the change to ambient groundwater flow the pumping well will serve as the down-gradient point of compliance. Further, wells located in a radial fashion about the pumping well should serve as background wells.
At this time, alternative offsite sources of water supply are being considered. Should an offsite source be selected, there will be no onsite groundwater pumping and ambient groundwater flow will not be altered. Under this circumstance groundwater flows to the east-northeast toward Koehn Lake.
Groundwater Sampling Program
The groundwater monitoring program proposes to use a low-flow sampling approach to collect groundwater samples within these wells. Low-flow sampling techniques are widely accepted and standardized methods have been published by several sources including ASTM, the U.S. Environmental Protection Agency and the U.S. Army Corps of Engineers.
Sampling with using a low-flow program has been shown to represent groundwater over the screen interval with pumping influence preferentially drawing water with the higher conductivity materials across

Beacon Solar Energy Project 69 June 2009
from the screen. The United States Environmental Protection Agency (USEPA) recommends that low flow sampling be conducted in wells with short screen intervals generally about 10 feet in length or less. In wells with long screen intervals (i.e., generally those with screens longer than 20 feet or more), ambient groundwater flow has been shown in some cases, to flow preferentially through the well casing migrating in from deeper portions of the screen and exiting at shallow intervals.
Proposed Evaluation of Water Supply Wells as Monitor Wells
The collocation of new monitor wells installed adjacent to the evaporation ponds and LTU and existing water supply wells Nos. 44B, 45B and 49 might be used to evaluate the adequacy of water supply wells use as monitor wells for the Project. A stepwise analysis of the former water supply wells is proposed to determine their adequacy as monitor wells.
Install the three groundwater monitor wells as shown in the revised detection monitoring plan. Complete the wells with short screen intervals and in consideration of the project water supply (i.e., if onsite pumping is proposed extend the screens accordingly to account for projected drawdown).
Conduct a video survey of all the water supply wells to determine well condition and their screen interval. Consider water supply wells for use as monitor wells only if the screen interval extends above the static groundwater level. Those wells that are screened below the water table will not be consider for further evaluation as monitor wells. Rehabilitate (develop) those wells with screen intervals above the water table and that have been designated as potential monitor wells.
Perform a spinner test in those water supply wells proposed for monitoring purposes. Conduct the test to evaluate if the well is acting as a conduit for ambient flow exchange through the well from one part of the aquifer to another. Perform tests at 25 foot intervals below the top of water table to a depth of 100 feet below the water table.
Depending on the outcome of the video survey, if wells Nos. 44B, 45B and 49 have screen intervals above the water table, conduct a comparative study with the newly installed monitor wells to understand if the water supply wells can produce representative groundwater samples from the uppermost portion of the aquifer below the site. If none of the wells has a suitable screen interval the comparative study will not be conducted.
Collect samples using a variety of low-flow sampling techniques and analyze the groundwater samples for the same suite including pH, total dissolved solids, general minerals and dissolved metals. In all cases follow the standard operating procedures for low-flow sampling listed in the detection monitoring plan.
– Sample pump placed at a depth of 10 feet below the static water table;
– Sample pump placed at a depth of 10 feet below the static water table fitted with a packer set at 15 feet below the static water; and,
– Sample pump placed at a depth of 10 feet below the static water table fitted with a Spectra SamplerTM (QED flow equalization product for long-screen wells).
Compare the data to determine if the water supply wells can provide a representative sample from the upper portion of the aquifer below the site.

Beacon Solar Energy Project 70 June 2009
If the comparative results are similar consider those water supply wells with screen above the water table suitable for use as monitor wells. Implement the low-flow sampling technique that provided the best results by comparison to the monitor wells data.
If the comparative results are not similar consider sealing the lower portion of the well with a high solids bentonite grout to within 20 to 30 feet of the static water level and repeat the test procedure. If the wells do not produce comparative data, replace them with new monitor wells. Additionally, replace those former water supply wells that have been identified in the detection monitor program that are screen below the water table with new monitor wells.
Comment 10: Operation Wastewater
Section 4.0 of the revised draft RoWD (March 2009) confirms that the two primary sources of waste water (cooling tower blow down and ion exchange regeneration stream) and one occasional source (storm water accumulated in the Land Treatment Unit) are designated waste per the California Code of Regulations (CCR) Title 27 section 20210. Designated waste can only be discharged into appropriate waste management units; therefore, use of this waste water for dust control is prohibited.
Response
Comment noted. As provided in the RoWD amendment, waste water will not be used for dust control.
Comment 11: Soil Erosion Potential by Water and Wind During Construction
The first full paragraph on page 4.9-33 seems to imply that there is no historical record of precipitation or storm water runoff reaching the valley floor in the vicinity of the Project site. However, the AFC states the mean annual precipitation is approximately 6 inches and the 1OO-year flood plain bisects the site. Please revise this section for clarity and consistency with existing and historical conditions.
Response
Comment noted. The inference will be corrected in future submittals, as there is no misunderstanding that the site hydrology is critical in the design and operation of the project. The project refinement document provides a detailed assessment of the hydrologic conditions at the site, the civil design to control stormwater and the re-routing of Pine Tree Creek.
Comment 12: Soil Erosion Potential by Water and Wind During Construction
Lahontan Water Board staff does not agree with the stated conclusion on page 4.9-34, that the best management practices (BMPs) proposed in the draft Drainage, Erosion, and Sediment Control Plan/Storm Water Pollution Prevention Plan (DESCP/SWPPP) and Soil & Water Condition 2 are sufficient to prevent significant soil erosion by water during construction. Firstly, the draft DESCP/SWPPP states it is a preliminary document because the soils analysis has not been finalized and because the grading and drainage calculations are based on "conceptual" designs. Additionally, the DESCP/SWPPP does not contain BMPs or have a plan for containment of discharge runoff to adjacent properties. Therefore, Lahontan Water Board staff does not consider the draft DESCP/SWPPP adequate to protect against erosion by water during construction. Secondly, Soil & Water Condition 2 is not applicable because the Project cannot be permitted under the State Water Board's General Construction Permit. See Comment 1 regarding the proposed WDRs.
Response
The project is not required to complete the SWPPP/DESCP prior to permitting, but rather prior to project construction. The project has implemented design changes to reflect low-impact development (LID)
Beacon Solar Energy Project 71 June 2009
techniques, including onsite retention of the water quality storm event per the Kern County design standards. In addition, the project will implement a combination of source control, site design, and treatment control BMPs to manage storm water at the site during construction and operations. These BMPs will include erosion and sediment control practices.
Comment 13: Soil Erosion Potential by Water and Wind During Construction
The PSA does not address potential impacts to waters of the State by the construction of linear facilities (e.g., gas pipeline) outside of the Project site. Construction of linear features across waters of the State must be addressed by proposed WDRs that Lahontan Water Board staff is currently drafting. See Comment 1.
Response
No waters of the State or waters of the U.S. were identified along proposed linear facilities surveyed. No impacts to state or U.S. jurisdictional waters will be impacted by construction or operation of the linear features.
Comment 14: Soil Erosion Potential by Water and Wind During Construction
Lahontan Water Board staff does not agree that the draft DESCP/SWPPP and Soil & Water Condition 4 provide adequate protection against soil erosion by water during Project operation (see Comment 12). Additionally, Soil & Water Condition 4 is not appropriate because the Project cannot be permitted under the State Water Board's General Construction Permit (see Comment 1). Finally, the text should provide some information on the Compliance Project Manager, e.g., who does this manager represent, what is the manager's role and authority.
Response
See response to comment no. 12.
Comment 15: Construction Storm Water
See Comment 12 regarding the adequacy of DESCP/SWPPP and Soil & Water Condition 2. Lahontan Water Board staff does not agree that these measures are adequate or applicable for the protection of water quality.
Response
See response to comment no. 12.
Comment 16: Operation Storm Water
Lahontan Water Board staff concurs with the proposed revisions to the Conceptual Drainage Study listed on pages 4.9-37 and 4.9-38. Staff wishes to reinforce the PSA's recommendations that storm water conveyances must be designed so that they do not discharge directly to the proposed diversion channel and that all retention basins be located and designed for rapid infiltration of the storm water rather than evaporation. Staff also believes that the redesigned diversion channel must consider the information that will be generated by the recommended geomorphic assessment. Staff concurs with the recommendations and comments provided by the Energy Commission and California Department of Fish and Game on the redesigned diversion channel. Additionally, the Project must eliminate or mitigate losses of the ephemeral wash's natural functions and designated beneficial uses of "groundwater recharge" and "wildlife habitat."
Response
See response to comment no. 12.

Beacon Solar Energy Project 72 June 2009
Comment 17: Proposed Conditions of Certification, Soil & Water 5
The meaning of the last sentence of item "c." on page 4.9-5, is unclear. It appears to be an incomplete sentence.
Response
It is uncertain how to respond to this question as item “c” can not be found in the soil and water resources section.
Comment 18: Proposed Conditions of Certification, Soil & Water 5
The last sentence of item "1." on page 4.9-56 should be revised to specify that comments from the Lahontan Water Board will also be considered by the Compliance Project Manager.
Response
The compliance manager will adhere to conditions of certification as provided in the license. As these conditions will be derived from input and comments provided by the RWQCB, they will serve as the basis for environmental oversight of the project.
Alternatives
The following comment is on the Alternatives section of the PSA.
Comment 19: State Water Board Resolution 75-58, Water Quality Control Policy on the Use and Disposal of Inland Waters Used for Power Plant Cooling
The Applicant is proposing the use of high quality groundwater for power plant construction and power plant cooling. State Water Board's Water Quality Control Policy on the Use and Disposal of Inland Waters Used for Power Plant Cooling (Power Plant Cooling Policy, adopted by Resolution 75-58) states that fresh inland waters should only be used for power plant cooling if other sources of water or other methods of cooling would be environmentally undesirable or economically unsound. Based on the PSA alternative analysis, other methods of cooling and other sources of water are economically viable. No undesirable environmental impacts were identified for these cooling methods or sources of water. Therefore, the use of high quality groundwater "for power plant cooling would not be consistent with this State Water Board Policy. Please note that policies adopted by the State Water Board and approved by the Office of Administrative Law, such as the Power Plant Cooling Policy, have the weight of law.
Response
Evaluations of environmental and economic feasibility of accessing alternative water supplies were provided in the Application for Certification (March 8, 2008), subsequent data response submittals to the California Energy Commission (CEC), and in Beacon’s comments on the Preliminary Staff Assessment (PSA), submitted to the CEC May 1, 2009 (see the “Alternatives” section). In the PSA, Staff identified seven potential alternatives that might reduce the Project’s need for potable groundwater, including dry cooling, photovoltaic solar technology, and use of lower quality water supplies from off-site sources. As noted in Beacon’s comments on the PSA, neither dry cooling nor photovoltaic solar technology are economically viable at this site. With respect to the acquisition of low quality water, two potential supply alternatives are currently being considered, but it has not yet been determined that they are feasible alternatives, within the meaning of that term as defined in the CEC’s 2003 Integrated Energy Policy Report (cross-referencing State Water Board Resolution 75-58). One alternative under consideration is to draw water from the area around Koehn Lake, where limited historical data shows the groundwater may have higher total dissolved solids (TDS) levels than the groundwater found in the wells on the BSEP plant site. However, a sampling of wells
Beacon Solar Energy Project 73 June 2009
and pumping data in the area has yet to be conducted, and other considerations such as subterranean aquifer features and the need for a 7-9 mile pipeline may affect the ultimate feasibility of this option. The other alternative is to obtain tertiary treated reclaimed water from the Rosamond Wastewater Treatment Plant, approximately 40 miles from the BSEP plant site. Preliminary discussions with Rosamond officials have been initiated; however, given the distance of this source from the plant site (necessitating a 40 mile pipeline) and the potential concerns associated with transferring water from a basin that is currently in overdraft (Antelope Valley) to a basin that is in recovery, it remains to be seen whether this will ultimately be environmentally, socially, and economically feasible. Each of these alternatives is presented in the amended RoWD, along with Beacon’s original proposal to utilize onsite groundwater.
Laws, Ordinances, Regulations, and Standards
The following comments apply to the LORS tables of the Soils and Water and Waste Management sections of the PSA.
Comment 20: Soil & Water Table 1 and Waste Management Table 1
State Water Board policies are approved by the Office of Administrative Law and have the weight of law. Therefore, the policies should be included under "State LORS" rather than included with guidance.
Response
Beacon is uncertain as to the meaning of the term “weight of law.” As a general matter, only statutes that have been passed and codified by the legislature may be termed “law,” though regulations promulgated by an administrative agency that are within the scope and purpose of the authority delegated to that agency by the legislature are given great legal deference, similarly to ordinances adopted by a political municipality. (See i.e. Gov. Code § 11342.2.) As an administrative policy adopted by through resolution, however, whether or not approved by the Office of Administrative Law, it does not appear that the State Water Board’s Power Plant Cooling Policy 75-58, would be proper to include in the “State LORS” section as opposed to the guidance section.
Comment 21: State LORS for Soil and Water Resources and Waste Management: Porter-Cologne Water Quality Control Act (Water Code Sections 13000 et seq.)
Lahontan Water Board staff concurs with the inclusion of the Porter-Cologne Water Quality Control Act (Water Code sections 13000 et seq.) in the LORS for the PSA sections: Soils and Water and Waste Management. Although staff agrees that Water Code 13000 et seq. are applicable in entirety, the following highlight specific examples of applicable sections of the Water Code. (listing not provided - reference is made to the original submittal for the list of LORS that are recommended to be included)
Response
Comment noted.
Comment 22: State LORS for Soil and Water Resources and Waste Management: Additional State LORS
Neither LORS tables for the Soils and Water or Waste Management sections appear to be complete. The both PSA tables should be revised for consistency with the following tabulation of requirements and their descriptions. (listing not provided - reference is made to the original submittal for the list of LORS that are recommended to be included)
Comment noted. LORS will be revised in consideration of these recommendations in final staff assessment.