ats/ess 452: synoptic meteorology friday 2/8/2013 quiz & assignment 2 results finish thermal...
TRANSCRIPT

ATS/ESS 452: Synoptic MeteorologyFriday 2/8/2013
• Quiz & Assignment 2 Results• Finish Thermal Wind• MOS decoding (Assignment)• New England weather

dv/dx v is decreasing with increasing x (goes from positive to negative)
dv/dx < 0
du/dy u is increasing with increasing y (goes from negative to positive)
du/dy > 0
Vort = neg - posVort < 0Anti-cyclonic vorticity… clockwise rotation

Curvature Vorticity
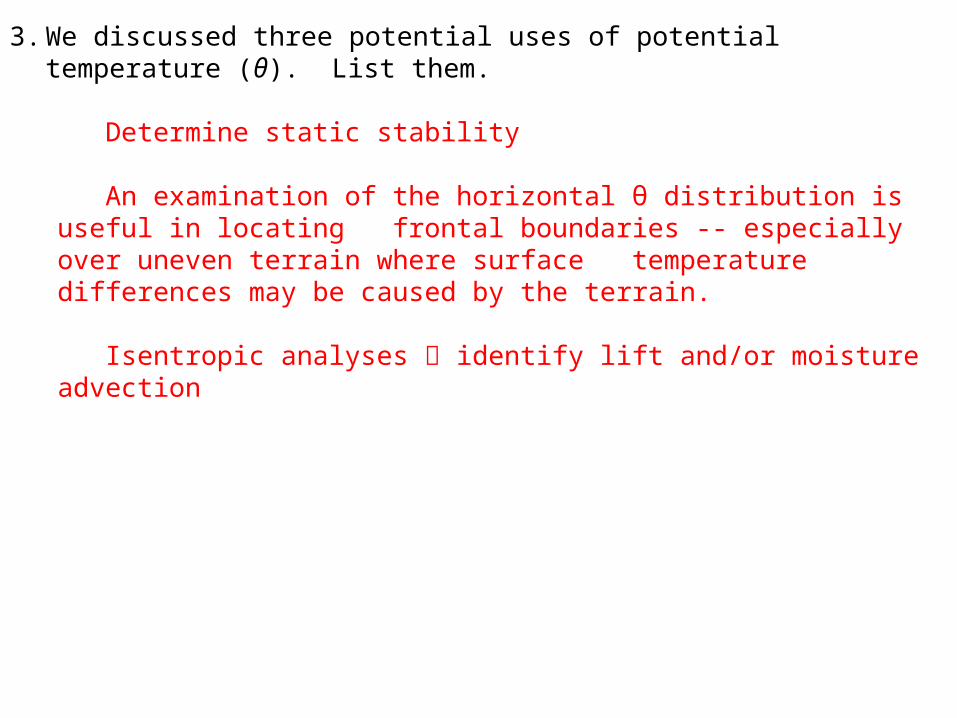
3. We discussed three potential uses of potential temperature (θ). List them.
Determine static stability
An examination of the horizontal θ distribution is useful in locating frontal boundaries -- especially over uneven terrain where surface temperature differences may be caused by the terrain.
Isentropic analyses identify lift and/or moisture advection

Quiz # Mean Max Min
Quiz 1(17 total points)
13 (76.5) 15 10
Quiz 2(15 total points)
9.4 (63) 11 7
Quiz 3(15 total points)
8.5 (57)12 (80) (scaled)
9 (12.5) 8 (11.5)

Mean Max Min
92.6(77%)
103 83
102(85%)
112.4 92.4
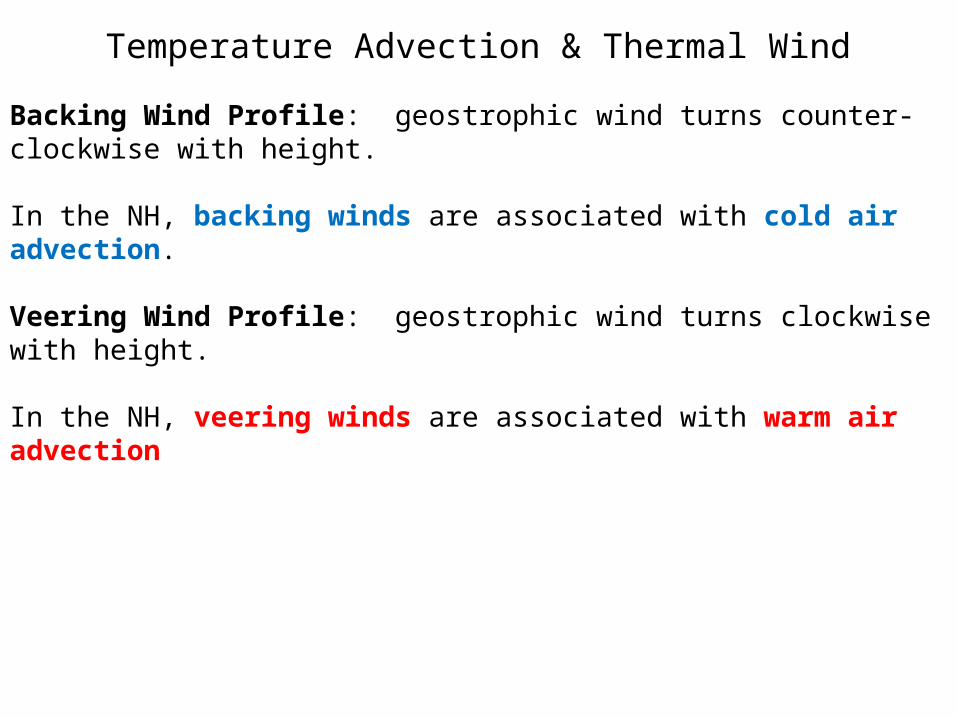
Temperature Advection & Thermal Wind
Backing Wind Profile: geostrophic wind turns counter-clockwise with height.
In the NH, backing winds are associated with cold air advection.
Veering Wind Profile: geostrophic wind turns clockwise with height.
In the NH, veering winds are associated with warm air advection


*BUT…
The link between veering/backing winds and thermal advection only applies to the GEOSTROPHIC wind
Why is this?

The actual wind can veer or back due to other mechanisms that may not be related to thermal advection
For example, in the PBL, friction can cause a departure from geostrophic balance. Notice below, that the inclusion of the friction has caused the sfc wind to blow towards the lower pressure.
The influence of friction diminishes with height, and the flow becomes more geostrophic
So in this example, how does the wind change with height? Implications?
Frictional Veering

GSO sounding from 00Z 25 August 2008
What is the wind profile doing here?
Clockwise with height
Veering Wind Profile
What type of thermal advection does this imply?
Warm Air Advection (WAA)
BUT… what can you say about the PBL?
It’s relatively deep
So this is likely frictional veering… no implications for WAA

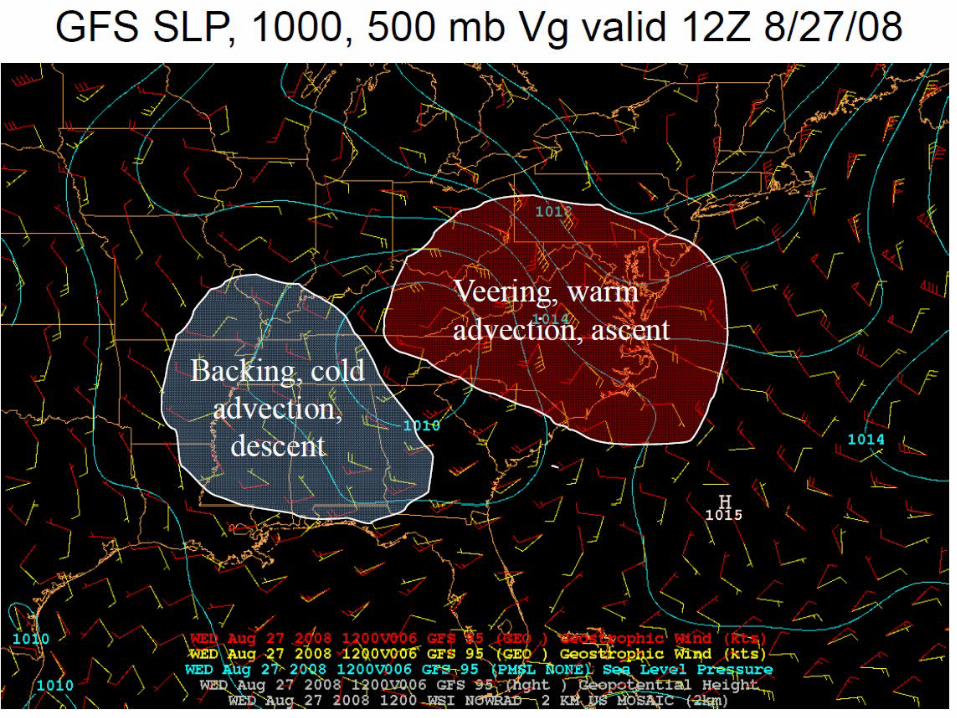
GSO sounding from 00Z 27 August 2008
What is the wind profile doing here?
Veering
What type of thermal advection does this imply?
WAA
How about the PBL?Shallow, so the
deep veering observed IS geostrophic veering.
WAA is likely occurring.
This is also consistent with the saturated atmospheric profile

MOS
• Model Output Statistics• The MOS technique develops relationship
equations from both observed and model forecast weather elements
• Produces statistical guidance for point locations throughout the model domain
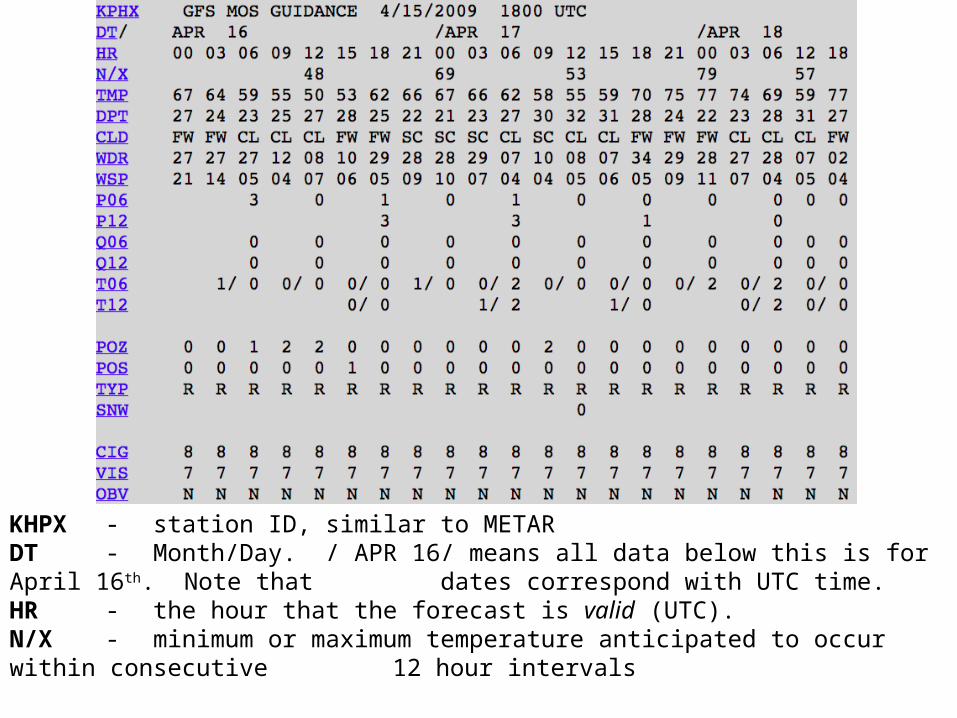
KHPX - station ID, similar to METARDT - Month/Day. / APR 16/ means all data below this is for April 16th. Note that dates correspond with UTC time.HR - the hour that the forecast is valid (UTC).N/X - minimum or maximum temperature anticipated to occur within consecutive 12 hour intervals
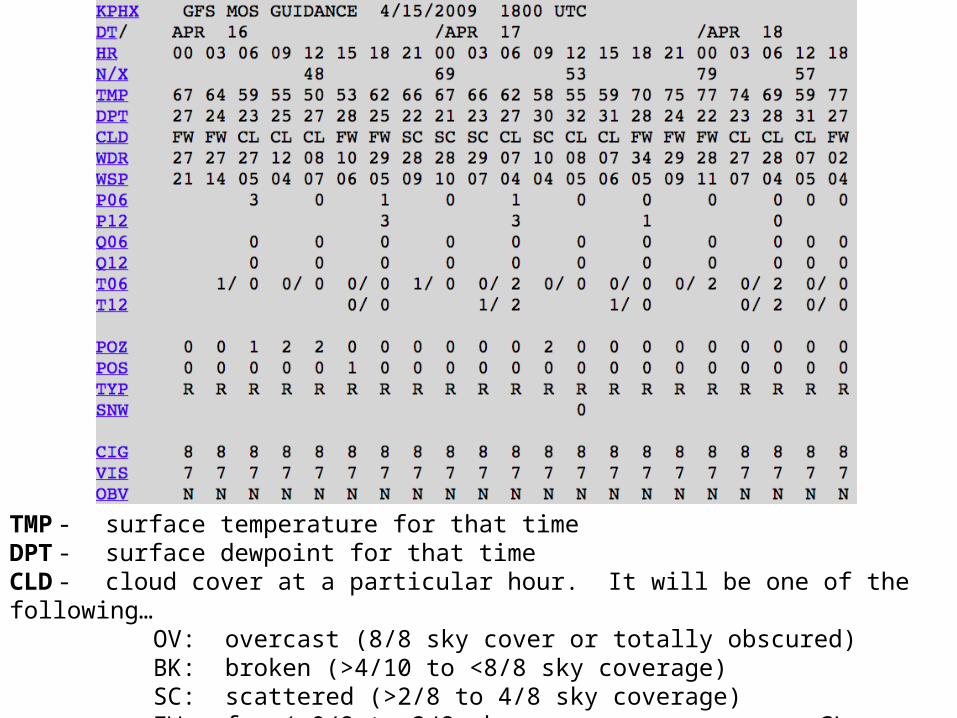
TMP - surface temperature for that timeDPT - surface dewpoint for that timeCLD - cloud cover at a particular hour. It will be one of the following…
OV: overcast (8/8 sky cover or totally obscured)BK: broken (>4/10 to <8/8 sky coverage)SC: scattered (>2/8 to 4/8 sky coverage)FW: few (>0/8 to 2/8 sky coverage or CL:
clear skies

WDR - the wind direction in degrees (0-350) at a height of 10-meters. Add a zero to the end of the number to get the wind directionWSP - the wind speed (at 10-meters) in knotsP06 - the probability of precipitation (PoP) for a 6-hr period ending at the specified time (ex: 65 = 65% chance of rain from 6 hours previous to this point)P12 - PoP for a 12-hr period ending at the specified time

Q06/Q12 - quantitative precipitation forecast (QPF) categories for liquid equivalent precipitation. This
means that snowfall is melted and a liquid equivalent is given. The format is “6 hour total (Q06) / 12 hour
total (Q12)” up to the time specified. The numbers will value 0-6 and are shown as follows:
0: No Precip 1: 0.01 to 0.09” 2: 0.10 to 0.24” 3: 0.25 to 0.49”4: 0.50 to 0.99” 5: 1.00 to 1.99” 6: > 2.00”

T06 - thunderstorm/conditional severe thunderstorm potential for a 6-hr period ending at time specified
ex: 56/65 suggests that there is a 56% chance of thunderstorms BUT a 65% chance that IF thunderstorms form, they will be severeT12 - same as above, but for 12-hr period ending at time specified
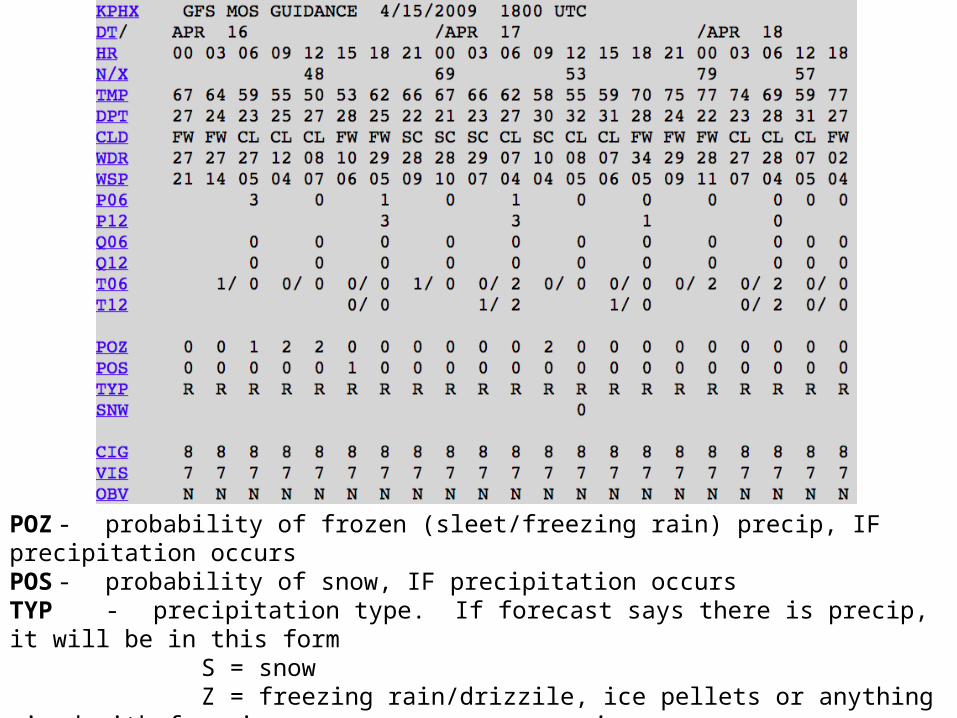
POZ - probability of frozen (sleet/freezing rain) precip, IF precipitation occursPOS - probability of snow, IF precipitation occursTYP - precipitation type. If forecast says there is precip, it will be in this form
S = snowZ = freezing rain/drizzile, ice pellets or anything
mixed with freezing precipR = rain/drizzle or rain mixed with snow
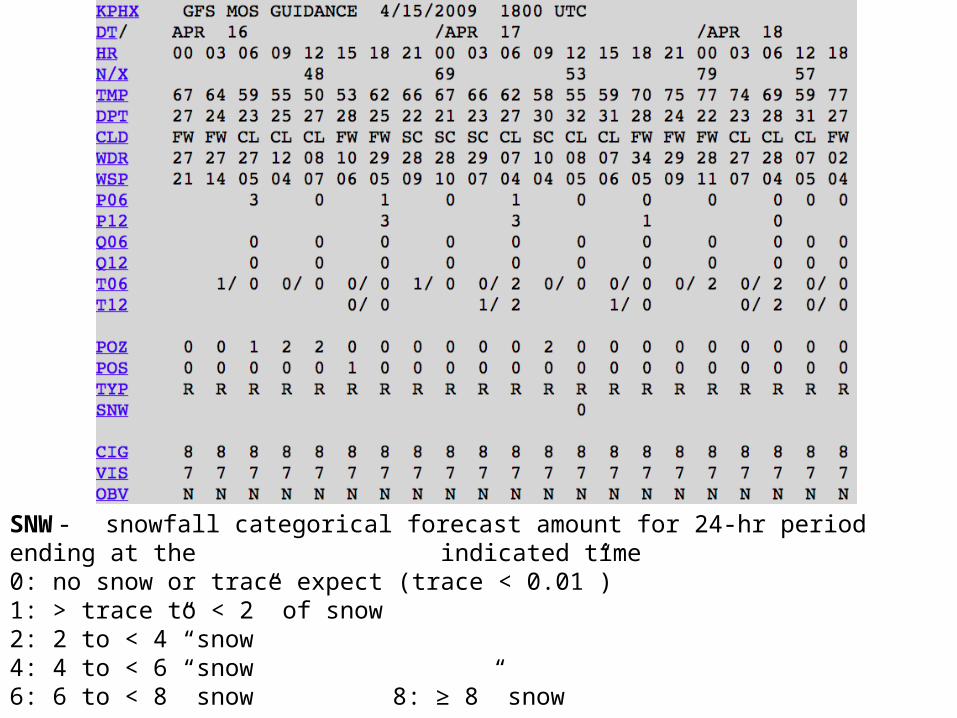
SNW - snowfall categorical forecast amount for 24-hr period ending at the indicated time
0: no snow or trace expect (trace < 0.01”)1: > trace to < 2” of snow2: 2 to < 4” snow4: 4 to < 6” snow6: 6 to < 8” snow 8: ≥ 8” snow

CIG - ceiling (lowest broken or overcast layer) height forecast1: < 200 ft 7: 6600-12,000 ft2: 200-400 ft 8: > 12,000 ft or unlimited ceiling3: 500-900 ft4: 1000-1900 ft5: 2000-3000 ft6: 3100-6500 ft
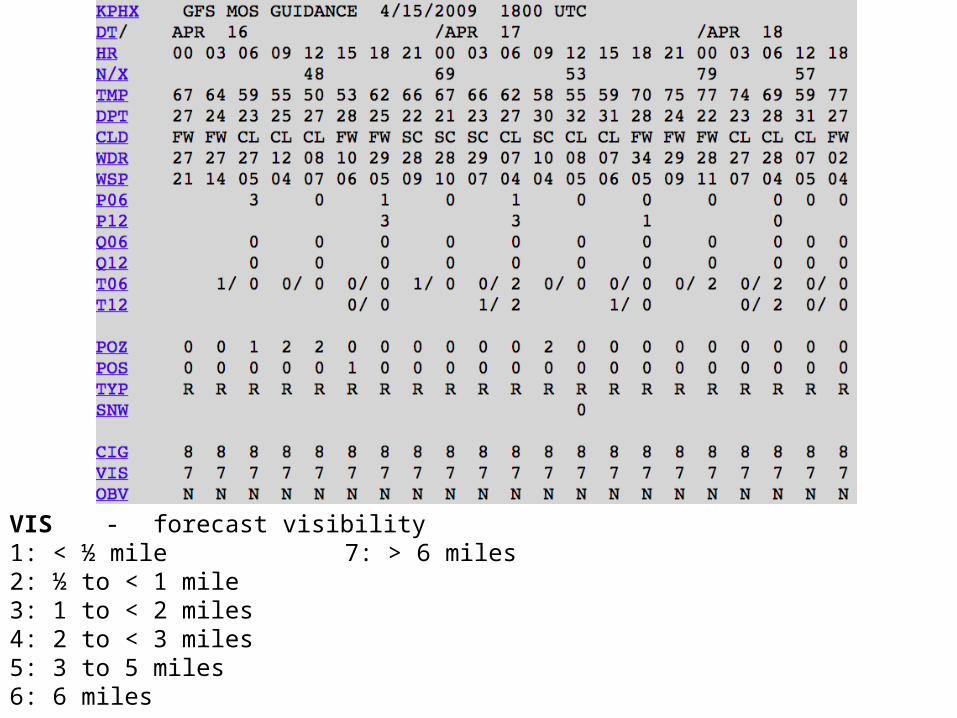
VIS - forecast visibility1: < ½ mile 7: > 6 miles2: ½ to < 1 mile3: 1 to < 2 miles4: 2 to < 3 miles5: 3 to 5 miles6: 6 miles
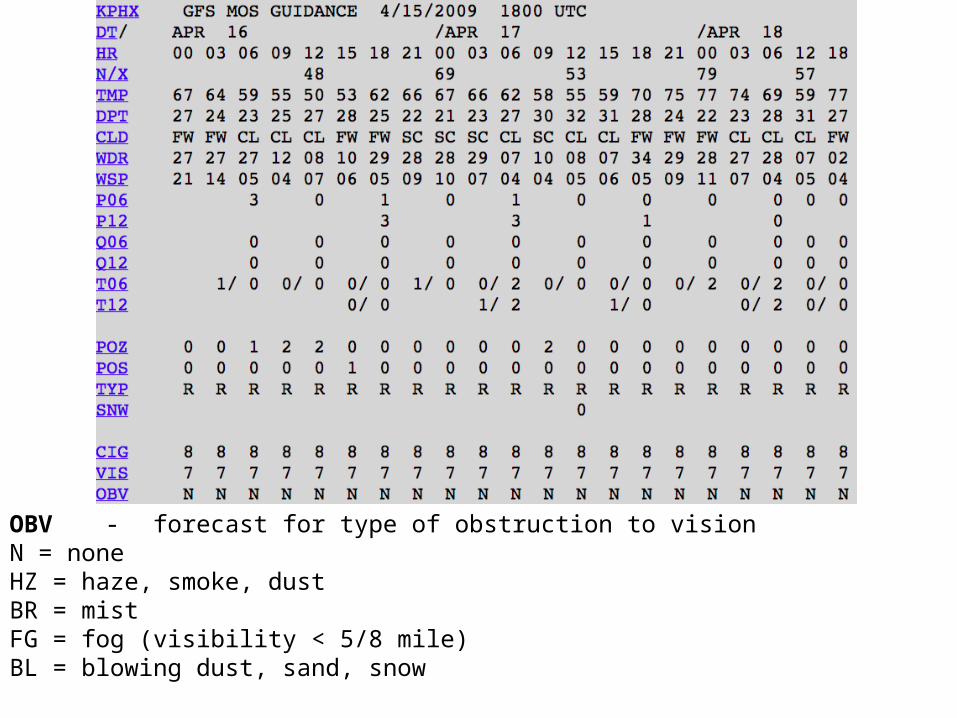
OBV - forecast for type of obstruction to visionN = noneHZ = haze, smoke, dustBR = mistFG = fog (visibility < 5/8 mile)BL = blowing dust, sand, snow