atp for the rhu - fccid.io · doc no: ap2000010-ver a02 page 1 of 22 atp for rhu atp for the rhu...
TRANSCRIPT
Doc No: AP2000010-Ver A02 Page 1 of 22 ATP FOR RHU
ATP
For The RHU
Proprietary Information
The information contained in this document is the sole property of MobileAccess. The Disclosure of this information does not constitute the release of any proprietary rights therein. Permission to reproduce this information or parts disclosed here in must be obtained in writing from MobileAccess.
Doc No: AP2000010-Ver A02 Page 2 of 22 ATP FOR RHU
Approvals: Name Signature Date Prepared Guy Becher 11/07/05 Checked Shay shimchon
Approved Yossi Gil Q.A. Shlomo Cohen
Description Rev. ECO Name Signature Date In ATP for RHU change Iden and SMR band to: Iden band: DL_851-869MHz , UL_806-824MHz SMR band: UL_896-901MHz
A02 C000739 Guy Becher
11/07/05
Doc No: AP2000010-Ver A02 Page 3 of 22 ATP FOR RHU
RHU TESTS ATP - RF Test Procedure
Table Of Contents 1 Scope3 2 Required Equipment.3 3 Block Diagram. 4 4 Setup 5 5 Mean Gain Target Values... 10 6 Spectrum Analyzer Setup12 7 FSK Setup Table..15 8 Laser Current Calibration16 9 Optical Power PDI...16 10 Antenna Connection..16 11 SPI Lines Test17 12 Software Verification17 13 Led Test.17 14 Current Test...17 15 General Network Tests..18 16 Downlink Mean Gain Adjustment Test.18 17 Port Unbalance. .18 18 Uplink Mean Gain Adjustment Test .18 19 Uplink AGC Test...19 20 Downlink Power Detector .19 21 NF Test. .20 22 IMD3 Test. 20 23 IIP3 Test 20 24 FSK Downlink Rejection. .21 25 FSK Uplink Carrier.. .21 26 FSK Modem. .21
Doc No: AP2000010-Ver A02 Page 4 of 22 ATP FOR RHU
1. Scope This document describes the ATP (Acceptance Test Procedure) to be performed for the RHU 1000 Dual Band
2. Required Equipment.
2.1. 1xHP8753C+ HP85046A Network Analyzer + S Parameters Set or equivalent. 2.2. 1xPower Supply. 2.3. 1xNetwork Printer/Plotter. 2.4. 2xHP8648B Signal Generator or equivalent. 2.5. 1xHP8594E Spectrum Analyzer or equivalent 2.6. 1x Multi-meter. 2.7. Terminators 50Ω SMA 2.8. Terminators 50Ω N-Type 2.9. Programming Plug
2.10. 2xFiber Optic cables 2.11. 1xLow noise amplifier (SMA) 2.12. 1xOptical Power Meter

Doc No: AP2000010-Ver A02 Page 5 of 22 ATP FOR RHU
3. Block Diagram
RF Front End
DCA_RHU_DL_NB_LOW5bit
PAD-3dB
PAD-3dB
PDET_RHU_DL_NB
UL_BBPWR
Uplink
Local PowerSupply
+7.5V +5V -5V
+(20-60) V
+3V
P.D ERA-2SM15dB AGB3303
PAD-3dB
Downlink
DCA_RHU_DL_NB_HIGH5bit
PAD-3dB PA High Band
PDET_RHU_UL_BB
LSR PAD -3dB
from 3rd Band(SMA)
SGA-4586
VCO ALCThresholds
On/Off
SGA-458624dB
SGA-458618dB
LNA
LNAN-Type
N-Type
N-Type
N-Type
FSK TX
FSK RX to 3rd Band(SMA)
ANT Sens.S1 S2 S3 S4
RFSPDT
PDET_RHU_DL_BB
DCA_RHU_UL_NB_LOW_AGC(3bit)
DCA_RHU_UL_NB_HIGH_ADJ(5bit)
DCA_RHU_UL_NB_LOW_ADJ(5bit)
PDET_RHU_UL_LOWPDET_RHU_UL_HIGH
Pout_RHU_DL_NB
Pin_RHU_DL_BB
Pin_RHU_UL_NB_HIGH
Pin_RHU_UL_NB_LOW
Pin_RHU_LSR
PADN.U
PowerSplitter
PA Low Band
W-LANSMA
3B HighSMA
4B LowSMA
AGB3302
SAW
SAW
CrossBand Dup. Cross Band
Card
AGB3302
AGB3302
PAD-13dB
PAD-10dB
AGB3303
AGB3303
AGB3303
1950MHz
SAW
SAW
CrossBandDup.
Cross BandCard
ANT's
Doc No: AP2000010-Ver A02 Page 6 of 22 ATP FOR RHU
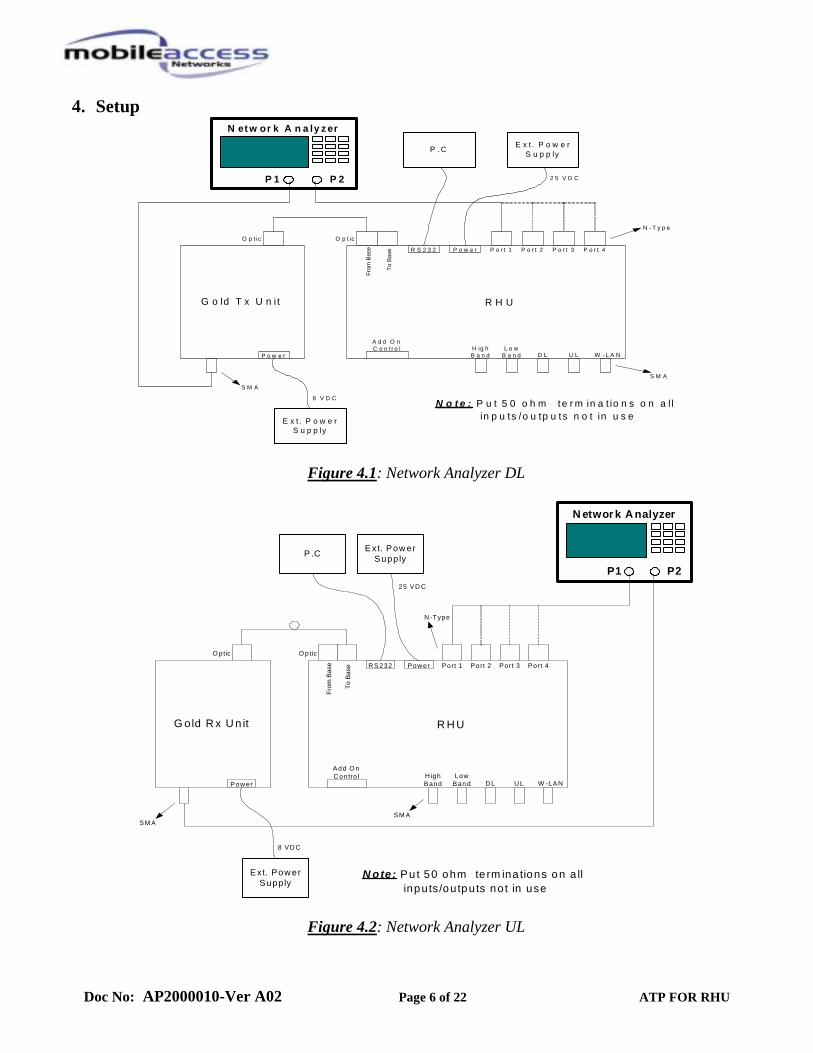
4. Setup
P o w e rR S 2 3 2 P o r t 4P o r t 3P o r t 2P o r t 1
O p t ic
To B
ase
From
Bas
e
W - L A NU LD LL o w
B a n dH ig hB a n d
A d d O nC o n t r o l
R H U
N e t w o r k A n a ly z e r
P 2P 1
S M A
N - T y p e
O p t ic
P o w e r
S M A
E x t . P o w e rS u p p lyP .C
E x t . P o w e rS u p p ly
G o ld T x U n i t
8 V D C
2 5 V D C
N o t e : P u t 5 0 o h m te r m in a t io n s o n a l lin p u ts /o u tp u ts n o t in u s e
Figure 4.1: Network Analyzer DL
Pow erR S232 Port 4Port 3Port 2Port 1
O ptic
To B
ase
From
Bas
e
W -LANU LD LLow
Ban dH ighBand
Add O nC ontro l
R H U
N etw ork A nalyzer
P2P1
SM A
N -Type
O ptic
P ow er
SM A
E xt. Pow erSupp lyP .C
Ext. Pow erSupp ly
G old R x U n it
8 VD C
25 VD C
N ote: Pu t 50 ohm te rm ina tions on a llinputs/outputs not in use
Figure 4.2: Network Analyzer UL
Doc No: AP2000010-Ver A02 Page 7 of 22 ATP FOR RHU
PowerRS232 Port 4Port 3Port 2Port 1
Optic
To B
ase
From
Bas
e
W-LANULDLLowBand
HighBand
Add OnControl
RHU
SMA
N-Type
Optic
Power
SMA
Ext. PowerSupplyP.C
Ext. PowerSupply
Gold Tx Unit
8 VDC
25 VDC
Note: Put 50 ohm terminations on allinputs/outputs not in use
SpectrumAnalyzer
SignalGenerator2
SignalGenerator1
PowerDivider
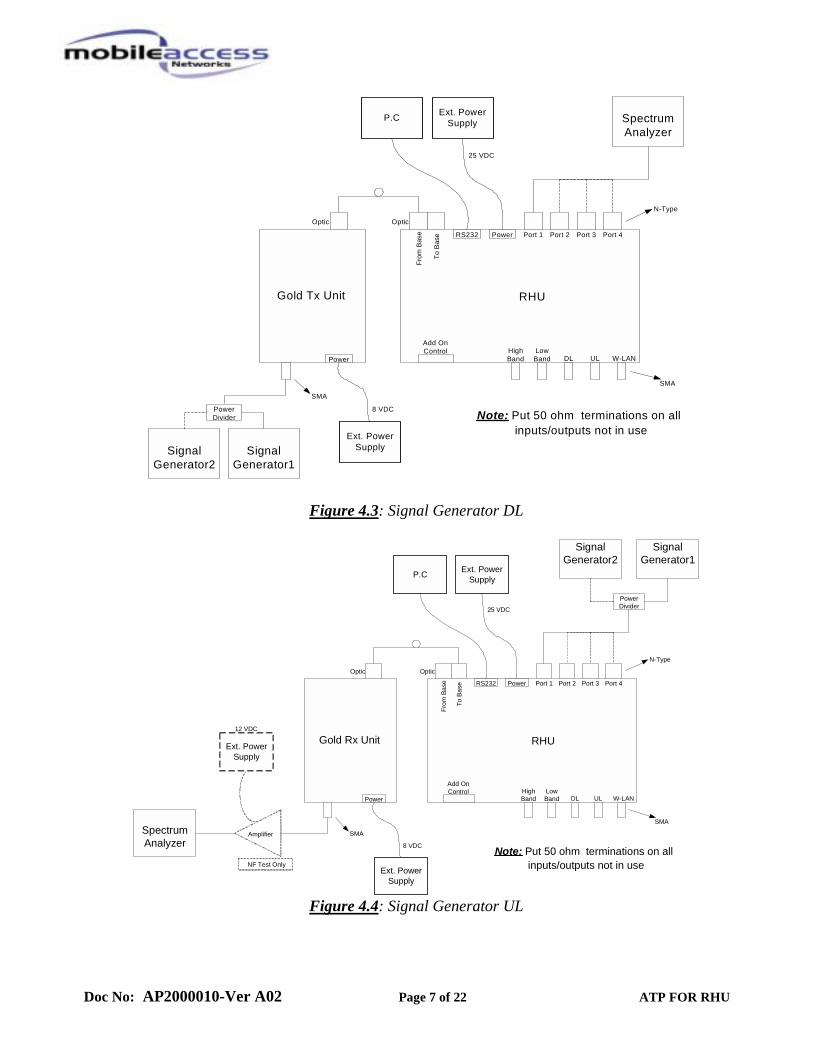
Figure 4.3: Signal Generator DL
PowerRS232 Port 4Port 3Port 2Port 1
Optic
To B
ase
From
Bas
e
W-LANULDLLowBand
HighBand
Add OnControl
RHU
SMA
N-Type
Optic
Power
SMA
Ext. PowerSupplyP.C
Ext. PowerSupply
Gold Rx Unit
8 VDC
25 VDC
Note: Put 50 ohm terminations on allinputs/outputs not in use
SignalGenerator1
SpectrumAnalyzer
SignalGenerator2
PowerDivider
Ext. PowerSupply
Amplifier
12 VDC
NF Test Only
Figure 4.4: Signal Generator UL
Doc No: AP2000010-Ver A02 Page 8 of 22 ATP FOR RHU
PowerRS232 Port 4Port 3Port 2Port 1
Optic
To B
ase
From
Bas
e
W-LANULDLLow
BandHighBand
Add OnControl
RHU Network Analyzer
P2P1
SMA
N-Type
Optic
Power
SMA
Ext. PowerSupplyP.C
Ext. PowerSupply
Gold Rx Unit
8 VDC
25 VDC
Note: Put 50 ohm terminations on allinputs/outputs not in use
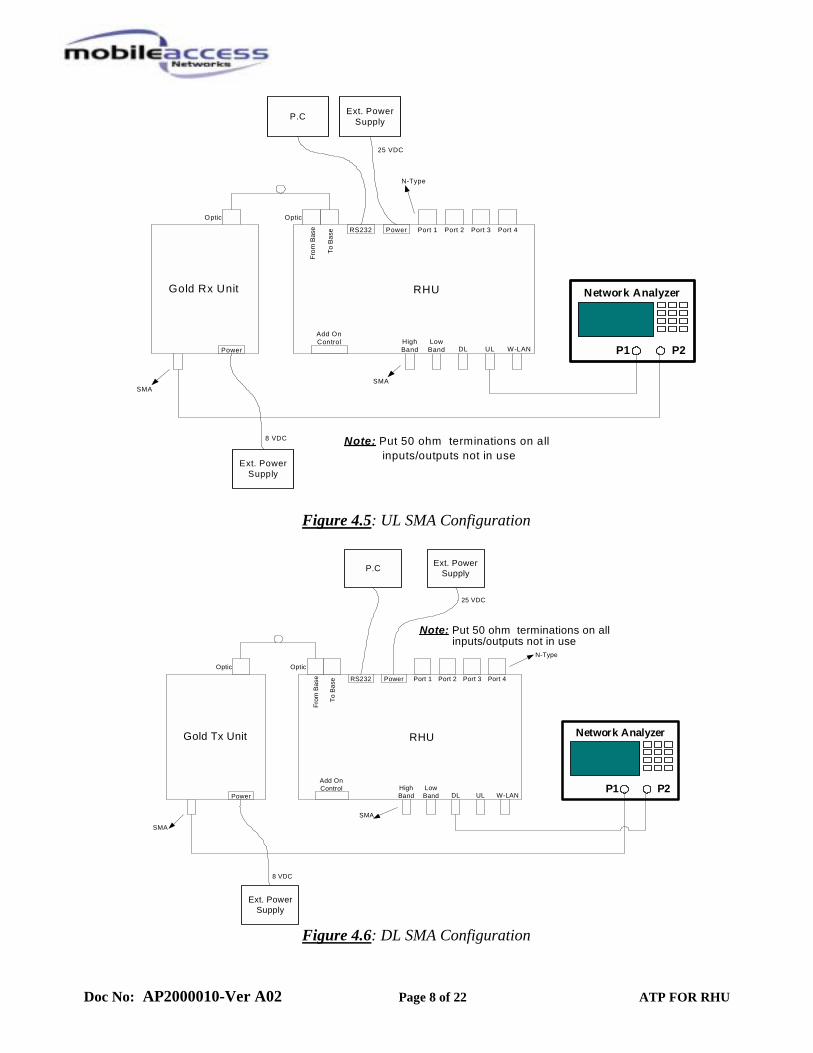
Figure 4.5: UL SMA Configuration
PowerRS232 Port 4Port 3Port 2Port 1
Optic
To B
ase
From
Bas
e
W-LANULDLLowBand
HighBand
Add OnControl
RHU Network Analyzer
P2P1
SMA
N-Type
Optic
Power
SMA
Ext. PowerSupplyP.C
Ext. PowerSupply
Gold Tx Unit
8 VDC
25 VDC
Note: Put 50 ohm terminations on allinputs/outputs not in use
Figure 4.6: DL SMA Configuration
Doc No: AP2000010-Ver A02 Page 9 of 22 ATP FOR RHU
PowerRS232 Port 4Port 3Port 2Port 1
To B
ase
From
Bas
e
W-LANULDLLowBand
HighBand
Add OnControl
RHU
Network Analyzer
P2P1
SMA
N-Type
Ext. PowerSupplyP.C
25 VDC
Note: Put 50 ohm terminations on allinputs/outputs not in use
Note: Cover Opticalconnectors
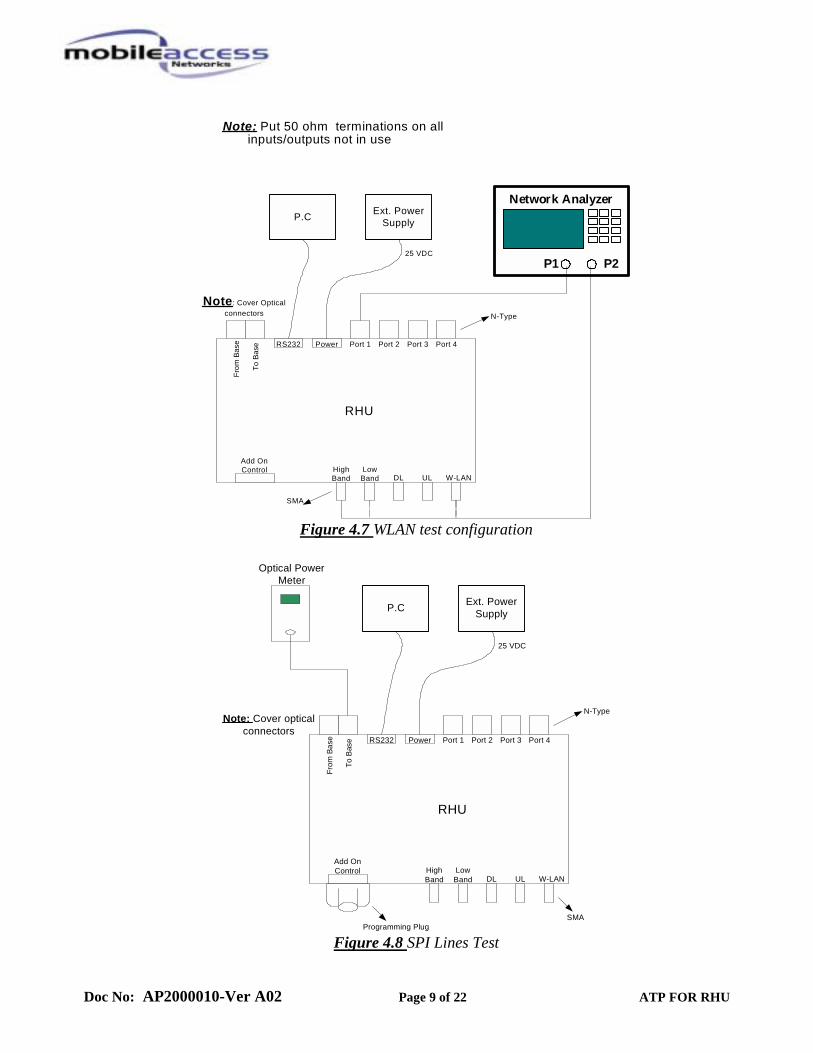
Figure 4.7 WLAN test configuration
PowerRS232 Port 4Port 3Port 2Port 1
To B
ase
From
Bas
e
W-LANULDLLowBand
HighBand
Add OnControl
RHU
SMA
N-Type
Ext. PowerSupplyP.C
25 VDC
Programming Plug
Note: Cover opticalconnectors
Optical PowerMeter
Figure 4.8 SPI Lines Test
Doc No: AP2000010-Ver A02 Page 10 of 22 ATP FOR RHU
PowerRS232 Port 4Port 3Port 2Port 1
Optic
To B
ase
From
Bas
e
W-LANULDLLowBand
HighBand
Add OnControl
RHU
SMA
N-Type
Ext. PowerSupplyP.C
25 VDC
Note: Put 50 ohm terminations on allinputs/outputs not in use
SpectrumAnalyzer
BU
OpticRS232
Alarms
ComPowerSupply
DownlinkUplink
Ext. PowerSupply
25 VDC
SpectrumAnalyzer
Optic
Note: Cover opticalconnectors
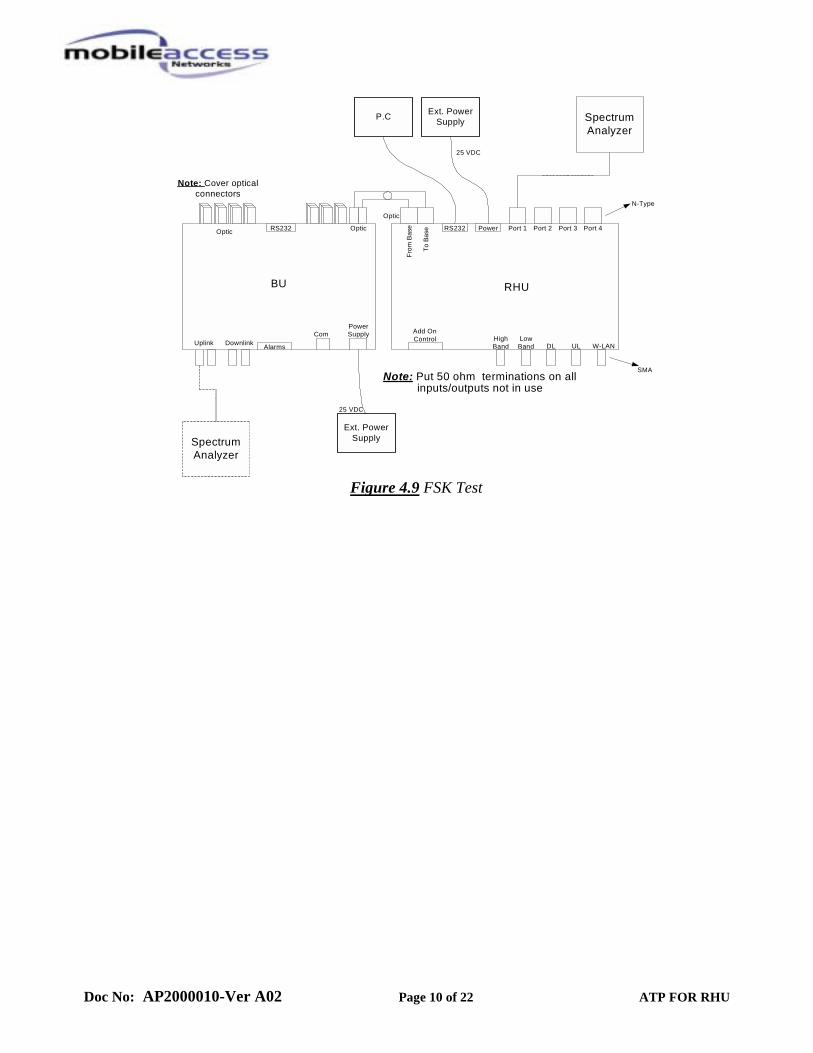
Figure 4.9 FSK Test
Doc No: AP2000010-Ver A02 Page 11 of 22 ATP FOR RHU
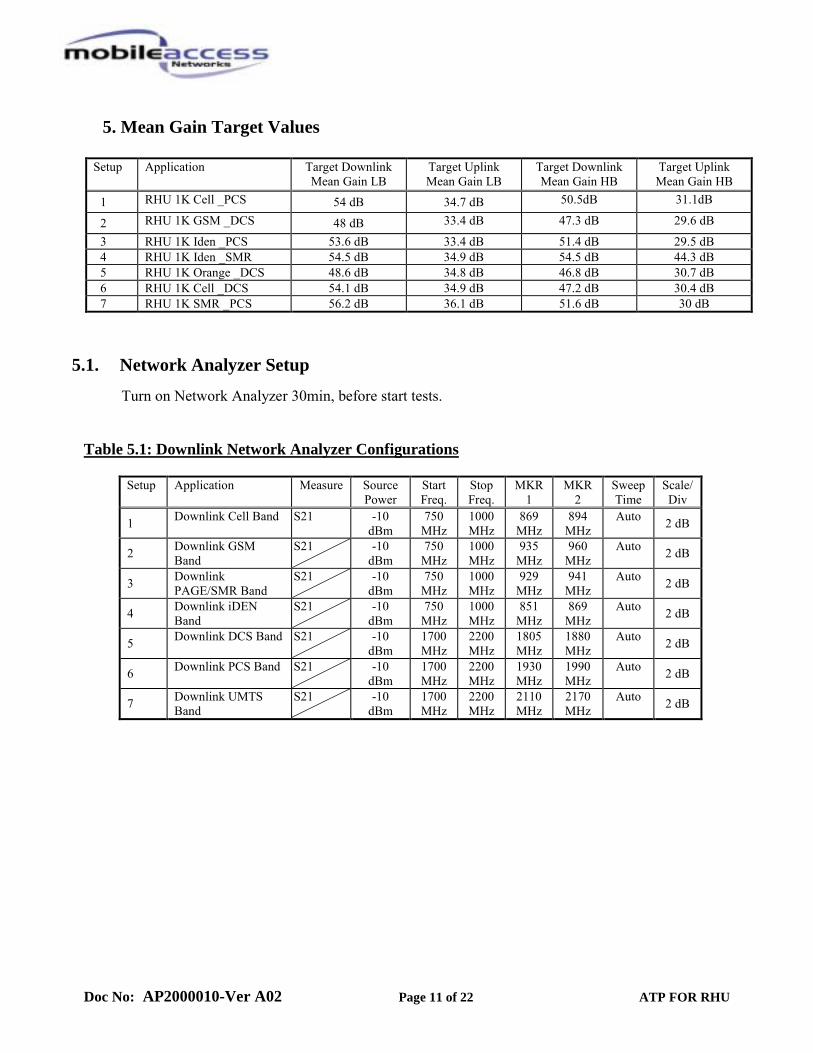
5. Mean Gain Target Values
Setup Application Target Downlink Mean Gain LB
Target Uplink Mean Gain LB
Target Downlink Mean Gain HB
Target Uplink Mean Gain HB
1 RHU 1K Cell _PCS 54 dB 34.7 dB 50.5dB 31.1dB
2 RHU 1K GSM _DCS 48 dB 33.4 dB 47.3 dB 29.6 dB
3 RHU 1K Iden _PCS 53.6 dB 33.4 dB 51.4 dB 29.5 dB 4 RHU 1K Iden _SMR 54.5 dB 34.9 dB 54.5 dB 44.3 dB 5 RHU 1K Orange _DCS 48.6 dB 34.8 dB 46.8 dB 30.7 dB 6 RHU 1K Cell _DCS 54.1 dB 34.9 dB 47.2 dB 30.4 dB 7 RHU 1K SMR _PCS 56.2 dB 36.1 dB 51.6 dB 30 dB
5.1. Network Analyzer Setup Turn on Network Analyzer 30min, before start tests.
Table 5.1: Downlink Network Analyzer Configurations
Setup Application Measure Source
Power Start Freq.
Stop Freq.
MKR 1
MKR 2
Sweep Time
Scale/ Div
1 Downlink Cell Band S21
-10 dBm
750 MHz
1000 MHz
869 MHz
894 MHz
Auto 2 dB
2 Downlink GSM Band
S21
-10 dBm
750 MHz
1000 MHz
935 MHz
960 MHz
Auto 2 dB
3 Downlink PAGE/SMR Band
S21
-10 dBm
750 MHz
1000 MHz
929 MHz
941 MHz
Auto 2 dB
4 Downlink iDEN Band
S21
-10 dBm
750 MHz
1000 MHz
851 MHz
869 MHz
Auto 2 dB
5 Downlink DCS Band S21
-10 dBm
1700 MHz
2200 MHz
1805 MHz
1880 MHz
Auto 2 dB
6 Downlink PCS Band S21
-10 dBm
1700 MHz
2200 MHz
1930 MHz
1990 MHz
Auto 2 dB
7 Downlink UMTS Band
S21
-10 dBm
1700 MHz
2200 MHz
2110 MHz
2170MHz
Auto 2 dB
Doc No: AP2000010-Ver A02 Page 12 of 22 ATP FOR RHU
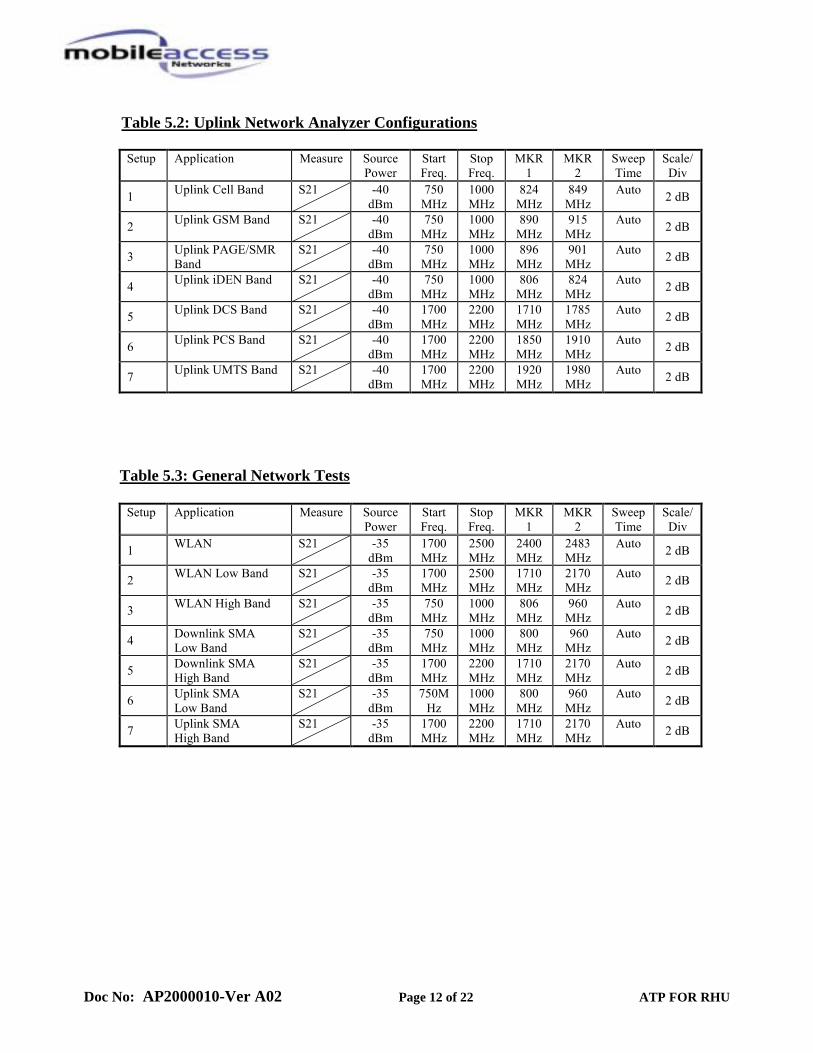
Table 5.2: Uplink Network Analyzer Configurations Setup Application Measure Source
Power Start Freq.
Stop Freq.
MKR 1
MKR 2
Sweep Time
Scale/ Div
1 Uplink Cell Band S21
-40 dBm
750 MHz
1000 MHz
824 MHz
849 MHz
Auto 2 dB
2 Uplink GSM Band S21
-40 dBm
750 MHz
1000 MHz
890 MHz
915 MHz
Auto 2 dB
3 Uplink PAGE/SMR Band
S21
-40 dBm
750 MHz
1000 MHz
896 MHz
901 MHz
Auto 2 dB
4 Uplink iDEN Band S21
-40 dBm
750 MHz
1000 MHz
806 MHz
824 MHz
Auto 2 dB
5 Uplink DCS Band S21
-40 dBm
1700 MHz
2200 MHz
1710 MHz
1785 MHz
Auto 2 dB
6 Uplink PCS Band S21
-40 dBm
1700 MHz
2200 MHz
1850 MHz
1910 MHz
Auto 2 dB
7 Uplink UMTS Band S21
-40 dBm
1700 MHz
2200 MHz
1920 MHz
1980 MHz
Auto 2 dB
Table 5.3: General Network Tests Setup Application Measure Source
Power Start Freq.
Stop Freq.
MKR 1
MKR 2
Sweep Time
Scale/ Div
1 WLAN S21
-35 dBm
1700 MHz
2500MHz
2400 MHz
2483 MHz
Auto 2 dB
2 WLAN Low Band S21
-35 dBm
1700 MHz
2500 MHz
1710 MHz
2170 MHz
Auto 2 dB
3 WLAN High Band S21
-35 dBm
750 MHz
1000 MHz
806 MHz
960 MHz
Auto 2 dB
4 Downlink SMA Low Band
S21
-35 dBm
750 MHz
1000 MHz
800 MHz
960 MHz
Auto 2 dB
5 Downlink SMA High Band
S21
-35 dBm
1700 MHz
2200 MHz
1710 MHz
2170 MHz
Auto 2 dB
6 Uplink SMA Low Band
S21
-35 dBm
750MHz
1000 MHz
800 MHz
960 MHz
Auto 2 dB
7 Uplink SMA High Band
S21
-35 dBm
1700 MHz
2200 MHz
1710 MHz
2170 MHz
Auto 2 dB
Doc No: AP2000010-Ver A02 Page 13 of 22 ATP FOR RHU
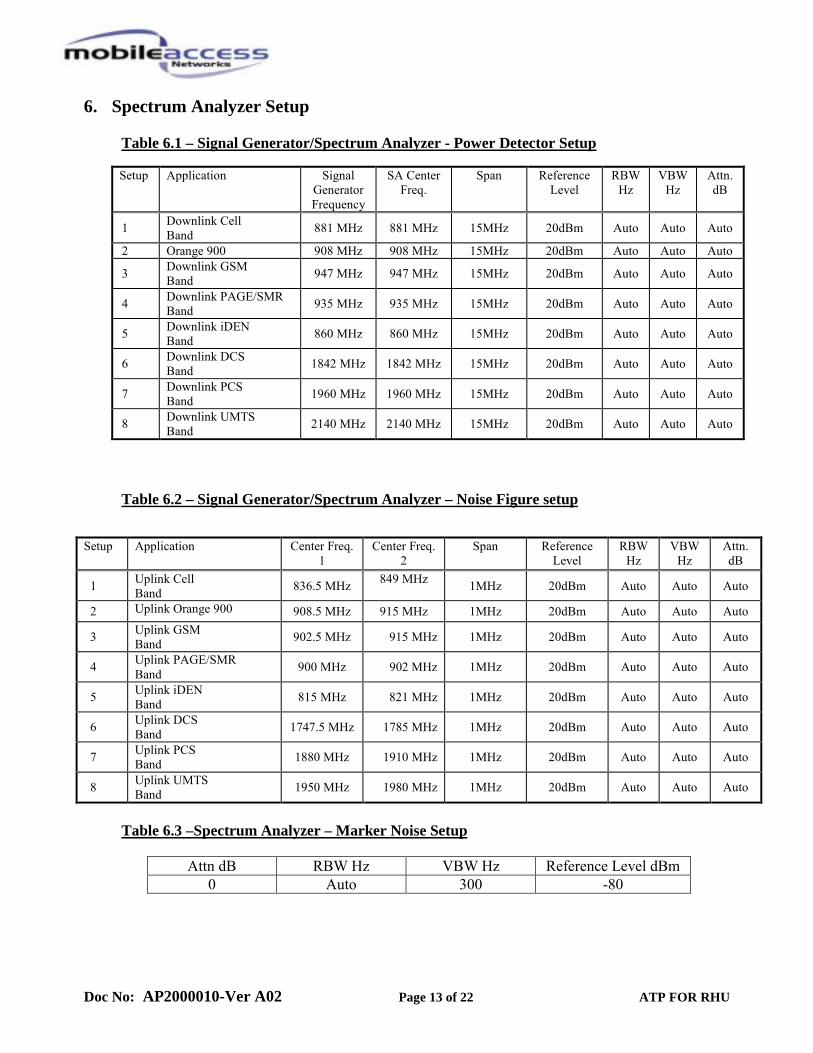
6. Spectrum Analyzer Setup Table 6.1 – Signal Generator/Spectrum Analyzer - Power Detector Setup
Setup Application Signal
Generator Frequency
SA Center Freq.
Span Reference Level
RBW Hz
VBW Hz
Attn. dB
1 Downlink Cell Band 881 MHz 881 MHz 15MHz 20dBm Auto Auto Auto
2 Orange 900 908 MHz 908 MHz 15MHz 20dBm Auto Auto Auto
3 Downlink GSM Band 947 MHz 947 MHz 15MHz 20dBm Auto Auto Auto
4 Downlink PAGE/SMR Band 935 MHz 935 MHz 15MHz 20dBm Auto Auto Auto
5 Downlink iDEN Band 860 MHz 860 MHz 15MHz 20dBm Auto Auto Auto
6 Downlink DCS Band 1842 MHz 1842 MHz 15MHz 20dBm Auto Auto Auto
7 Downlink PCS Band 1960 MHz 1960 MHz 15MHz 20dBm Auto Auto Auto
8 Downlink UMTS Band 2140 MHz 2140 MHz 15MHz 20dBm Auto Auto Auto
Table 6.2 – Signal Generator/Spectrum Analyzer – Noise Figure setup
Setup Application Center Freq. 1
Center Freq. 2
Span Reference Level
RBW Hz
VBW Hz
Attn. dB
1 Uplink Cell Band 836.5 MHz 849 MHz
1MHz 20dBm Auto Auto Auto
2 Uplink Orange 900 908.5 MHz 915 MHz 1MHz 20dBm Auto Auto Auto
3 Uplink GSM Band 902.5 MHz 915 MHz 1MHz 20dBm Auto Auto Auto
4 Uplink PAGE/SMR Band 900 MHz MHz902 1MHz 20dBm Auto Auto Auto
5 Uplink iDEN Band 815 MHz 821 MHz 1MHz 20dBm Auto Auto Auto
6 Uplink DCS Band 1747.5 MHz 1785 MHz 1MHz 20dBm Auto Auto Auto
7 Uplink PCS Band 1880 MHz 1910 MHz 1MHz 20dBm Auto Auto Auto
8 Uplink UMTS Band 1950 MHz 1980 MHz 1MHz 20dBm Auto Auto Auto
Table 6.3 –Spectrum Analyzer – Marker Noise Setup
Attn dB RBW Hz VBW Hz Reference Level dBm 0 Auto 300 -80
Doc No: AP2000010-Ver A02 Page 14 of 22 ATP FOR RHU
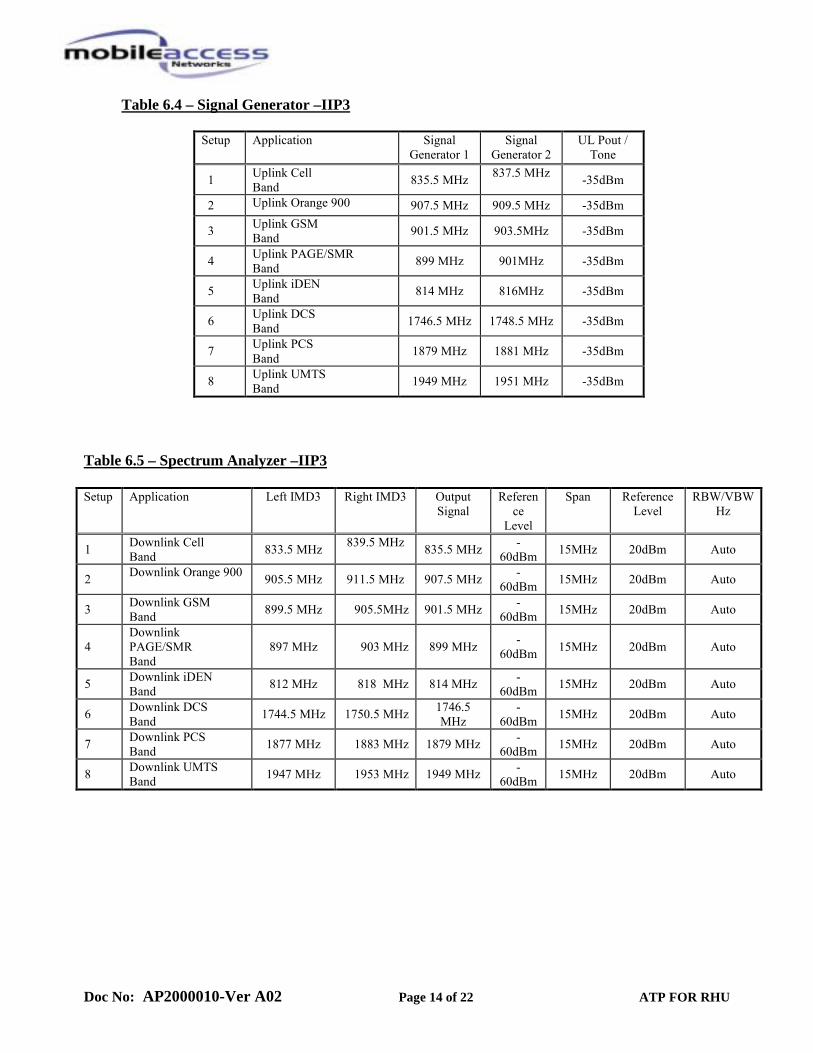
Table 6.4 – Signal Generator –IIP3
Setup Application Signal Generator 1
Signal Generator 2
UL Pout / Tone
1 Uplink Cell Band 835.5 MHz 837.5 MHz
-35dBm
2 Uplink Orange 900 907.5 MHz 909.5 MHz -35dBm
3 Uplink GSM Band 901.5 MHz 903.5MHz -35dBm
4 Uplink PAGE/SMR Band 899 MHz MHz901 -35dBm
5 Uplink iDEN Band 814 MHz MHz816 -35dBm
6 Uplink DCS Band 1746.5 MHz 1748.5 MHz -35dBm
7 Uplink PCS Band 1879 MHz 1881 MHz -35dBm
8 Uplink UMTS Band 1949 MHz 1951 MHz -35dBm
Table 6.5 – Spectrum Analyzer –IIP3 Setup Application Left IMD3 Right IMD3 Output
Signal Referen
ce Level
Span Reference Level
RBW/VBW Hz
1 Downlink Cell Band 833.5 MHz 839.5 MHz
835.5 MHz -60dBm 15MHz 20dBm Auto
2 Downlink Orange 900 905.5 MHz 911.5 MHz 907.5 MHz -60dBm 15MHz 20dBm Auto
3 Downlink GSM Band 899.5 MHz 905.5MHz 901.5 MHz -
60dBm 15MHz 20dBm Auto
4 Downlink PAGE/SMR Band
897 MHz MHz903 899 MHz -60dBm 15MHz 20dBm Auto
5 Downlink iDEN Band 812 MHz MHz 818 814 MHz -
60dBm 15MHz 20dBm Auto
6 Downlink DCS Band 1744.5 MHz 1750.5 MHz 1746.5
MHz -
60dBm 15MHz 20dBm Auto
7 Downlink PCS Band 1877 MHz 1883 MHz 1879 MHz -
60dBm 15MHz 20dBm Auto
8 Downlink UMTS Band 1947 MHz 1953 MHz 1949 MHz -
60dBm 15MHz 20dBm Auto
Doc No: AP2000010-Ver A02 Page 15 of 22 ATP FOR RHU
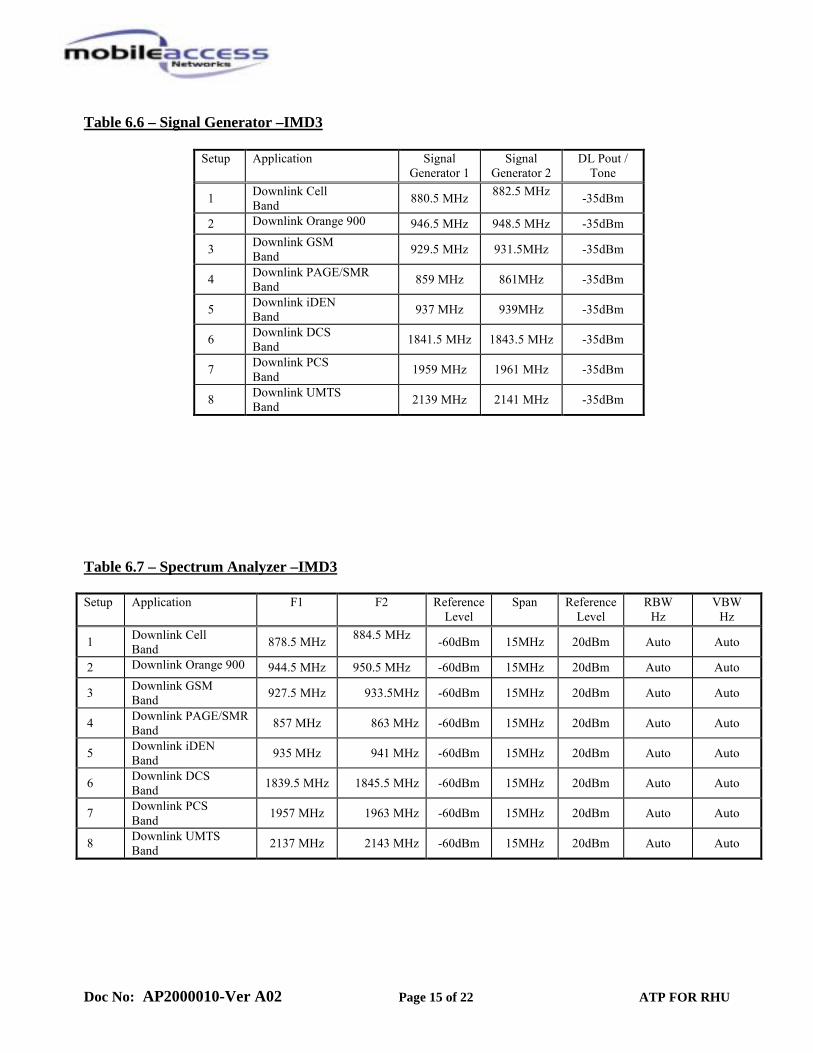
Table 6.6 – Signal Generator –IMD3
Setup Application Signal Generator 1
Signal Generator 2
DL Pout / Tone
1 Downlink Cell Band 880.5 MHz 882.5 MHz
-35dBm
2 Downlink Orange 900 946.5 MHz 948.5 MHz -35dBm
3 Downlink GSM Band 929.5 MHz 931.5MHz -35dBm
4 Downlink PAGE/SMR Band 859 MHz MHz861 -35dBm
5 Downlink iDEN Band 937 MHz MHz939 -35dBm
6 Downlink DCS Band 1841.5 MHz 1843.5 MHz -35dBm
7 Downlink PCS Band 1959 MHz 1961 MHz -35dBm
8 Downlink UMTS Band 2139 MHz 2141 MHz -35dBm
Table 6.7 – Spectrum Analyzer –IMD3 Setup Application F1 F2 Reference
Level Span Reference
Level RBW
Hz VBW
Hz
1 Downlink Cell Band 878.5 MHz 884.5 MHz
-60dBm 15MHz 20dBm Auto Auto
2 Downlink Orange 900 944.5 MHz 950.5 MHz -60dBm 15MHz 20dBm Auto Auto
3 Downlink GSM Band 927.5 MHz 933.5MHz -60dBm 15MHz 20dBm Auto Auto
4 Downlink PAGE/SMR Band 857 MHz MHz863 -60dBm 15MHz 20dBm Auto Auto
5 Downlink iDEN Band 935 MHz MHz941 -60dBm 15MHz 20dBm Auto Auto
6 Downlink DCS Band 1839.5 MHz 1845.5 MHz -60dBm 15MHz 20dBm Auto Auto
7 Downlink PCS Band 1957 MHz 1963 MHz -60dBm 15MHz 20dBm Auto Auto
8 Downlink UMTS Band 2137 MHz 2143 MHz -60dBm 15MHz 20dBm Auto Auto
Doc No: AP2000010-Ver A02 Page 16 of 22 ATP FOR RHU
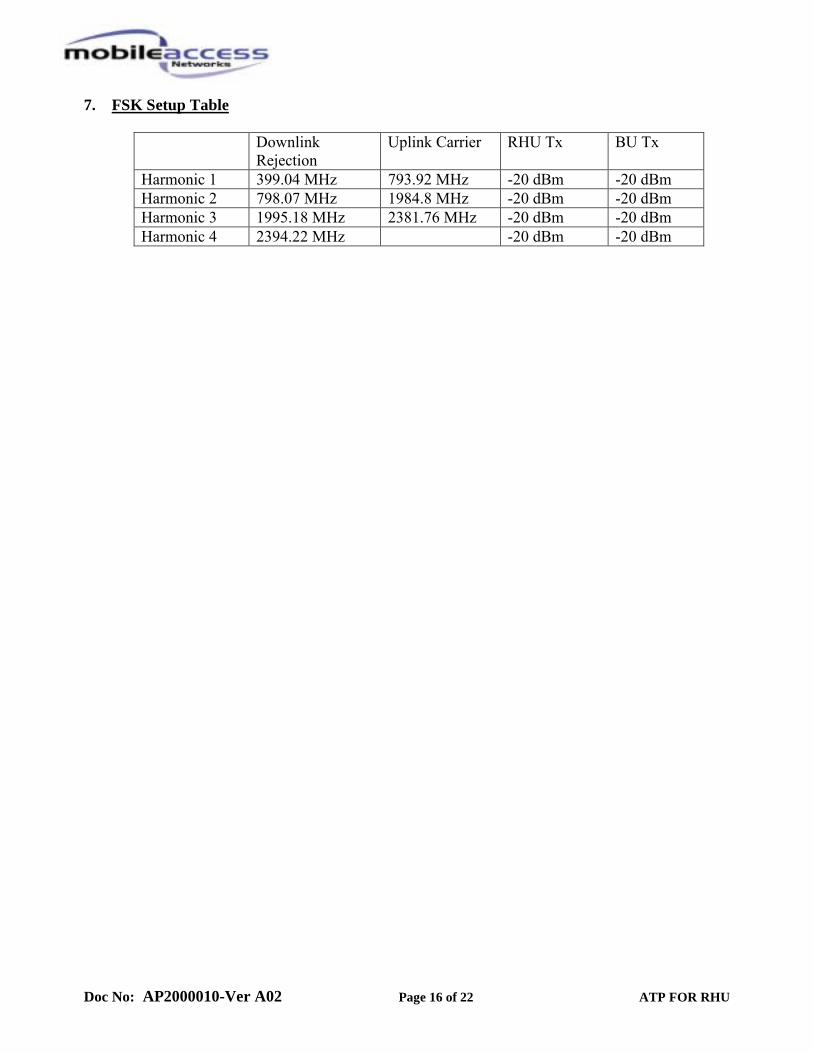
7. FSK Setup Table
Downlink Rejection
Uplink Carrier RHU Tx BU Tx
Harmonic 1 399.04 MHz 793.92 MHz -20 dBm -20 dBm Harmonic 2 798.07 MHz 1984.8 MHz -20 dBm -20 dBm Harmonic 3 1995.18 MHz 2381.76 MHz -20 dBm -20 dBm Harmonic 4 2394.22 MHz -20 dBm -20 dBm
Doc No: AP2000010-Ver A02 Page 17 of 22 ATP FOR RHU
8. Laser Current Calibration 8.1. Connect the RHU according to setup 4.8. 8.2. Run the RHU GUI software. 8.3. Write down the laser slope efficiency (SE) from the laser manufacturer data sheet. 8.4. Write down the laser current threshold (Ith) from the laser manufacturer data sheet. 8.5. Change the LASER value in the RHU GUI software until Ibias matches to Ith+25mA. 8.6. Record Ibias to ATR. 8.7. Record LASER to ATR. 8.8. Record Ith to ATR. 8.9. Record Slope efficiency to ATR.
9. Optical Power PDI
9.1. Connect the RHU according to setup 4.8. 9.2. Measure the laser power with the optical power meter. 9.3. Record result to ATR. 9.4. Run the RHU GUI software and read the PDI Mon value. 9.5. Convert the PDI Mon Value to Volts according to the following expression:
(255
5_ ×= MonPDIV )
9.6. Record result to ATR.
10. Antenna Connection 10.1. Connect the RHU according to setup 4.8. 10.2. Run the RHU GUI software. 10.3. Connect 50Ω N-type termination on antenna port1 and verify that the antenna indicator in the GUI software is green.
10.4. Remove the 50Ω termination from antenna port1 and verify that the antenna indicator in the GUI software is red.
10.5. Record results to ATR. 10.6. Repeat the steps 10.3 to 10.5 for antenna ports 2 to 4.
Doc No: AP2000010-Ver A02 Page 18 of 22 ATP FOR RHU
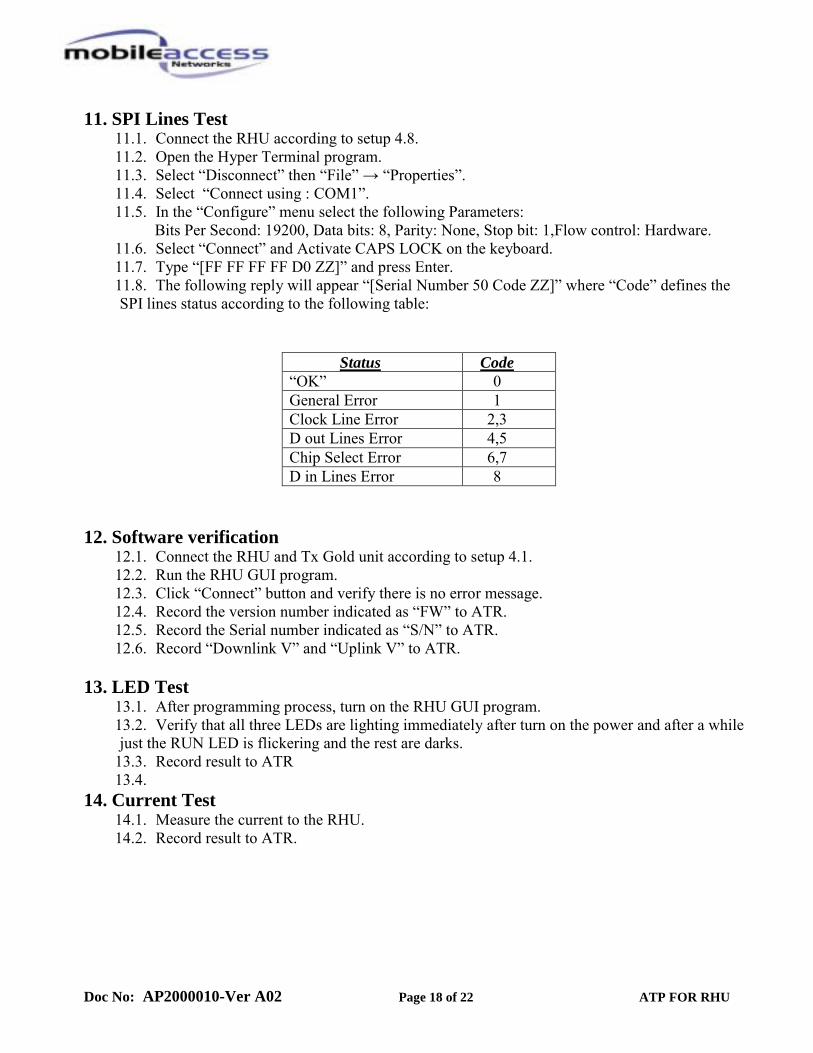
11. SPI Lines Test 11.1. Connect the RHU according to setup 4.8. 11.2. Open the Hyper Terminal program. 11.3. Select Disconnect then File → Properties. 11.4. Select Connect using : COM1. 11.5. In the Configure menu select the following Parameters: Bits Per Second: 19200, Data bits: 8, Parity: None, Stop bit: 1,Flow control: Hardware. 11.6. Select Connect and Activate CAPS LOCK on the keyboard. 11.7. Type [FF FF FF FF D0 ZZ] and press Enter. 11.8. The following reply will appear [Serial Number 50 Code ZZ] where Code defines the SPI lines status according to the following table:
Status Code OK 0 General Error 1 Clock Line Error 2,3 D out Lines Error 4,5 Chip Select Error 6,7 D in Lines Error 8
12. Software verification
12.1. Connect the RHU and Tx Gold unit according to setup 4.1. 12.2. Run the RHU GUI program. 12.3. Click Connect button and verify there is no error message. 12.4. Record the version number indicated as FW to ATR. 12.5. Record the Serial number indicated as S/N to ATR. 12.6. Record Downlink V and Uplink V to ATR.
13. LED Test
13.1. After programming process, turn on the RHU GUI program. 13.2. Verify that all three LEDs are lighting immediately after turn on the power and after a while just the RUN LED is flickering and the rest are darks.
13.3. Record result to ATR 13.4.
14. Current Test 14.1. Measure the current to the RHU. 14.2. Record result to ATR.
Doc No: AP2000010-Ver A02 Page 19 of 22 ATP FOR RHU
15. General Network Tests 15.1. WLAN SMA Port Test
15.1.1. Connect the RHU unit according to setup 4.7. 15.1.2. Set the Network Analyzer according to the RHU band, Based on table 5.4, S21 and ripple
measurement. 15.1.3. Repeat the measurement for SMA ports Low Band and High Band. 15.1.4. Record the results to the ATR.
15.2. Downlink SMA Port 15.2.1. Connect the RHU unit according to setup 4.6. 15.2.2. Set the Network Analyzer according to the RHU band, Based on table 5.4, S21 and
ripple Measurement. 15.2.3. Repeat the measurement for low band and high band. 15.2.4. Record the results to the ATR.
15.3. Uplink SMA Port 15.3.1. Connect the RHU unit according to setup 4.5. 15.3.2. Set the Network Analyzer according to the RHU band, Based on table 5.4, S21 and ripple
Measurement. 15.3.3. Repeat the measurement for low band and high band. 15.3.4. Record the results to the ATR.
16. Downlink Mean Gain Adjustment Test 16.1. Connect the RHU and Tx Gold unit according to setup 4.1. 16.2. Set the Network Analyzer according to the RHU band, base on Table 5.2, S21
measurement. 16.3. Adjust the downlink DCA using the RHU SW until S21 comply with the target Mean
gain value according to table 5.1. 16.4. Record the Mean Gain to ATR. 16.5. Record the Ripple To ATR. 16.6. Record DCA value to ATR.
17. Port Unbalance
17.1. Connect the RHU and Tx Gold unit according to setup 4.1. 17.2. Measure S21 on the antenna ports 1 to 4 according to the frequency bands detailed in
table 5.2. 17.3. Record results to the ATR.
18. Uplink Mean Gain Adjustment Test 18.1. Connect the RHU and Tx Gold unit according to setup 4.2. 18.2. Set the Network Analyzer according to the RHU band, base on Table 5.3, S21
measurement. 18.3. Adjust the downlink DCA using the RHU SW until S21 comply with the target Mean
gain value according to table 5.1. 18.4. Record the Mean Gain to ATR. 18.5. Record the Ripple To ATR. 18.6. Record DCA value to ATR
Doc No: AP2000010-Ver A02 Page 20 of 22 ATP FOR RHU
19. Uplink AGC Test 19.1. Connect the RHU and Rx Gold unit according to setup 4.4. 19.2. Set the signal generator frequency to the center frequency of the RHU Uplink Band. 19.3. Set the signal generator power to 35dBm. 19.4. Set the spectrum analyzer to the center frequency of the RHU Uplink Band. 19.5. Calculate the gain. 19.6. Record result to the ATR. 19.7. Set the signal generator power to 20dBm. 19.8. Calculate the gain. 19.9. Record result to the ATR.
20. Down link Power Detector
20.1. Power Detector Low Band
20.1.1. Connect the RHU and Tx Gold unit according to setup 4.3. 20.1.2. Set Spectrum Analyzer according to the RHU band, based on Table 6.1. 20.1.3. Set Signal Generator Frequency according to the RHU band, based on Table 6.1. 20.1.4. Adjust the signal generator output power to get +1dBm on the spectrum analyzer. 20.1.5. Measure the Output Signal on the Spectrum analyzer and read the A/D value on the
RHU SW. 20.1.6. Record result to ATR. 20.1.7. Increase the Power Level of the Signal Generator by 1 dB. 20.1.8. Measure the Output Signal on the Spectrum and read the A/D value on the RHU SW. 20.1.9. Record result to ATR. 20.1.10. Repeat stages 19.1.6 to 19.1.9 22 times.
20.2. Power Detector High Band
20.2.1. Connect the RHU and Tx Gold unit according to setup 4.3. 20.2.2. Set Spectrum Analyzer according to the RHU band, based on Table 6.1.
Set Signal Generator Frequency according to the RHU band, based on Table 6.1. 20.2.3. Adjust the signal generator output power to get -1dBm on the spectrum analyzer. 20.2.4. Measure the Output Signal on the Spectrum analyzer and read the A/D value on the
RHU SW. 20.2.5. Record result to ATR. 20.2.6. Increase the Power Level of the Signal Generator by 1 dB. 20.2.7. Measure the Output Signal on the Spectrum and read the A/D value on the RHU SW. 20.2.8. Record result to ATR. 20.2.9. Repeat stages 19.1.16 to 19.1.18 22 times.
Doc No: AP2000010-Ver A02 Page 21 of 22 ATP FOR RHU
21. NF Test
The noise figure test is performed on 2 frequencies of the band: the center frequency (center frequency 1 in table 6.2) and the right edge frequency of the band (center frequency 2 in table 6.2).
21.1. Connect the RHU and Rx Gold unit according to setup 4.4. 21.2. Set Spectrum Analyzer and Signal Generator Frequencies according to the RHU band to
center frequency 1, based on Table 6.2. 21.3. Measure the composite input power to the Rx gold unit. 21.4. Measure the output signal on antenna Port 1with the spectrum analyzer. 21.5. Press the RF OFF button on the signal generator. 21.6. Set up the spectrum analyzer to marker noise measurement according to table 6.3. 21.7. Measure the noise floor at the center frequency based on table 6.3. 21.8. Calculate the noise figure using the following expression:
Gain = (Output Power) - (Input Power)
NF = -174 – NFL – Gain. 21.9. Record the result to the ATR. 21.10. Repeat steps 16.2 to 16.9 for center frequency 2.
22. IMD3 test
22.1. Connect the RHU and Tx Gold unit according to setup 4.3. 22.2. Set Signal generators according to the RHU band, based on table 6.6. 22.3. Measure the IMD3 products at the RHU output with the spectrum analyzer according the
table 6.7. Note: there are two IMD3 products on either side of the output signals ( 1221 2,2 ffff −− )
22.4. Record the worst result to the ATR. 23. IIP3 test
23.1. Connect the RHU and Rx Gold Unit according to setup 4.4. 23.2. Set signal generators according to the RHU band, based on table 6.4. 23.3. Measure the IMD3 and output signals on the spectrum analyzer according to table 6.5. 23.4. Calculate the IIP3 value according to the following expression:
inOut
IMDOUT
PPGainPGainPIIP
−=−−×= 323
23.5. Record the result to ATR.
Doc No: AP2000010-Ver A02 Page 22 of 22 ATP FOR RHU
24. FSK Downlink Rejection
24.1. Connect the RHU and BU according to setup 4.9. 24.2. Run the RHU and BU GUI software. 24.3. Set the BU and RHU FSK Tx power according to table 7. 24.4. Set the spectrum analyzer to the Downlink Rejection frequencies according to table 7. 24.5. Measure the Downlink rejection signal. 24.6. Record the results to ATR.
25. FSK Uplink Carrier
25.1. Connect the RHU and BU according to setup 4.9. 25.2. Run the RHU and BU GUI software. 25.3. Set the BU and RHU FSK Tx power according to table 7. 25.4. Set the spectrum analyzer to the Uplink carrier frequencies according to table 7. 25.5. Measure the Uplink carrier signal. 25.6. Record the results to ATR.
26. FSK MODEM
26.1. Connect RHU and BU according to setup 4.9. 26.2. Remove RS232 cable and let the link run for 2 minuets. 26.3. Plug RS232 plug and run the RHU GUI software. 26.4. Read FSK counter on the RHU GUI software. 26.5. Record result to ATR.