atos origin presentation q3 results 2008
TRANSCRIPT

Atos, Atos and fish symbol, Atos Origin and fish symbol, Atos Consulting, and the fish symbol itself are registered trademarks of Atos Origin SA. 31/10/2008 00:11© 2006 Atos Origin. Private for the client. This report or any part of it, may not be copied, circulated, quoted without prior written approval from Atos Origin or the client.
Atos Origin Q3 2008 revenuesManagement Board Conference call
Paris, 31 October 2008

2 Atos Origin Q3 2008 revenues / 31 October 2008
Disclaimers
» This presentation contains further forward-looking statements that involve risks and uncertainties concerning the Group’s expected growth and profitability for 2008. Actual events or results may differ from those described in this presentation due to a number of risks and uncertainties that are described within the 2007 annual report filed with the Autorités des Marchés Financiers (AMF) on 9 April 2008 as a Document de Référence under the registration number : D.08-218
» All figures used for the third quarter 2008 are unaudited
Q3 2007 Q3 2008
Exclude ItalyIncludes AEMS Exchange only for July
Includes Clearing and Markets activities
New Scope
Statutory scope
New scope aligned with the Market Guidance
Includes Italy and AEMS
Exchange Statutory Scope
Excludes Italyand AEMS Exchange Excludes Italy and AEMS Exchange
» Different scopes of the company are presented taking into account the disposal of Italy at the end of January 2008 and the split of AEMS between the part remaining in the Group (Clearing & Settlement and Capital Market) and the part sold to NYSE/Euronext (AEMS Exchange) in August 2008.

3 Atos Origin Q3 2008 revenues / 31 October 2008
Agenda
» Q3 2008 Highlights
» Q3 2008 Financial Performance
» Outcome of strategic review
» Focus on operational improvement
» Group actions vs new environment
» Market exposure
» Objectives 2008
4 Atos Origin Q3 2008 revenues / 31 October 2008
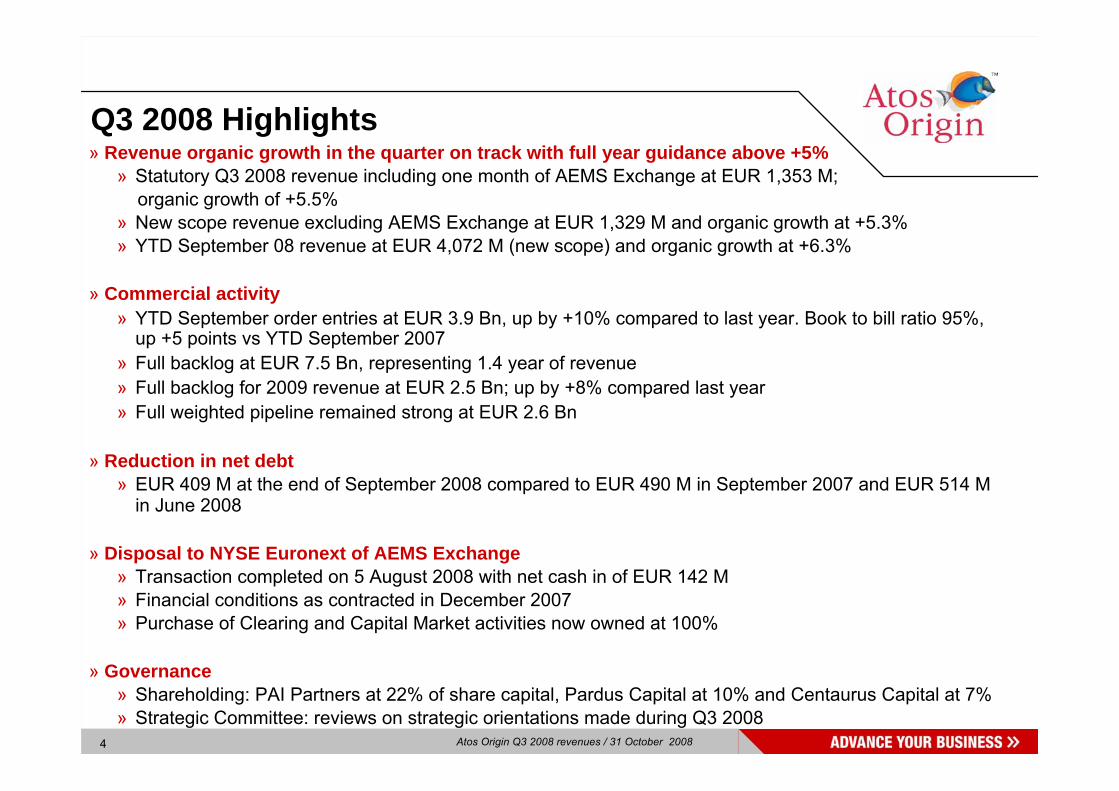
» Revenue organic growth in the quarter on track with full year guidance above +5%» Statutory Q3 2008 revenue including one month of AEMS Exchange at EUR 1,353 M;
organic growth of +5.5%» New scope revenue excluding AEMS Exchange at EUR 1,329 M and organic growth at +5.3%» YTD September 08 revenue at EUR 4,072 M (new scope) and organic growth at +6.3%
» Commercial activity» YTD September order entries at EUR 3.9 Bn, up by +10% compared to last year. Book to bill ratio 95%,
up +5 points vs YTD September 2007» Full backlog at EUR 7.5 Bn, representing 1.4 year of revenue» Full backlog for 2009 revenue at EUR 2.5 Bn; up by +8% compared last year» Full weighted pipeline remained strong at EUR 2.6 Bn
» Reduction in net debt » EUR 409 M at the end of September 2008 compared to EUR 490 M in September 2007 and EUR 514 M
in June 2008
» Disposal to NYSE Euronext of AEMS Exchange» Transaction completed on 5 August 2008 with net cash in of EUR 142 M» Financial conditions as contracted in December 2007» Purchase of Clearing and Capital Market activities now owned at 100%
» Governance » Shareholding: PAI Partners at 22% of share capital, Pardus Capital at 10% and Centaurus Capital at 7%» Strategic Committee: reviews on strategic orientations made during Q3 2008
Q3 2008 Highlights

5 Atos Origin Q3 2008 revenues / 31 October 2008
Main wins in third quarter 2008
Extension PACS SAN storageMOUKNHS ScotlandContract extension in health / transformationSI/MOUKPublic sector
Software developmentSIFranceMichelin
Customers Country Service line
Deals
Interelectra Belgium SI,MO Clearinghouse solution.
Utilities company France MO Worldwide ERP monitoring, administration and hosting.Public Sector France SI SAP HR ImplementationEmployment Agency France CO,SI,MO Network administration and engineering.Retail e-banking company France CO,SI Business design and build of the e-banking solutionRedcats France MO Infrastructure transformation projectRetail company France OLS eCommerce BPOGEK Germany SI Software design and build for an e-Health card NRW Bank Germany MO Infrastructure OutsourcingAchmea Netherlands SI Application management (Off shoring included)Chamber of Commerce Netherlands SI Framework Agreement for software development Ministry of Education Netherlands MO Workplace, application delivery and development servicesSantander Spain CO SAP ERP Consulting serviceRepsol Spain CO,SI Loyalty Service Center managementTelefonica Spain SI Application management (Off shoring included)ACCA (UK Accountants Assoc.) UK MO IT Outsourcing (Off shoring included)CPG company UK SI SAP Upgrade
Public Sector USA MO Desktop support, service desk and disaster recovery.

6 Atos Origin Q3 2008 revenues / 31 October 2008
Order entry and book to bill ratio
93 %97 %98 %95%YTD Sept 08
YTD Sept 07
Book to bill
90%
Total Group
78 %107 %92 %
ManagedOperations
Systems IntegrationConsulting
(€ bn)
3,5
3,9
0,0 1,0 2,0 3,0 4,0
YTD Sept
2008 2007
H1 08 at+14%
YTD Sept +10%
NB: figures based on new scope atsame exchange rates
YTD September 2008 order entries up by +10% vs YTD September 07Book to bill ratio up by +5 points
Q3 08 flat

7 Atos Origin Q3 2008 revenues / 31 October 2008
Agenda
» Q3 2008 highlights
» Q3 2008 Financial Performance
» Outcome of strategic review
» Focus on operational improvement
» Group actions vs new environment
» Market exposure
» Objectives 2008

8 Atos Origin Q3 2008 revenues / 31 October 2008
Q3 2008 revenue organic growth at +5.3%
Third quarter revenue organic growth confirms full year guidance
Organic growth: at constant scope and exchange rates
In € Million 2008 2007 Δ% Exchange rates Disposals 2007
proforma% organic
growth
Statutory scope 1,353 1,418 -4.6% (41) (95) 1,282 +5.5%
Italy (no revenue in 2008 and 3 months in 2007) 0 (58) 58 0
AEMS Exchange (1 month in 08 and 3 months in 07) (24) (57) 1 37 (20)
Revenue excluding Italy and AEMS Exchange 1,329 1,303 +2.0% (40) (0) 1,263 +5.3%

9 Atos Origin Q3 2008 revenues / 31 October 2008
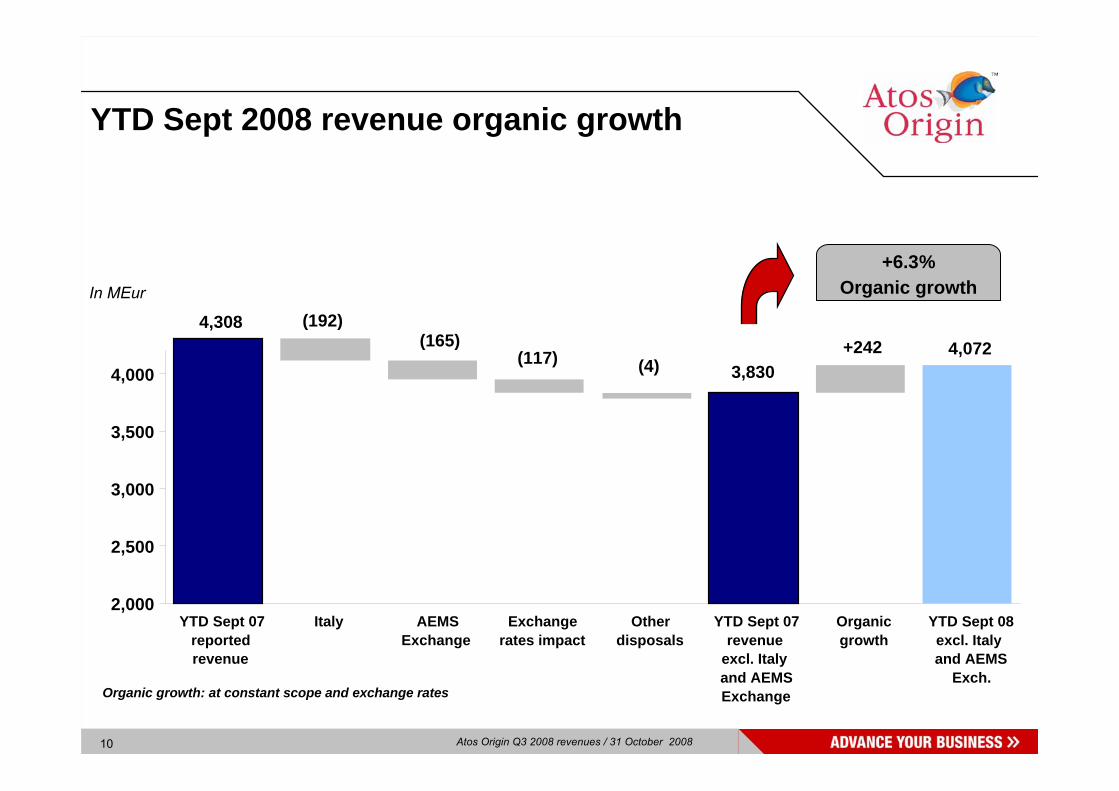
YTD September 2008 revenue organic growth at +6.3%
YTD September revenue organic growth higher than last year by +2.3 points
Organic growth: at constant scope and exchange rates
In € Million 2008 2007 Δ% Exchange rates Disposals 2007
proforma% organic
growth
Statutory scope 4,217 4,308 -2.1% (121) (212) 3,975 +6.1%
Italy (1 month in 2008 and 9 months in 2007) (20) (192) 171 (21)
AEMS Exchange (7 months in 08 and 9 mths in 07) (125) (165) 4 37 (124)
Revenue excluding Italy and AEMS Exchange 4,072 3,951 +3.1% (117) (4) 3,830 +6.3%
10 Atos Origin Q3 2008 revenues / 31 October 2008
YTD Sept 2008 revenue organic growth
+6.3% Organic growthIn MEur
4,0724,308
3,830
(165)(117) (4)
+242
2,000
2,500
3,000
3,500
4,000
YTD Sept 07reportedrevenue
Italy AEMSExchange
Exchangerates impact
Otherdisposals
YTD Sept 07revenue
excl. Italyand AEMSExchange
Organicgrowth
YTD Sept 08excl. Italyand AEMS
Exch.
(192)
Organic growth: at constant scope and exchange rates

11 Atos Origin Q3 2008 revenues / 31 October 2008
Revenue organic growth remains above market
Revenue organic growth evolution by quarter
+2,9%
+6,6%
+5,9%
+7,7%
+5,3%
+2,5%
+5,3%
+0,4%
-0,2%
+3,2%
+2,7%
Q1'06 Q2'06 Q3'06 Q4'06 Q1'07 Q2'07 Q3'07 Q4'07 Q1'08 Q2'08 Q3'08
IT Services market growth Western Europe +6.2% (*)
IT Services market growth Western Europe : +5.9% (*)
IT Services market in Western Europe: +4.8% (*)
(*) Source Gartner (updated figures)
Year-on year organic growth(At constant scope and exchange rates)

12 Atos Origin Q3 2008 revenues / 31 October 2008
Momentum of organic growth in 2008 compared to the last two years sustained
Momentum of organic growth maintained : Q3 08 at +5.3% after +6.6% in Q3 07
Q1 Q1 Q1Q2Q2 Q2Q3 Q3
+3.2% +2.9%
+7.7%
-0.2%
+6.6%
+5.3%
+2.7% +2.5%
+5.9%
-2,0%
-1,0%
0,0%
1,0%
2,0%
3,0%
4,0%
5,0%
6,0%
7,0%
8,0%
2006 2007 2008
Q1 Q2 Q1 Q2 Q1 Q2Q3 Q3 Q3
Year-on year organic growth(At constant scope and exchange rates)

13 Atos Origin Q3 2008 revenues / 31 October 2008
Q3 2008 revenue performance by service line
» Improved trend in Consulting with +11.2% after -1.6% in Q1 and flat in Q2» In SI: double digit growth in UK, Germany & CE and Asia Pacific» In MO: strong growth for UK, Atos Worldline, France MS and AP
Organic growth: at constant scope and exchange rates
In € MillionQ3 2008 Q3 2007
Δ% % organic growth
Q3 2008 Q3 2007Δ% % organic
growth
Consulting 84 79 +6.6% +11.2% 84 79 +6.6% +11.2%
Systems Integration 521 549 -5.1% +5.2% 521 508 +2.5% +5.2%
Managed Operations 748 790 -5.3% +5.1% 725 716 +1.2% +4.7%
Total Group 1,353 1,418 -4.6% +5.5% 1,329 1,303 +2.0% +5.3%
Statutory scope Excluding Italy and AEMS Exchange

14 Atos Origin Q3 2008 revenues / 31 October 2008
YTD September 2008 revenue performanceby service line
» Positive revenue organic growth in Consulting vs -9.6% YTD September 2007» In SI, total organic growth up by +2.2 points vs September 2007» In MO: UK, Atos Wordline, EMEA and Asia Pacific at double digit
Organic growth: at constant scope and exchange rates
In € MillionYTD Sept
2008YTD Sept
2007 Δ% % organic growth
YTD Sept 2008
YTD Sept 2007 Δ% % organic
growth
Consulting 262 268 -2.0% +2.1% 262 268 -2.0% +2.1%
Systems Integration 1,651 1,717 -3.8% +6.6% 1,637 1,577 +3.8% +6.8%
Managed Operations 2,303 2,323 -0.9% +6.2% 2,173 2,106 +3.2% +6.5%
Total Group 4,217 4,308 -2.1% +6.1% 4,072 3,951 +3.1% +6.3%
Statutory scope Excluding Italy and AEMS Exchange

15 Atos Origin Q3 2008 revenues / 31 October 2008
Q3 2008 revenue performance by geographical area
» Strong growth in all geographies except The Netherlands and Americas
Organic growth: at constant scope and exchange rates
In € Million Q3 2008 Q3 2007 Δ% % organic growth
Q3 2008 Q3 2007 Δ% % organic growth
France 391 395 -1.0% +6.0% 376 353 +6.6% +6.7%
United Kingdom 236 261 -9.4% +10.3% 228 247 -7.8% +7.9%
The Netherlands 260 263 -0.9% -0.7% 260 262 -0.7% -0.7%
Germany + Central Europe 162 152 +6.6% +6.4% 162 152 +6.6% +6.4%
Rest of EMEA 210 249 -15.6% +10.9% 210 191 +10.1% +10.9%
Americas 52 64 -19.3% -18.7% 52 64 -19.3% -18.7%
Asia Pacific 42 35 +19.9% +28.8% 42 35 +19.9% +28.8%
Total Group 1,353 1,418 -4.6% +5.5% 1,329 1,303 +2.0% +5.3%
Statutory scope Excluding Italy and AEMS Exchange
16 Atos Origin Q3 2008 revenues / 31 October 2008
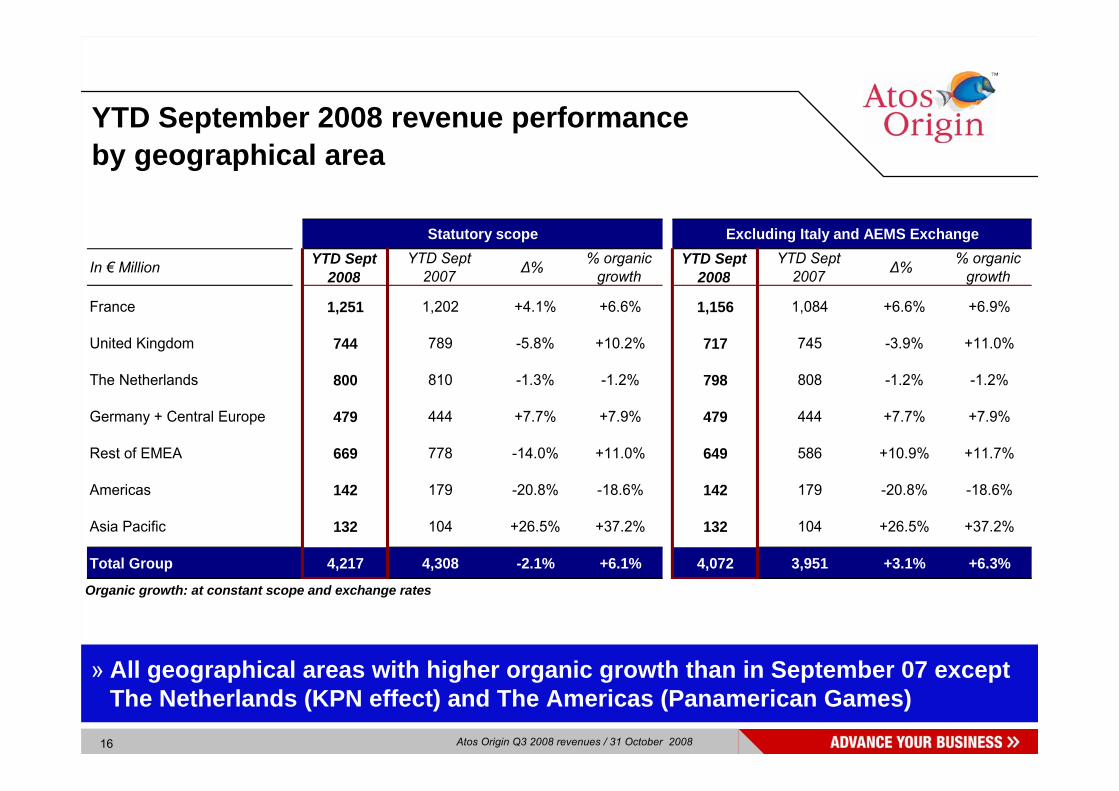
YTD September 2008 revenue performanceby geographical area
» All geographical areas with higher organic growth than in September 07 exceptThe Netherlands (KPN effect) and The Americas (Panamerican Games)
In € Million YTD Sept 2008
YTD Sept 2007 Δ% % organic
growthYTD Sept
2008YTD Sept
2007 Δ% % organic growth
France 1,251 1,202 +4.1% +6.6% 1,156 1,084 +6.6% +6.9%
United Kingdom 744 789 -5.8% +10.2% 717 745 -3.9% +11.0%
The Netherlands 800 810 -1.3% -1.2% 798 808 -1.2% -1.2%
Germany + Central Europe 479 444 +7.7% +7.9% 479 444 +7.7% +7.9%
Rest of EMEA 669 778 -14.0% +11.0% 649 586 +10.9% +11.7%
Americas 142 179 -20.8% -18.6% 142 179 -20.8% -18.6%
Asia Pacific 132 104 +26.5% +37.2% 132 104 +26.5% +37.2%
Total Group 4,217 4,308 -2.1% +6.1% 4,072 3,951 +3.1% +6.3%
Statutory scope Excluding Italy and AEMS Exchange
Organic growth: at constant scope and exchange rates

17 Atos Origin Q3 2008 revenues / 31 October 2008
Net debt evolution
(M€)
» AEMS Exchange: EUR 142 M cash received in Q3 2008» Dividends payment for EUR 28 M in July 2008
409
490509 514
0
100
200
300
400
500
600
June September
2007 2008

18 Atos Origin Q3 2008 revenues / 31 October 2008
» Change in scope relates to Italy (2,443 staff), AEMS Exchange (424)
» YTD September 08 hirings: +8,700 new employees with +2,600 in Q1, +3,000 in Q2 and 3,100in Q3
» Staff attrition stable compared to end of June 2008 at 13.5%
Headcount evolution
51,704 51,358(2,887)(4,910)
(1,302)
+8,753
10,000
20,000
30,000
40,000
50,000
Opening staff Change inscope
Leavers Lay-offs &dismissals
Hirings Closing staff

19 Atos Origin Q3 2008 revenues / 31 October 2008
Staff by geographical area
Of which 6,600 staff in low costs countries (13.5% of opening staff)
ClosingSept 2008
ClosingDec 2007
France 15,341 15,275 +66 +0.4%
United Kingdom 6,314 6,022 +292 +4.8%
The Netherlands 8,329 8,398 (69) -0.8%
Germany + Central Europe 4,248 4,076 +172 +4.2%
Rest of EMEA 8,784 8,131 +653 +8.0% SpainAmericas 3,168 2,629 +539 +20.5% BrazilAsia-Pacific 4,934 3,973 +961 +24.2% IndiaCorporate 240 256 (16) -6.3%
Total Group excl. Italy 51,358 48,761 +2,598 +5.3%
Italy 2,477
AEMS Exchange 467
Total Group 51,358 51,704 (346) -0.7%
Change since opening 1/1/08

20 Atos Origin Q3 2008 revenues / 31 October 2008
Offshore / Nearshore: above 4,000 staff
» Total offshore / nearshore increase by +500 staff during Q3 08
» Offshore / Nearshore: from 3% of total staff in December 2006 to 8% in September 2008
3,1392,2661,282India
4,042584
319
3,458
Sept 2008
3,001452
283
2,549
Dec 2007
1,58598
205
1,487
Dec 2006
Total offshore / nearshoreTotal nearshore
Other
(Staff)
Total offshore

21 Atos Origin Q3 2008 revenues / 31 October 2008
Agenda
» Q3 2008 highlights
» Q3 2008 Financial Performance
» Outcome of strategic review
» Focus on operational improvement
» Group actions vs new environment
» Market exposure
» Objectives 2008

22 Atos Origin Q3 2008 revenues / 31 October 2008
Strategic Review
» Two months intensive process led by the Strategic Committee and the Management Board
» Kick-Off on 7 July 2008, 3 weeks after the AGM of 12 June 2008
» Constructive and open process to assess the various strategic options and define clear priorities for the Group
» Review of various options in order to maximize value creation under current marketconditions
» Unanimous support of strategic priorities proposed by the Management Board

23 Atos Origin Q3 2008 revenues / 31 October 2008
Focus the company on high margin, recurring cash flow businesses
1. Become the European leader in transaction processing
» Organic growth, few key acquisitions and new outsourcing business with large volume transaction customers
» Ambition to reach in 3 years revenue of EUR 1.5 Bn with an operating margin above 15%
2. Refocus C&SI and MO
» Focus MO on local infrastructure, mainframe and server management
» Continued development of Distinctive Offerings and focus SI around selected profitable service offerings
» Explore partnerships to leverage existing platforms in C&SI
3. Focus on core geographiesand activities
» Divestures on non core geographies and activities» Between EUR 250 and 500 M revenue in the next months» First phase has started on a scope of EUR 250 M
4. Accelerate operationalimprovement
» Pursued effort on 3o3 operational transformation» Maintain emphasis on additional identified improvement
areas

24 Atos Origin Q3 2008 revenues / 31 October 2008
Focus on core geographies and activities
Divestments of non core geographies
Scope: geographies involved are mainlyoutside Europe
Key Figures
slightly <05.0% Operating Margin
249268Revenue
FY 2008 (e)FY 2007(in M€)

25 Atos Origin Q3 2008 revenues / 31 October 2008
Accelerate operational improvement
» Pursued effort on 3o3 operational transformation
» Industrialization initiatives (CMMi, tooling)
» Push towards offshore
» Mainframe consolidation
» Increased cost reduction through purchasing
» Maintain emphasis on additional identified improvement areas
» Turnaround of Systems Integration France
» Turnaround of Consulting UK
» Address G&A costs in NL
» Tighter management of Subcontractors
» Review of low margin contracts
» Accelerated resource streamlining

26 Atos Origin Q3 2008 revenues / 31 October 2008
Agenda
» Q3 2008 highlights
» Q3 2008 Financial Performance
» Outcome of strategic review
» Focus on operational improvement
» Group actions vs new environment
» Market exposure
» Objectives 2008

27 Atos Origin Q3 2008 revenues / 31 October 2008
Industrialization CMMI Roll-out: key for productivity
3,000
300
Brazil
CMMI5, Q3CMMI 3, Q3
» Mid ‘07: 2.750 CMMI3 in Europe
» YE ‘07: 7.550 CMMI3+ worldwide
» Q3 ’08: 8.550 CMMI3+ worldwide
» YE’ 09: 13.300 CMMI3+ (all close-, near- and offshore centers)
3, 150
1,500
500
100

28 Atos Origin Q3 2008 revenues / 31 October 2008
Industrialization – increasing users of standard tools
Staff in Software Development & Maintenance Centers
Users of ToolingShared Service Center
41%
74%
0%
26%
Penetration %

29 Atos Origin Q3 2008 revenues / 31 October 2008
Managed Services Global Factory – mainframe optimization (at current volumes)
» Mainframe project is on track. The transfer from France (part 1) will be completed end of 2008
Consolidation of MIPS in Germany
End 2006
12,500
16,650
End 2007
NL
Italy
FR I
FR II25,00027,300
End 2008 End 2009
UK
FR I
Already done in Q3 3 800 Mips

30 Atos Origin Q3 2008 revenues / 31 October 2008
61%
78%
90%
55%50%50%
44%
20%
95%
45%
2006 2007 sept-08 Target end2008
Target end2009
Spend in the yearly action plan scope
External spend covered by Purchasing
» Results from increased scope:
• Building lease negotiation, EUR 2 M cost reduction
• Software specification and contract change, EUR 2 M cost reduction
• Financial services contract, EUR 1 M cost reduction
• Refurbishing project, 60 % budget reduction
» 50% External spend managed centrally compared to 15% in 2007
» 55% strategic buyers of total number of resources in Purchasing compared to 15% in 2007
» Since Q3 2007 Global actions have been concluded for savings of EUR 44 M.
Global purchasing to reduce costs

31 Atos Origin Q3 2008 revenues / 31 October 2008
Agenda
» Q3 2008 highlights
» Q3 2008 Financial Performance
» Outcome of strategic review
» Focus on operational improvement
» Group actions vs new environment
» Market exposure
» Objectives 2008

32 Atos Origin Q3 2008 revenues / 31 October 2008
Actions on costs
» Low margin contracts improvement
» Tight control on all indirect costs incl. external fees
» Reduction of all travel & expenses
» Reduction of all trainings not related to revenue
Actions on staff
» Decrease of subcos» Accelerated streamlining» Specific caution on direct
staff recruitments» Freeze all indirect
recruitments incl. replacements
» Adaptation of bonus schemes
» Optimization of resources management
Group actions launched early September 2008
Actions on revenue
» Sales push plan
» Push increase of offshore
» Chase up unbilled revenue
The Group actions aimed at being better preparedfor new economic conditions

33 Atos Origin Q3 2008 revenues / 31 October 2008
Actions on Cash
» Reduction of CAPEX : strict control process both at Global and Local level.
» RFP to outsource datacenter operative assets (“box”, power, cooling, network, security)
» Objective: financing assets of one datacenter in France before year end
» Collection of overdue receivables in all geographies: specific process led by Group Finance by weekly reporting with strict follow-up in each country
Objective from 5.5% to 4.5% of revenue in 2009

34 Atos Origin Q3 2008 revenues / 31 October 2008
Management actions on internal governance
» Executive assessments on top 50 managers of the Group
» Review of operational staff and managers’ scorecard (more than 16,000 headcount) to align their focus on new environment
» Continue and reinforce control on Human Resources: hirings and subcos
» Speed up implementation of organizational changes

35 Atos Origin Q3 2008 revenues / 31 October 2008
Agenda
» Q3 2008 highlights
» Q3 2008 Financial Performance
» Outcome of strategic review
» Focus on operational improvement
» Group actions vs new environment
» Market exposure
» Objectives 2008

36 Atos Origin Q3 2008 revenues / 31 October 2008
Revenue profile by industry sector
PublicSector25%
Financial Services
22%Manufact.
15%
Telecoms15%
Retail10%
EnergyUtilities
9%
Group revenue profile by sector – YTD Sept '08
Atos Wordline,
MS in Germany
and France
Atos Worldline and
Retail banking
Other4%

37 Atos Origin Q3 2008 revenues / 31 October 2008
Revenue profile and growth sensitivity
AWL & BPO17%
Managed Services
37%SI Appl. Mgmt14%
SI Projects13%
SI Prof. Serv.13%
Cons.6%
Group revenue profile by business
YTD Sept '08
68 % recurringrevenues
+6%+4%+5%+2%+2%+5%Scenario 1
+4%+2%0%-5%-10%-10%Scenario 3+5%+3%+3%0%0%0%Scenario 2
Wordline & BPO
ManagedServices
Application Mngt
ProjectsProf. Services
Managed OperationsSystems IntegrationConsultingGrowth
assumptionsGroup aggregate
growth
+4%+2%
0%

38 Atos Origin Q3 2008 revenues / 31 October 2008
Financing » Credit lines and leverage ratio
- EUR 1.2 billion credit lines until May 2011, with EUR 1.1 billion until May 2012
- Current leverage (Net debt / EBITDA) below 1 vs covenant below 2.5
» In the current financial environment, Atos Origin has no short term issue of financing
» Significant progress in the CAPEX financing with expected first deal to be finalised before year-end
39 Atos Origin Q3 2008 revenues / 31 October 2008
Agenda
» Q3 2008 highlights
» Q3 2008 Financial Performance
» Outcome of strategic review
» Focus on operational improvement
» Group actions vs new environment
» Market exposure
» Objectives 2008

40 Atos Origin Q3 2008 revenues / 31 October 2008
Revenue objective for 2008
2008 revenue coverage as of Sept 08
95%
1%4%
BacklogPipeTo find
2007 revenue coverage as of Sept 07
94%
2%4%
BacklogPipeTo find
Objective of full year 2008 revenue organic growth above +5% confirmed
41 Atos Origin Q3 2008 revenues / 31 October 2008
Objectives for 2008
» Excluding Italy and AEMS Exchange disposed this year:
- Full year revenue organic growth above +5%
- On the scope representing more than 95% of total revenue (excluding non core geographies being divested), the Group should reach an operating margin at 5.5 per cent, an improvement by +100 basis points compared to 2007 in line with the objective. The non core geographies will experience a small operating loss in 2008. .

Atos, Atos and fish symbol, Atos Origin and fish symbol, Atos Consulting, and the fish symbol itself are registered trademarks of Atos Origin SA. 31/10/2008 00:11© 2006 Atos Origin. Private for the client. This report or any part of it, may not be copied, circulated, quoted without prior written approval from Atos Origin or the client.
Questions
Paris, 31 October 2008

43 Atos Origin Q3 2008 revenues / 31 October 2008
Contacts and agenda
Gilles Arditti – Head of Investor Relations – [email protected] [email protected]
5 February 2009
17 February 2009
Fourth Quarter 2008 revenue
Annual Results 2008

Atos, Atos and fish symbol, Atos Origin and fish symbol, Atos Consulting, and the fish symbol itself are registered trademarks of Atos Origin SA. 31/10/2008 00:11© 2006 Atos Origin. Private for the client. This report or any part of it, may not be copied, circulated, quoted without prior written approval from Atos Origin or the client.
Atos Origin Q3 2008 revenuesManagement Board Conference call
Paris, 31 October 2008