atmospheric pollution monitoring using gosat and gosat...
TRANSCRIPT

1International Workshop on Land Use/Cover Changes and Air Pollution in Asia ,
Bogor, Indonesia, August 4-7, 2015
International Workshop on Land Use/Cover Changes and Air Pollution in Asia
Atmospheric Pollution Monitoring Using GOSAT and GOSAT 2
Tsuneo MatsunagaNIES GOSAT-2 Project Team
National Institute for Environmental Studies (NIES), Japan
GOSAT (2009‐) GOSAT−2 (FY2017‐)
(c)Mitsubishi Electric Corporation(c)JAXA

2International Workshop on Land Use/Cover Changes and Air Pollution in Asia ,
Bogor, Indonesia, August 4-7, 2015
Today’s Topics
Status of GOSAT and GOSAT-2
GOSAT Air Pollution Watch
Preparation of GOSAT-2 Validation New TCCON site in Southeast Asia Test of smaller FTS

3International Workshop on Land Use/Cover Changes and Air Pollution in Asia ,
Bogor, Indonesia, August 4-7, 2015
GOSAT LaunchGOSAT (Greenhouse gases Observing Satellite) is the world’s first satellite dedicated to greenhouse gas monitoring from space.
GOSAT was successfully launched on January 23, 2009, and since then GOSAT has been monitoring the Earth’s atmosphere continuously.
The successor, GOSAT‐2, will be launched in FY2017. GOSAT‐2 design reviews for spacecraft, instruments, and ground data system are ongoing.Launch of GOSAT in 2009

4International Workshop on Land Use/Cover Changes and Air Pollution in Asia ,
Bogor, Indonesia, August 4-7, 2015
Announcement (August 4, 2015)
Around the noon of August 2nd, 2015 (Jananese Standard Time), the operation of Thermal Infrared (TIR) part of Fourier Transform Spectrometer (FTS) onboard GOSAT was terminated due to the sudden stop of its mechanical cooler to cool TIR detector to -200°C (≈ 70K).
No impacts have been found in Shortwave Infrared (SWIR) part of FTS and Cloud and Aerosol Imager (CAI) so far. Carbon dioxide and methane observation by SWIR and aerosol/cloud observation by CAI are continued without termination.
The root causes of the sudden stop of the cooler and treatments are under investigation.
GOSAT has finished its nominal operation period (5 years) in January 2014, and is currently in its extended operation period.

5International Workshop on Land Use/Cover Changes and Air Pollution in Asia ,
Bogor, Indonesia, August 4-7, 2015
GOSAT-2 CG
(c)Mitsubishi Electric Corporation
GOSAT-2 in Space
FTS-2 CAI-2

6International Workshop on Land Use/Cover Changes and Air Pollution in Asia ,
Bogor, Indonesia, August 4-7, 2015
Quick Overview of GOSAT and GOSAT-2
GOSAT Specifications GOSAT-2 Requirements
Launch year and life time Jan. 2009, 5 years FY2017, 5 years
Satellite(Main body size, mass, power)
3.7 x 1.8 x 2.0 m, 1750kg, 3.8KW (EOL)
5.3 x 2.0 x 2.8 m, <2000kg, 5.0KW
Orbit (Type, altitude, repeat cycle, equator crossing time)
Sun synchronous,666 km, 3 days, 13:00
Sun synchronous,613 km, 6 days, 13:00±15 min
Target gases CO2, CH4, O2, O3, H2O CO2, CH4, O2, O3, H2O, CO
Fourier Transform Spectrometer(FTS and FTS-2)
Band 1 : 0.76 – 0.78 µmBand 2 : 1.56 – 1.72 µmBand 3 : 1.92 – 2.08 µmBand 4 : 5.6 – 14.3 µm
IFOV = 10.5 kmPointing = ±20° (AT), ±35° (CT)Polarimetry = Band 1, 2, 3
Band 1 : 0.75 – 0.77 µmBand 2 : 1.56 – 1.69 µmBand 3 : 1.92 – 2.33 µmBand 4 : 5.5 – 8.4 µmBand 5 : 8.4 – 14.3 µmIFOV = 9.7 kmPointing = ±40° (AT), ±35° (CT)Polarimetry = Band 1, 2, 3
Cloud and Aerosol Imager(CAI and CAI-2)
NadirB1 = 380 nmB2 = 674 nmB3 = 870 nmB4 = 1600 nm
B1-B3 = 500 m / 1000 km, B4 = 1500 m / 750 km
B1-5: forward, B6-10:backwardB1 = 343 nm B6 = 380 nmB2 = 443 nm B7 = 550 nmB3 = 674 nm B8 = 674 nmB4 = 869 nm B9 = 869 nmB5 = 1630 nm B10= 1630 nmB1-B4, B6-B9= 460 m / 920 kmB5, B10 = 920 m / 920 km
Other new features of GOSAT-2 FTS-2
Intelligent pointing using FTS-2 FOV camera, fully programmable (target mode) observation, and improved SNR.

7International Workshop on Land Use/Cover Changes and Air Pollution in Asia ,
Bogor, Indonesia, August 4-7, 2015
GOSAT-2 FTS-2Optical Layout and External View
FTS-2 is designed based on CrIS(Cross-track Infrared Sounder ) onboard NASA’s Suomi NPP.

8International Workshop on Land Use/Cover Changes and Air Pollution in Asia ,
Bogor, Indonesia, August 4-7, 2015
GOSAT-2 Joint Project
Application of GOSAT-2 data to
environmental policy
Level 2 to 4 processing, validation,
and distribution of GOSAT-2 data
Design, development, test, launch, and operation of
GOSAT-2 spacecraft, and the calibration and Level 1
processing of GOSAT-2 data

9International Workshop on Land Use/Cover Changes and Air Pollution in Asia ,
Bogor, Indonesia, August 4-7, 2015
GOSAT Air Pollution Watch
• Japan has a satellite (GOSAT) and will have satelllites (GCOM-C and GOSAT-2) with sub km resolution UV imagers suitable for land aerosol / air pollution mapping (CAI, CAI-2, and SGLI).
• Combined use of these satellites will enable us to monitor land air pollution frequently (daily) in quasi-realtime.
• GOSAT Air Pollution Watch is being designed for rapid processing / distribution of GOSAT CAI data for monitoring of air pollution caused mainly by particulate matters. Its testbed is already developed.
• Data processing algorithms in GOSAT Air Pollution Watch are based on but modified from GOSAT/GOSAT-2 algorithms for aerosol product generation to realize faster and timely data processing.
• Data from GOSAT Air Pollution Watch will be used to inform the current distribution of the polluted air. In addition, they will contribute to short term prediction of air pollution using atmospheric transport models.

10International Workshop on Land Use/Cover Changes and Air Pollution in Asia ,
Bogor, Indonesia, August 4-7, 2015
GOSAT CAI Processing Flow(1) Cloud Mask
Discriminate clouds from land, urban polluted air, dust, and smokes. UV band brightness threshold (High UV reflectance => clouds) UV band spatial smoothness (Smooth => other than clouds) Current parameters are determined empirically using CAI images in
Russia, China, and SE Asia.
China, October 9, 2014 Dark grey pixels = CloudPink pixels = Urban polluted air
11International Workshop on Land Use/Cover Changes and Air Pollution in Asia ,
Bogor, Indonesia, August 4-7, 2015
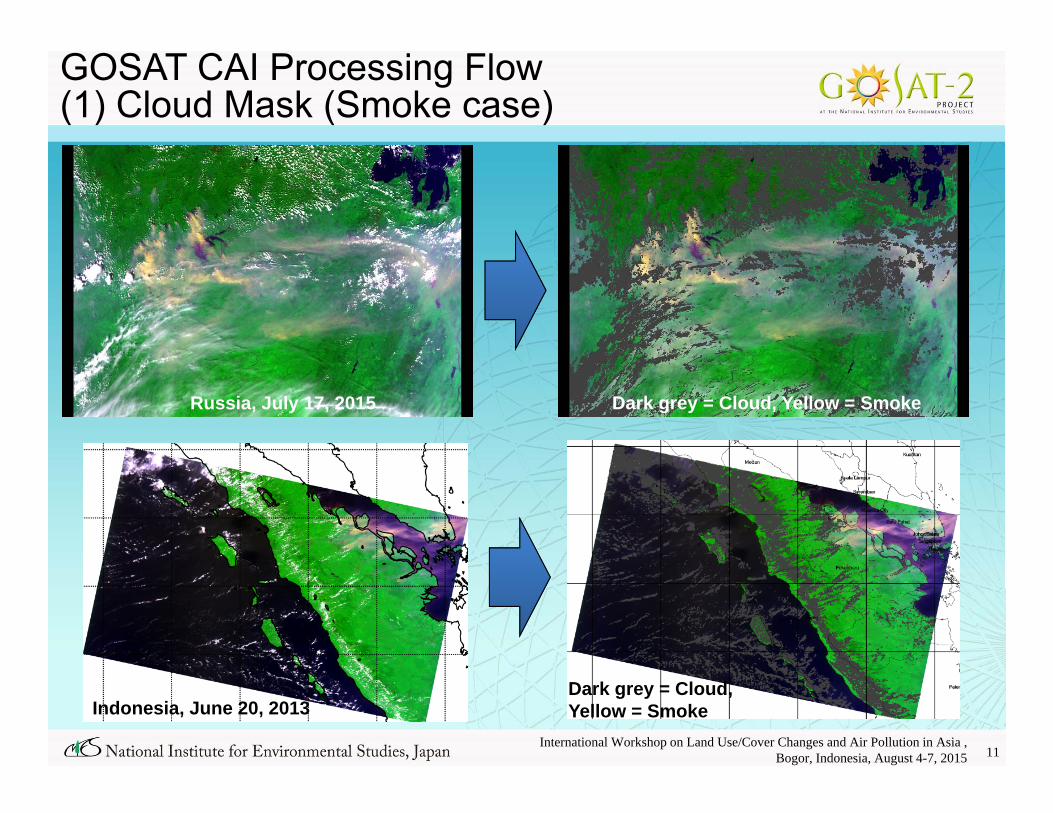
GOSAT CAI Processing Flow(1) Cloud Mask (Smoke case)
Dark grey = Cloud, Yellow = SmokeRussia, July 17, 2015
Dark grey = Cloud, Yellow = SmokeIndonesia, June 20, 2013

12International Workshop on Land Use/Cover Changes and Air Pollution in Asia ,
Bogor, Indonesia, August 4-7, 2015
GOSAT CAI Processing Flow(2) AOT(380nm) Estimation
Estimate Aerosol Optical Thickness at 380 nm for non-cloud pixels. Modified Kaufman Method (Fukuda et al., JGR, 2013) over land. Use difference between observed and theoretical aerosol free surface
reflectances in the UV region to estimate AOT (380).
China, October 9, 2014 AOT(380nm)
0 3

13International Workshop on Land Use/Cover Changes and Air Pollution in Asia ,
Bogor, Indonesia, August 4-7, 2015
GOSAT CAI Processing Flow(3) PM2.5 Estimation
Convert AOT(380nm) to PM2.5 concentration for non-cloud land pixels. Empirical regression using AOT (380nm), observed spectral
reflectances, PBL height, and humidity data is used in the conversion. PM2.5 data measured in Beijing (3 years) and Shenyang (1.6 years),
China, provided by US Embassy, are used in this study.
China, October 9, 2014
AOT(380nm)
0 3
PM2.5(g/m3)
100 300

14International Workshop on Land Use/Cover Changes and Air Pollution in Asia ,
Bogor, Indonesia, August 4-7, 2015
GOSAT CAI Processing Flow(3) PM2.5 Estimation – Regression Residuals -
Regression residuals for Beijing / Shenyang data suggest PM2.5 estimation error is about 30 – 40 %.
0
20
40
60
80
100
120
140
160
180
0 20 40 60 80 100 120
observed
predicted
PM2.5 = 0 – 100 mg/m3
RMSE = 21.4mg/m3
N = 145
PM2.5, GOSAT(µg/m3)
PM2.
5, G
roun
d(µg
/m3 )
Blue : Beijing, winterOrange : Beijing, summerGray : Shenyang, winterYellow : Shenyang, summer
PM2.5 = 0 – 500 mg/m3
RMSE = 67.8 mg/m3
N = 256
Beijing = 3 yearsShenyang = 1.6 years
Beijing = 3 yearsShenyang = 1.6 years
PM2.
5, G
roun
d(µg
/m3 )
PM2.5, GOSAT(µg/m3)

15International Workshop on Land Use/Cover Changes and Air Pollution in Asia ,
Bogor, Indonesia, August 4-7, 2015
GOSAT Air Pollution WatchSample 1: Indonesia June 20, 2013(P9F31)
PM2.5(g/m3)
100 300
Using Beijing/Shenyang regression

16International Workshop on Land Use/Cover Changes and Air Pollution in Asia ,
Bogor, Indonesia, August 4-7, 2015
GOSAT Air Pollution WatchSample 2: Indonesia June 23, 2013(P9F31)
PM2.5(g/m3)
100 300Using
Beijing/Shenyang regression

17International Workshop on Land Use/Cover Changes and Air Pollution in Asia ,
Bogor, Indonesia, August 4-7, 2015
Call for GOSAT Air Pollution Watch Partners
A testbed of GOSAT Air Pollution Watch was successfully developed using urban air pollution data from Beijing and Shenyang, China.
NIES would like to issue “Call for new GOSAT Air Pollution Watch partners” to extend the coverage of the testbed to Southeastern and South Asian countries. NIES will provide GOSAT raw and processed data (e.g.: air pollution maps) in quasi-real
time. Partners will provide local air pollution data (several years from 2009, hourly or higher
sampling) such as BC and PM2.5 concentrations for regression analysis.
The collaborative testbed will evolve into a multi-satellite system after GOSAT-2 and GCOM-C launches in coming years.
These activities may have close relationships to JCM (Joint Crediting Mechanism) activities between Japan and asian countries.
Contact : Tsuneo Matsunaga ([email protected])

18International Workshop on Land Use/Cover Changes and Air Pollution in Asia ,
Bogor, Indonesia, August 4-7, 2015
A New TCCON Site in Southeast Asia(Total Carbon Colunm Observing Network)
FY 2014• Potential sites were identified and
visited.• Bruker 125 HR FTS with solar tracker
were installed in the container at NIES.
a) Locations oh three candidate sites in Philippines, b) Landscape at Burgos, c) Installation of a container for FTS at NIES, d) A high resolution FTS in the container.
FY2015• Decide the site considering scientific,
logistical, and human resource aspects.
• Negotiate with various stakeholders and conclude MOU.
• Adjust and evaluate the newly procured FTS at NIES
FY2016• Conclude all the contracts• Move FTS from Tsukuba to the site
and start its operation
Burgos
a)
b)
c)
d)

19International Workshop on Land Use/Cover Changes and Air Pollution in Asia ,
Bogor, Indonesia, August 4-7, 2015
Smaller (cheaper) FTS are being tested...
Bruker 125 HR FTS is commonly used among TCCON stations. But it is so expensive and large to install many places.
Currently, cheaper and smaller FTS such as Bruker EM27 are being tested to evaluate its observation performance as well as easiness of operation and maintenance.
If smaller FTS work well, we may increase the number of validation sites especially in Southeast asia.
EM27 test in Railroad Valley, NV EM27 test at Caltech, CA

20International Workshop on Land Use/Cover Changes and Air Pollution in Asia ,
Bogor, Indonesia, August 4-7, 2015
Thank you for your attention.
For more information, send e-mails [email protected]
or
Visit our website:http://www.gosat-2.nies.go.jp

21International Workshop on Land Use/Cover Changes and Air Pollution in Asia ,
Bogor, Indonesia, August 4-7, 2015
Forest Fires in Indonesia andAtmospheric Pollution in Singapore
Singapore
Sumatra Is.
GOSAT CAI (June 20, 2013)
Singapore, morning of June 21, 2013(Reuter)

22International Workshop on Land Use/Cover Changes and Air Pollution in Asia ,
Bogor, Indonesia, August 4-7, 2015
Urban Atmospheric Pollution in ChinaObserved by GOSAT CAI
GOSAT CAI (Oct 2, 2013) GOSAT CAI (Oct 5, 2013)
Beijing Beijing
GOSAT Observationon Oct. 2
GOSAT Observationon Oct. 5
In Beijing (October 5, 2013)
Photo by W. Takeuchi (Univ. Tokyo)