atmospheric mixing ratios of methyl ethyl ketone (2 …. m. yáñez-serrano et al.: atmospheric...
TRANSCRIPT
Atmos. Chem. Phys., 16, 10965–10984, 2016www.atmos-chem-phys.net/16/10965/2016/doi:10.5194/acp-16-10965-2016© Author(s) 2016. CC Attribution 3.0 License.
Atmospheric mixing ratios of methyl ethyl ketone (2-butanone) intropical, boreal, temperate and marine environmentsA. M. Yáñez-Serrano1,2,a, A. C. Nölscher1,b, E. Bourtsoukidis1, B. Derstroff1, N. Zannoni3, V. Gros3, M. Lanza4,J. Brito5, S. M. Noe6, E. House7, C. N. Hewitt7, B. Langford8, E. Nemitz8, T. Behrendt1,c, J. Williams1, P. Artaxo5,M. O. Andreae1,9, and J. Kesselmeier1
1Biogeochemistry and Air Chemistry Departments, Max Planck Institute for Chemistry, P.O. Box 3060,55020 Mainz, Germany2Instituto Nacional de Pesquisas da Amazônia (INPA), Av. André Araújo 2936, Manaus-AM, 69083-000, Brazil3Laboratoire des Sciences du Climat et de l’Environnement, LSCE/IPSL, CEA-CNRS-UVSQ, Université Paris-Saclay,91191 Gif-sur-Yvette, France4IONICON Analytik GmbH, Eduard-Bodem-Gasse 3, 6020, Innsbruck, Austria5Instituto de Física, Universidade de São Paulo (USP), Rua do Matão, Travessa R, 187, CEP 05508-900, São Paulo-SP, Brazil6Institute of Agricultural and Environmental Sciences, Estonian University of Life Sciences, Kreutzwaldi 1,51014 Tartu, Estonia7Lancaster Environment Centre, Lancaster University, Lancaster, LA1 4YQ, UK8Centre for Ecology & Hydrology, Penicuik, EH26 0QB, UK9Scripps Institution of Oceanography, University of California San Diego, La Jolla, CA 92037, USAanow at: Department of Ecosystem Physiology, University of Freiburg, 79085 Freiburg, Germanybnow at: Division of Geological and Planetary Sciences, California Institute of Technology, Pasadena, CA 91125, USAcnow at: Department of Biogeochemical Processes, Max Planck Institute for Biogeochemistry, Hans-Knöll-Str. 10,07745 Jena, Germany
Correspondence to: A. M. Yáñez-Serrano ([email protected])
Received: 12 April 2016 – Published in Atmos. Chem. Phys. Discuss.: 25 April 2016Revised: 10 August 2016 – Accepted: 17 August 2016 – Published: 6 September 2016
Abstract. Methyl ethyl ketone (MEK) enters the atmospherefollowing direct emission from vegetation and anthropogenicactivities, as well as being produced by the gas-phase ox-idation of volatile organic compounds (VOCs) such as n-butane. This study presents the first overview of ambientMEK measurements at six different locations, characteris-tic of forested, urban and marine environments. In order tounderstand better the occurrence and behaviour of MEK inthe atmosphere, we analyse diel cycles of MEK mixing ra-tios, vertical profiles, ecosystem flux data, and HYSPLITback trajectories, and compare with co-measured VOCs.MEK measurements were primarily conducted with proton-transfer-reaction mass spectrometer (PTR-MS) instruments.Results from the sites under biogenic influence demonstratethat vegetation is an important source of MEK. The diel cy-cle of MEK follows that of ambient temperature and the
forest structure plays an important role in air mixing. Atsuch sites, a high correlation of MEK with acetone was ob-served (e.g. r2
= 0.96 for the SMEAR Estonia site in a re-mote hemiboreal forest in Tartumaa, Estonia, and r2
= 0.89at the ATTO pristine tropical rainforest site in central Ama-zonia). Under polluted conditions, we observed strongly en-hanced MEK mixing ratios. Overall, the MEK mixing ra-tios and flux data presented here indicate that both biogenicand anthropogenic sources contribute to its occurrence in theglobal atmosphere.
Published by Copernicus Publications on behalf of the European Geosciences Union.
10966 A. M. Yáñez-Serrano et al.: Atmospheric mixing ratios of methyl ethyl ketone (2-butanone)
1 Introduction
Methyl ethyl ketone (C4H8O; MEK, also known as 2-butanone, butanone, methyl acetone, butan-2-one, methyl-propanone and ethyl methyl ketone) is an oxygenated volatileorganic compound (OVOC). Its occurrence in the atmospherehas been reported over a wide range of environments (Ceci-nato et al., 2002; Hellén et al., 2004; Ho et al., 2002; Kimet al., 2015; McKinney et al., 2011; Singh et al., 2004) withtypical mixing ratios of 0.03–4 ppb (Ciccioli and Mannozzi,2007; Kim et al., 2015). Although often being measuredalongside other volatile organic compounds (VOCs), atmo-spheric MEK has received little attention to date. The pho-tochemistry of acetone may serve as an example of how ke-tones affect the composition and chemistry of the atmosphereby delivering free radicals to the upper troposphere (Colombet al., 2006; Finlayson-Pitts and Pitts, 2000; McKeen et al.,1997) and thus increasing the ozone formation potential andaltering the oxides of nitrogen (NOx) regime (Ciccioli andMannozzi, 2007; Folkins et al., 1998; Prather and Jacob,1997). This understanding may be transferred to MEK, asthis molecule is structurally similar to acetone, with a com-parable absorption spectrum (Martinez et al., 1992). Severalstudies report that the mixing ratio of MEK in the free tro-posphere is roughly one-quarter of that of acetone (Moore etal., 2012; Singh et al., 2004). However, MEK is about an or-der of magnitude more reactive than acetone with respect tothe hydroxyl radical (OH) (Atkinson, 2000), which makes ita compound of interest in ongoing discussions about the in-ability to fully account for the reactivity of OH (Nölscher etal., 2016).
There are several known but poorly characterised sourcesof MEK to the atmosphere. Terrestrial vegetation (Bracho-Nunez et al., 2013; Brilli et al., 2014; Davison et al., 2008;De Gouw et al., 1999; Isidorov et al., 1985; Jardine et al.,2010; Kirstine et al., 1998; König et al., 1995; McKinneyet al., 2011; Ruuskanen et al., 2011; Song and Ryu, 2013;Steeghs et al., 2004; Wilkins, 1996; Yáñez-Serrano et al.,2015), fungi (Wheatley et al., 1997) and bacteria (Song andRyu, 2013; Wilkins, 1996) are known to emit MEK. It is alsoemitted directly by several anthropogenic sources, includinganthropogenic biomass burning (Andreae and Merlet, 2001),solvent evaporation (Kim et al., 2015; Legreid et al., 2007)and vehicle exhaust (Bon et al., 2011; Brito et al., 2015; Liuet al., 2015; Verschueren, 1983). In addition, MEK can beformed via the atmospheric oxidation of other compounds(de Gouw et al., 2003; Jenkin et al., 1997; Neier and Strehlke,2002; Sommariva et al., 2011).
Looking in more detail at biogenic sources, MEK emis-sions have been observed from different types of vegetation,including forest canopies (Brilli et al., 2014; Jordan et al.,2009b; Yáñez-Serrano et al., 2015), pasture (Davison et al.,2008; De Gouw et al., 1999; Kirstine et al., 1998) and clover(De Gouw et al., 1999; Kirstine et al., 1998). The MEK pro-duction and release mechanisms are manifold but poorly un-
derstood. Studies show higher MEK emissions after cuttingand drying of leaves than under no-stress conditions (Davi-son et al., 2008; De Gouw et al., 1999). Due to the watersolubility of MEK in leaves and on surfaces (Sander, 2015),Jardine et al. (2010) suggested MEK emissions to be depen-dent on evaporation from storage pools in leaves. It has beensuggested that MEK takes part in tri-trophic signalling fol-lowing herbivore attack (Jardine et al., 2010; Song and Ryu,2013). The roots of plants have also been found to releaseMEK in root–aphid interactions (Steeghs et al., 2004). De-caying plant tissue may also act as a source of MEK tothe atmosphere (Warneke et al., 1999). Furthermore, somestudies indicate the importance of MEK emissions by mi-crobes, such as Brevibacterium linens, Bacillus spp. and ther-mophilic Gram-positive actinomycetes bacteria (Song andRyu, 2013; Wilkins, 1996), and fungi such as Trichodermaspp. (Wheatley et al., 1997).
MEK not only enters the atmosphere via direct emis-sions but also results from the atmospheric photooxidationof VOCs such as n-butane, 2-butanol, 3-methyl pentane and2-methyl-1-butene (de Gouw et al., 2003; Jenkin et al., 1997;Neier and Strehlke, 2002; Sommariva et al., 2011). Althoughbutane in the atmosphere comes predominantly from an-thropogenic sources (Kesselmeier and Staudt, 1999), somestudies have reported emission of n-butane from vegetation(Donoso et al., 1996; Greenberg and Zimmerman, 1984; Hel-lén et al., 2006; König et al., 1995; Zimmerman et al., 1988).The MEK yield from n-butane oxidation is ∼ 80 % (Singhet al., 2004). It is important to note that no mechanisticpathways have been found for atmospheric MEK productionfrom the dominant biogenic VOCs isoprene, α-pinene and β-pinene, as well as from methyl butenol oxidation (Rollins etal., 2009; Singh et al., 2004).
In the atmosphere MEK reacts mainly with OH (kOH =
1.15× 10⁻¹² cm3 s−1) (Chew and Atkinson, 1996), whilereactions with O3 and NO3 are very slow during the dayand hence negligible (Atkinson and Arey, 2003). MEK hasa lifetime of 5.4 days at an OH concentration of 1.6×10⁶ radicals cm−3, whereas isoprene and acetone have life-times of 8.2 h and 38 days, respectively, under the same con-ditions (Grant et al., 2008). The atmospheric degradation ofMEK leads to acetaldehyde and formaldehyde formation. Inthe presence of NOx , MEK can lead to peroxyacetyl nitrate(PAN) and ozone formation (Grosjean et al., 2002; Pinho etal., 2005). In the upper troposphere, MEK photolyses and re-generates OH (Atkinson, 2000; Baeza Romero et al., 2005;De Gouw et al., 1999), as does acetone, potentially increas-ing ozone formation.
Anthropogenic biomass burning leads to significant MEKemissions of about 2 Tg a−1 globally (Andreae and Merlet,2001, and unpublished updates; Schauer et al., 2001). Fur-thermore, about 9 Tg a−1 of other C4 compounds is emit-ted by biomass burning, which may act as MEK precur-sors. Another strong source of MEK is biofuel and char-coal combustion, with emissions of ∼ 830 mg kg−1 of dry
Atmos. Chem. Phys., 16, 10965–10984, 2016 www.atmos-chem-phys.net/16/10965/2016/
A. M. Yáñez-Serrano et al.: Atmospheric mixing ratios of methyl ethyl ketone (2-butanone) 10967
biomass (compared to an emission rate of ∼ 260 mg kg−1 ofdry mass for biomass burning of savannah and grassland veg-etation types; Andreae and Merlet, 2001). Despite the factthat biomass burning emission rates have been fairly wellcharacterised, vehicular emissions, food cooking, industrialactivities, cigarette smoke and other anthropogenic sourceshave not been characterised. Even though MEK is present inurban atmospheres, there are no observations of MEK emis-sions from vehicles. Most of the urban MEK is released tothe atmosphere via evaporation from chemical plants and in-dustrial and household applications, as it is widely used as asolvent (e.g. in glues and as a paint thinner). It has a low toxi-city and is not carcinogenic (National Center for Biotechnol-ogy, 2015). As its manufacturing has been increasing in thelast 10 years, global atmospheric mixing ratios have probablyincreased as well.
Here we report recent findings on MEK from six differentsites, including biogenic- and anthropogenic-dominated en-vironments, in order to understand MEK sources in differentenvironments. Our large dataset allows a closer view of thisimportant, almost ubiquitous species in Earth’s atmosphere.
2 Sites and methodology
The field sites compared in our study cover areas from pris-tine to remote anthropogenically influenced tropical forests,as well as boreal and Mediterranean regions. Measure-ments were performed using proton-transfer-reaction massspectrometry (PTR-MS) and partly complemented by gaschromatography–flame ionisation detection (GC-FID) andgas chromatography–mass spectrometry (GC-MS) analyticaltechniques (Fig. 1, Table 1).
Online MEK measurements were performed withquadrupole PTR-MSs (Ionicon Analytic GmbH, Austria;Lindinger et al., 1998) at all sites except for CYPHEX,where a proton transfer reaction time-of-flight mass spec-trometer (PTR-ToF-MS, Ionicon Analytic GmbH, Austria;Jordan et al., 2009a) was used. The PTR-MSs were operatedat standard conditions (2.2 mbar drift pressure, 600 V driftvoltage, 142 Td for ATTO and SMEAR Estonia; 2.0 mbardrift pressure, 550 V drift voltage, 129 Td, for TT34;2.2 mbar drift pressure, 600 V drift voltage, 135 Td forO3HP; 2.2 mbar drift pressure, 560 V drift voltage, 132 Tdfor T2; and 2.2 mbar drift pressure, 600 V drift voltage,137 Td for CYPHEX).
Periodic background measurements and weekly humidcalibrations were performed at all sites. Gravimetrically pre-pared multicomponent standards were obtained from Apel &Riemer, USA, for ATTO, TT34, T2 and CYPHEX and fromIonicon Analytik GmbH, Austria, for O3HP and SMEAR Es-tonia.
2.1 The Amazon Tall Tower Observatory, ATTO:pristine tropical rainforest (Amazon, Brazil)
The Amazon Tall Tower Observatory (ATTO) site is lo-cated in central Amazonia, 150 km NE of Manaus, Brazil(Fig. 1), within a pristine primary tropical rainforest. Thesite is equipped with a tall tower (325 m) and two 80 m tow-ers. One of them (02◦08′38.8′′ S, 58◦59′59.5′′W) is an 80 mwalk-up tower, where the trace gas measurements take place.It is surrounded by a forest with a canopy height of ap-proximately 35 m and with at least 417 different tree speciesamong 7293 screened trees of ≥ 10 cm diameter at breastheight (DBH) in the twelve 1 ha inventoried plots (Andreaeet al., 2015). The climate of this site is typical for tropicalrainforests with a drier season (July–October) and a wet sea-son (December–April; Nobre et al., 2009).
Measurements for this study took place 18 February–15 March 2014. They were carried out at seven differentheights (0.05, 0.5, 4, 24, 53 and 79 m) with the PTR-MSswitching sequentially between each height in 2 min inter-vals. The inlet lines were made of PTFE (9.5 mm OD), in-sulated and heated to 50 ◦C, and had PTFE particle inlet fil-ters. More information about the gradient system and PTR-MS operation at ATTO can be found elsewhere (Nölscher etal., 2016; Yáñez-Serrano et al., 2015). The limit of detection(LOD) and uncertainty in the PTR-MS were 0.05 ppb and34 %, respectively.
Additionally, ambient samples for offline measurementswith GC-FID were taken on 11 March 2014 from 08:30 to11:00 LT. They were collected at 24 m using a GSA SG-10-2 personal sampler pump and adsorber tubes (130 mgof Carbograph 1 (90 m2 g−1) followed by 130 mg of Car-bograph 5 (560 m2 g−1)). The size of the Carbograph par-ticles was in the range of 20–40 mesh. Carbograph 1 and5 were provided by Lara s.r.l. (Rome, Italy). Samples werecollected for 20 min with a flow of 167 mL min−1 passingabout 3.3 L of ambient air through the adsorbent. Cartridgeswere transported to the laboratory for analysis by a PerkinElmer Autosystem XL GC-FID. These samples generallymatched the results of the PTR-MS. For details on samplingsee Kesselmeier et al. (2002).
2.2 TT34: remote tropical rainforest (Amazon, Brazil)
The ZF2 site is located in the Reserva Biologica do Cuieirasin central Amazonia, 60 km NNW of Manaus (2◦35′39.4′′ S,60◦12′33.4′′W) within a remote primary tropical rainforest(Fig. 1). The site is equipped with two towers, TT34 and theK34. The TT34 triangular tower is 40 m high and embeddedwithin the forest with a canopy height of approximately 30 m.The biodiversity of this site is also high and the climate isvery similar to that at the ATTO site. More information aboutthe site can be found elsewhere (Karl et al., 2009; Martin etal., 2010).
www.atmos-chem-phys.net/16/10965/2016/ Atmos. Chem. Phys., 16, 10965–10984, 2016
10968 A. M. Yáñez-Serrano et al.: Atmospheric mixing ratios of methyl ethyl ketone (2-butanone)
Table 1. Measurement sites, site environment, sampling dates, methods used and sampling heights.
Site Characteristics Canopy height Time of sampling Technique Type ofmeasurement
Measurementheights
ATTO(Brazil)
Pristine tropicalrainforest
35 m dense veg. Feb/Mar 2014 PTR-MSGC-FID (samples for of-fline analysis, collectedvolume= 3.34 L)
Ambient 0.05, 0.5, 4, 24,38, 53, 79 m24 m
TT34(Brazil)
Remote tropicalrainforest
30 m dense veg. Sep 2013–Jul 2014 PTR-MS Ambient,includingcanopy-scalefluxes
41 m
SMEAR(Estonia)
Remote hemibo-real forest
16–20 m denseveg.
Jun, Jul, Oct 2012Oct 2012
GC-MS (samples for of-fline analysis, collectedvolume= 6 L)PTR-MS
Ambient, plant,soil enclosureAmbient, plantenclosure
2, 20 m
16 m
O3HP(France)
Rural temperateforest
5 m sparse veg. May–Jun 2014 PTR-MS Ambient 2 m
T2(Brazil)
Mixed urban-and rainforest-influenced envi-ronment
Influence fromveg. nearby
Feb–Apr 2014Jul–Oct 2014
PTR-MS Ambient 14 m
CYPHEX(Cyprus)
Mixed marine,rural environmentinfluenced byaged air masses
None, on top ofa hill
Jul–Aug 2014 PTR-TOF-MS Ambient 8 m
Measurements for this study were made from 1 Septem-ber 2013 to 20 July 2014 at 41 m, at a fast rate (0.5 Hz)for virtual disjunct eddy covariance (vDEC) flux derivationstechniques (Karl et al., 2002; Langford et al., 2009; Rinneet al., 2002). The high-resolution data were further aver-aged to give 30 min concentration and flux data. Wind vectordata were obtained with a sonic anemometer (Gill R3, USA)mounted at the top of the tower close to the PTR-MS in-let. The PTR-MS inlet line was made of PFA (12.7 mm OD)(PFA-T8-062-100, Swagelok) and was insulated and heatedto 40 ◦C inside the air-conditioned cabin. The LOD anduncertainty averaged 30 min concentrations measurementswere 0.18 ppb and 6 %, respectively.
2.3 Station for Measuring Ecosystem-AtmosphereRelations, SMEAR Estonia: remote hemiborealforest (Tartumaa, Estonia)
The Station for Measuring Ecosystem-Atmosphere Relations(SMEAR Estonia) site is located in the Järvselja Experi-mental Forestry station in Tartumaa, SE Estonia (58◦16′ N27◦16′ E), within a remote hemiboreal zone, far from majoranthropogenic disturbances (Noe et al., 2011; Fig. 1). Thesite is equipped with a tower of 24 m height. The surround-ing canopy is about 16–20 m in height and the remote hemi-boreal forest consists of a mixture of tree species, with Nor-way spruce (Picea abies) dominating. The climate is boreal
with a growing season of 170–180 days. More informationabout the site can be found elsewhere (e.g. Bourtsoukidis etal., 2014a; Noe et al., 2011, 2016).
The measurements were made between 3 and 17 Octo-ber 2012. Sampling was done using a dynamic, automatedglass enclosure with measurement cycles of 36 s. The inletline (9.5 mm OD) was made of glass and was insulated andheated to 70 ◦C. A dynamic exchange enclosure was used tomeasure emission rates from a Norway spruce branch locatedin the upper canopy at 16 m. While the focus of this study wasthe quantification of emission rates of MEK from a Norwayspruce tree, ambient mixing ratios were derived as well us-ing the box model described in Bourtsoukidis et al. (2014b).The LOD and uncertainty of the PTR-MS were 0.04 ppb and28 %, respectively.
Furthermore, at SMEAR Estonia, offline measurementswith a GC-MS were carried out for periods of 3 days eachin June and July 2012, with samples taken every 4 h at twoheights (2 and 20 m). Samples for GC-MS analysis were alsotaken from cuvettes enclosing some common plant species atthe site (Table 1). In addition, VOC emissions from soil litterwere monitored monthly. The air samples were drawn intomulti-bed stainless steel cartridges (10.5 cm length, 3 mm in-ner diameter, Supelco, Bellefonte, PA, USA) filled with Car-botrap C 20/40 mesh (0.2 g), Carbopack C 40/60 mesh (0.1 g)and Carbotrap X 20–40 mesh (0.1 g) adsorbents (Supelco).Even though the site usually experiences low ozone mix-
Atmos. Chem. Phys., 16, 10965–10984, 2016 www.atmos-chem-phys.net/16/10965/2016/
A. M. Yáñez-Serrano et al.: Atmospheric mixing ratios of methyl ethyl ketone (2-butanone) 10969
TT34
ATTO
T2
O3HP
SMEAR
CYPHEX
Red: primary anthropogenically affectedGreen: primary biogenically affected
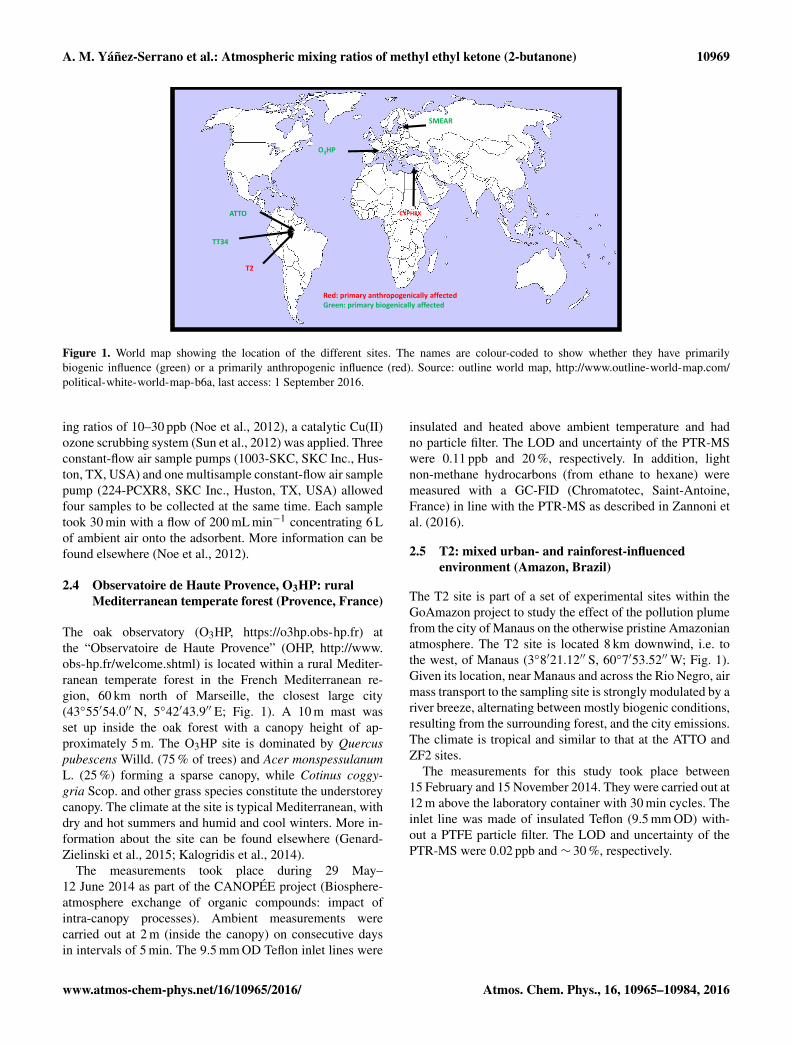
Figure 1. World map showing the location of the different sites. The names are colour-coded to show whether they have primarilybiogenic influence (green) or a primarily anthropogenic influence (red). Source: outline world map, http://www.outline-world-map.com/political-white-world-map-b6a, last access: 1 September 2016.
ing ratios of 10–30 ppb (Noe et al., 2012), a catalytic Cu(II)ozone scrubbing system (Sun et al., 2012) was applied. Threeconstant-flow air sample pumps (1003-SKC, SKC Inc., Hus-ton, TX, USA) and one multisample constant-flow air samplepump (224-PCXR8, SKC Inc., Huston, TX, USA) allowedfour samples to be collected at the same time. Each sampletook 30 min with a flow of 200 mL min−1 concentrating 6 Lof ambient air onto the adsorbent. More information can befound elsewhere (Noe et al., 2012).
2.4 Observatoire de Haute Provence, O3HP: ruralMediterranean temperate forest (Provence, France)
The oak observatory (O3HP, https://o3hp.obs-hp.fr) atthe “Observatoire de Haute Provence” (OHP, http://www.obs-hp.fr/welcome.shtml) is located within a rural Mediter-ranean temperate forest in the French Mediterranean re-gion, 60 km north of Marseille, the closest large city(43◦55′54.0′′ N, 5◦42′43.9′′ E; Fig. 1). A 10 m mast wasset up inside the oak forest with a canopy height of ap-proximately 5 m. The O3HP site is dominated by Quercuspubescens Willd. (75 % of trees) and Acer monspessulanumL. (25 %) forming a sparse canopy, while Cotinus coggy-gria Scop. and other grass species constitute the understoreycanopy. The climate at the site is typical Mediterranean, withdry and hot summers and humid and cool winters. More in-formation about the site can be found elsewhere (Genard-Zielinski et al., 2015; Kalogridis et al., 2014).
The measurements took place during 29 May–12 June 2014 as part of the CANOPÉE project (Biosphere-atmosphere exchange of organic compounds: impact ofintra-canopy processes). Ambient measurements werecarried out at 2 m (inside the canopy) on consecutive daysin intervals of 5 min. The 9.5 mm OD Teflon inlet lines were
insulated and heated above ambient temperature and hadno particle filter. The LOD and uncertainty of the PTR-MSwere 0.11 ppb and 20 %, respectively. In addition, lightnon-methane hydrocarbons (from ethane to hexane) weremeasured with a GC-FID (Chromatotec, Saint-Antoine,France) in line with the PTR-MS as described in Zannoni etal. (2016).
2.5 T2: mixed urban- and rainforest-influencedenvironment (Amazon, Brazil)
The T2 site is part of a set of experimental sites within theGoAmazon project to study the effect of the pollution plumefrom the city of Manaus on the otherwise pristine Amazonianatmosphere. The T2 site is located 8 km downwind, i.e. tothe west, of Manaus (3◦8′21.12′′ S, 60◦7′53.52′′W; Fig. 1).Given its location, near Manaus and across the Rio Negro, airmass transport to the sampling site is strongly modulated by ariver breeze, alternating between mostly biogenic conditions,resulting from the surrounding forest, and the city emissions.The climate is tropical and similar to that at the ATTO andZF2 sites.
The measurements for this study took place between15 February and 15 November 2014. They were carried out at12 m above the laboratory container with 30 min cycles. Theinlet line was made of insulated Teflon (9.5 mm OD) with-out a PTFE particle filter. The LOD and uncertainty of thePTR-MS were 0.02 ppb and ∼ 30 %, respectively.
www.atmos-chem-phys.net/16/10965/2016/ Atmos. Chem. Phys., 16, 10965–10984, 2016

10970 A. M. Yáñez-Serrano et al.: Atmospheric mixing ratios of methyl ethyl ketone (2-butanone)
30
25
20
15
10Tem
perature ºC
00:00 18:00Local time
2000
1500
1000
500
0PAR
µmol m
-2 s-1
00:00 18:00
dat
0.4
0.3
0.2
0.1
0.0
MEK
ppb
00:00 18:00
dat
ATTO SMEAR Estonia O3HP
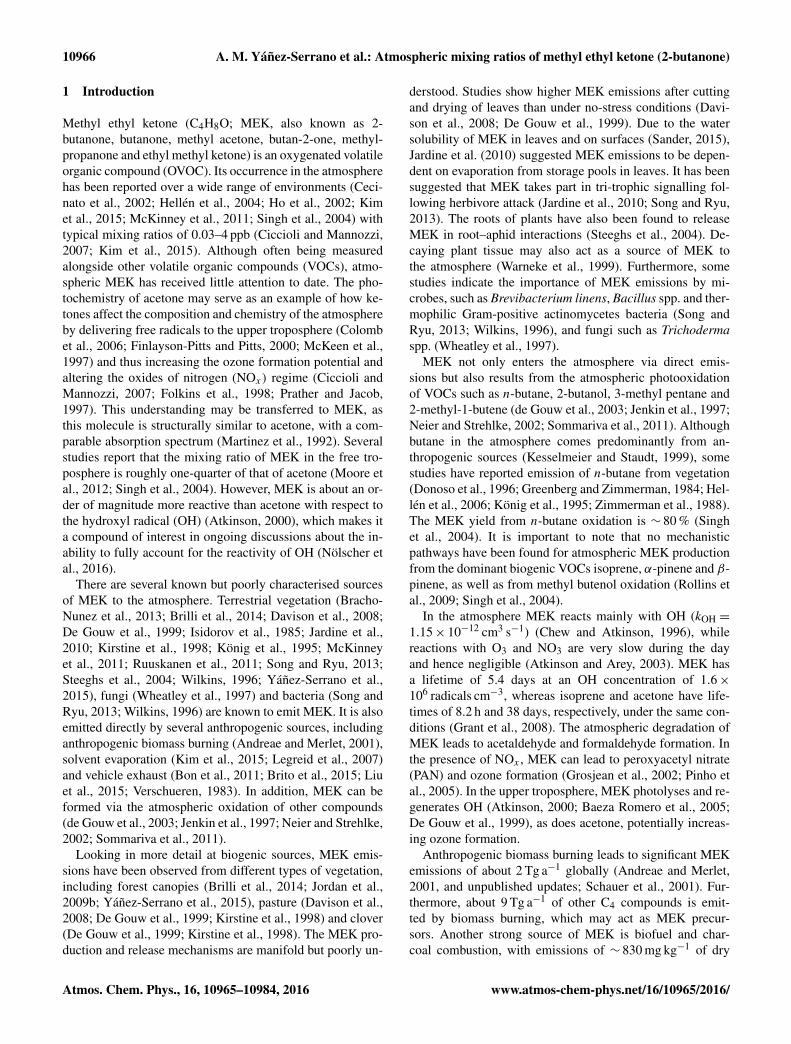
Figure 2. Hourly average diel cycles of MEK at the ATTO (left), SMEAR Estonia (middle) and O3HP (right) sites, for the period ofmeasurements (wet season 2014 for ATTO at 38 m October 2014 for SMEAR Estonia at 16 m, and May and June 2014 for O3HP at 2 m).Hourly mean diel cycles of temperature and PAR are also shown in red and grey, respectively. Error bars represent the standard deviations.
2.6 CYPHEX: mixed marine, rural environmentinfluenced by aged air masses (Cyprus)
The Cyprus Photochemistry Experiment (CYPHEX) cam-paign took place at a site located in the NW inshore part ofCyprus, in the Paphos region (34◦57′50.0′′ N, 32◦22′37.0′′ E)(Fig. 1). The site experiences mixed marine and rural emis-sions influence. The climate is Mediterranean, warm and dry,and shrubs and small trees dominate the sparse vegetation.
The measurements took place during July and Au-gust 2014 without a single rain event. Instruments were in-stalled inside containers and connected to a stack inlet thatreached up 5 m above the container roofs. Air was drawnthrough the 8 m stack inlet of 0.5 m with high flow rate(10 L min−1) to minimise wall losses. The subsampling in-let line was made of Teflon (13 mm OD), was insulated andheated to 35 ◦C, and had a PTFE inlet particle filter. The LODand uncertainty of the PTR-MS were 0.02 ppb and 11 %, re-spectively.
3 Results
3.1 Sites dominated by biogenic emissions
All the pristine or remote sites studied were characterisedby relatively low mixing ratios of nitrogen oxides (NOx)(< 3 ppb of nitrogen dioxide (NO2) for O3HP (Kalogridiset al., 2014; Zannoni et al., 2016), 0.2–0.8 ppb of NOx forSMEAR Estonia, and < 1 ppb NOx for the Amazon rainfor-est (Kuhn et al., 2010)). The diel cycles of MEK at thesesites followed a comparable pattern (Fig. 2), where MEKmixing ratios were highest in the middle of the day, fol-lowing the maxima of light and air temperature. The dom-inant source at these sites was considered to be biogenic.Mixing ratios of MEK correlated well with ambient tem-perature (r2
= 0.57 (ATTO), r2= 0.83 (SMEAR), r2
= 0.47(O3HP)), while it was less well correlated with photosynthet-ically active radiation (PAR) (r2
= 0.23 (ATTO), r2= 0.26
(SMEAR), r2= 0.67 (O3HP)). This suggests that ambient
temperature predominantly influenced MEK emission ratesfrom plants.
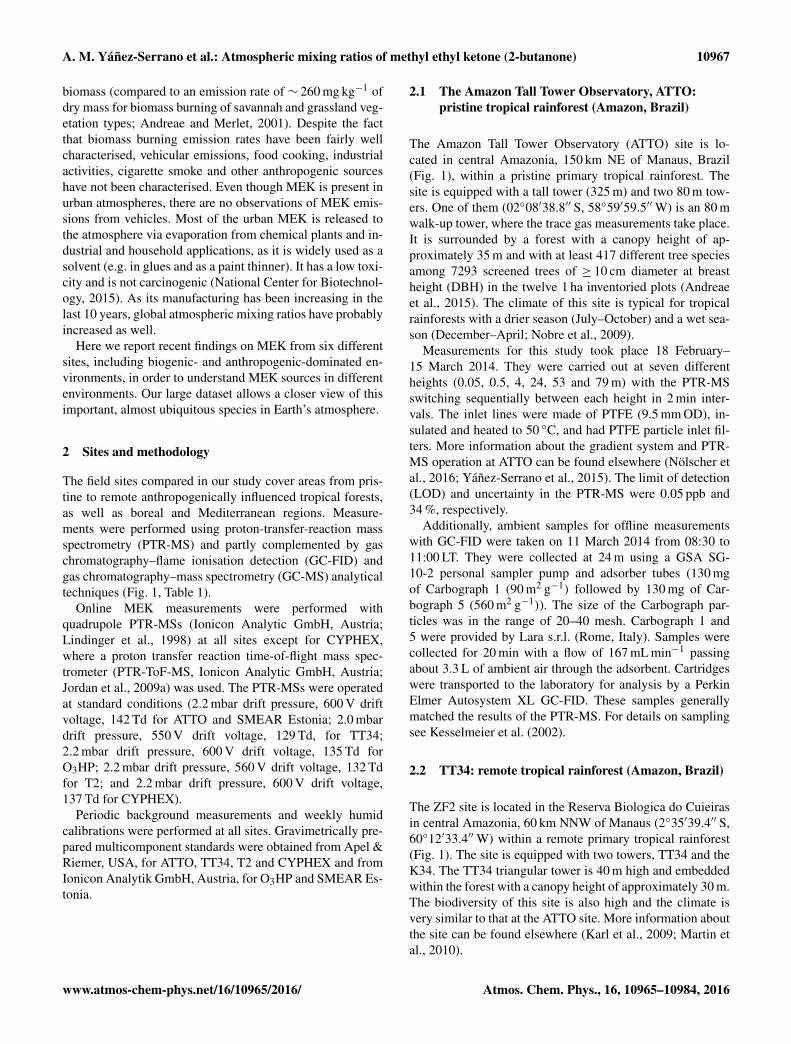
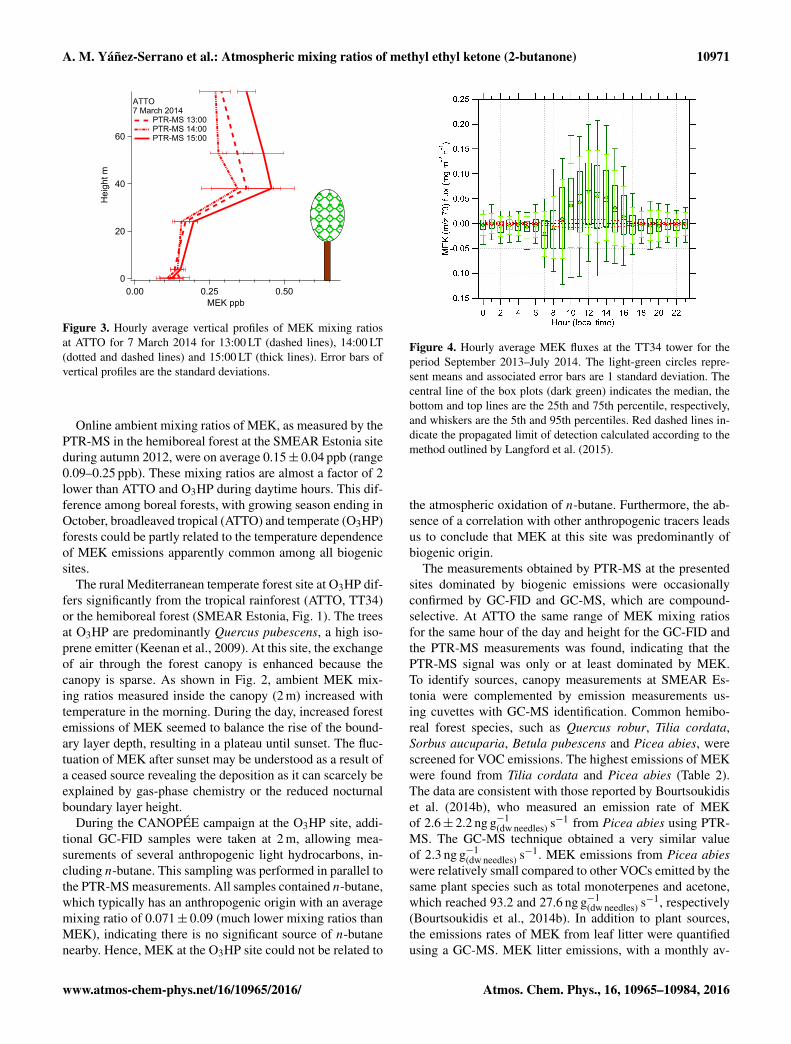
The vertical observations at ATTO revealed a strong dielvariability in the magnitude and vertical distribution of MEKmixing ratios throughout the forest canopy and in the atmo-sphere above. Figure 3 shows an example of an hourly verti-cal profile of MEK for 1 day (7 March 2014) from 13:00 to15:00 LT, from the ground to the atmosphere, suggesting thatthe canopy top is the major source of MEK at the site on suchdays. Similar concentration gradients were found for 83 %(for the afternoon hours) and 45 % (for the morning hours)of all days of measurements. In addition, MEK mixing ratiosdecreased significantly beneath the canopy towards the for-est floor, possibly due to dry deposition or generally smallervegetation emissions due to less light and temperature. How-ever, a possible production from the ozonolysis of alkanesor bidirectional plant exchange cannot be ruled out. For aseasonal comparison, Yáñez-Serrano et al. (2015) reported0.43 ppb of MEK for the dry season (September 2013) and0.13 ppb of MEK for the wet season (February–March 2013)at 38 m. Curiously, at 24 m, MEK mixing ratios for the wetseason were 0.38 ppb, very close to the measured values forthis study. Possible differences in canopy structure temper-ature and solar radiation among years may be the cause forthis discrepancy.
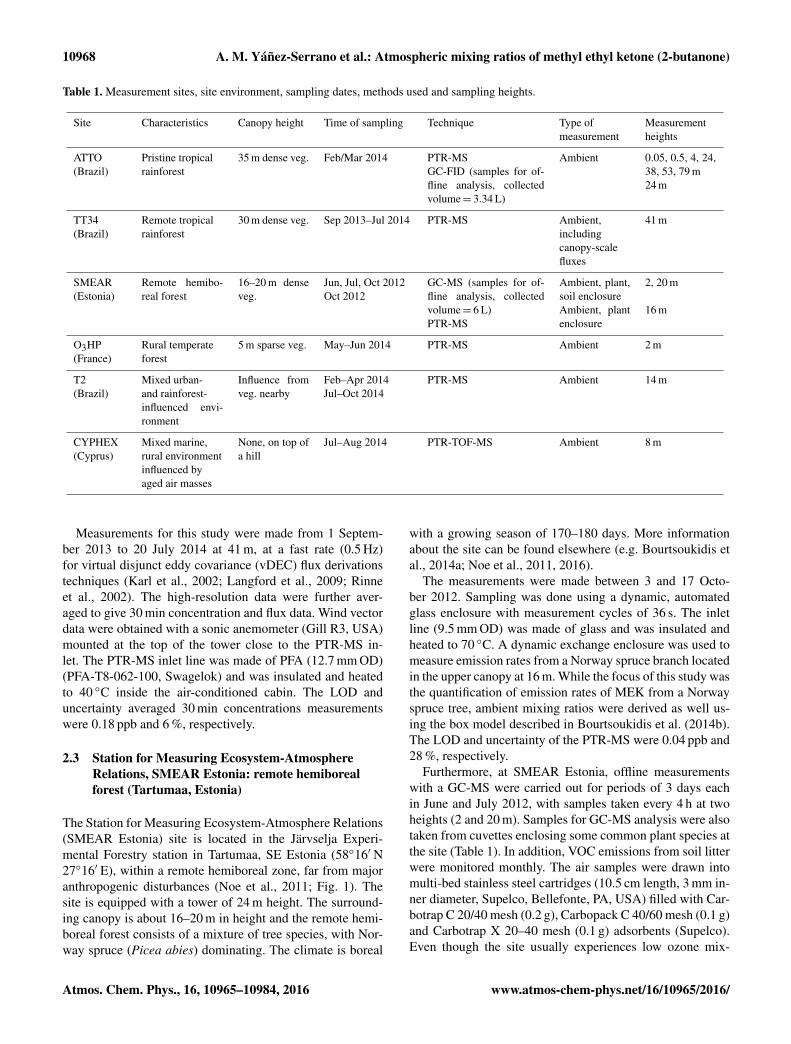
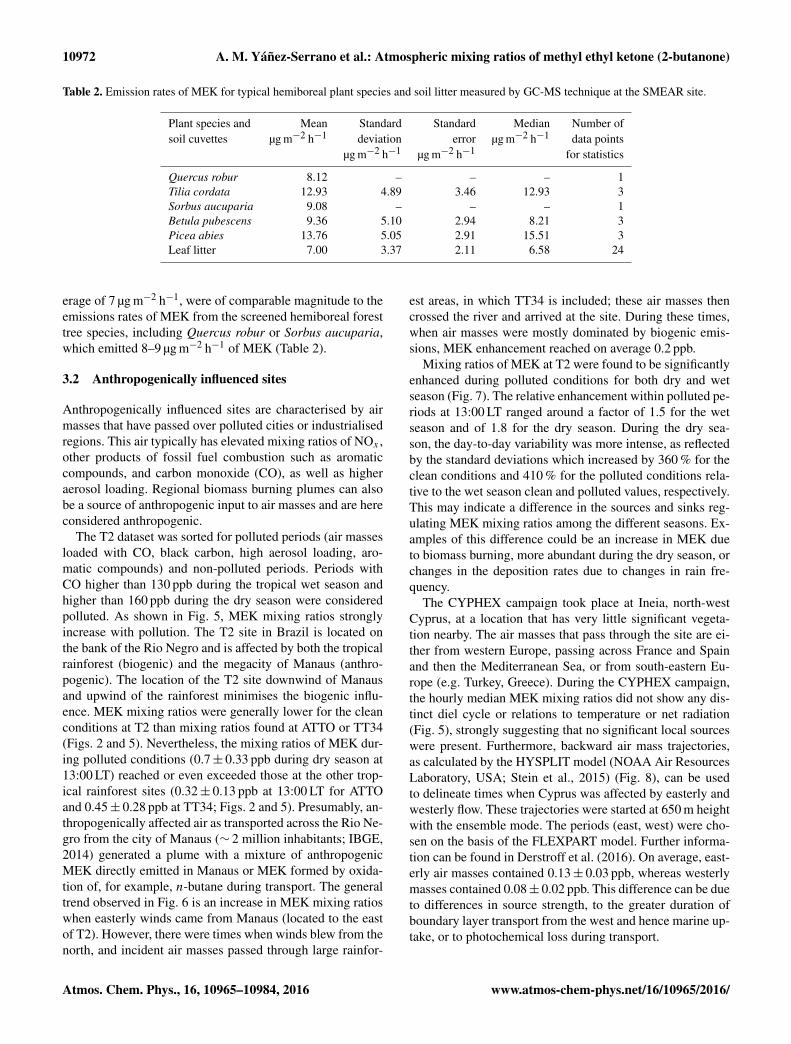
At the TT34 rainforest site, ecosystem-scale fluxes weredirectly calculated from the PTR-MS measurements usingthe method of virtual disjunct eddy covariance (vDEC) (Karlet al., 2001; Fig. 4). The fluxes averaged over the entire 11-month measurement period (covering parts of both the dryand the wet season) clearly demonstrate an emission of MEKby the rainforest during daytime with the highest emissionsaround noon, and no emissions during nighttime. In termsof seasonal variation, MEK mixing ratios were observed tobe higher during the dry season (September–October 2013,∼ 0.6 ppb) and lower during the wet season (January–April,∼ 0.2 ppb) (data not shown).
Atmos. Chem. Phys., 16, 10965–10984, 2016 www.atmos-chem-phys.net/16/10965/2016/
A. M. Yáñez-Serrano et al.: Atmospheric mixing ratios of methyl ethyl ketone (2-butanone) 10971
60
40
20
0
Hei
ght m
0.500.250.00MEK ppb
ATTO 7 March 2014
PTR-MS 13:00 PTR-MS 14:00 PTR-MS 15:00
Figure 3. Hourly average vertical profiles of MEK mixing ratiosat ATTO for 7 March 2014 for 13:00 LT (dashed lines), 14:00 LT(dotted and dashed lines) and 15:00 LT (thick lines). Error bars ofvertical profiles are the standard deviations.
Online ambient mixing ratios of MEK, as measured by thePTR-MS in the hemiboreal forest at the SMEAR Estonia siteduring autumn 2012, were on average 0.15± 0.04 ppb (range0.09–0.25 ppb). These mixing ratios are almost a factor of 2lower than ATTO and O3HP during daytime hours. This dif-ference among boreal forests, with growing season ending inOctober, broadleaved tropical (ATTO) and temperate (O3HP)forests could be partly related to the temperature dependenceof MEK emissions apparently common among all biogenicsites.
The rural Mediterranean temperate forest site at O3HP dif-fers significantly from the tropical rainforest (ATTO, TT34)or the hemiboreal forest (SMEAR Estonia, Fig. 1). The treesat O3HP are predominantly Quercus pubescens, a high iso-prene emitter (Keenan et al., 2009). At this site, the exchangeof air through the forest canopy is enhanced because thecanopy is sparse. As shown in Fig. 2, ambient MEK mix-ing ratios measured inside the canopy (2 m) increased withtemperature in the morning. During the day, increased forestemissions of MEK seemed to balance the rise of the bound-ary layer depth, resulting in a plateau until sunset. The fluc-tuation of MEK after sunset may be understood as a result ofa ceased source revealing the deposition as it can scarcely beexplained by gas-phase chemistry or the reduced nocturnalboundary layer height.
During the CANOPÉE campaign at the O3HP site, addi-tional GC-FID samples were taken at 2 m, allowing mea-surements of several anthropogenic light hydrocarbons, in-cluding n-butane. This sampling was performed in parallel tothe PTR-MS measurements. All samples contained n-butane,which typically has an anthropogenic origin with an averagemixing ratio of 0.071± 0.09 (much lower mixing ratios thanMEK), indicating there is no significant source of n-butanenearby. Hence, MEK at the O3HP site could not be related to
Figure 4. Hourly average MEK fluxes at the TT34 tower for theperiod September 2013–July 2014. The light-green circles repre-sent means and associated error bars are 1 standard deviation. Thecentral line of the box plots (dark green) indicates the median, thebottom and top lines are the 25th and 75th percentile, respectively,and whiskers are the 5th and 95th percentiles. Red dashed lines in-dicate the propagated limit of detection calculated according to themethod outlined by Langford et al. (2015).
the atmospheric oxidation of n-butane. Furthermore, the ab-sence of a correlation with other anthropogenic tracers leadsus to conclude that MEK at this site was predominantly ofbiogenic origin.
The measurements obtained by PTR-MS at the presentedsites dominated by biogenic emissions were occasionallyconfirmed by GC-FID and GC-MS, which are compound-selective. At ATTO the same range of MEK mixing ratiosfor the same hour of the day and height for the GC-FID andthe PTR-MS measurements was found, indicating that thePTR-MS signal was only or at least dominated by MEK.To identify sources, canopy measurements at SMEAR Es-tonia were complemented by emission measurements us-ing cuvettes with GC-MS identification. Common hemibo-real forest species, such as Quercus robur, Tilia cordata,Sorbus aucuparia, Betula pubescens and Picea abies, werescreened for VOC emissions. The highest emissions of MEKwere found from Tilia cordata and Picea abies (Table 2).The data are consistent with those reported by Bourtsoukidiset al. (2014b), who measured an emission rate of MEKof 2.6± 2.2 ng g−1
(dw needles) s−1 from Picea abies using PTR-MS. The GC-MS technique obtained a very similar valueof 2.3 ng g−1
(dw needles) s−1. MEK emissions from Picea abieswere relatively small compared to other VOCs emitted by thesame plant species such as total monoterpenes and acetone,which reached 93.2 and 27.6 ng g−1
(dw needles) s−1, respectively(Bourtsoukidis et al., 2014b). In addition to plant sources,the emissions rates of MEK from leaf litter were quantifiedusing a GC-MS. MEK litter emissions, with a monthly av-
www.atmos-chem-phys.net/16/10965/2016/ Atmos. Chem. Phys., 16, 10965–10984, 2016
10972 A. M. Yáñez-Serrano et al.: Atmospheric mixing ratios of methyl ethyl ketone (2-butanone)
Table 2. Emission rates of MEK for typical hemiboreal plant species and soil litter measured by GC-MS technique at the SMEAR site.
Plant species and Mean Standard Standard Median Number ofsoil cuvettes µg m−2 h−1 deviation error µg m−2 h−1 data points
µg m−2 h−1 µg m−2 h−1 for statistics
Quercus robur 8.12 – – – 1Tilia cordata 12.93 4.89 3.46 12.93 3Sorbus aucuparia 9.08 – – – 1Betula pubescens 9.36 5.10 2.94 8.21 3Picea abies 13.76 5.05 2.91 15.51 3Leaf litter 7.00 3.37 2.11 6.58 24
erage of 7 µg m−2 h−1, were of comparable magnitude to theemissions rates of MEK from the screened hemiboreal foresttree species, including Quercus robur or Sorbus aucuparia,which emitted 8–9 µg m−2 h−1 of MEK (Table 2).
3.2 Anthropogenically influenced sites
Anthropogenically influenced sites are characterised by airmasses that have passed over polluted cities or industrialisedregions. This air typically has elevated mixing ratios of NOx ,other products of fossil fuel combustion such as aromaticcompounds, and carbon monoxide (CO), as well as higheraerosol loading. Regional biomass burning plumes can alsobe a source of anthropogenic input to air masses and are hereconsidered anthropogenic.
The T2 dataset was sorted for polluted periods (air massesloaded with CO, black carbon, high aerosol loading, aro-matic compounds) and non-polluted periods. Periods withCO higher than 130 ppb during the tropical wet season andhigher than 160 ppb during the dry season were consideredpolluted. As shown in Fig. 5, MEK mixing ratios stronglyincrease with pollution. The T2 site in Brazil is located onthe bank of the Rio Negro and is affected by both the tropicalrainforest (biogenic) and the megacity of Manaus (anthro-pogenic). The location of the T2 site downwind of Manausand upwind of the rainforest minimises the biogenic influ-ence. MEK mixing ratios were generally lower for the cleanconditions at T2 than mixing ratios found at ATTO or TT34(Figs. 2 and 5). Nevertheless, the mixing ratios of MEK dur-ing polluted conditions (0.7± 0.33 ppb during dry season at13:00 LT) reached or even exceeded those at the other trop-ical rainforest sites (0.32± 0.13 ppb at 13:00 LT for ATTOand 0.45± 0.28 ppb at TT34; Figs. 2 and 5). Presumably, an-thropogenically affected air as transported across the Rio Ne-gro from the city of Manaus (∼ 2 million inhabitants; IBGE,2014) generated a plume with a mixture of anthropogenicMEK directly emitted in Manaus or MEK formed by oxida-tion of, for example, n-butane during transport. The generaltrend observed in Fig. 6 is an increase in MEK mixing ratioswhen easterly winds came from Manaus (located to the eastof T2). However, there were times when winds blew from thenorth, and incident air masses passed through large rainfor-
est areas, in which TT34 is included; these air masses thencrossed the river and arrived at the site. During these times,when air masses were mostly dominated by biogenic emis-sions, MEK enhancement reached on average 0.2 ppb.
Mixing ratios of MEK at T2 were found to be significantlyenhanced during polluted conditions for both dry and wetseason (Fig. 7). The relative enhancement within polluted pe-riods at 13:00 LT ranged around a factor of 1.5 for the wetseason and of 1.8 for the dry season. During the dry sea-son, the day-to-day variability was more intense, as reflectedby the standard deviations which increased by 360 % for theclean conditions and 410 % for the polluted conditions rela-tive to the wet season clean and polluted values, respectively.This may indicate a difference in the sources and sinks reg-ulating MEK mixing ratios among the different seasons. Ex-amples of this difference could be an increase in MEK dueto biomass burning, more abundant during the dry season, orchanges in the deposition rates due to changes in rain fre-quency.
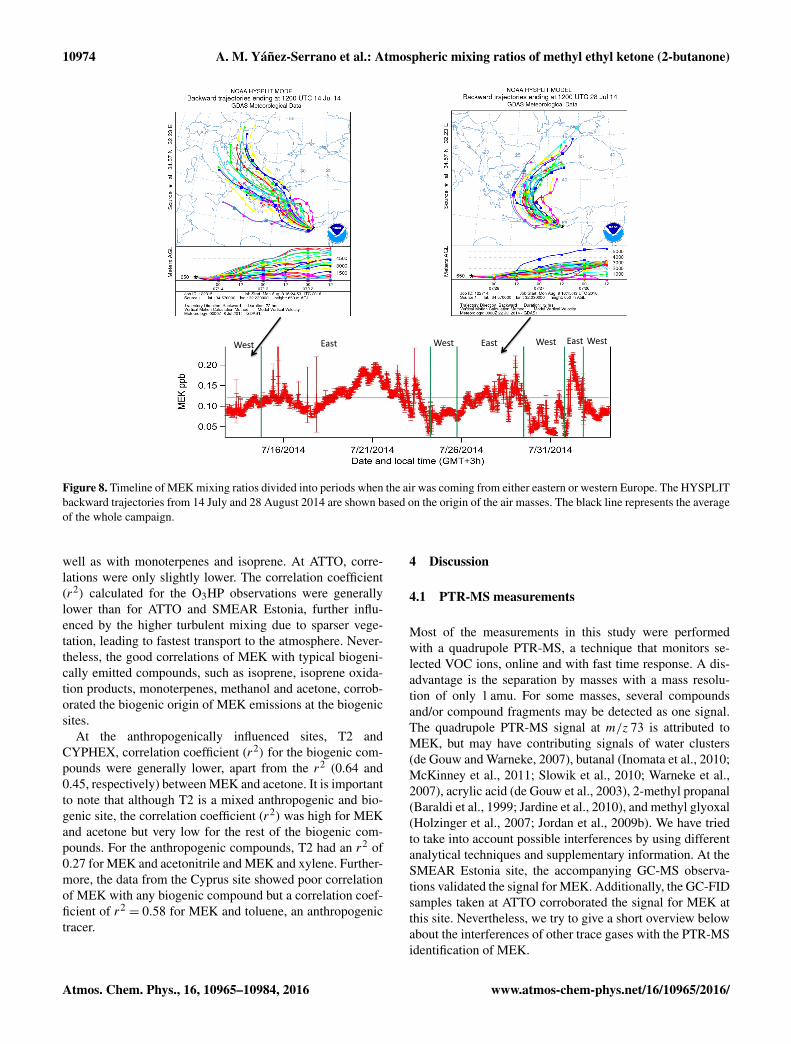
The CYPHEX campaign took place at Ineia, north-westCyprus, at a location that has very little significant vegeta-tion nearby. The air masses that pass through the site are ei-ther from western Europe, passing across France and Spainand then the Mediterranean Sea, or from south-eastern Eu-rope (e.g. Turkey, Greece). During the CYPHEX campaign,the hourly median MEK mixing ratios did not show any dis-tinct diel cycle or relations to temperature or net radiation(Fig. 5), strongly suggesting that no significant local sourceswere present. Furthermore, backward air mass trajectories,as calculated by the HYSPLIT model (NOAA Air ResourcesLaboratory, USA; Stein et al., 2015) (Fig. 8), can be usedto delineate times when Cyprus was affected by easterly andwesterly flow. These trajectories were started at 650 m heightwith the ensemble mode. The periods (east, west) were cho-sen on the basis of the FLEXPART model. Further informa-tion can be found in Derstroff et al. (2016). On average, east-erly air masses contained 0.13± 0.03 ppb, whereas westerlymasses contained 0.08± 0.02 ppb. This difference can be dueto differences in source strength, to the greater duration ofboundary layer transport from the west and hence marine up-take, or to photochemical loss during transport.
Atmos. Chem. Phys., 16, 10965–10984, 2016 www.atmos-chem-phys.net/16/10965/2016/

A. M. Yáñez-Serrano et al.: Atmospheric mixing ratios of methyl ethyl ketone (2-butanone) 10973
1000
800
600
400
200
0
PA
R m
ol ms
-2-1
00:00 06:00 12:00 18:00
30
28
26
24
22
20T
emperature ºC
00:00 06:00 12:00 18:00Local time
0.5
0.4
0.3
0.2
0.1
0.0
ME
K p
pb
T2 MEK polluted MEK clean
CYPHEX
µ
Figure 5. Hourly average diel cycles of MEK at the T2 (left) and CYPHEX (right) sites, for the period of measurements (wet season 2014for T2 at 14 m, July and August 2014 for CYPHEX at 12 m). For T2 a separation between polluted (dotted black line) and clean (thick blueline) air masses was done. Hourly mean diel cycles of temperature and PAR are also shown in red and grey, respectively. Error bars representthe standard deviations.
1 2 3
30
210
60
240
90270
120
300
150
330
180
0
0.05
0.10
0.15
0.20
0.25
0.30
0.35
MEK p
pb5 4 3 2
Figure 6. Polar surface plot for average MEK mixing ratios at agiven wind direction (angle, 1–5 m s−1) and wind speed (radius).
3.3 Compilation of measurement data
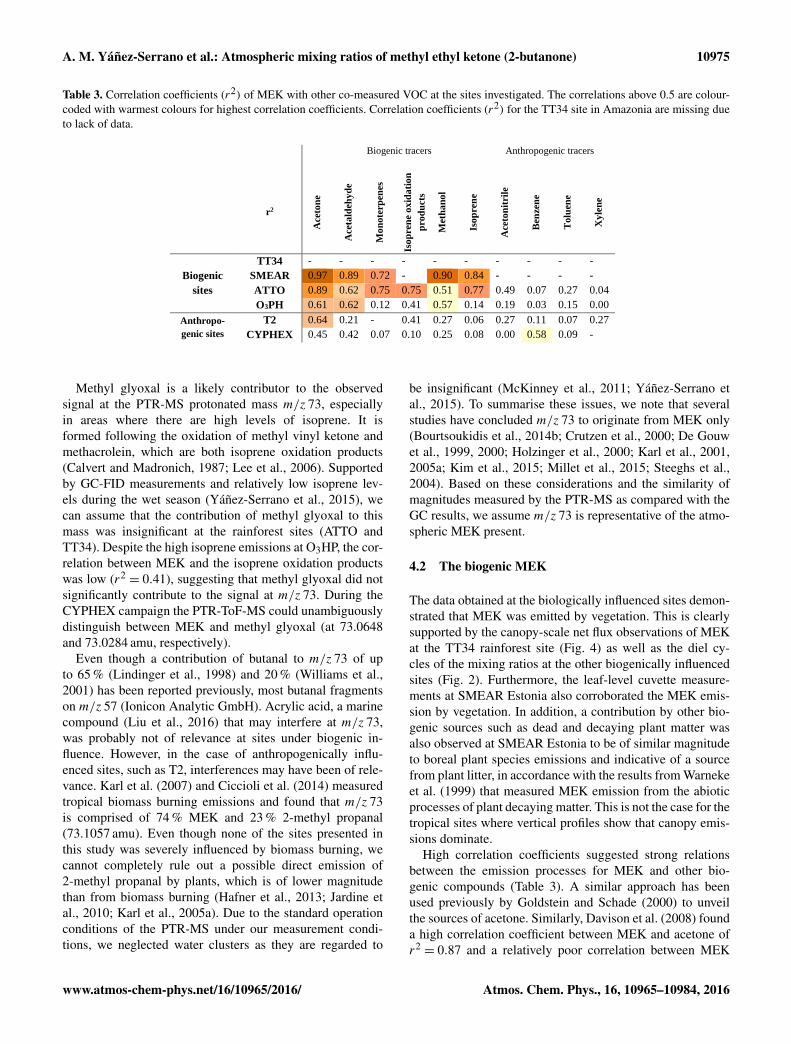
In order to investigate the origin and characteristics of MEKin the atmosphere, we calculated the correlation coeffi-cient (r2) between the mixing ratios of MEK and other co-measured VOC species for each site (Table 3). This coeffi-cient is the ratio of the variability in the MEK mixing ra-tios to the variability in the other VOC mixing ratios avail-able for each site. The correlation between MEK and otherVOC helps to identify possible similarities such as com-mon sources, sinks, chemical mechanisms, or transport pro-cesses. However, this comparison does not necessarily claimlinks between the various compounds. Acetone, acetalde-hyde, monoterpenes, isoprene, isoprene oxidation productsand methanol are regarded as being mainly of biogenic originespecially in forested areas (Kesselmeier and Staudt, 1999;Laothawornkitkul et al., 2009). Nevertheless, acetone, ac-etaldehyde and methanol may have additional sources in-cluding direct and secondary anthropogenic emissions thatcannot be neglected even at clean environments (Goldstein
1.0
0.8
0.6
0.4
0.2
0.0
ME
K p
pb
00:00 06:00 12:00 18:00
Local time
Dry season clean air masses Wet season clean air masses Dry season polluted air masses Wet season polluted air masses
Figure 7. Hourly average concentrations of MEK in ppb for theclean conditions (blue) and the polluted conditions (red) at the T2site. Dashed lines represent the dry season and thick lines representthe wet season. Error bars represent the standard deviation.
and Schade, 2000; Yáñez-Serrano et al., 2015). Compoundssuch as benzene, toluene, xylene and acetonitrile are con-sidered typical anthropogenic tracers (Andreae and Merlet,2001; Finlayson-Pitts and Pitts Jr., 1997).
In general, biogenic sites, namely ATTO, SMEAR Esto-nia, and O3HP, showed relatively high correlations betweenMEK and almost all biogenic VOCs (r2 > 0.5). Exceptionsappear in the r2 values for O3HP. For instance, the high-est correlation coefficient (r2) was found for MEK and ace-tone at the SMEAR site (r2
= 0.97). A high correlation co-efficient could indicate that the atmospheric processes gov-erning acetone and MEK abundance are likely very simi-lar (Zhou and Mopper, 1993). In SMEAR Estonia, overallhigh correlations were found between MEK and the oxy-genated compounds, acetone, acetaldehyde and methanol, as
www.atmos-chem-phys.net/16/10965/2016/ Atmos. Chem. Phys., 16, 10965–10984, 2016
10974 A. M. Yáñez-Serrano et al.: Atmospheric mixing ratios of methyl ethyl ketone (2-butanone)
West East East East West West West
Figure 8. Timeline of MEK mixing ratios divided into periods when the air was coming from either eastern or western Europe. The HYSPLITbackward trajectories from 14 July and 28 August 2014 are shown based on the origin of the air masses. The black line represents the averageof the whole campaign.
well as with monoterpenes and isoprene. At ATTO, corre-lations were only slightly lower. The correlation coefficient(r2) calculated for the O3HP observations were generallylower than for ATTO and SMEAR Estonia, further influ-enced by the higher turbulent mixing due to sparser vege-tation, leading to fastest transport to the atmosphere. Never-theless, the good correlations of MEK with typical biogeni-cally emitted compounds, such as isoprene, isoprene oxida-tion products, monoterpenes, methanol and acetone, corrob-orated the biogenic origin of MEK emissions at the biogenicsites.
At the anthropogenically influenced sites, T2 andCYPHEX, correlation coefficient (r2) for the biogenic com-pounds were generally lower, apart from the r2 (0.64 and0.45, respectively) between MEK and acetone. It is importantto note that although T2 is a mixed anthropogenic and bio-genic site, the correlation coefficient (r2) was high for MEKand acetone but very low for the rest of the biogenic com-pounds. For the anthropogenic compounds, T2 had an r2 of0.27 for MEK and acetonitrile and MEK and xylene. Further-more, the data from the Cyprus site showed poor correlationof MEK with any biogenic compound but a correlation coef-ficient of r2
= 0.58 for MEK and toluene, an anthropogenictracer.
4 Discussion
4.1 PTR-MS measurements
Most of the measurements in this study were performedwith a quadrupole PTR-MS, a technique that monitors se-lected VOC ions, online and with fast time response. A dis-advantage is the separation by masses with a mass resolu-tion of only 1 amu. For some masses, several compoundsand/or compound fragments may be detected as one signal.The quadrupole PTR-MS signal at m/z 73 is attributed toMEK, but may have contributing signals of water clusters(de Gouw and Warneke, 2007), butanal (Inomata et al., 2010;McKinney et al., 2011; Slowik et al., 2010; Warneke et al.,2007), acrylic acid (de Gouw et al., 2003), 2-methyl propanal(Baraldi et al., 1999; Jardine et al., 2010), and methyl glyoxal(Holzinger et al., 2007; Jordan et al., 2009b). We have triedto take into account possible interferences by using differentanalytical techniques and supplementary information. At theSMEAR Estonia site, the accompanying GC-MS observa-tions validated the signal for MEK. Additionally, the GC-FIDsamples taken at ATTO corroborated the signal for MEK atthis site. Nevertheless, we try to give a short overview belowabout the interferences of other trace gases with the PTR-MSidentification of MEK.
Atmos. Chem. Phys., 16, 10965–10984, 2016 www.atmos-chem-phys.net/16/10965/2016/
A. M. Yáñez-Serrano et al.: Atmospheric mixing ratios of methyl ethyl ketone (2-butanone) 10975
Table 3. Correlation coefficients (r2) of MEK with other co-measured VOC at the sites investigated. The correlations above 0.5 are colour-coded with warmest colours for highest correlation coefficients. Correlation coefficients (r2) for the TT34 site in Amazonia are missing dueto lack of data.
Table 2: Emission rates of MEK for typical hemi-boreal plant species and soil litter measured by GC-MS
technique at the SMEAR site.
Plant species and soil
cuvettes Mean
µg m-2 h-1
Standard
deviation
µg m-2 h-1
Standard error
µg m-2 h-1
Median
µg m-2 h-1
Number of data
points for statistics
Quercus robur 8.12 - - - 1
Tilia cordata 12.93 4.89 3.46 12.93 3
Sorbus aucuparia 9.08 - - - 1
Betula pubsecens 9.36 5.10 2.94 8.21 3
Picea abies 13.76 5.05 2.91 15.51 3
Leaf litter 7.00 3.37 2.11 6.58 24
Table 3: Correlation coefficients (r2) of MEK with other co-measured VOC at the sites investigated. The
correlations above 0.5 are colour coded with warmest colours for highest correlation coefficients. Correla-
tion coefficients (r2) for the TT34 site in Amazonia are missing due to lack of data.
Biogenic tracers Anthropogenic tracers
r2
Ace
ton
e
Ace
tald
ehy
de
Mo
note
rpen
es
Iso
pre
ne
ox
ida
tio
n
pro
du
cts
Met
ha
no
l
Iso
pre
ne
Ace
ton
itri
le
Ben
zen
e
To
luen
e
Xy
len
e
Biogenic
sites
TT34 - - - - - - - - - -
SMEAR 0.97 0.89 0.72 - 0.90 0.84 - - - -
ATTO 0.89 0.62 0.75 0.75 0.51 0.77 0.49 0.07 0.27 0.04
O3PH 0.61 0.62 0.12 0.41 0.57 0.14 0.19 0.03 0.15 0.00
Anthropo-
genic sites
T2 0.64 0.21 - 0.41 0.27 0.06 0.27 0.11 0.07 0.27
CYPHEX 0.45 0.42 0.07 0.10 0.25 0.08 0.00 0.58 0.09 -
Table 3: Literature compilation of MEK mixing ratios measurements in different ecosystems around the
globe from a wide range of atmospheric environments.
Reference MEK mixing
ratio in ppb Type of environment Reported data
Height from
surface Time of measurement
Zhou and Mopper, 1993 0.03 Caribbean ocean Cruise data, total average 10m October 1988
Ho et al., 2002 0.14 Hong Kong urban centre annual average 6m April 2000-April 2001
Cecinatto et al., 2002 0.15 Algeria rural residential site Daytime average Not specified January 2001
Cecinatto et al., 2002 0.23 Algeria rural residential site Daytime average Not specified August 2001
Feng et al., 2004 2.11 China urban site Evening time Not specified August–September 2002
Hellen et al., 2004 0.073 Finnish boreal forest site Diel average 1 m March-April 2003
Sighn et al., 2004 0.12 Tropospheric pacific ocean Non specified 0-2km February-April 2001
Legreid et al., 2007 0.2* Swiss urban site Annual average 8 m Throughout 2005
Davison et al., 2007 0.8* Swiss permanent grassland site Daytime average 1.2 m June 2005
Methyl glyoxal is a likely contributor to the observedsignal at the PTR-MS protonated mass m/z 73, especiallyin areas where there are high levels of isoprene. It isformed following the oxidation of methyl vinyl ketone andmethacrolein, which are both isoprene oxidation products(Calvert and Madronich, 1987; Lee et al., 2006). Supportedby GC-FID measurements and relatively low isoprene lev-els during the wet season (Yáñez-Serrano et al., 2015), wecan assume that the contribution of methyl glyoxal to thismass was insignificant at the rainforest sites (ATTO andTT34). Despite the high isoprene emissions at O3HP, the cor-relation between MEK and the isoprene oxidation productswas low (r2
= 0.41), suggesting that methyl glyoxal did notsignificantly contribute to the signal at m/z 73. During theCYPHEX campaign the PTR-ToF-MS could unambiguouslydistinguish between MEK and methyl glyoxal (at 73.0648and 73.0284 amu, respectively).
Even though a contribution of butanal to m/z 73 of upto 65 % (Lindinger et al., 1998) and 20 % (Williams et al.,2001) has been reported previously, most butanal fragmentson m/z 57 (Ionicon Analytic GmbH). Acrylic acid, a marinecompound (Liu et al., 2016) that may interfere at m/z 73,was probably not of relevance at sites under biogenic in-fluence. However, in the case of anthropogenically influ-enced sites, such as T2, interferences may have been of rele-vance. Karl et al. (2007) and Ciccioli et al. (2014) measuredtropical biomass burning emissions and found that m/z 73is comprised of 74 % MEK and 23 % 2-methyl propanal(73.1057 amu). Even though none of the sites presented inthis study was severely influenced by biomass burning, wecannot completely rule out a possible direct emission of2-methyl propanal by plants, which is of lower magnitudethan from biomass burning (Hafner et al., 2013; Jardine etal., 2010; Karl et al., 2005a). Due to the standard operationconditions of the PTR-MS under our measurement condi-tions, we neglected water clusters as they are regarded to
be insignificant (McKinney et al., 2011; Yáñez-Serrano etal., 2015). To summarise these issues, we note that severalstudies have concluded m/z 73 to originate from MEK only(Bourtsoukidis et al., 2014b; Crutzen et al., 2000; De Gouwet al., 1999, 2000; Holzinger et al., 2000; Karl et al., 2001,2005a; Kim et al., 2015; Millet et al., 2015; Steeghs et al.,2004). Based on these considerations and the similarity ofmagnitudes measured by the PTR-MS as compared with theGC results, we assume m/z 73 is representative of the atmo-spheric MEK present.
4.2 The biogenic MEK
The data obtained at the biologically influenced sites demon-strated that MEK was emitted by vegetation. This is clearlysupported by the canopy-scale net flux observations of MEKat the TT34 rainforest site (Fig. 4) as well as the diel cy-cles of the mixing ratios at the other biogenically influencedsites (Fig. 2). Furthermore, the leaf-level cuvette measure-ments at SMEAR Estonia also corroborated the MEK emis-sion by vegetation. In addition, a contribution by other bio-genic sources such as dead and decaying plant matter wasalso observed at SMEAR Estonia to be of similar magnitudeto boreal plant species emissions and indicative of a sourcefrom plant litter, in accordance with the results from Warnekeet al. (1999) that measured MEK emission from the abioticprocesses of plant decaying matter. This is not the case for thetropical sites where vertical profiles show that canopy emis-sions dominate.
High correlation coefficients suggested strong relationsbetween the emission processes for MEK and other bio-genic compounds (Table 3). A similar approach has beenused previously by Goldstein and Schade (2000) to unveilthe sources of acetone. Similarly, Davison et al. (2008) founda high correlation coefficient between MEK and acetone ofr2= 0.87 and a relatively poor correlation between MEK
www.atmos-chem-phys.net/16/10965/2016/ Atmos. Chem. Phys., 16, 10965–10984, 2016
10976 A. M. Yáñez-Serrano et al.: Atmospheric mixing ratios of methyl ethyl ketone (2-butanone)
and monoterpenes (r2= 0.54). They surmised that good cor-
relations indicated a common origin for biogenically emit-ted compounds. Furthermore, a resemblance of the patternof acetone and MEK has been reported for the ATTO site be-fore (Yáñez-Serrano et al., 2015). In our study, we found highcorrelation coefficients (r2) for MEK with acetone and MEKwith temperature, and lower r2 for MEK and compoundssuch as isoprene and monoterpenes for all the biogenicsites (Table 3). This could indicate that MEK forest emis-sions are more related to processes resembling acetone emis-sions and temperature-dependent processes, rather than light-and temperature-dependent emission mechanisms, as for iso-prene and monoterpenes (Jardine et al., 2015; Kesselmeierand Staudt, 1999).
Plant physiological production pathways have been re-ported for MEK formation. MEK can be formed, similarlyto acetone, as a by-product of a cyanohydrin lyase reac-tion during cyanogenesis (Fall, 2003; Vetter, 2000). Thischemical defence pathway was also identified in clover byKirstine et al. (1998) and de Gouw et al. (1999) as a re-sult of mechanical stress, and can be of special importancefor tropical rainforests (Miller et al., 2006). On the otherhand, in places such as SMEAR Estonia, dominating plantspecies are not cyanogenic, and other processes for MEKformation are probably more dominant. In pine trees, ace-tone is produced from light-dependent and independent pro-cesses that can be associated with the decarboxylation ofacetoacetate occurring in microorganisms and animals (Fall,2003), from oxidation of fatty acids leading to ketone emis-sions (Niinemets et al., 2014), from pyruvic acid leading toacetyl-CoA (Kesselmeier and Staudt, 1999), or from unchar-acterised biochemical reactions (Fall, 2003). Such processescould also be related to MEK emissions.
Even though extensive laboratory measurements areneeded to identify the dominant plant process or processesresponsible for MEK emission, this study demonstrated therole that temperature can exert on such emissions. Hence,forests around the world may act as very different sourcesfor atmospheric MEK. This can be seen for boreal forests(SMEAR Estonia), with distinctly lower temperatures, whereMEK levels were significantly lower. However, other fac-tors must be considered (Schade et al., 2011), such as leafarea index (LAI) and plant species composition, as well asthe environmental factors, water availability and mechanicalstress, the latter having already been observed by de Gouwet al. (1999) to act as a driver for MEK emissions.
Due to its relatively long atmospheric lifetime (∼ 5 daysfor the reaction with OH; Grant et al., 2008), MEK isexpected to accumulate in the atmosphere until removal.Hence, atmospheric mixing ratios can reflect seasonality andchanges in dominating sources, affected by radiation, tem-perature and phenology, from more biogenic dominance dur-ing the wet season to transport phenomena and oxidationprocesses of primarily emitted compounds from regionalbiomass burning, as was seen in 2013 at the ATTO site
(Yáñez-Serrano et al., 2015). Moreover, a possible produc-tion from certain terpenes through ozonolysis cannot be ex-cluded (Holzinger et al., 2005). Additionally, the canopystructure seems to be important for air mixing and trans-port, as seen for the O3HP site with an apparently fastermixing due to sparser vegetation and consequent dampen-ing of the amplitude of the diel cycle. Furthermore, due toits oxygenated nature, partitioning to and from aqueous sur-faces is likely, including deposition and surface reactions. Itshigh water solubility might allow dissolution within leaf wa-ter (Sander, 2015), triggering bidirectional exchange of MEK(Karl et al., 2005b; McKinney et al., 2011; Niinemets et al.,2014). Due to its high solubility in water and its relativelylong lifetime, MEK could potentially influence gas–aqueousreactions on aerosol surfaces (Nozière, 2005). This has beenshown indirectly by the production of methyl glyoxal afterits oxidation by OH, having implications for the formation oforganics in the aerosol aqueous phase (Rodigast et al., 2016).
4.3 The anthropogenic MEK
A clear difference could be observed between the anthro-pogenic and biogenic influenced sites presented in this study.The T2 site represented a site with mixed influence by urbanarea and tropical rainforest. Affected by anthropogenic andbiogenic sources, ambient mixing ratios of MEK were higherthan at the pristine ATTO rainforest site. Polluted episodes(from the Manaus plume) with an increase in MEK could bedistinguished for both the wet and the dry season, suggest-ing a short-range transport of air masses. On the other hand,when the wind is blowing from the north, MEK mixing ratioswere also present, showing an influence from biogenic forestemissions (Fig. 7), thus having a mix of biogenic and anthro-pogenic influence at the T2 site. A strong seasonality of MEKmixing ratios at T2 reflected biomass burning as a commonoccurrence in the Amazon region during the dry season (Ar-taxo et al., 2013). In addition to MEK, a higher contributionof butanal affecting m/z 73 (Inomata et al., 2010; Karl et al.,2007) might be possible, although MEK has been reported tohave a much higher emission factor (range from 0.17 to 0.83)than butanal (range from 0.04 to 0.21) for biomass burning(Andreae and Merlet, 2001).
We regarded CYPHEX as an anthropogenically influencedsite with weak or no apparent direct sources but whichwas affected by anthropogenic air masses after long-rangetransport over marine areas. Losses by transport over thesea and chemical decomposition led to the lowest averagedMEK mixing ratios of all compared sites. Correlation co-efficients (r2) of MEK with the biogenic tracers were rela-tively poor for T2 and CYPHEX. However, correlations werealso poor for the anthropogenic tracers, although slightly bet-ter than at the biogenic sites. MEK showed highest corre-lation with acetone, indicating similar sources and fate inair mixing and chemistry processes. MEK transported overlong distances (10 days) is lost by photochemical aging or
Atmos. Chem. Phys., 16, 10965–10984, 2016 www.atmos-chem-phys.net/16/10965/2016/
A. M. Yáñez-Serrano et al.: Atmospheric mixing ratios of methyl ethyl ketone (2-butanone) 10977
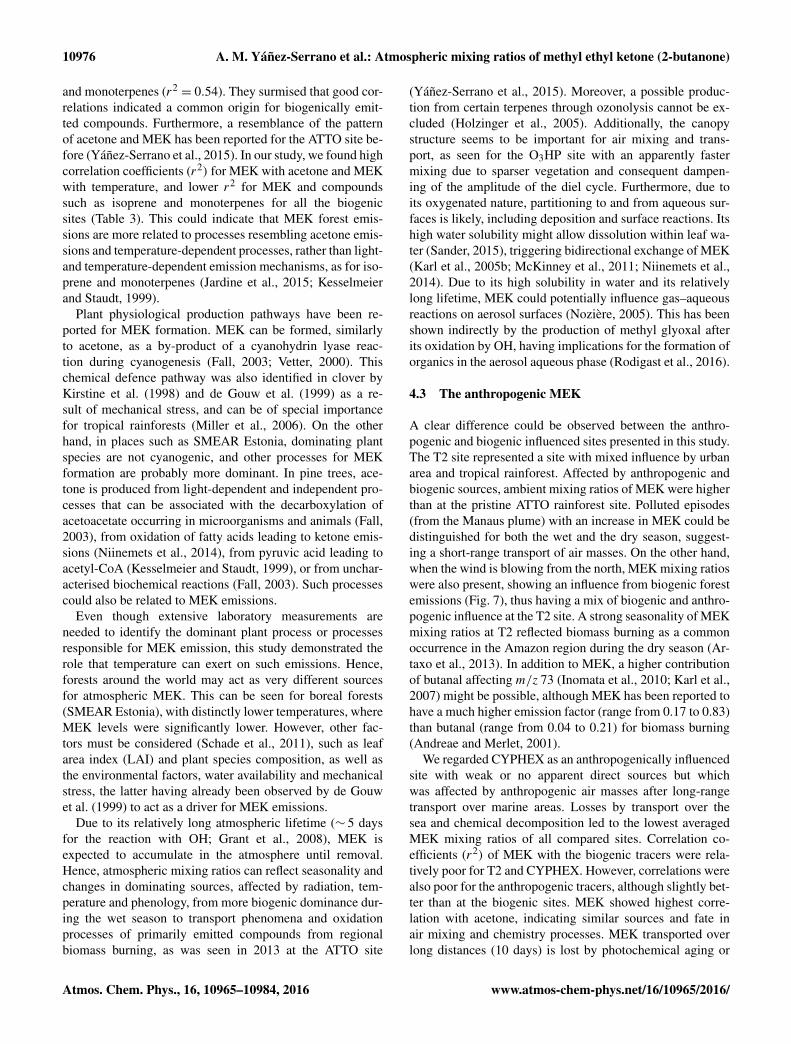
Table 4. Literature compilation of MEK mixing ratios measurements in different ecosystems around the globe from a wide range of atmo-spheric environments.
Reference MEK mixing Type of Reported Height from Time ofratio in ppb environment data surface measurement
Zhou and Mopper(1993)
0.03 Caribbean Sea Cruise data, totalaverage
10 m October 1988
Ho et al. (2002) 0.14 Hong Kong urban cen-tre
Annual average 6 m April 2000–April2001
Cecinato etal. (2002)
0.15 Algerian rural residen-tial site
Daytime average Not specified January 2001
Cecinato etal. (2002)
0.23 Algerian rural residen-tial site
Daytime average Not specified August 2001
Feng et al. (2004) 2.11 Chinese urban site Evening time Not specified August–September2002
Hellén et al. (2004) 0.073 Finnish boreal forestsite
Diel average 1 m March–April2003
Sighn et al. (2004) 0.12 Tropospheric PacificOcean
Not specified 0–2 km February–April2001
Legreid et al. (2007) 0.2a Swiss urban site Annual average 8 m Throughout 2005
Davison et al. (2008) 0.8b Swiss permanent grass-land site
Daytime average 1.2 m June 2005
Grant et al. (2008) ∼ 0.5 Senegalese rural site Daytime average 6 m September 2006
Jordan et al. (2009b) 0.13 USA mixed rural site Interannual medianfrom 2005 to 2008
12 m From 2005 to2008
Kim et al. (2015) ∼ 4 South Korean semi-rural site
Diel average 15 m June 2013
Yáñez-Serrano etal. (2015)
0.43 Brazilian tropical rain-forest site (ATTO)
Daytime average 38 m September 2013
Yáñez-Serrano etal. (2015)
0.13 Brazilian tropical rain-forest site (ATTO)
Daytime average 38 m February–March2013
This study 0.39 Brazilian tropical rain-forest site (ATTO)
Daytime average 38 m February–March2014
This study 0.39 Brazilian tropical rain-forest site (TT34)
Daytime average 41 m September2013–July 2014
This study 0.19 Hemiboreal forest site(SMEAR Estonia)
Daytime average 16 m October 2012
This study 0.30 French Mediterraneanforest (O3HP)
Daytime average 2 m May–June 2014
This study 0.13 Brazilian mixed tropi-cal rainforest site (T2)
Daytime average 14 m February–October 2014
This study 0.11 Cyprian rural site(CYPHEX)
Daytime average 8 m July–August2014
a Average from different seasons reported. b Average of different conditions cutting, a day after cutting and removing hay and a day after removing hay.
www.atmos-chem-phys.net/16/10965/2016/ Atmos. Chem. Phys., 16, 10965–10984, 2016
10978 A. M. Yáñez-Serrano et al.: Atmospheric mixing ratios of methyl ethyl ketone (2-butanone)
deposition as evidenced by the lowest values reported fromCYPHEX. This is despite known secondary photochemicalsources, i.e. n-butane oxidation (Katzenstein et al., 2003;Kwok et al., 1996). Interestingly, even under polluted condi-tions, MEK did not correlate with aromatic compounds, ex-cept during CYPHEX, although this correlation deterioratedin the more aged westerly air masses. This can only be under-stood as a result of a very complex mixture of anthropogenicsources of MEK which vary from direct emission by indus-try (Legreid et al., 2007), gasoline combustion (Verschueren,1983), biomass burning (Andreae and Merlet, 2001) and ve-hicular emissions (Brito et al., 2015). Furthermore, chemicalprocessing during transport may contribute, such as oxida-tion of n-butane; however, the longer transport times duringCYPHEX from the west corresponded to lower values.
5 Remarks and conclusions
The comparison of MEK mixing ratios in different parts ofthe world is necessary in order to understand how this ubiq-uitous compound occurs and behaves in the atmosphere. Tosummarise, Table 4 aims to provide a numerical compari-son of MEK mixing ratios reported around the globe. WhileMEK mixing ratios in our study are relatively constant, MEKhas been measured in many different ecosystems rangingfrom 0.073 ppb to 4 ppb. Therefore, it is important to con-sider the variability in this compound as MEK can lead toPAN and ozone formation in the atmosphere (Pinho et al.,2005). Photochemical odd-hydrogen production in the up-per troposphere (Atkinson, 2000; Baeza Romero et al., 2005;De Gouw et al., 1999) can further enhance the MEK ozoneforming potential (Folkins et al., 1998; Prather and Jacob,1997). Of the widely used atmospheric chemistry models,only GEOS-Chem explicitly computes MEK but only withregard to anthropogenic origin. On the basis of the data pre-sented here from forest sites, it is necessary for atmosphericchemistry models to also include biogenic MEK emissionsto better estimate its effects on the environment. Sites underbiogenic influence showed marked diel variability, matchingbiogenic VOC emissions and temperature. Structural forestfeatures seem to affect turbulent mixing and diluting of tracegases like MEK, as in the case of O3HP with patchy vegeta-tion. MEK seemed to be produced in plants in a similar fash-ion to acetone, likely released during mechanical stress. Pos-sible pathways for productions in plants are oxidation of fattyacids, cyanogenesis, production from pyruvic acid leading toacetyl-CoA, and light-dependent and independent processesthat can be associated with the decarboxylation of acetoac-etate occurring in microorganisms and animals.
This study presents the first compilation and compari-son of ambient measurements of MEK at different sites.MEK patterns and mixing ratios differ around the globedepending on sources and transport. Vegetation and litterhave been identified as sources of MEK and magnitude ofsources varied among the tropical rainforest, the Mediter-ranean temperate forest and the hemiboreal forest following alikely temperature dependence. However, via different filter-ing methodologies (CO filtering and backward trajectories),the anthropogenic input from polluted regions, such as themixed urban and tropical rainforest and mixed marine envi-ronment, is often found to be the dominant contribution.
6 Data availability
Even though the data are still not available in any publicrepository, as the authors are still working on other parts ofthe data collected during the campaigns, the data are avail-able upon request from the main author.
Acknowledgements. For ATTO, we thank the Max Planck Societyand the Instituto Nacional de Pesquisas da Amazonia for contin-uous support. Furthermore, we acknowledge the support by theATTO project (German Federal Ministry of Education and Re-search, BMBF funds 01LB1001A; Brazilian Ministério da Ciên-cia, Tecnologia e Inovação FINEP/MCTI contract 01.11.01248.00),UEA and FAPEAM, LBA/INPA, and SDS/CEUC/RDS-Uatumã.We would especially like to thank all the people involved in the lo-gistical support of the ATTO project, in particular Reiner Ditz andHermes Braga Xavier. We acknowledge the micrometeorologicalgroup of INPA/LBA for their collaboration concerning the meteoro-logical parameters, with special thanks to Marta Sá, Antonio Huxleyand Leonardo Oliveira. We would like to acknowledge Stefan Wolfffor the construction, support and maintenance of the inlet system.We are grateful to Nina Knothe for logistical help. We would alsolike to thank Thomas Klüpfel for all the great support providedwith the PTR-MS operation in the laboratory as well as in the field.This paper contains results of research conducted under the Tech-nical/Scientific Cooperation Agreement between the National Insti-tute for Amazonian Research, the State University of Amazonas,and the Max-Planck-Gesellschaft e.V.; the opinions expressed arethe entire responsibility of the authors and not of the participatinginstitutions.
For TT34, we thank the Natural Environment Research Coun-cil for funding the CLAIRE-UK project (reference NE/I012567/1),A. Valach, B. Davison and M. Shaw for assistance andA. R. MacKenzie for valuable discussions.
For SMEAR, we would like to acknowledge the EU Re-gional Development Foundation: “Environmental Conservation andEnvironmental Technology R&D Programme” project BioAtmos(3.2.0802.11-0043), “Internationalization of Science Programme”project INSMEARIN (10.1-6/13/1028), and the “Estonian Re-search Infrastructures Roadmap” project Estonian EnvironmentalObservatory (3.2.0304.11-0395). We express our gratitude to theArchimedes Foundation (international programme DoRa) and the“Freunde und Förderer der Goethe Universität” that provided fund-ing to E. Bourtsoukidis for conducting research in Estonia. We
Atmos. Chem. Phys., 16, 10965–10984, 2016 www.atmos-chem-phys.net/16/10965/2016/
A. M. Yáñez-Serrano et al.: Atmospheric mixing ratios of methyl ethyl ketone (2-butanone) 10979
would like to additionally thank Dominika Radacki, Javier Roa-les, Beate Noe, Eero Talts, Ahto Kangur and Miguel P. Estrada forproviding valuable help with the setup and transportation. Specialthanks to Boris Bonn for the insightful discussions and commentsduring the production of this article.
For O3HP, the measurements presented in this study were sup-ported by the European Commission’s 7th Framework Programmeunder grant agreement number 287382 “PIMMS”, as well as byANR-CANOPEE and ChArMEx, CEA and CNRS. We acknowl-edge B. Bonsang and C. Kalogridis for the GC-FID measurements,J. P. Orts and I. Reiter for logistical support, and J. Lathière formanaging the CANOPÉE project.
For T2, we thank Bruno Takeshi for all the logistical sup-port. Furthermore, we acknowledge the support by FAPESP grant2013/25058-1 and 2013/05014-0.
For CYPHEX, the authors gratefully acknowledge the NOAAAir Resources Laboratory (ARL) for the provision of the HYS-PLIT transport and dispersion model and READY website(http://www.ready.noaa.gov) used in this publication.
The article processing charges for this open-accesspublication were covered by the Max Planck Society.
Edited by: E. HarrisReviewed by: two anonymous referees
References
Andreae, M. O. and Merlet, P.: Emission of trace gases and aerosolsfrom biomass burning, Global Biogeochem. Cy., 15, 955–966,doi:10.1029/2000gb001382, 2001.
Andreae, M. O., Acevedo, O. C., Araùjo, A., Artaxo, P., Barbosa, C.G. G., Barbosa, H. M. J., Brito, J., Carbone, S., Chi, X., Cintra,B. B. L., da Silva, N. F., Dias, N. L., Dias-Júnior, C. Q., Ditas, F.,Ditz, R., Godoi, A. F. L., Godoi, R. H. M., Heimann, M., Hoff-mann, T., Kesselmeier, J., Könemann, T., Krüger, M. L., Lavric,J. V., Manzi, A. O., Lopes, A. P., Martins, D. L., Mikhailov, E.F., Moran-Zuloaga, D., Nelson, B. W., Nölscher, A. C., SantosNogueira, D., Piedade, M. T. F., Pöhlker, C., Pöschl, U., Que-sada, C. A., Rizzo, L. V., Ro, C.-U., Ruckteschler, N., Sá, L. D.A., de Oliveira Sá, M., Sales, C. B., dos Santos, R. M. N., Sat-urno, J., Schöngart, J., Sörgel, M., de Souza, C. M., de Souza,R. A. F., Su, H., Targhetta, N., Tóta, J., Trebs, I., Trumbore,S., van Eijck, A., Walter, D., Wang, Z., Weber, B., Williams,J., Winderlich, J., Wittmann, F., Wolff, S., and Yáñez-Serrano,A. M.: The Amazon Tall Tower Observatory (ATTO): overviewof pilot measurements on ecosystem ecology, meteorology, tracegases, and aerosols, Atmos. Chem. Phys., 15, 10723–10776,doi:10.5194/acp-15-10723-2015, 2015.
Artaxo, P., Rizzo, L. V., Brito, J. F., Barbosa, H. M. J., Arana, A.,Sena, E. T., Cirino, G. G., Bastos, W., Martin, S. T., and Andreae,M. O.: Atmospheric aerosols in Amazonia and land use change:from natural biogenic to biomass burning conditions, FaradayDiscuss., 165, 203–235, doi:10.1039/c3fd00052d, 2013.
Atkinson, R.: Atmospheric chemistry of VOCs and NOx , Atmos.Environ., 34, 2063–2101, doi:10.1016/s1352-2310(99)00460-4,2000.
Atkinson, R. and Arey, J.: Gas-phase tropospheric chemistry of bio-genic volatile organic compounds: A review, Atmos. Environ.,37, S197–S219, doi:10.1016/S1352-2310(03)00391-1, 2003.
Baeza Romero, M. T., Blitz, M. A., Heard, D. E., Pilling, M.J., Price, B., Seakins, P. W., and Wang, L.: Photolysis ofmethylethyl, diethyl and methylvinyl ketones and their role inthe atmospheric HOx budget, Faraday Discuss., 130, 73–88,doi:10.1039/b419160a, 2005.
Baraldi, R., Rapparini, F., Rossi, F., Latella, A., and Ciccioli,P.: Volatile organic compound emissions from flowers of themost occuring and economically important species of fruittrees, Phys. Chem. Earth B, 24, 729–732, doi:10.1016/S1464-1909(99)00073-8, 1999.
Bon, D. M., Ulbrich, I. M., de Gouw, J. A., Warneke, C., Kuster,W. C., Alexander, M. L., Baker, A., Beyersdorf, A. J., Blake, D.,Fall, R., Jimenez, J. L., Herndon, S. C., Huey, L. G., Knighton,W. B., Ortega, J., Springston, S., and Vargas, O.: Measurementsof volatile organic compounds at a suburban ground site (T1)in Mexico City during the MILAGRO 2006 campaign: mea-surement comparison, emission ratios, and source attribution,Atmos. Chem. Phys., 11, 2399–2421, doi:10.5194/acp-11-2399-2011, 2011.
Bourtsoukidis, E., Williams, J., Kesselmeier, J., Jacobi, S., andBonn, B.: From emissions to ambient mixing ratios: online sea-sonal field measurements of volatile organic compounds overa Norway spruce-dominated forest in central Germany, Atmos.Chem. Phys., 14, 6495–6510, doi:10.5194/acp-14-6495-2014,2014a.
Bourtsoukidis, E., Bonn, B., and Noe, S. M.: On-line field measure-ments of BVOC emissions from Norway spruce (Picea abies) atthe hemiboreal SMEAR-Estonia site under autumn conditions,Boreal Environ. Res., 19, 153–167, 2014b.
Bracho-Nunez, A., Knothe„ N. M., Welter, S., Staudt, M., Costa,W. R., Liberato, M. A. R., Piedade, M. T. F., and Kesselmeier, J.:Leaf level emissions of volatile organic compounds (VOC) fromsome Amazonian and Mediterranean plants, Biogeosciences, 10,5855–5873, doi:10.5194/bg-10-5855-2013, 2013.
Brilli, F., Gioli, B., Zona, D., Pallozzi, E., Zenone, T., Fratini, G.,Calfapietra, C., Loreto, F., Janssens, I. A., and Ceulemans, R.:Simultaneous leaf- and ecosystem-level fluxes of volatile organiccompounds from a poplar-based SRC plantation, Agr. Forest Me-teorol., 187, 22–35, doi:10.1016/j.agrformet.2013.11.006, 2014.
Brito, J., Wurm, F., Yáñez-Serrano, A. M., de Assunção, J. V.,Godoy, J. M., and Artaxo, P.: Vehicular Emission Ratios of VOCsin a Megacity Impacted by Extensive Ethanol Use: Results ofAmbient Measurements in São Paulo, Brazil, Environ. Sci. Tech-nol., 49, 11381–11387, doi:10.1021/acs.est.5b03281, 2015.
Calvert, J. G. and Madronich, S.: Theoretical study of the initialproducts of the atmospheric oxidation of hydrocarbons, J. Geo-phys. Res., 92, 2211, doi:10.1029/JD092iD02p02211, 1987.
Cecinato, A., Yassaa, N., Di Palo, V., and Possanzini, M.: Obser-vation of volatile and semi-volatile carbonyls in an Algerian ur-ban environment using dinitrophenylhydrazine/silica-HPLC andpentafluorophenylhydrazine/silica-GC-MS, J. Environ. Monitor.,4, 223–228, doi:10.1039/b110616n, 2002.
Chew, A. A. and Atkinson, R.: OH radical formation yields fromthe gas-phase reactions of O3 with alkenes and monoterpenes, J.Geophys. Res., 101, 28649, doi:10.1029/96JD02722, 1996.
www.atmos-chem-phys.net/16/10965/2016/ Atmos. Chem. Phys., 16, 10965–10984, 2016
10980 A. M. Yáñez-Serrano et al.: Atmospheric mixing ratios of methyl ethyl ketone (2-butanone)
Ciccioli, P. and Mannozzi, M.: High-Molecular-Weight Carbonylsand Carboxylic Acids, in: Wiley: Volatile Organic Compounds inthe Atmosphere, edited by: Koppmann, R., 292–343, BlackwellPublishing Ltd., 2007.
Ciccioli, P., Centritto, M., and Loreto, F.: Biogenic volatile organiccompound emissions from vegetation fires, Plant. Cell Environ.,37, 1810–1825, doi:10.1111/pce.12336, 2014.
Colomb, A., Williams, J., Crowley, J., Gros, V., Hofmann, R., Sal-isbury, G., Klüpfel, T., Kormann, R., Stickler, A., Forster, C., andLelieveld, J.: Airborne Measurements of Trace Organic Speciesin the Upper Troposphere Over Europe: the Impact of Deep Con-vection, Environ. Chem., 3, 244, doi:10.1071/EN06020, 2006.
Crutzen, P. J., Williams, J., Poschl, U., Hoor, P., Fischer, H.,Warneke, C., Holzinger, R., Hansel, A., Lindinger, W., Scheeren,B., and Lelieveld, J.: High spatial and temporal resolution mea-surements of primary organics and their oxidation products overthe tropical forests of Surinam, Atmos. Environ., 34, 1161–1165,doi:10.1016/s1352-2310(99)00482-3, 2000.
Davison, B., Brunner, A., Ammann, C., Spirig, C., Jocher, M., andNeftel, A.: Cut-induced VOC emissions from agricultural grass-lands, Plant Biol., 10, 76–85, doi:10.1055/s-2007-965043, 2008.
de Gouw, J. and Warneke, C.: Measurements of volatile organiccompounds in the earth’s atmosphere using proton-transfer-reaction mass spectrometry, Mass Spectrom. Rev., 26, 223–257,doi:10.1002/mas.20119, 2007.
De Gouw, J. A., Howard, C. J., Custer, T. G., and Fall, R.: Emis-sions of volatile organic compounds from cut grass and cloverare enhanced during the drying process, Geophys. Res. Lett., 26,811–814, doi:10.1029/1999GL900076, 1999.
De Gouw, J. A., Howard, C. J., Custer, T. G., Baker, B. M., andFall, R.: Proton-transfer chemical-ionization mass spectrometryallows real-time analysis of volatile organic compounds releasedfrom cutting and drying of crops, Environ. Sci. Technol., 34,2640–2648, doi:10.1021/es991219k, 2000.
de Gouw, J., Warneke, C., Karl, T., Eerdekens, G., van der Veen,C., and Fall, R.: Sensitivity and specificity of atmospheric tracegas detection by proton-transfer-reaction mass spectrometry,Int. J. Mass Spectrom., 223–224, 365–382, doi:10.1016/S1387-3806(02)00926-0, 2003.
Derstroff, B., Sander, R., Hueser, I., Parchatka, U., Bourtsoukidis,E., Crowley, J. N., Fischer, H., Phillips, G. J., Schuladen, J.,Mallik, C., Harder, H., Sauvage, C., Stönner, C., Kesselmeier,J., Lelieveld, J., and Williams, J.: Volatile organic compounds(VOCs) in photochemically aged air the Eastern and WesternMediterranean, Atmos. Chem. Phys. Discuss., in preparation,2016.
Donoso, L., Romero, R., Rondon, A., Fernandez, E., Oyola,P., and Sanhueza, E.: Natural and anthropogenic C2 to C6hydrocarbons in the central-eastern Venezuelan atmosphereduring the rainy season, J. Atmos. Chem., 25, 201–214,doi:10.1007/BF00053791, 1996.
Fall, R.: Abundant oxygenates in the atmosphere: a bio-chemical perspective, Chem. Rev., 103, 4941–4952,doi:10.1021/cr0206521, 2003.
Feng, Y., Wen, S., Wang, X., Sheng, G., He, Q., Tang, J., and Fu,J.: Indoor and outdoor carbonyl compounds in the hotel ball-rooms in Guangzhou, China, Atmos. Environ., 38, 103–112,doi:10.1016/j.atmosenv.2003.09.061, 2004.
Finlayson-Pitts, B. J. and Pitts, J. N.: Photochemistry of ImportantAtmospheric Species, in: Chemistry of the Upper and Lower At-mosphere, 86–129, Elsevier, Academic Press, USA, 2000.
Finlayson-Pitts, B. J. and Pitts Jr., J. N.: Tropospheric airpollution: Ozone, airborne toxics, polycyclic aromatichydrocarbons, and particles, Science, 276, 1045–1052,doi:10.1126/science.276.5315.1045, 1997.
Folkins, I., Chatfield, R., Singh, H., Chen, Y., and Heikes, B.:Ozone production efficiencies of acetone and peroxides inthe upper troposphere, Geophys. Res. Lett., 25, 1305–1308,doi:10.1029/98GL01030, 1998.
Genard-Zielinski, A.-C., Boissard, C., Fernandez, C., Kalogridis,C., Lathière, J., Gros, V., Bonnaire, N., and Ormeño, E.: Vari-ability of BVOC emissions from a Mediterranean mixed forestin southern France with a focus on Quercus pubescens, Atmos.Chem. Phys., 15, 431–446, doi:10.5194/acp-15-431-2015, 2015.
Goldstein, A. H. and Schade, G. W.: Quantifying biogenic and an-thropogenic contributions to acetone mixing ratios in a rural envi-ronment, Atmos. Environ., 34, 4997–5006, doi:10.1016/S1352-2310(00)00321-6, 2000.
Grant, D. D., Fuentes, J. D., Chan, S., Stockwell, W. R., Wang,D., and Ndiaye, S. A.: Volatile organic compounds at a ru-ral site in western Senegal, J. Atmos. Chem., 60, 19–35,doi:10.1007/s10874-008-9106-1, 2008.
Greenberg, J. P. and Zimmerman, P. R.: Nonmethane hydrocarbonsin remote tropical, continental, and marine atmospheres, J. Geo-phys. Res., 89, 4767, doi:10.1029/JD089iD03p04767, 1984.
Grosjean, D., Grosjean, E., and Moreira, L. F. R.: Speciated Ambi-ent Carbonyls in Rio de Janeiro, Brazil, Environ. Sci. Technol.,36, 1389–1395, doi:10.1021/es0111232, 2002.
Hafner, S. D., Howard, C., Muck, R. E., Franco, R. B., Montes,F., Green, P. G., Mitloehner, F., Trabue, S. L., and Rotz, C.A.: Emission of volatile organic compounds from silage: Com-pounds, sources, and implications, Atmos. Environ., 77, 827–839, doi:10.1016/j.atmosenv.2013.04.076, 2013.
Hellén, H., Hakola, H., Reissell, A., and Ruuskanen, T. M.:Carbonyl compounds in boreal coniferous forest air inHyytiälä, Southern Finland, Atmos. Chem. Phys., 4, 1771–1780,doi:10.5194/acp-4-1771-2004, 2004.
Hellén, H., Hakola, H., Pystynen, K.-H., Rinne, J., and Haapanala,S.: C2–C10 hydrocarbon emissions from a boreal wetland andforest floor, Biogeosciences, 3, 167–174, doi:10.5194/bg-3-167-2006, 2006.
Ho, K. F., Lee, S. C., Louie, P. K. K., and Zou, S. C.: Seasonal varia-tion of carbonyl compound concentrations in urban area of HongKong, Atmos. Environ., 36, 1259–1265, doi:10.1016/S1352-2310(01)00570-2, 2002.
Holzinger, R., Rottenberger, S., Crutzen, P. J., Kesselmeier, J., andSandoval-Soto, L.: Emissions of volatile organic compoundsfrom Quercus ilex L. measured by Proton Transfer ReactionMass Spectrometry under different environmental conditions, J.Geophys. Res., 105, 20573–20579, doi:10.1029/2000jd900296,2000.
Holzinger, R., Lee, A., Paw, K. T., and Goldstein, U. A. H.: Ob-servations of oxidation products above a forest imply biogenicemissions of very reactive compounds, Atmos. Chem. Phys., 5,67–75, doi:10.5194/acp-5-67-2005, 2005.
Holzinger, R., Millet, D. B., Williams, B., Lee, A., Kreisberg, N.,Hering, S. V., Jimenez, J., Allan, J. D., Worsnop, D. R., and
Atmos. Chem. Phys., 16, 10965–10984, 2016 www.atmos-chem-phys.net/16/10965/2016/
A. M. Yáñez-Serrano et al.: Atmospheric mixing ratios of methyl ethyl ketone (2-butanone) 10981
Goldstein, A. H.: Emission, oxidation, and secondary organicaerosol formation of volatile organic compounds as observed atChebogue Point, Nova Scotia, J. Geophys. Res., 112, D10S24,doi:10.1029/2006JD007599, 2007.
IBGE: Estimativas da população residente no Brasil e unidadesda Federação com data de referência em 1◦ de julhode 2014, available at: ftp://ftp.ibge.gov.br/Estimativas_de_Populacao/Estimativas_2014/estimativa_dou_2014.pdf (last ac-cess: 1 September 2016), 2014.
Inomata, S., Tanimoto, H., Kato, S., Suthawaree, J., Kanaya, Y.,Pochanart, P., Liu, Y., and Wang, Z.: PTR-MS measurementsof non-methane volatile organic compounds during an intensivefield campaign at the summit of Mount Tai, China, in June 2006,Atmos. Chem. Phys., 10, 7085–7099, doi:10.5194/acp-10-7085-2010, 2010.
Isidorov, V. A., Zenkevich, I. G., and Ioffe, B. V.: Volatile organiccompounds in the atmosphere of forests, Atmos. Environ., 19,1–8, doi:10.1016/0004-6981(85)90131-3, 1985.
Jardine, A. B., Jardine, K. J., Fuentes, J. D., Martin, S. T., Mar-tins, G., Durgante, F., Carneiro, V., Higuchi, N., Manzi, A. O.,and Chambers, J. Q.: Highly reactive light-dependent monoter-penes in the Amazon, Geophys. Res. Lett., 42, 1576–1583,doi:10.1002/2014GL062573, 2015.
Jardine, K., Abrell, L., Kurc, S. A., Huxman, T., Ortega, J., andGuenther, A.: Volatile organic compound emissions from Lar-rea tridentata (creosotebush), Atmos. Chem. Phys., 10, 12191–12206, doi:10.5194/acp-10-12191-2010, 2010.
Jenkin, M. E., Saunders, S. M., and Pilling, M. J.: The tropo-spheric degradation of volatile organic compounds: a proto-col for mechanism development, Atmos. Environ., 31, 81–104,doi:10.1016/S1352-2310(96)00105-7, 1997.
Jordan, A., Haidacher, S., Hanel, G., Hartungen, E., Märk, L., See-hauser, H., Schottkowsky, R., Sulzer, P., and Märk, T. D.: A highresolution and high sensitivity proton-transfer-reaction time-of-flight mass spectrometer (PTR-TOF-MS), Int. J. Mass. Spec-trom., 286, 122–128, doi:10.1016/j.ijms.2009.07.005, 2009a.
Jordan, C., Fitz, E., Hagan, T., Sive, B., Frinak, E., Haase, K.,Cottrell, L., Buckley, S., and Talbot, R.: Long-term study ofVOCs measured with PTR-MS at a rural site in New Hamp-shire with urban influences, Atmos. Chem. Phys., 9, 4677–4697,doi:10.5194/acp-9-4677-2009, 2009b.
Kalogridis, C., Gros, V., Sarda-Esteve, R., Langford, B., Loubet, B.,Bonsang, B., Bonnaire, N., Nemitz, E., Genard, A.-C., Boissard,C., Fernandez, C., Ormeño, E., Baisnée, D., Reiter, I., and Lath-ière, J.: Concentrations and fluxes of isoprene and oxygenatedVOCs at a French Mediterranean oak forest, Atmos. Chem.Phys., 14, 10085–10102, doi:10.5194/acp-14-10085-2014, 2014.
Karl, T., Crutzen, P. J., Mandl, M., Staudinger, M., Guenther, A.,Jordan, A., Fall, R., and Lindinger, W.: Variability-lifetime rela-tionship of VOCs observed at the Sonnblick Observatory 1999– estimation of HO-densities, Atmos. Environ., 35, 5287–5300,doi:10.1016/S1352-2310(01)00341-7, 2001.
Karl, T., Harren, F., Warneke, C., de Gouw, J., Grayless, C., andFall, R.: Senescing grass crops as regional sources of reactivevolatile organic compounds, J. Geophys. Res.-Atmos., 110, 1–11, doi:10.1029/2005JD005777, 2005a.
Karl, T., Harley, P., Guenther, A., Rasmussen, R., Baker, B., Jar-dine, K., and Nemitz, E.: The bi-directional exchange of oxy-genated VOCs between a loblolly pine (Pinus taeda) planta-
tion and the atmosphere, Atmos. Chem. Phys., 5, 3015–3031,doi:10.5194/acp-5-3015-2005, 2005b.
Karl, T., Guenther, A., Turnipseed, A., Tyndall, G., Artaxo, P., andMartin, S.: Rapid formation of isoprene photo-oxidation prod-ucts observed in Amazonia, Atmos. Chem. Phys., 9, 7753–7767,doi:10.5194/acp-9-7753-2009, 2009.
Karl, T. G., Spirig, C., Rinne, J., Stroud, C., Prevost, P., Green-berg, J., Fall, R., and Guenther, A.: Virtual disjunct eddy covari-ance measurements of organic compound fluxes from a subalpineforest using proton transfer reaction mass spectrometry, Atmos.Chem. Phys., 2, 279–291, doi:10.5194/acp-2-279-2002, 2002.
Karl, T. G., Christian, T. J., Yokelson, R. J., Artaxo, P., Hao,W. M., and Guenther, A.: The Tropical Forest and Fire Emis-sions Experiment: method evaluation of volatile organic com-pound emissions measured by PTR-MS, FTIR, and GC fromtropical biomass burning, Atmos. Chem. Phys., 7, 5883–5897,doi:10.5194/acp-7-5883-2007, 2007.
Katzenstein, A. S., Doezema, L. A., Simpson, I. J., Blake, D. R.,and Rowland, F. S.: Extensive regional atmospheric hydrocarbonpollution in the southwestern United States, P. Natl. Acad. Sci.USA, 100, 11975–11979, doi:10.1073/pnas.1635258100, 2003.
Keenan, T., Niinemets, Ü., Sabate, S., Gracia, C., and Peñuelas,J.: Process based inventory of isoprenoid emissions from Euro-pean forests: model comparisons, current knowledge and uncer-tainties, Atmos. Chem. Phys., 9, 4053–4076, doi:10.5194/acp-9-4053-2009, 2009.
Kesselmeier, J. and Staudt, M.: Biogenic volatile or-ganic compounds (VOC): An overview on emission,physiology and ecology, J. Atmos. Chem., 33, 23–88,doi:10.1023/A:1006127516791, 1999.
Kesselmeier, J., Kuhn, U., Rottenberger, S., Biesenthal, T., Wolf,A., Schebeske, G., Andreae, M. O., Ciccioli, P., Brancaleoni, E.,Frattoni, M., Oliva, S. T., Botelho, M. L., Silva, C. M. A., andTavares, T. M.: Concentrations and species composition of atmo-spheric volatile organic compounds (VOCs) as observed duringthe wet and dry season in Rondonia (Amazonia), J. Geophys.Res., 107, 1–13, doi:10.1029/2000jd000267, 2002.
Kim, S., Kim, S.-Y., Lee, M., Shim, H., Wolfe, G. M., Guenther,A. B., He, A., Hong, Y., and Han, J.: Impact of isoprene andHONO chemistry on ozone and OVOC formation in a semiru-ral South Korean forest, Atmos. Chem. Phys., 15, 4357–4371,doi:10.5194/acp-15-4357-2015, 2015.
Kirstine, W., Galbally, I., Ye, Y., and Hooper, M.: Emissions ofvolatile organic compounds (primarily oxygenated species) frompasture, J. Geophys. Res., 103, 10605, doi:10.1029/97JD03753,1998.
König, G., Brunda, M., Puxbaum, H., Hewitt, C. N., Duckham, S.C., and Rudolph, J.: Relative contribution of oxygenated hydro-carbons to the total biogenic VOC emissions of selected mid-European agricultural and natural plant species, Atmos. Environ.,29, 861–874, doi:10.1016/1352-2310(95)00026-U, 1995.
Kuhn, U., Ganzeveld, L., Thielmann, A., Dindorf, T., Schebeske,G., Welling, M., Sciare, J., Roberts, G., Meixner, F. X.,Kesselmeier, J., Lelieveld, J., Kolle, O., Ciccioli, P., Lloyd, J.,Trentmann, J., Artaxo, P., and Andreae, M. O.: Impact of ManausCity on the Amazon Green Ocean atmosphere: ozone production,precursor sensitivity and aerosol load, Atmos. Chem. Phys., 10,9251–9282, doi:10.5194/acp-10-9251-2010, 2010.
www.atmos-chem-phys.net/16/10965/2016/ Atmos. Chem. Phys., 16, 10965–10984, 2016
10982 A. M. Yáñez-Serrano et al.: Atmospheric mixing ratios of methyl ethyl ketone (2-butanone)
Kwok, E. S. C., Arey, J., and Atkinson, R.: Alkoxy Radical Iso-merization in the OH Radical-Initiated Reactions of C4–C8 n-Alkanes, J. Phys. Chem., 100, 214–219, doi:10.1021/jp952036x,1996.
Langford, B., Davison, B., Nemitz, E., and Hewitt, C. N.: Mix-ing ratios and eddy covariance flux measurements of volatile or-ganic compounds from an urban canopy (Manchester, UK), At-mos. Chem. Phys., 9, 1971–1987, doi:10.5194/acp-9-1971-2009,2009.
Langford, B., Acton, W., Ammann, C., Valach, A., and Nemitz, E.:Eddy-covariance data with low signal-to-noise ratio: time-lag de-termination, uncertainties and limit of detection, Atmos. Meas.Tech., 8, 4197–4213, doi:10.5194/amt-8-4197-2015, 2015.
Laothawornkitkul, J., Taylor, J. E., Paul, N. D., and Hewitt, C. N.:Biogenic volatile organic compounds in the Earth system, NewPhytol., 183, 27–51, doi:10.1111/j.1469-8137.2009.02859.x,2009.
Lee, A., Goldstein, A. H., Kroll, J. H., Ng, N. L., Varut-bangkul, V., Flagan, R. C., and Seinfeld, J. H.: Gas-phaseproducts and secondary aerosol yields from the photooxida-tion of 16 different terpenes, J. Geophys. Res., 111, D17305,doi:10.1029/2006JD007050, 2006.
Legreid, G., Lööv, J. B., Staehelin, J., Hueglin, C., Hill, M.,Buchmann, B., Prevot, A. S. H., and Reimann, S.: Oxy-genated volatile organic compounds (OVOCs) at an ur-ban background site in Zürich (Europe): Seasonal varia-tion and source allocation, Atmos. Environ., 41, 8409–8423,doi:10.1016/j.atmosenv.2007.07.026, 2007.
Lindinger, W., Hansel, A., and Jordan, A.: On-line monitoring ofvolatile organic compounds at pptv levels by means of proton-transfer-reaction mass spectrometry (PTR-MS) medical appli-cations, food control and environmental research, Int. J. MassSpectrom., 173, 191–241, doi:10.1016/S0168-1176(97)00281-4,1998.
Liu, Y., Yuan, B., Li, X., Shao, M., Lu, S., Li, Y., Chang, C.-C., Wang, Z., Hu, W., Huang, X., He, L., Zeng, L., Hu, M.,and Zhu, T.: Impact of pollution controls in Beijing on atmo-spheric oxygenated volatile organic compounds (OVOCs) dur-ing the 2008 Olympic Games: observation and modeling impli-cations, Atmos. Chem. Phys., 15, 3045–3062, doi:10.5194/acp-15-3045-2015, 2015.
Liu, Y., Liu, C.-Y., Yang, G.-P., Zhang, H.-H., and Zhang, S.:Biogeochemistry of dimethylsulfoniopropionate, dimethylsul-fide and acrylic acid in the Yellow Sea and the Bohai Sea duringautumn, Environ. Chem., 13, 127–139, doi:10.1071/EN15025,2016.
Martin, S. T., Andreae, M. O., Althausen, D., Artaxo, P., Baars, H.,Borrmann, S., Chen, Q., Farmer, D. K., Guenther, A., Gunthe,S. S., Jimenez, J. L., Karl, T., Longo, K., Manzi, A., Müller, T.,Pauliquevis, T., Petters, M. D., Prenni, A. J., Pöschl, U., Rizzo,L. V., Schneider, J., Smith, J. N., Swietlicki, E., Tota, J., Wang,J., Wiedensohler, A., and Zorn, S. R.: An overview of the Ama-zonian Aerosol Characterization Experiment 2008 (AMAZE-08), Atmos. Chem. Phys., 10, 11415–11438, doi:10.5194/acp-10-11415-2010, 2010.
Martinez, R. D., Buitrago, A. A., Howell, N. W., Hearn, C. H., andJoens, J. A.: The near U.V. absorption spectra of several aliphaticaldehydes and ketones at 300 K, Atmos. Environ. A-Gen., 26,785–792, doi:10.1016/0960-1686(92)90238-G, 1992.
McKeen, S. A., Gierczak, T., Burkholder, J. B., Wennberg, P. O.,Hanisco, T. F., Keim, E. R., Gao, R.-S., Liu, S. C., Ravishankara,A. R., and Fahey, D. W.: The photochemistry of acetone in theupper troposphere: A source of odd-hydrogen radicals, Geophys.Res. Lett., 24, 3177–3180, doi:10.1029/97GL03349, 1997.
McKinney, K. A., Lee, B. H., Vasta, A., Pho, T. V., and Munger, J.W.: Emissions of isoprenoids and oxygenated biogenic volatileorganic compounds from a New England mixed forest, Atmos.Chem. Phys., 11, 4807–4831, doi:10.5194/acp-11-4807-2011,2011.
Miller, R. E., Jensen, R., and Woodrow, I. E.: Frequency of cyano-genesis in tropical rainforests of far north Queensland, Australia,Ann. Bot., 97, 1017–1044, doi:10.1093/aob/mcl048, 2006.
Millet, D. B., Baasandorj, M., Farmer, D. K., Thornton, J. A., Bau-mann, K., Brophy, P., Chaliyakunnel, S., de Gouw, J. A., Graus,M., Hu, L., Koss, A., Lee, B. H., Lopez-Hilfiker, F. D., Neu-man, J. A., Paulot, F., Peischl, J., Pollack, I. B., Ryerson, T. B.,Warneke, C., Williams, B. J., and Xu, J.: A large and ubiqui-tous source of atmospheric formic acid, Atmos. Chem. Phys., 15,6283–6304, doi:10.5194/acp-15-6283-2015, 2015.
Moore, D. P., Remedios, J. J., and Waterfall, A. M.: Global distri-butions of acetone in the upper troposphere from MIPAS spec-tra, Atmos. Chem. Phys., 12, 757–768, doi:10.5194/acp-12-757-2012, 2012.
National Center for Biotechnology: PubChem CompoundDatabase; CID= 6569, Open Chem. database, available at:http://pubchem.ncbi.nlm.nih.gov/compound/2-Butanone, lastaccess: 22 March 2015.
Neier, W. and Strehlke, G.: 2-Butanone, in Ullmann’s Encyclopediaof Industrial Chemistry, Wiley-VCH, Weinheim, 2002.
Niinemets, Ü., Fares, S., Harley, P., and Jardine, K. J.: Bidirectionalexchange of biogenic volatiles with vegetation: emission sources,reactions, breakdown and deposition., Plant. Cell Environ., 37,1790–809, doi:10.1111/pce.12322, 2014.
Nobre, C. A., Obregón, G. O., Marengo, J. A., Fu, R., and Poveda,G.: Characteristics of Amazonian climate: Main features, Geo-phys. Monogr. Ser., 186, 149–162, doi:10.1029/2008GM000720,2009.
Noe, S. M., Kimmel, V., Hüve, K., Copolovici, L., Portillo-Estrada, M., Püttsepp, Ü., Jõgiste, K., Niinemets, Ü., Hört-nagl, L., and Wohlfahrt, G.: Ecosystem-scale biosphere–atmosphere interactions of a hemiboreal mixed forest standat Järvselja, Estonia, Forest Ecol. Manage., 262, 71–81,doi:10.1016/j.foreco.2010.09.013, 2011.
Noe, S. M., Hüve, K., Niinemets, Ü., and Copolovici, L.: Sea-sonal variation in vertical volatile compounds air concentrationswithin a remote hemiboreal mixed forest, Atmos. Chem. Phys.,12, 3909–3926, doi:10.5194/acp-12-3909-2012, 2012.
Noe, S. M., Krasnov, D., Krasnova, A., Cordey, H. P. E., and Ni-inemets, Ü.: Seasonal variation and characterisation of reactivetrace gas mixing ratios over a hemi-boreal mixed forest site inEstonia, Boreal Environ. Res., 21, 332–344, 2016.
Nölscher, A. C., Yáñez-Serrano, A. M., Wolff, S., de Araujo, A.C., Lavric, J. V., Kesselmeier, J., and Williams, J.: Unexpectedseasonality in quantity and composition of Amazon rainforest airreactivity, Nat. Commun., 7, 10383, doi:10.1038/ncomms10383,2016.
Atmos. Chem. Phys., 16, 10965–10984, 2016 www.atmos-chem-phys.net/16/10965/2016/

A. M. Yáñez-Serrano et al.: Atmospheric mixing ratios of methyl ethyl ketone (2-butanone) 10983
Nozière, B.: Organic reactions increasing the absorption indexof atmospheric sulfuric acid aerosols, Geophys. Res. Lett., 32,L03812, doi:10.1029/2004GL021942, 2005.
Pinho, P. G., Pio, C. A., and Jenkin, M. E.: Evaluation of isoprenedegradation in the detailed tropospheric chemical mechanism,MCM v3, using environmental chamber data, Atmos. Environ.,39, 1303–1322, doi:10.1016/j.atmosenv.2004.11.014, 2005.
Prather, M. J. and Jacob, D. J.: A persistent imbalance in HOxand NOx photochemistry of the upper troposphere driven bydeep tropical convection, Geophys. Res. Lett., 24, 3189–3192,doi:10.1029/97GL03027, 1997.
Rinne, H. J. I., Guenther, A. B., Greenberg, J. P., and Harley, P. C.:Isoprene and monoterpene fluxes measured above Amazonianrainforest and their dependence on light and temperature, Atmos.Environ., 36, 2421–2426, doi:10.1016/S1352-2310(01)00523-4,2002.
Rodigast, M., Mutzel, A., Schindelka, J., and Herrmann, H.: A newsource of methylglyoxal in the aqueous phase, Atmos. Chem.Phys., 16, 2689–2702, doi:10.5194/acp-16-2689-2016, 2016.
Rollins, A. W., Kiendler-Scharr, A., Fry, J. L., Brauers, T., Brown,S. S., Dorn, H.-P., Dubé, W. P., Fuchs, H., Mensah, A., Mentel, T.F., Rohrer, F., Tillmann, R., Wegener, R., Wooldridge, P. J., andCohen, R. C.: Isoprene oxidation by nitrate radical: alkyl nitrateand secondary organic aerosol yields, Atmos. Chem. Phys., 9,6685–6703, doi:10.5194/acp-9-6685-2009, 2009.
Ruuskanen, T. M., Müller, M., Schnitzhofer, R., Karl, T., Graus, M.,Bamberger, I., Hörtnagl, L., Brilli, F., Wohlfahrt, G., and Hansel,A.: Eddy covariance VOC emission and deposition fluxes abovegrassland using PTR-TOF, Atmos. Chem. Phys., 11, 611–625,doi:10.5194/acp-11-611-2011, 2011.
Sander, R.: Compilation of Henry’s law constants (version 4.0)for water as solvent, Atmos. Chem. Phys., 15, 4399–4981,doi:10.5194/acp-15-4399-2015, 2015.
Schade, G. W., Solomon, S. J., Dellwik, E., Pilegaard, K., andLadstätter-Weissenmayer, A.: Methanol and other VOC fluxesfrom a Danish beech forest during late springtime, Biogeochem-istry, 106, 337–355, doi:10.1007/s10533-010-9515-5, 2011.
Schauer, J. J., Kleeman, M. J., Cass, G. R., and Simoneit, B. R. T.:Measurement of Emissions from Air Pollution Sources. 3. C1–C29 Organic Compounds from Fireplace Combustion of Wood,Environ. Sci. Technol., 35, 1716–1728, doi:10.1021/es001331e,2001.
Singh, H. B., Salas, L. J., Chatfield, R. B., Czech, E., Fried,A., Walega, J., Evans, M. J., Field, B. D., Jacob, D. J.,Blake, D., Heikes, B., Talbot, R., Sachse, G., Crawford, J. H.,Avery, M. A., Sandholm, S., and Fuelberg, H.: Analysis ofthe atmospheric distribution, sources, and sinks of oxygenatedvolatile organic chemicals based on measurements over the Pa-cific during TRACE-P, J. Geophys. Res.-Atmos., 109, D15S07,doi:10.1029/2003JD003883, 2004.
Slowik, J. G., Vlasenko, A., McGuire, M., Evans, G. J., and Abbatt,J. P. D.: Simultaneous factor analysis of organic particle and gasmass spectra: AMS and PTR-MS measurements at an urban site,Atmos. Chem. Phys., 10, 1969–1988, doi:10.5194/acp-10-1969-2010, 2010.
Sommariva, R., de Gouw, J. A., Trainer, M., Atlas, E., Goldan, P.D., Kuster, W. C., Warneke, C., and Fehsenfeld, F. C.: Emissionsand photochemistry of oxygenated VOCs in urban plumes in
the Northeastern United States, Atmos. Chem. Phys., 11, 7081–7096, doi:10.5194/acp-11-7081-2011, 2011.
Song, G. C. and Ryu, C.-M.: Two Volatile Organic CompoundsTrigger Plant Self-Defense against a Bacterial Pathogen and aSucking Insect in Cucumber under Open Field Conditions, Int. J.Mol. Sci., 14, 9803–9819, doi:10.3390/ijms14059803, 2013.
Steeghs, M., Bais, H. P., de Gouw, J., Goldan, P., Kuster, W., North-way, M., Fall, R., and Vivanco, J. M.: Proton-transfer-reactionmass spectrometry as a new tool for real time analysis of root-secreted volatile organic compounds in Arabidopsis, Plant Phys-iol., 135, 47–58, doi:10.1104/pp.104.038703, 2004.
Stein, A. F., Draxler, R. R., Rolph, G. D., Stunder, B. J. B., Co-hen, M. D., Ngan, F., Stein, A. F., Draxler, R. R., Rolph, G. D.,Stunder, B. J. B., Cohen, M. D., and Ngan, F.: NOAA’s HYS-PLIT Atmospheric Transport and Dispersion Modeling System,B. Am. Meteorol. Soc., 96, 2059–2077, doi:10.1175/BAMS-D-14-00110.1, 2015.
Sun, Z., Copolovici, L., and Niinemets, Ü.: Can the capacity for iso-prene emission acclimate to environmental modifications duringautumn senescence in temperate deciduous tree species Populustremula?, J. Plant Res., 125, 263–274, doi:10.1007/s10265-011-0429-7, 2012.
Verschueren, K.: Methyl Ethyl Ketone, in: Handbook of Environ-mental Data on Organic Chemicals, 850–852, Van NostrandReinhold Co., New York, 1983.
Vetter, J.: Plant cyanogenic glycosides, Toxicon, 38, 11–36,doi:10.1016/S0041-0101(99)00128-2, 2000.
Warneke, C., Karl, T., Judmaier, H., Hansel, A., Jordan, A.,Lindinger, W., and Crutzen, P. J.: Acetone, methanol, andother partially oxidized volatile organic emissions from deadplant matter by abiological processes: Significance for atmo-spheric HOx chemistry, Global Biogeochem. Cy., 13, 9–17,doi:10.1029/98GB02428, 1999.
Warneke, C., Mckeen, S. A., Gouw, J. A. De, Goldan, P. D.,Kuster, W. C., Holloway, J. S., Williams, E. J., Lerner, B. M.,Parrish, D. D., Trainer, M., Fehsenfeld, F. C., Kato, S., At-las, E. L., Baker, A., and Blake, D. R.: Determination of urbanvolatile organic compound emission ratios and comparison withan emissions database, J. Geophys. Res.-Atmos., 112, D10S47,doi:10.1029/2006JD007930, 2007.
Wheatley, R., Hackett, C., Bruce, A., and Kundzewicz, A.: Ef-fect of substrate composition on production of volatile organiccompounds from Trichoderma spp. Inhibitory to wood decayfungi, Int. Biodeter. Biodegr., 39, 199–205, doi:10.1016/S0964-8305(97)00015-2, 1997.
Wilkins, K.: Volatile metabolites from actinomycetes, Chemo-sphere, 32, 1427–1434, doi:10.1016/0045-6535(96)00051-3,1996.
Williams, J., Pöschl, U., Crutzen, P. J., Hansel, A., Holzinger,R., Warneke, C., Lindinger, W., and Lelieveld, J.: An atmo-spheric chemistry interpretation of mass scans obtained froma proton transfer mass spectrometer flown over the tropi-cal rainforest of Surinam, J. Atmos. Chem., 38, 133–166,doi:10.1023/a:1006322701523, 2001.
Yáñez-Serrano, A. M., Nölscher, A. C., Williams, J., Wolff, S.,Alves, E., Martins, G. A., Bourtsoukidis, E., Brito, J., Jardine,K., Artaxo, P., and Kesselmeier, J.: Diel and seasonal changesof biogenic volatile organic compounds within and above an
www.atmos-chem-phys.net/16/10965/2016/ Atmos. Chem. Phys., 16, 10965–10984, 2016
10984 A. M. Yáñez-Serrano et al.: Atmospheric mixing ratios of methyl ethyl ketone (2-butanone)
Amazonian rainforest, Atmos. Chem. Phys., 15, 3359–3378,doi:10.5194/acp-15-3359-2015, 2015.
Zannoni, N., Gros, V., Lanza, M., Sarda, R., Bonsang, B., Kalo-gridis, C., Preunkert, S., Legrand, M., Jambert, C., Boissard, C.,and Lathiere, J.: OH reactivity and concentrations of biogenicvolatile organic compounds in a Mediterranean forest of downyoak trees, Atmos. Chem. Phys., 16, 1619–1636, doi:10.5194/acp-16-1619-2016, 2016.
Zhou, X. and Mopper, K.: Carbonyl compounds in the lower marinetroposphere over the Caribbean Sea and Bahamas, J. Geophys.Res., 98, 2385, doi:10.1029/92JC02772, 1993.
Zimmerman, P. R., Greenberg, J. P., and Westberg, C. E.: Mea-surements of atmospheric hydrocarbons and biogenic emissionfluxes in the Amazon Boundary layer, J. Geophys. Res., 93, 1407,doi:10.1029/JD093iD02p01407, 1988.
Atmos. Chem. Phys., 16, 10965–10984, 2016 www.atmos-chem-phys.net/16/10965/2016/