atmospheric deposition as a source of heavy metals in...
TRANSCRIPT

1
Atmospheric deposition as a source of heavy metals in urban stormwater
Janaka Gunawardena, Prasanna Egodawatta, Godwin A. Ayoko and Ashantha Goonetilleke
Science and Engineering Faculty, Queensland University of Technology, GPO Box 2434,
Brisbane QLD 4001, AUSTRALIA
E-mail: [email protected]; [email protected]; [email protected];

2
Atmospheric deposition as a source of heavy metals in urban stormwater
Abstract Atmospheric deposition is one of the most important pathways of urban stormwater pollution. Atmospheric deposition which can be in the form of either wet or dry deposition have distinct characteristics in terms of associated particulate sizes, pollutant types and influential parameters. This paper discusses the outcomes of a comprehensive research study undertaken to identify important traffic characteristics and climate factors such as antecedent dry period and rainfall characteristics which influences the characteristics of wet and dry deposition of solids and heavy metals. The outcomes confirmed that Zinc (Zn) is correlated with traffic volume whereas Lead (Pb), Cadmium (Cd), Nickel (Ni), and Copper (Cu) are correlated with traffic congestion. Consequently, reducing traffic congestion will be more effective than reducing traffic volume for improving air quality particularly in relation to Pb, Cd, Ni, and Cu. Zn was found to have the highest atmospheric deposition rate compared to other heavy metals. Zn in dry deposition is associated with relatively larger particle size fractions (>10 µm), whereas Pb, Cd, Ni and Cu are associated with relatively smaller particle size fractions (<10 µm). The analysis further revealed that bulk (wet plus dry) deposition which is correlated with rainfall depth and contains a relatively higher percentage of smaller particles compared to dry deposition which is correlated with the antecedent dry period. As particles subjected to wet deposition are smaller, they disperse over a larger area from the source of origin compared to particles subjected to dry deposition as buoyancy forces become dominant for smaller particles compared to the influence of gravity. Furthermore, exhaust emission particles were found to be primarily associated with bulk deposition compared to dry deposition particles which mainly originate from vehicle component wear. Keywords: air pollutants, atmospheric deposition, heavy metals, stormwater pollution, traffic emissions 1. Introduction Urban stormwater runoff is an important pathway for the transport of pollutants generated by anthropogenic activities. Key pollutants such as heavy metals which can be primarily related to traffic related emissions will either accumulate directly on ground surfaces or will initially accumulate in the atmosphere (Gunawardana et al., 2012; Sabin et al., 2006). With time, these atmospheric phase pollutants will also deposit on ground surfaces for eventual transport by stormwater (Huston et al., 2009). Therefore, atmospheric deposition can directly influence stormwater quality. The importance of this phenomenon needs to be viewed in the context of incessant urban growth common to most parts of the world and coupled with increasing anthropogenic activities such as vehicular traffic. For example, the average annual growth rate of new vehicle registrations in Australia from 2003 to 2008 was 3% (ABS, 2008). As air quality standards are commonly formulated for particles <10 µm due to human health concerns, most research on traffic related emissions has focused on particles in this size fraction (Fitz, 2001; Sabin et al., 2006). However, Kakooei and Kakooei (2007) have noted that more than 50% of total suspended particulate matter from vehicle emissions is >10 µm. Also, due to gravity, coarse particles deposit relatively rapidly from the atmosphere. Therefore, particles >10 µm are the most important in terms of atmospheric deposition and resulting stormwater pollution.

3
Fundamentally, there are two types of atmospheric depositions which have distinct characteristics in the context of stormwater pollution. During rainfall, atmospheric deposition occurs as wet deposition and at other times, as dry deposition. The investigation of dry deposition has been widely undertaken at local and regional scales (for example, Davis and Birch, 2011; Paode et al., 1998). However, there has been only limited investigation of both, wet and dry deposition together, particularly in Australia (Huston et al., 2009; Pekey et al., 2007). Based on past research findings, it has been concluded that atmospheric pollution is influenced by traffic and land use related activities (Davis and Birch, 2011; Opher and Friedler, 2010). Implicitly, land use related activities also influence traffic characteristics. This paper presents the outcomes of a research study which investigated the relationships between atmospheric deposition of solids and associated heavy metals with antecedent dry period and rainfall characteristics. Additionally, the correlation of solids and heavy metals with traffic characteristics was also investigated. 2. Materials and methods 2.1 Study site selection Field investigations were conducted at two sets of study sites at Gold Coast, Australia as shown in Fig. 1. The first set of sites was from highly urbanised areas (referred to as “Set 1”) with a varied range of urban activities in the immediate vicinity. This set of study sites was selected to investigate the influence of intense anthropogenic activities on atmospheric deposition. The second set of sites (referred to as “Set 2”, see Fig. 1) was located on typical suburban roads sites with a range of traffic volumes. These sites were selected primarily to investigate the influence of traffic characteristics on atmospheric deposition. Each set of study sites consisted of four sites and their characteristics are given in Table 1. Traffic volume, in the form of average daily traffic (ADT) and traffic congestion in the form of volume over capacity (V/C) was obtained for the selected “Set 2” sites using automatic traffic counters. “Set 1” sites are non road sites. Hence the collection of traffic data was not applicable for these sites. Sampling at “Set 1” sites were undertaken by positioning samplers to ensure that a representative sample was collected. “Set 2 sites were sampled by positioning samplers on the shoulder of the selected road. Wind data were obtained from the principal meteorological station at the Gold Coast Seaway (Station ID: 040764). 2.2 Field sampling As it was not practical to collect wet deposition samples separately, wet plus dry deposition referred to as bulk deposition and dry deposition sampling was conducted at each sampling location. The wet and dry deposition sampling apparatus developed by Hill and Caritat (2002) was adapted for the sampling. The sampler was modified to suit the sampling programme with two sampling heads incorporated to accommodate bulk and dry deposition sampling as shown in Fig. 2. The picket holding the sampling heads extended to a height of 2000 mm above ground level to minimise contamination from resuspended particles generated by traffic induced and natural wind. As reported by Rocher et al. (2004), resuspended particles due to vehicle induced wind is not significant at a height above 2000 mm from ground level. Both bulk and dry deposition collectors were installed at the same time immediately after a rainfall event, as the atmospheric pollutant load is minimal (Ravindra et al., 2003). One sampling head was used to collect dry deposition and the other to collect bulk deposition. Each site was sampled eight times covering three rainfall events and five dry sampling events. Dry deposition samples were collected at antecedent dry days of 3, 4, 5, 6, and 7 days after a
4
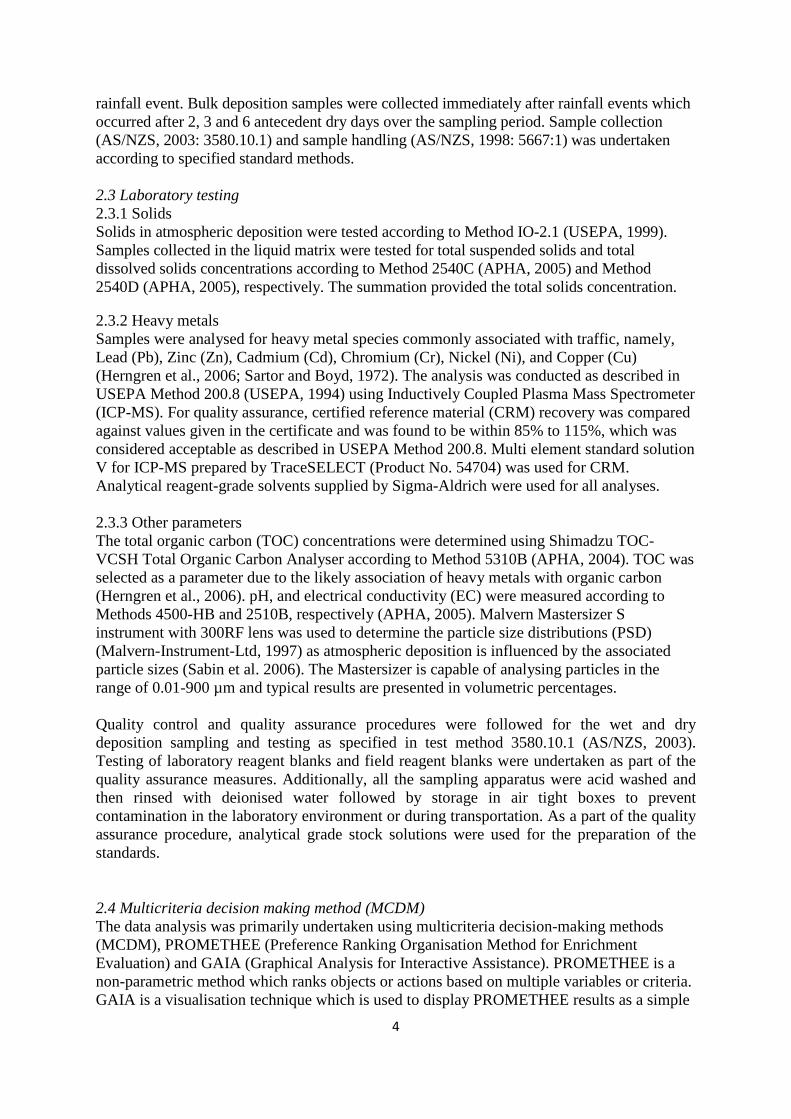
rainfall event. Bulk deposition samples were collected immediately after rainfall events which occurred after 2, 3 and 6 antecedent dry days over the sampling period. Sample collection (AS/NZS, 2003: 3580.10.1) and sample handling (AS/NZS, 1998: 5667:1) was undertaken according to specified standard methods. 2.3 Laboratory testing 2.3.1 Solids Solids in atmospheric deposition were tested according to Method IO-2.1 (USEPA, 1999). Samples collected in the liquid matrix were tested for total suspended solids and total dissolved solids concentrations according to Method 2540C (APHA, 2005) and Method 2540D (APHA, 2005), respectively. The summation provided the total solids concentration. 2.3.2 Heavy metals Samples were analysed for heavy metal species commonly associated with traffic, namely, Lead (Pb), Zinc (Zn), Cadmium (Cd), Chromium (Cr), Nickel (Ni), and Copper (Cu) (Herngren et al., 2006; Sartor and Boyd, 1972). The analysis was conducted as described in USEPA Method 200.8 (USEPA, 1994) using Inductively Coupled Plasma Mass Spectrometer (ICP-MS). For quality assurance, certified reference material (CRM) recovery was compared against values given in the certificate and was found to be within 85% to 115%, which was considered acceptable as described in USEPA Method 200.8. Multi element standard solution V for ICP-MS prepared by TraceSELECT (Product No. 54704) was used for CRM. Analytical reagent-grade solvents supplied by Sigma-Aldrich were used for all analyses. 2.3.3 Other parameters The total organic carbon (TOC) concentrations were determined using Shimadzu TOC-VCSH Total Organic Carbon Analyser according to Method 5310B (APHA, 2004). TOC was selected as a parameter due to the likely association of heavy metals with organic carbon (Herngren et al., 2006). pH, and electrical conductivity (EC) were measured according to Methods 4500-HB and 2510B, respectively (APHA, 2005). Malvern Mastersizer S instrument with 300RF lens was used to determine the particle size distributions (PSD) (Malvern-Instrument-Ltd, 1997) as atmospheric deposition is influenced by the associated particle sizes (Sabin et al. 2006). The Mastersizer is capable of analysing particles in the range of 0.01-900 µm and typical results are presented in volumetric percentages. Quality control and quality assurance procedures were followed for the wet and dry deposition sampling and testing as specified in test method 3580.10.1 (AS/NZS, 2003). Testing of laboratory reagent blanks and field reagent blanks were undertaken as part of the quality assurance measures. Additionally, all the sampling apparatus were acid washed and then rinsed with deionised water followed by storage in air tight boxes to prevent contamination in the laboratory environment or during transportation. As a part of the quality assurance procedure, analytical grade stock solutions were used for the preparation of the standards.
2.4 Multicriteria decision making method (MCDM) The data analysis was primarily undertaken using multicriteria decision-making methods (MCDM), PROMETHEE (Preference Ranking Organisation Method for Enrichment Evaluation) and GAIA (Graphical Analysis for Interactive Assistance). PROMETHEE is a non-parametric method which ranks objects or actions based on multiple variables or criteria. GAIA is a visualisation technique which is used to display PROMETHEE results as a simple

5
principal component (PC) biplot in PC1 and PC2 space (Gunawardena et al., 2012). A comprehensive review of PROMETHEE methodologies and applications is provided by Behzadian et al. (2010). Unlike the other commonly used methods for principal component analysis (PCA), which generally need a large number of samples for effective modelling, PROMETHEE can be successfully utilised for relatively small data sets. For example, Herngren et al., (2005) used a data set with only 15 objects to determine the association of heavy metals with different particle size ranges and organic matter. Therefore, PROMETHEE and GAIA have been widely used to analyse multivariate data for environmental decision making (for example, Herngren et al., 2005; Herngren et al., 2006; Khalil et al., 2004). A detailed discussion on PROMETHEE can be found elsewhere (Keller et al., 1991). Rules for the interpretation of the GAIA biplot have been provided by Espinasse et al. (1997). For the PROMETHEE analysis, the user needs to select the ranking order, weighting, preference function and a threshold value for each variable according to the objectives of the analysis (Ayoko et al., 2007). For PROMETHEE and GAIA analysis undertaken in this study, Decision Lab software (Decision Lab, 2000) was used. The V-shape preference function was selected for all the variables. This function compares values based on one threshold value for each variable. In this analysis, variables are set as maximum so that the decision axis, pi, points towards the most polluted site/s. 3. Results and discussion 3.1 Solids in atmospheric deposition 3.1.1 Dry deposition Fig. 3a illustrates the variation of dry deposition in the form of total suspended particulate matter with the antecedent dry period. The dry deposition increases with antecedent dry days for both “Set 1”and “Set 2” sites. Fig. 3a further shows that “Set 1” and “Set 2” sampling sites separate into two groups (Group A and Group B) and dry deposition at “Set 1” sites have contributed higher solids load compared to “Set 2” sampling sites for most of the sampling events irrespective of the antecedent dry days. For example, average dry deposition increased from 163.8 mg/m2 to 706.3 mg/m2 for “Set 1” sites as antecedent dry period increased from 3 to 6 days. For the Set 2 sites, consistently lower dry deposition occurred during the initial 5 days after a rainfall event. For example, except at one sampling point, average dry deposition increased from 84.4 mg/m2 to 290.2 mg/m2 as the antecedent dry period increased from 3 to 7 days as shown in Fig. 3a. The higher pollutant deposition rates at “Set 1” sites is attributed to the fact these were located in areas with intense anthropogenic activities resulting in relatively higher generation of particulate pollutants and consequently higher deposition rates compared to typical suburban roads which comprised “Set 2” sites. 3.1.2 Bulk deposition The solids data obtained from bulk deposition samples are shown in Fig. 3b. As evident in Fig. 3b, bulk deposition increases with rainfall depth for both “Set 1” and “Set 2” sites. For example, except at one sampling event, bulk deposition increased from 512 mg/m2 to 920 mg/m2 for “Set 1” sites when the rainfall increased up to 19 mm. Bulk deposition increased from 6 mg/m2 to 486 mg/m2 for “Set 2” sites when the rainfall increased from 1.2 to 25 mm. Furthermore, the correlation analysis carried out to investigate the relationship between bulk deposition and rainfall found correlation coefficients of 0.6 and 0.7 for “Set 1” and “Set 2” sites, respectively. This further confirms that bulk atmospheric deposition is correlated with the rainfall depth. 3.1.3 Particle size distribution (PSD)
6
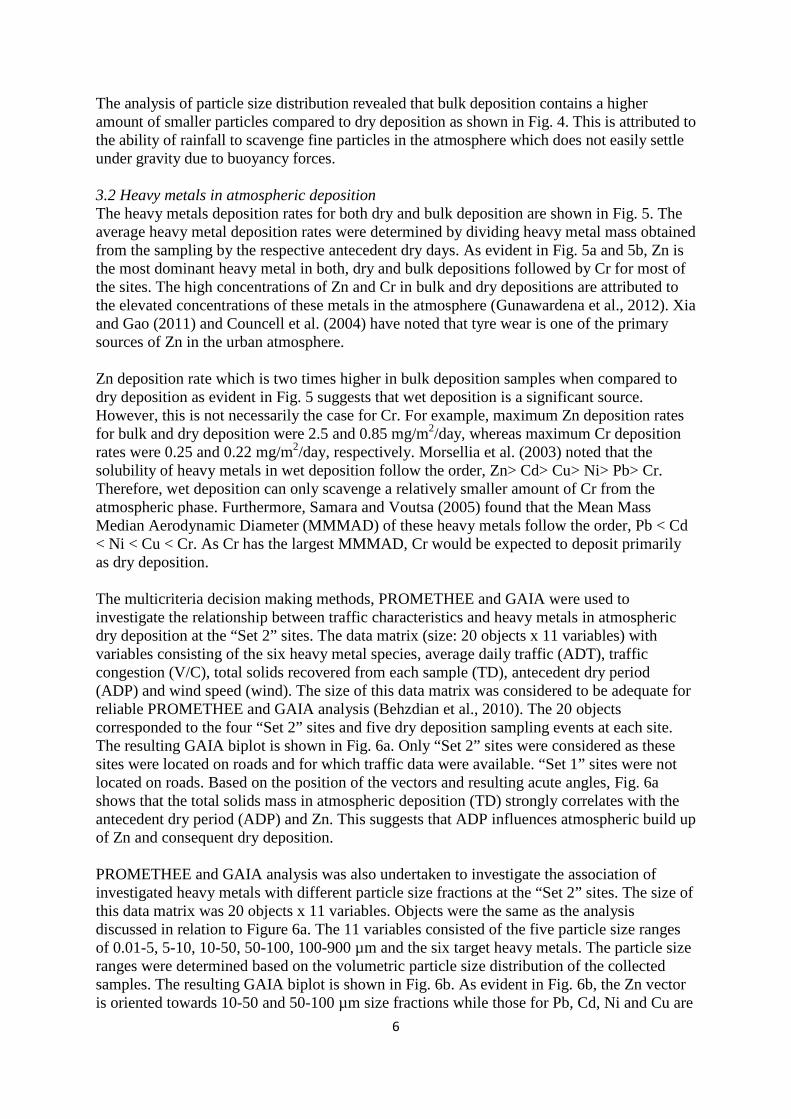
The analysis of particle size distribution revealed that bulk deposition contains a higher amount of smaller particles compared to dry deposition as shown in Fig. 4. This is attributed to the ability of rainfall to scavenge fine particles in the atmosphere which does not easily settle under gravity due to buoyancy forces. 3.2 Heavy metals in atmospheric deposition The heavy metals deposition rates for both dry and bulk deposition are shown in Fig. 5. The average heavy metal deposition rates were determined by dividing heavy metal mass obtained from the sampling by the respective antecedent dry days. As evident in Fig. 5a and 5b, Zn is the most dominant heavy metal in both, dry and bulk depositions followed by Cr for most of the sites. The high concentrations of Zn and Cr in bulk and dry depositions are attributed to the elevated concentrations of these metals in the atmosphere (Gunawardena et al., 2012). Xia and Gao (2011) and Councell et al. (2004) have noted that tyre wear is one of the primary sources of Zn in the urban atmosphere. Zn deposition rate which is two times higher in bulk deposition samples when compared to dry deposition as evident in Fig. 5 suggests that wet deposition is a significant source. However, this is not necessarily the case for Cr. For example, maximum Zn deposition rates for bulk and dry deposition were 2.5 and 0.85 mg/m2/day, whereas maximum Cr deposition rates were 0.25 and 0.22 mg/m2/day, respectively. Morsellia et al. (2003) noted that the solubility of heavy metals in wet deposition follow the order, Zn> Cd> Cu> Ni> Pb> Cr. Therefore, wet deposition can only scavenge a relatively smaller amount of Cr from the atmospheric phase. Furthermore, Samara and Voutsa (2005) found that the Mean Mass Median Aerodynamic Diameter (MMMAD) of these heavy metals follow the order, Pb < Cd < Ni < Cu < Cr. As Cr has the largest MMMAD, Cr would be expected to deposit primarily as dry deposition. The multicriteria decision making methods, PROMETHEE and GAIA were used to investigate the relationship between traffic characteristics and heavy metals in atmospheric dry deposition at the “Set 2” sites. The data matrix (size: 20 objects x 11 variables) with variables consisting of the six heavy metal species, average daily traffic (ADT), traffic congestion (V/C), total solids recovered from each sample (TD), antecedent dry period (ADP) and wind speed (wind). The size of this data matrix was considered to be adequate for reliable PROMETHEE and GAIA analysis (Behzdian et al., 2010). The 20 objects corresponded to the four “Set 2” sites and five dry deposition sampling events at each site. The resulting GAIA biplot is shown in Fig. 6a. Only “Set 2” sites were considered as these sites were located on roads and for which traffic data were available. “Set 1” sites were not located on roads. Based on the position of the vectors and resulting acute angles, Fig. 6a shows that the total solids mass in atmospheric deposition (TD) strongly correlates with the antecedent dry period (ADP) and Zn. This suggests that ADP influences atmospheric build up of Zn and consequent dry deposition. PROMETHEE and GAIA analysis was also undertaken to investigate the association of investigated heavy metals with different particle size fractions at the “Set 2” sites. The size of this data matrix was 20 objects x 11 variables. Objects were the same as the analysis discussed in relation to Figure 6a. The 11 variables consisted of the five particle size ranges of 0.01-5, 5-10, 10-50, 50-100, 100-900 µm and the six target heavy metals. The particle size ranges were determined based on the volumetric particle size distribution of the collected samples. The resulting GAIA biplot is shown in Fig. 6b. As evident in Fig. 6b, the Zn vector is oriented towards 10-50 and 50-100 µm size fractions while those for Pb, Cd, Ni and Cu are

7
oriented more towards 1-5 and 5-10 µm size fractions. Accordingly, it can be concluded that Zn is associated primarily with the relatively larger particle size fractions (>10 µm) whereas Pb, Cd, Ni and Cu are associated with relatively smaller particle size fractions (<10 µm). Except Cr, all the other heavy metals show relatively negative correlation with TOC. This suggests the limited association of heavy metals with organic compounds in the atmosphere. This is attributed to the primary origin of organic carbon being sources other than vehicular traffic and consequently, linkages between traffic generated organic carbon and heavy metals being overshadowed in the analysis. In Fig. 6a, the weak negative correlation shown by ADT and V/C is attributed to the road design and traffic management practices adopted in the study region. This creates traffic scenarios with two extremes in the form of high ADT with low V/C and low ADT with high V/C. High ADT with low V/C characterises a high volume of traffic, but low congestion due to higher service standard and the presence of multiple lanes. In contrast, low ADT with high V/C characterises congested traffic despite the fact that the traffic volume is low. As evident in Fig. 6a, Pb, Cd, Ni and Cu correlates with V/C. The same heavy metals show negative correlation with ADT. This suggests that these heavy metals are primarily generated due to congested traffic, though the traffic volume is low. This is a traffic scenario where vehicles often accelerate, then de-accelerate along with engine idle running which results in inefficient fuel combustion. Therefore, it can be argued that these heavy metals mainly originate from exhaust emissions. This conclusion is also supported by the relative fineness of particles associated with Pb, Cd, Ni and Cu in atmospheric deposition (Samara and Voutsa, 2005) as evident in Fig. 6a. As evident in Figure 6a, Zn in dry deposition shows a weak correlation with average daily traffic (ADT) and weak negative correlation with V/C. Therefore, traffic volume primarily contributes to the generation of Zn. As Zn is associated with relatively larger particles, it can be concluded that these particles would be generated by the wear of vehicle components such as tyre wear. Thorpe and Harrison (2008) have noted that vehicle component wear particles tend to be relatively larger than exhaust related particles. Patel et al. (2009) have further noted that exhaust particles are mostly associated with PM2.5. The fact that Zn primarily originates from the wear of vehicle components can be further supported by the findings from the studies undertaken by Streanbeck et al (2002) and Councell et al. (2004). In order to investigate the influence of land use on atmospheric heavy metal deposition, bulk deposition data collected at “Set 1” and “Set 2” sites were analysed together using PROMETHEE and GAIA and excluding the traffic data. The size of the data matrix was 11 variables x 23 objects. The 11 variables consisted of the six heavy metal species, solids load (BD), antecedent dry period (ADP), total organic carbon (TOC), wind speed (wind) and rainfall. Although, there should be 24 objects corresponding to the 24 bulk deposition sampling events (four “Set 1” and “Set 2” sites each and three sampling episodes per site), one data point was removed as rainfall was not recorded for this event. The resulting GAIA biplot is given in Fig. 7. It is evident from Fig. 7, that there is no clear grouping of sites based on their dominant land uses. Also, not all “Set 1” sites are aligned in the direction of the decision axis pi as shown in Fig. 7. Therefore, this suggests that heavy metals in wet deposition are less sensitive to the source characteristics compared to dry deposition. This is attributed to the fact that wet deposition particles are smaller and hence they have the tendency to disperse over a larger

8
area from the source of origin. Consequently, buoyancy forces become dominant for smaller particles compared to the influence of gravity. Fig. 7 shows two clusters of bulk deposition sampling events (Group C and Group D), corresponding to 3 and 6 antecedent dry days. However, there is no clear grouping of sites corresponding to 2 antecedent dry days sampling event. This suggests that there is similarity in bulk deposition as the antecedent dry days reaches 3 days and beyond. Therefore, it can be concluded that atmospheric bulk deposition tends to have a similar variation with the increase in ADP. This is attributed to the fact that the atmospheric pollutant concentration becomes more uniform as the antecedent dry period increases and consequently atmospheric bulk deposition is more uniform. 4. Conclusions The following important conclusions were derived from the research study undertaken:
• Zn has the highest dry and bulk deposition rates for most of the study sites. This is attributed to the high concentration of Zn in the atmosphere. The deposition rates of Zn is more than three times higher than the corresponding rates for the second most common element (Cr) in dry deposition. Furthermore, Zn deposition occurs due to, both, dry and wet deposition while Cr deposition occurs primarily by dry deposition.
• Zn is correlated with traffic volume whereas Pb, Cd, Ni and Cu are correlated with
traffic congestion. This suggests that the reduction in traffic congestion is relatively important for improving air quality, particularly in relation to Pb, Cd, Ni and Cu.
• Zn in dry deposition is mostly associated with relatively larger particle size fractions (>10 µm) whereas Pb, Cd, Ni and Cu are mostly associated with relatively smaller particle size fractions (<10 µm) and wet deposition. Data analysis revealed that traffic volume contributes mostly larger particles such as vehicle component wear, whereas congestion contributes mostly finer particles where exhaust emissions predominate. Therefore, dry deposition appears to be the more important source of Zn, whereas wet deposition appears to be an important source of Pb, Cd, Ni and Cu.
• Dry atmospheric deposition of solids correlates with the antecedent dry period
whereas bulk deposition is correlated to the rainfall depth.
• As particles subjected to wet deposition are smaller, they disperse over a larger area in the atmosphere from the source of origin compared to particles subjected to dry deposition as buoyancy forces become dominant compared to the influence of gravity. Consequently, wet deposition mostly contributes heavy metals associated with fine particles such as Pb, Cd, Ni and Cu. Accordingly, exhaust emission particles are associated primarily with bulk deposition compared to dry deposition particles.
5. Acknowledgments The authors would like to thank Dr. Jason Kerr and Mr. James Hazelman for their support during the field sampling program. 6. Role of the funding source The project was jointly funded by Gold Coast City Council and Queensland Department of Transport and Main Roads under the Australian Research Council (ARC) Linkage project

9
(LP0882637). The funding agencies had no any involvement in the preparation of this paper. 7. References 1. ABS, 2008. Australian Bureau of Statistics (Report No. 1379.0.55.001), National
Regional Profile, Gold Coast 2002 to 2006, Canberra, Australia. 2. Ayoko, G.A., Singh, K., Balerea, S., Kokot, S., 2007. Exploratory multivariate
modeling and prediction of the physico-chemical properties of surface water and groundwater. Journal of Hydrology 336(1-2), 15-124.
3. AS/NZS, 2003. 3580.10.1 - Australian New Zealand Standards, Method for sampling and analysis of ambient air: determination of particulate matter-deposited matter-gravimetric method, Standards Australian and Standards New Zealand.
4. AS/NZS, 1998. 5667.1 - Australian New Zealand Standards, Water quality Sampling, Part 1: Guideline of the Design of Sampling Programmes, Sampling Techniques and the Preservations and Handling of Samples, Standards Australian and Standards New Zealand.
5. APHA, 2005. Standard methods for the examination of water & wastewater, Washington DC, American Public Health Association.
6. Behzadian, M., Kazemzadeh, R.B., Albadvi, A.,Aghdasi, M., 2010. PROMETHEE: A comprehensive literature review on methodologies and applications. European Journal of Operational Research 200, 198-215.
7. Councell, T., Duckenfield, K., Landa, E.R., and Callender, E., 2004. Tire-Wear Particles as a Source of Zinc to the Environment. Environment Science and Technology 38, 4206-4214.
8. Davis, B., Birch, G., 2011. Spatial Distribution of Bulk Atmospheric Deposition of Heavy Metals in Metropolitan Sydney, Australia. Water Air Soil Pollution 214, 147-162.
9. Espinasse, B., Picolet, G., Chouraqui, E., 1997. Negotiation support systems: A multi-criteria and multi-agent approach. European Journal of Operational Research 103(2), 389-409.
10. Fitz, D.R., 2001. Measurements of PM10 and PM2.5 emission factors from paved roads in California. Final Report. Contract No. 98-723. California Air Resources Board, Monitoring and Laboratory Division, Sacramento, CA.
11. Gunawardana, C., Goonetilleke, A., Egodawatta, P., Dawes, L., Kokot, S., 2012. Source characterisation of road dust based on chemical and mineralogical composition. Chemosphere 87, 163-170.
12. Gunawardena, J., Egodawatta, P., Ayoko, G.A., Goonetilleke, A., 2012. Role of traffic in atmospheric accumulation of heavy metals and polycyclic aromatic hydrocarbons. Atmospheric Environment 54, 502-510.
13. Herngren, L., Goonetilleke, A. and Ayoko, G., 2005. Understanding heavy metal and suspended solids relationships in urban stormwater using simulated rainfall. Journal of Environmental Management 76, 149-158.
14. Herngren, L., Goonetilleke, A., and Ayoko, G.A., 2006. Analysis of heavy metals in road-deposited sediments. Analytica Chimica Acta 571(2), 270-278.
15. Huston, R., Chan, Y.C., Gardner, T., Shaw, G., Chapman, H., 2009. Characterisation of atmospheric deposition as a source of contaminants in urban rainwater tanks, Water research 43, 1630-1640.
16. Hill, L.J., Caritat, P.D. 2002., A method of bulk sampling wet and dry atmospheric deposition for trace element analysis. Proceedings of the conference, Regolith and Landscapes in Eastern Australia, Canberra, Australia, 54-57.
17. Keller, H.R., Massart, D.L., Brans, J.P., 1991. Multicriteria decision making: a case study. Chemometrics and Intelligent laboratory systems 11, 175-189.

10
18. Kakooei, H., Kakooei, A.A., 2007. Measurement of PM10, PM2.5 and TSP Particle Concentrations in Teharan Uran. Journal of Applied Sciences 7(20), 3081-3085.
19. Khalil, W., Goonetilleke, A., Kokot, S., Carroll, S., 2004. Use of chemometrics methods and multicriteria decision-making for site selection for sustainable on-site sewage effluent disposal. Analytica Chimica Acta 506, 41-56.
20. Malvern Instrument Ltd., 1997. Sample dispersion and refractive index guide, MAN 0079, UK.
21. Opher, T., Friedler, E., 2010. Factors affecting highway runoff quality. Urban Water Journal 7(3), 155 - 172.
22. Pekey, B., Karakas, D., Ayberk, S., 2007. Atmospheric deposition of polycyclic aromatic hydrocarbons to Izmit Bay, Turkey. Chemosphere 67, 537-547.
23. Paode, R.D., Sofuoglu, S.C., Sivadechathep, J., Noll, K.E., Holsen, T.M., Keeler, G.J., 1998. Dry Deposition Fluxes and Mass Size Distributions of Pb, Cu, and Zn Measured in Southern Lake Michigan during AEOLOS. Environmental Science & Technology. 32(11), 1629-1635.
24. Patel, M.M., Chillrud, S.N., Correa, J.C., Feinberg, M., Hazi, Y., Deepti, K.C., et al., 2009. Spatial and temporal variations in traffic-related particulate matter at New York City high schools. Atmospheric Environment 43(32), 4975-4981.
25. Rocher, V., Azimi, S., Gasperi, J., Beuvin, L., Mulle, M., Moilleron, R. Chebbo, G., 2004. Hydrocarbons and metals in atmospheric deposition and roof runoff in central Paris, Water, Air, and Soil Pollution 159, 67-86.
26. Ravindra, K., Mor, S., Ameen, Kamyotra, J. S., Kaushik, C.P., 2003. Variation in spatial pattern of criteria air pollutants before and during initial rain of monsoon, Environmental Monitoring and Assessment, 87, 145-153.
27. Sartor, J.D. and Boyd, G.B., 1972. Water Pollution Aspects of Street Surface Contaminants. USEPA, EPA-R2-72-081, US Environmental Protection Agency, Washington, DC.
28. Samara, C., Voutsa, D., 2005. Size distribution of airborne particulate matter and associated heavy metals in the roadside environment. Chemosphere 59(8), 1197-1206.
29. Sabin, L.D., Hee Lim, J., Teresa Venezia, M., Winer, A.M., Schiff, K.C., Stolzenbach, K.D., 2006. Dry deposition and resuspension of particle-associated metals near a freeway in Los Angeles. Atmospheric Environment 40(39), 7528-7538.
30. Sternbeck, J., Sjödin, A.Å., Andréasson, K., 2002. Metal emissions from road traffic and the influence of resuspension-results from two tunnel studies. Atmospheric Environment 36(30), 4735-4744.
31. Thorpe, A., and Harrison, R.M., 2008. Sources and properties of non-exhaust particulate matter from road traffic: A review. Science of the Total Environment 400(1-3), 270-282.
32. USEPA, 1999. Compendium of Methods for the Determination of Toxic Organic Compounds in Ambient Air, Second Edition, U.S. Environmental Protection Agency, Cincinnati, OH 45268.
33. USEPA, 1994. Determination of Trace Elements in Water and Wastes by Inductively Coupled Plasma-Mass Spectrometry-Method 200.8. U.S. Environmental Protection Agency, OHIO 45268.
34. Xia, L., Gao, Y., 2011. Characterization of trace elements in PM2.5 aerosols in the vicinity of highways in northeast New Jersey in the U.S. east coast. Atmospheric Pollution Research 2, 34-44.
11
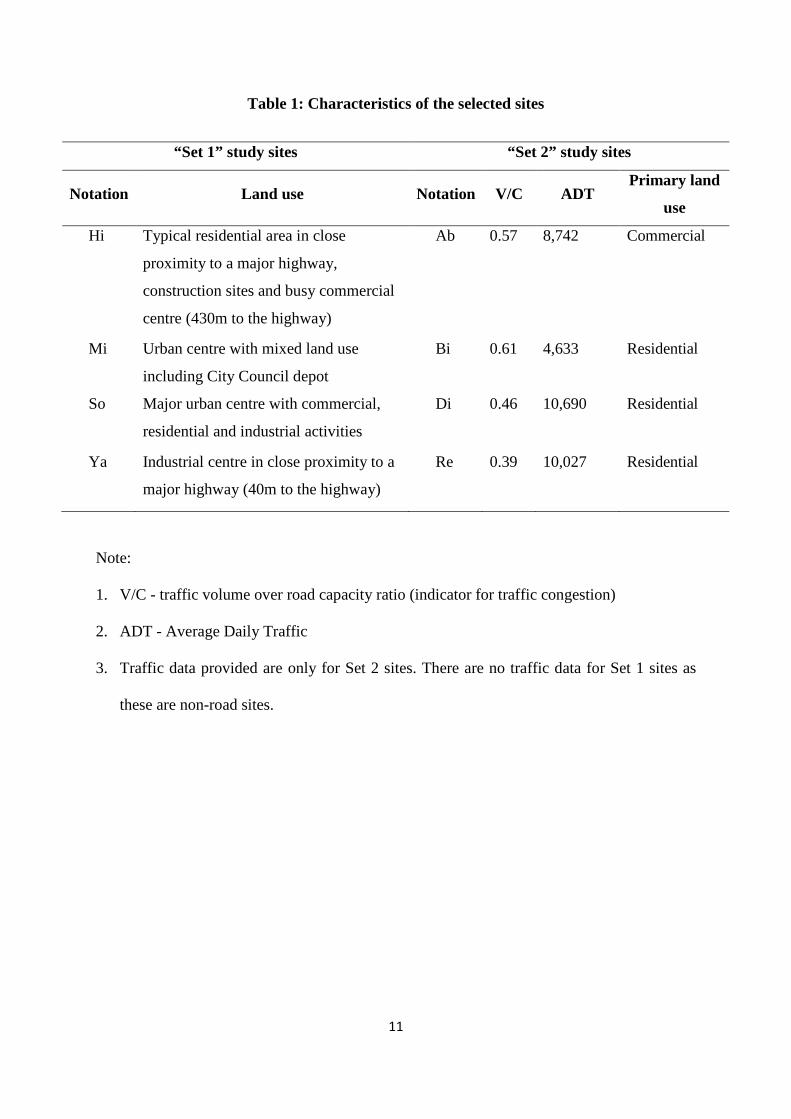
Table 1: Characteristics of the selected sites
“Set 1” study sites “Set 2” study sites
Notation Land use Notation V/C ADT Primary land
use
Hi Typical residential area in close
proximity to a major highway,
construction sites and busy commercial
centre (430m to the highway)
Ab 0.57 8,742 Commercial
Mi Urban centre with mixed land use
including City Council depot
Bi 0.61 4,633 Residential
So Major urban centre with commercial,
residential and industrial activities
Di 0.46 10,690 Residential
Ya Industrial centre in close proximity to a
major highway (40m to the highway)
Re 0.39 10,027 Residential
Note:
1. V/C - traffic volume over road capacity ratio (indicator for traffic congestion)
2. ADT - Average Daily Traffic
3. Traffic data provided are only for Set 2 sites. There are no traffic data for Set 1 sites as
these are non-road sites.

12
Figure captions
Figure 1: Location map of the study sites
Figure 2: Atmospheric deposition sampling apparatus used for collecting dry and bulk
deposition samples
Figure 3: Comparison of solids loads in the samples collected, (a) dry deposition with dry
days, (b) bulk deposition with rainfall depth
Figure 4: Comparison of cumulative average particle size distribution for dry and bulk
deposition
Figure 5: Comparison of heavy metal concentrations in atmospheric deposition, (a) dry
deposition, (b) bulk deposition
Figure 6: GAIA biplots of dry deposition for “Set 2” sites, (a) correlation of heavy metals
with traffic characteristics, (b) correlation of heavy metals with particle size fractions and
excluding traffic characteristics
Note: TD - solids mass; ADP - antecedent dry period; numbers, 3, 4, 5, 6 and 7 refers to the
antecedent dry days
Figure 7: GAIA biplot of bulk deposition for “Set 1” and “Set 2” sites
Note: BD - bulk deposition; ADP- antecedent dry period; numbers 2, 3 and 6 refer to 2, 3 and
6 ADPs

13

14

15

16